Article

Spatial–Temporal Evolution of Urban Resilience and Its Influencing Factors: Evidence from the Guanzhong Plain Urban Agglomeration

1
School of Economics and Management, Chang’an University, Xi’an 710064, China
2
School of Civil and Environmental Engineering, Nanyang Technological University, Singapore 639798, Singapore
*
Author to whom correspondence should be addressed.
Sustainability 2020, 12(7), 2593; https://doi.org/10.3390/su12072593
Submission received: 23 January 2020 / Revised: 18 March 2020 / Accepted: 18 March 2020 / Published: 25 March 2020
(This article belongs to the Section Sustainable Urban and Rural Development)

Abstract

:
Rapid urbanization places great pressure on the ecological environment and the carrying capacity of cities. Improving urban resilience has become an inherent requirement for the sustainable development of modern cities and urban agglomerations. This study constructed a comprehensive system to evaluate urban resilience from four perspectives: The ecological environment, economic level, social environment, and infrastructure services. As a case study, the extreme entropy method and panel data from about 16 cities from 2009 to 2016 were used to calculate resilience levels in the Guanzhong plain urban agglomeration (GPUA) in China. The spatial and temporal evolution of urban resilience characteristics in the GPUA were analyzed using ArcGIS. The influencing factors were further explored using a grey correlation analysis. The results showed that the urban resilience of GPUA experienced geographical differentiation in the “East-Central-Western” area and a “circle type” evolution process. Most urban resilience levels were low. The resilience of the infrastructure and the ecological environment significantly impacted the city and became its development weaknesses. Economic considerations have become one of the main factors influencing fluctuations in urban resilience. In summary, this study explored the differences in resilience in the GPUA and provided a reference for improving the urban resilience of other cities located in underdeveloped regions. The study also provided a useful theoretical basis for sustainable urban development.

1. Introduction

Urbanization is the most transformative force driving economic growth and social culture. Cities are increasingly becoming complex systems driven by social, economic, and ecological factors [1]. They serve as a main carrier of human life, civilization, and innovation, and are crucial to the development of modern human beings. However, uncertainties significantly threaten the sustainable development of cities, including natural disasters, climate change, energy crises, political instability, financial crises, food security, and terrorist attacks [2]. There are some differences in cities’ abilities to resist or sustain these uncertainties. Some cities fail to recover after a crisis, while others can gradually overcome the adverse impact of a disaster and even use it as an opportunity for further development. Therefore, effectively evaluating such capabilities is critical for urban planning and sustainable development.
The introduction of resilience provides new insights for solving these problems. The term resilience was originally derived from the Latin "resilio" [3], which was originally defined as “reverting to the original state.” Since then, the concept of resilience has been applied to different fields, including mechanics, psychology, ethnology, and human ecology [4,5]. As an indispensable research subject in human ecology, the idea of resilience is naturally applied to urban research, laying a foundation for the formation of the theory of urban resilience [6]. Urban resilience refers to the ability of urban systems to achieve normal operations (such as public safety, social order, and economic construction) through reasonable preparation, buffering, and response to uncertainty disturbances. The research of how to scientifically quantify urban resilience is helpful for scholars to accurately and effectively translate the theory into the actual construction of resilient cities. As an emerging research topic, research of urban resilience is very limited, and there is currently no unified measurement standard. Jabareen [7] proposed a planning framework to build a resilient city, including “vulnerability analysis, government regulation prevention, and uncertainty-oriented planning”. The framework provides managers and policy makers with a flexible, adaptable approach to integrate multiple dimensions (social, economic, cultural, and environmental) into a unified framework. However, there is a lack of supporting data to analyze changes in urban resilience.
While considering the evaluation of urban resilience, the resilience from the perspective of urban agglomeration is also a significant issue. The “New Urban Agenda (NUA)” published by the United Nations Conference on Housing and Sustainable Urban Development (Habitat III) calls on Member States to implement sustainable urban and territorial planning, build resilience, and use integrated urban areas or urban agglomeration [8]. Urban areas and agglomeration economic development have been cited as promising ways to help cities and regions enhance their competitiveness and achieve sustainable development [1].
It is our goal to explore the temporal and spatial evolution of urban resilience from the perspective of urban agglomeration. Over the past 40 years, eight large urban agglomerations have formed in China. The urbanization rate increased from 17.9% in 1978 to 60.60% by the end of 2019 [9]. As a result, there has been increased interest in urban resilience research, with a focus on urban agglomerations. The Guanzhong plain urban agglomeration (GPUA) is one of China’s eight major urban agglomerations, covering 16 cities in the central and western regions of China. The GPUA is representative of China’s underdeveloped and adaptive growth regions. Given the pressure of urbanization, there is an urgent need to measure the level of urban resilience. Therefore, it is of great theoretical and practical significance to evaluate the urban resilience of the GPUA and to explore its temporal and spatial evolution process.
This study selected 15 evaluation indicators covering four perspectives: Ecological environment, economic level, social environment, and infrastructure services. The indicators form three different levels of an evaluation system. By constructing this evaluation index system of urban resilience, this study used the extreme entropy method to calculate the urban resilience of the GPUA from 2009 to 2016 and analyzed its temporal and spatial evolution characteristics using ArcGIS. Finally, the study explored the factors influencing urban resilience using grey correlation analysis.
The rest of this study is organized as follows: Section 2 reviews the literature relating to the topic. Section 3 introduces the construction and research methods used to develop the urban resilience evaluation system, including the extreme value entropy method and grey correlation analysis. Section 4 presents the empirical research and analyzes the spatial–temporal evolution characteristics using the urban resilience results and discusses the factors influencing the GPUA. The last section summarizes the study and discusses the research conclusions and policy recommendations.

2. Literature Review

The city has become the main carrier of human habitation. The need to improve the ability of urban environments to resist unfavorable factors has caused this topic to emerge as a significant academic focus area. The current research on urban resilience has mainly concentrated in the following five areas.
(1) Theoretical research of the resilience concept.
Holling [10] proposed the adaptive cycle theory. The cycle describes a method of how organizations will go through a process of changes; Walker [11] proposed that resilience is a form of adaptation and change that a complex social ecosystem stimulates to respond to stress and constraints. These studies created a theoretical basis for later research. After reviewing the research progress exploring the mechanism of resilience evolution, evaluation methods, and planning methods, Li [12] used multidimensional dimensional resilience concepts, including social, economic, cultural, environmental, and spatial concepts, to address the problems restricting the development of the urban economy and society. Qiu [13] discussed the methods and principles of resilient city design based on the theory of complex adaptive systems. The study proposed six elements of resilience (i.e., subjectivity, diversity, autonomy, appropriate redundancy, slow variable management, and identification). These studies have further developed the concept of urban resilience. Wilkinson [14] articulates four strategies for resilience and the related enabling attributes that are intended to “evoke change, that survive change, and that nurture sources for reorganization following change”. These strategies are: ① To assume change and uncertainty, ② to nurture conditions for recovery and renewal after disturbance, ③ to combine different types of knowledge for learning, and ④ to create opportunities for self-organization. From the above analysis, it can be seen that the evolution of the viewpoint of resilience reflects the leap in the academic understanding of the system’s operating mechanism, and paves the way for further understanding of urban resilience.
(2) The application of urban resilience in urban planning and landscape design.
Jabareen [7] proposed the Resilience Urban Planning Framework (RCPF) to address the key issues regarding actions future cities and their urban communities should take to achieve a more resilient state. Xiu et al. [15] introduced the concept of a resilient city and constructed a three-dimensional urban resilience research framework based on “scale–density–morphology” to evaluate the urban resilience of Dalian, China. Rafael et al. [16] evaluated different urban resilience measures by exploring the increase in urban green space and the application of white roofs using the Weather Research and Forecasting model and the surface urban energy and water balance (WRF-SUEWS) modeling system. Li et al. [17] conducted a resilience assessment of a single urban system, summarized the assessment framework and assessment methods of urban infrastructure resilience, and compared the advantages and disadvantages of each evaluation method. The concept of urban resilience has been applied from the development of an urban planning framework to specific city assessments. However, research on the applicability of urban resilience still needs to be further broadened.
(3) The construction of community resilience frameworks and management strategies.
Kammouh et al. [18] introduced two methods to calculate resilience, depending on data availability and the complexity of the requirements. The first method requires inputting past disaster data; the model then returns the performance function of each indicator and the entire community. The second method is implemented using knowledge-based fuzzy modeling, allowing a quantitative assessment of human metrics with descriptive knowledge rather than deterministic data. The approach applied the community resilience indicator framework, which defines community resilience using seven dimensions. Yoon et al. [19] used community factors (e.g., population) as an indicator of community resilience to form an entire community’s resilience system. They measured the Korean community using six indicators of human, social, economic, institutional, material, and environmental vulnerability and carrying capacity. A city disaster resilience index (CDRI) was analyzed using ordinary least squares regression and geographic weighted regression to determine the spatial characteristics of CDRI and to assess the impact of community resilience on actual losses. Kim and Lim [20] considered urban resilience as an important measure for adapting to climate change and proposed a conceptual framework to analyze resilience in the context of climate change. In summary, these studies provided a reference for the construction of the evaluation framework of urban resilience for this study. In terms of management strategy, Fan et al. [21] studied the typhoon disaster in Morakot, Taiwan as an example to explore improvements in community resilience. They proposed that post-disaster governance experts and the public can accurately assess the degree of typhoon disaster damage through different cooperative interaction modes of post-disaster governance.
(4) The resilience of urban infrastructure networks and social networks.
Kim et al. [22] conducted a network topology and resilience analysis of the Korean power grid. Zhao et al. [23] used a multi-layer network model to construct a conceptual framework for city infrastructure (CI) interdependence. First, they assembled different types of interdependent infrastructures using multi-layer network models to simulate urban interference with the network. Then, they analyzed the resilience of the network and the dependencies between the different infrastructure networks. Serre et al. [24] noted that it is increasingly difficult to identify possible failures of complex networks and predict their impact on the urban environment. They proposed new methods for selecting critical infrastructure networks to assess resilience levels [25]. A common feature of this research field is to apply a network model to evaluate, simulate, and explore urban resilience. These studies also provide examples of the use of interdisciplinary methods to describe urban resilience.
(5) Urban resilience recovery after urban disasters.
These studies address urban recovery after the impact of natural disasters, such as hurricanes and earthquakes. Rus et al. [26] conducted a literature analysis and found that resilience levels after urban disasters differ. Rus concluded that it is essential to develop sensible and strategic urban planning in vulnerable areas (e.g., earthquake-prone areas). He proposed a new concept, consisting of three distinct parts: ① A probabilistic vulnerability analysis of each physical unit (i.e., a building or infrastructure unit), ② a comprehensive index method to measure community disaster resilience, and ③ a complex network approach for assessing resilience (i.e., graph theory). Kuscahyadi et al. [27] spatially modeled the disaster resilience by establishing baseline conditions. These were verified in urban and rural areas, with significant differences found in the resilience between the two. Finally, assessing urban disaster risk involves exploring different types of possible disaster risks in cities and proposes solutions and strategies for improving urban resilience.
It can be seen that the topics covered by the urban resilience research system cover a wide range. The innovative point of studying these urban issues from the perspective of urban resilience is not the research topic itself, but the perspective of the problem and the method of implementing measures. Table 1 summarizes the research direction of scholars in addressing the issue of resilience in the past.
Table 1 traces the perspectives of the resilience studies. Resilience research is mainly distributed in five aspects. Early ecological resilience and engineering resilience research laid the foundation for resilience theory. Social resilience, urban resilience, and economic resilience are more targeted research from the perspective of resilience. They are specific applications of resilience theory. Meanwhile, resilience theory also has specific definitions from different perspectives.
In addition, in terms of urban resilience research, it is notable that traditional urban resilience assessment frameworks rarely develop indicators to measure the urban resilience of non-specific risks. These frameworks often emphasize resilience to single disturbances, such as natural disasters (e.g., earthquakes and floods). They do not capture the importance of complex factors, and do not address the multidimensional nature of urban resilience. In addition, existing resilience assessment indicators have focused on a single part of the urban system (e.g., infrastructure resilience) or a single city.
Cities are not only composed of infrastructure, but also economic, social, ecological, and other aspects. These are important components of urban resilience. However, there has been less investigation of the comprehensive resilience of many aspects of the city, especially from the perspective of urban agglomerations. In addition, there has been a lack of research on the temporal and spatial evolution of urban resilience to explore the changes in evolutionary laws during the past period. Therefore, using the GPUA as a case study, this study comprehensively evaluated the urban comprehensive resilience and explored the temporal and spatial evolution characteristics and the influencing factors. This study also provides policy recommendations and case studies to support urbanization in underdeveloped regions, especially for urban agglomerations.

3. Methods and Data

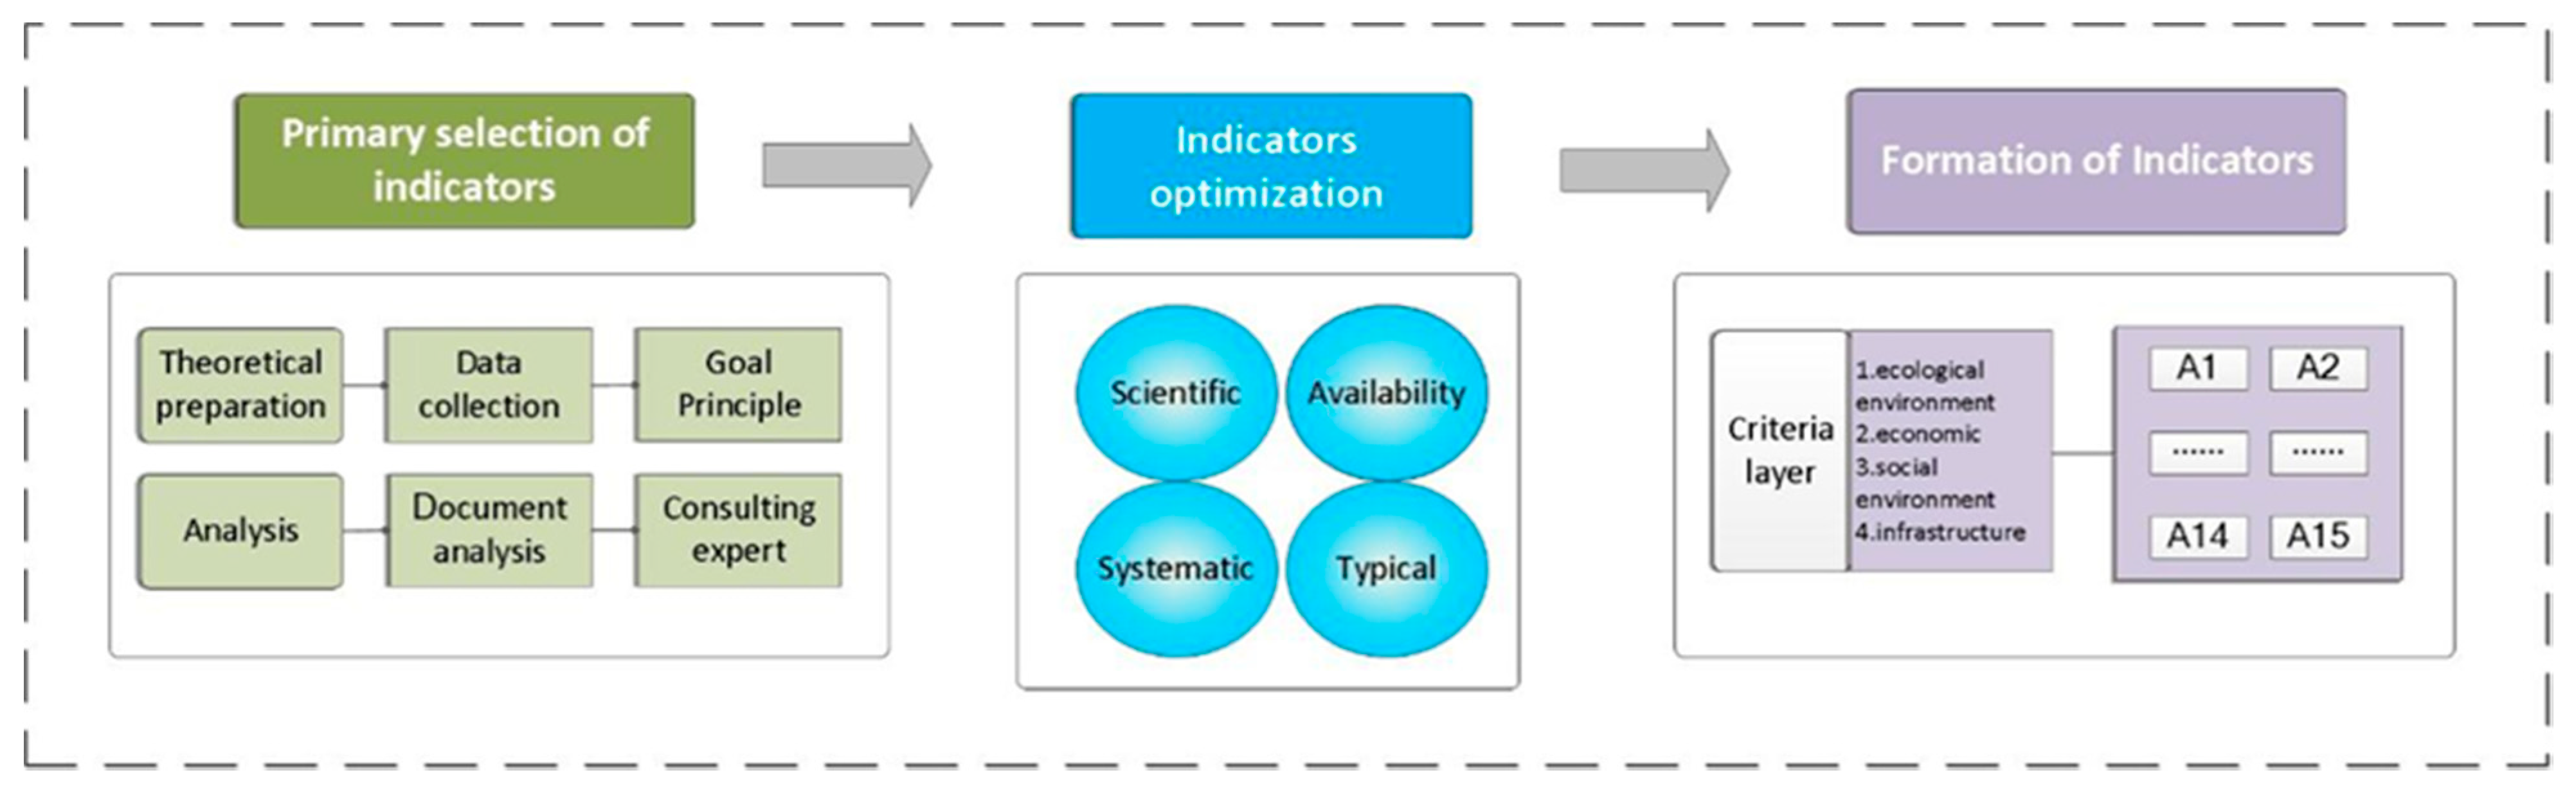
3.1. The Construction of an Urban Resilience Index System

Urban development plays an important role in promoting urban resilience. Meanwhile, enhancing urban resilience can effectively improve the development of cities and reduce a city’s inherent vulnerability, enhancing the city’s ability to resist risks and disasters. Before evaluating urban resilience, an effective evaluation system and guidelines must be established to measure urban resilience. To address this, the 100 Global Resilient Cities project, launched by the Rockefeller Foundation in the United States, proposed an urban resilience index [41]. This index system includes four dimensions: Health and welfare, economics and society, infrastructure and ecosystems, and leadership and strategy. Gonalves et al. [43] proposed an urban resilience assessment matrix based on previous studies. The matrix consists of five dimensions: Economic basis, population, urbanization process, social cohesion, and human capital. Suárez et al. [42] argued that diversity, modularity, tight feedback, social cohesion, and innovation are the five most important factors influencing urban resilience and should serve as evaluation criteria. In assessing the resilience of Xiamen City, Noah [44] selected 30 indicators to form an evaluation system that addresses six aspects: Economy, society, environment, community, infrastructure, and organization. When constructing an urban resilience evaluation system, each study has had its own focus; however, the urban system components of economy, ecology, social organization, and infrastructure have been consistently recognized as the essential dimensions.
To comprehensively reflect the development and evolution of resilient cities, after considering the historical literature methods and research objectives, this study divided the urban resilience evaluation index system into four perspectives: Ecological environment, economic level, social environment, and infrastructure services [45,46]. Using both systemic and scientific principles, we used the composite index method to design three levels: The target layer, criterion layer, and indicator layer. A total of 15 sub-evaluation indicators were included to construct the urban resilience comprehensive evaluation index system for the GPUA (see Table 2). In particular, due to the synchronicity of the climate conditions in the research cities, we did not select indicators such as air quality level. This makes it possible for the evaluation system to be used to evaluate the resilience level of man-made cities without considering climate conditions.
The process of selecting indicators is shown in Figure 1.
(1) Urban ecological environment resilience. Human activities make human environmental conflicts a core problem restricting human survival [47]. Eco-environmental resilience construction is an important path to narrowing this conflict. This is reflected in the risks posed to ecosystem stability when faced with an overload, such as the reduction of urban green space landscapes and excessive pollutants. Hence, this layer included three representative indicators to measure the resilience of the urban ecological environment: Green coverage rate, per capita park green area, and per capita wastewater discharge in the built-up area.
(2) Urban economic level resilience. Wink [39] realized the importance of combining resilience and the economy after reviewing research methods related to resilience, and perfected the concept of economic resilience. Economic resilience refers to continued functioning in the defense and resolution of a crisis and responding to an economic depression. Roberto [48] distinguished between economic resilience inside and outside the city. Exogenous regional economic resilience represents the ability to externally impact and maintain regional development paths. Endogenous economic resilience describes the internal development process. High levels of economic development must be achieved to ensure the reliability and adaptability of different highly resilient urban systems. Hence, from the perspective of urban financial level and the degree of resident wealth, we selected four typical economic indicators: Per capita GDP, fiscal revenue, actual use of foreign capital, and the per capita year-end balance of urban and rural residents’ savings.
(3) Urban social environment resilience. As an important aspect of the urban social development level, the urban social environment resilience was represented using three indicators: The proportion of non-agricultural employment personnel, the number of students in regular colleges and universities, and the number of hospital beds per 1000 people. Accordingly, the three indicators above were used to measure the level of urbanization, the potential human capital of cities, and the basic innovation ability and emergency medical service level.
(4) Urban infrastructure resilience. A city is a complex system composed of natural systems, social systems, and structural systems. Each system itself is important; however, most urban systems are highly dependent on functional infrastructure to successfully operate [49,50]. The service capacity indicators of major infrastructure were used to measure urban infrastructure resilience. These indicators included: The per capita road area, per capita urban gas supply, quantity of buses per 10,000 people, per capita drainage pipe length, and the proportion of international Internet users. These five indicators are important tools to ensure the normal operation of an urban system. Urban agglomerations face significant pressures on water, electricity, and road networks, and face fragility due to accidental impacts. As such, an ideal level of urban infrastructure services is important in forming and developing highly resilient systems.

3.2. Research Method

3.2.1. Extreme Entropy Method

There are differences in the dimensions and there are inconsistencies between the evaluation system indicators. To eliminate the impact of these differences, the indicators needed to undergo nondimensionalization processing. The data standardization methods included the extreme value method, z-score standardization method, and vector normalization method. This study applied the most widely used extreme value method in data standardization processing [51]. To avoid the subjectivity of artificially determining the index weight, this study adopted the optimal improved entropy method. That is the extreme entropy method [52], which involves the following steps:
1. Establishing the matrix based on raw indicator data.
There are n cities and m evaluation indicators. In this study, there are 16 cities and 15 evaluation indicators, i.e., the value of n is 16, and the value of m is 15. Together, they constitute the data matrix of the raw indicators:
  A = { A i j } n m ( i = 1 , 2 , , n ; j = 1 , 2 , , m ) ,
where Aij is the raw indicator value of the jth evaluation index of the ith city.
2. The standardization of extreme values.
Since the measurement units of various indexes are not uniform, we should first standardize them before using them to calculate comprehensive indexes. That is, we should convert the absolute values of indexes into relative values to solve the problem of homogenization of different qualitative indexes. Moreover, since the values of positive and negative indicators have different meanings (e.g., the higher the value of positive indicators, the better; the lower the value of negative indicators, the better), we use different algorithms to standardize the high and low indicators. The specific methods are as follows:
The   A j is the value of the jth evaluation indicator. If the jth evaluation indicator is a positive indicator, then:
  A i j * = A i j min ( A j ) max ( A j ) min ( A j ) .
If the evaluation index A j is a negative indicator, then:
  A i j * = max ( A j ) A i j max ( A j ) min ( A j ) ,
where A i j * ( i = 1 , 2 , , n ; j = 1 , 2 , , m ) is the standardized value of the jth evaluation index of the ith city,   max ( A j )   is the maximum value of the jth evaluation indicator, and   min ( A j ) is the minimum value of the jth evaluation indicator.
3. Determination of indicator weight.
(1) The proportion of the ith city to the index under the jth indicator ( P i j ) is calculated by
P i j = A i j * i = 1 n A i j * .
(2) The entropy of the jth indicator ( e j ) is calculated as:
e j = k i = 1 n P i j ln ( P i j )   where   k = 1 / ln ( n ) > 0 . e j 0 ;
It can be known from Formula (4) that for a given j , the smaller the difference of Aij, the larger the e j . When A i j is all equal, e j = e m a x = 1, then the index A i j has no effect on the comparison of the evaluated objects; when the difference between A i j is larger, e j is smaller. The index A j has a greater comparison effect between the evaluated objects.
(3) The difference coefficient of the jth indicator ( g j ) is calculated as:
g j = 1 e j .
The larger the value of g j , the more important this indicator is in the comprehensive evaluation index system.
(4) The weight of the jth indicator ( W J ) is calculated as:
W J = g j j = 1 m g j ( j = 1 , 2 , , m ) .
4. Comprehensive evaluation of urban resilience.
After the standard values and index weights were derived using Equations (1)–(7), the final results were calculated using the following formula:
S I = j = 1 m W J A i j * ( i = 1 , 2 , , n ) .

3.2.2. Grey Correlation Analysis

Different evaluation indicators have different effects on the comprehensive evaluation value. As such, the main influencing factors have a guiding and key role in resolving any contradictions. There is a need to quantitatively measure the relationship between urban resilience and evaluation indicators, as well as to find out the main factors affecting urban resilience. The grey correlation analysis method is a quantitative method to describe and compare the system’s development and change. The grey correlation analysis method makes up for the disadvantages caused by using a mathematical statistics analysis method. It is applicable no matter how many samples systems have or whether the samples have rules. The method conveniently displays the correlation of related factors [53], helping us to identify the highly correlated indicators in the urban resilience evaluation system. This method identified the main impact indicators, strengthening the regulation and control of relevant variables. The method also identified indicators with less relevance, allowing for the verification of the fit of the indicator system and the rational allocation of urban planning and construction resources. To optimize the efficiency of resilience construction, the grey correlation analysis method was used to quantitatively measure the relationship between urban resilience and evaluation indicators. This led to the identification of the main influencing factors of urban resilience.
The basic idea of grey correlation analysis is to evaluate the closeness between the reference and comparison sequences based on the similarity degree of the curve geometries. The more similar the curves are, the greater the correlation degree of corresponding sequences is. The reference sequence must be determined before correlation analysis. In this study, when we study a city, the dependent variable composes the reference sequence x 0 ,   which is selected from S I . The independent variables compose the comparison sequences   x i ,   which   are selected from A i j . Each sequence consists of values at different times. Taking x 0 , for example, the value at the first point in time is called x 0 ( 1 ) , the value at the second point in time is called x 0 ( 2 ) , and the value at the kth point in time is x 0 ( k ) . Hence,   x 0 can be expressed as x 0 = { x 0 ( 1 ) , x 0 ( 2 ) , , x 0 ( k ) } . Similarly, comparison sequence x i can be expressed as x i = { x i ( 1 ) , x i ( 2 ) , , x i ( k ) } , i = 1 , 2 , , m . For the convenience of expression, in the formulas (9)–(11), x 0 and x i are collectively expressed as x i , { x i ( 1 ) , x i ( 2 ) , , x i ( n ) } , i = 0 , 1 , 2 , , m ; k = 1 , 2 , , n (m is the number of indicators and n is the number of time series). In this study, the value of m is 15 and the value of n is 8 because there are 15 evaluation indicators over 8 years. The calculation steps are as follows:
1. Dimensionless data using the mean method.
All of the data of a sequence were removed by the average value of the sequence, resulting in a new sequence.
(1) The original series was set as:
x i = { x i ( 1 ) , x i ( 2 ) , , x i ( k ) } , i = 0 , 1 , 2 , , m ; k = 1 , 2 , , n .
(2) The average series was calculated as:
x i ¯ = k = 1 n x i ( k ) n ,
where x i ¯ represents the mean of the pure sequence of numbers, which is convenient for statistics and calculation.
(3) The series y i was calculated as:
y i = { y i ( 1 ) , y i ( 2 ) , , y i ( n ) } = { x i ( 1 ) x i ¯ , x i ( 2 ) x i ¯ , x i ( n ) x i ¯ } .
2. Difference sequence.
Δ 0 i ( k ) = | y 0 ( k ) y i ( k ) | , Δ i = { Δ i ( 1 ) , Δ i ( 2 ) , Δ i ( n ) } , i = 1 , 2 , m
The variable Δ 0 i ( k ) represents the new sequence after the differential order.   | y 0 ( k ) y i ( k ) | represents the difference between the absolute value of the reference variable and the comparison variable at the point k after removing the dimension.
3. The maximum difference and the minimum difference between the two poles were identified as follows:
Δ m a x = m a x i m a x k Δ 0 i ( k ) , Δ m i n = m i n i m i n k Δ 0 i ( k ) ,
where the   Δ m a x represents the maximum difference   and   Δ m i n represents the minimum difference.
4. The correlation coefficient, represented by ξ 0 i ( k ) , was then calculated as:
ξ 0 i ( k ) = ( Δ m i n + ρ Δ m a x ) ( Δ 0 i ( k ) + ρ Δ m a x ) , ρ ( 0 , 1 ) i = 1 , 2 , m ; k = 1 , 2 , n ,
where the value range of the resolution coefficient ρ is (0,1); ρ was assigned the usual value of 0.5 [52].
5. The relevance of an indicator was represented by   γ 0 i .
The correlation coefficients were grouped into one value. In other words, the average value was obtained as the quantitative representation of the degree of correlation between the comparison series and the reference number column. The formula calculating the degree of correlation was:
  γ 0 i = i = 1 m ξ 0 i ( k ) n , i = 1 , 2 , m , m 15 .
The bigger the correlation degree is, the closer the comparison sequence and the reference sequence are. The bigger the correlation degree is, the stronger the correlation between indicators and urban resilience.

3.3. Data Sources

This study used the 16 cities in the GPUA as the case study. Based on data availability, the scope of the study included the administrative regions of each city. Each indicator value was derived from the Statistical Yearbooks of Shaanxi Province (2010–2017), Gansu Province (2010–2017), and Shanxi Province (2010–2017), as well as the China City Statistical Yearbook (2010–2017). Due to the lack of statistical data in individual years, there were eight missing data; we applied the average annual growth rate to interpolate the missing data.

4. Results and Discussion
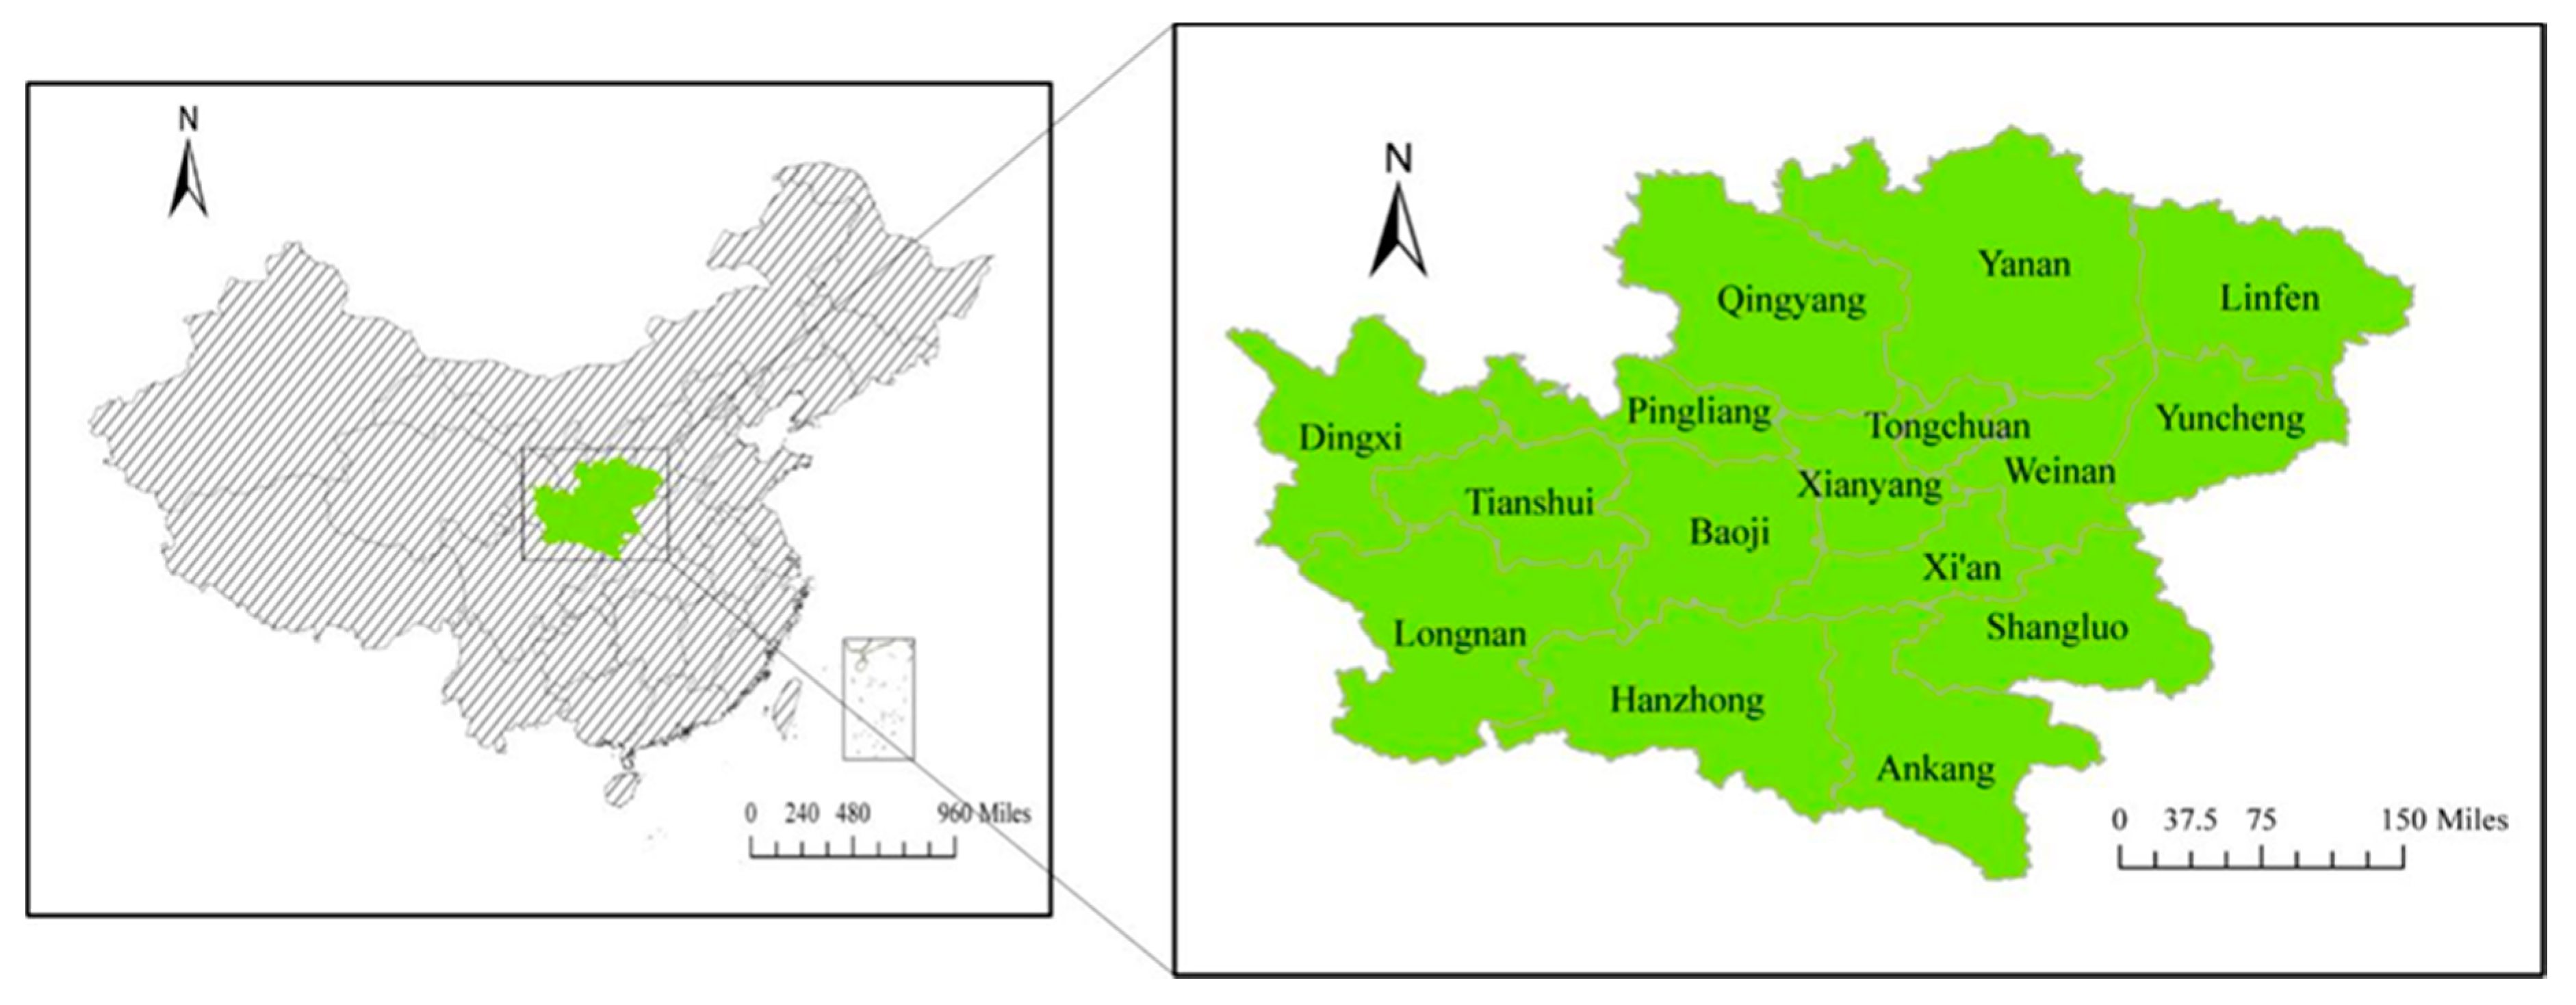
4.1. Research Area

As China has advanced urbanization and its “Silk Road Economic Belt and the 21st-Century Maritime Silk Road” initiative, the Guanzhong region (see Figure 2) has played a core leading role in the development of Northwest China. Strategic support for the development of west China has continued to be further strengthened and developed. The “GPUA Development Plan” was issued by the National Development and Reform Commission of China in 2018. It established Xi’an as the core city and included other 15 cities. Table 3 presents the details of GPUA.

4.2. Calculation Results of Urban Resilience

The weights of the urban resilience evaluation indexes were calculated using the formulas (1)–(7). Comprehensive evaluation values of urban resilience in each year for each city were calculated using a weighted synthesis (see Table 4). The overall evaluation values and the mean values of urban resilience for all cities and in different regions (Eastern, Central, and Western parts of the GPUA) were calculated to observe the regional linear changes of urban resilience in urban agglomerations (see Figure 3 and Figure 4, respectively). This led to the identification of the dynamic evolution characteristics of urban resilience in all cities and different regions from 2009 to 2016 (see Figure 4).
To distinguish the extent of the evaluation values after the quantitative calculations, we needed to conduct a classification analysis to establish the division interval. However, past research has not identified exact rules for the classification method. The commonly used classification methods include the Jenks classification method, equidistant classification method, and self-defined spacing classification method [54,55]. Each method has its own characteristics and applicable conditions. Su et al. [56] and Yang et al. [57] used the equal interval classification method to study urban economic resilience, dividing the comprehensive evaluation value into five grades, ranging from 0–1. Zhang et al. [45] used the self-defined spatial classification method to study urban resilience. Fang et al. [58] used Jenks classification to classify the calculated urban vulnerability into five levels.
Determining the level of regional urban resilience is a relative concept. To comprehensively evaluate and classify the level, we analyzed the differences in the urban resilience levels using a regional distribution pattern. This ensured the objectivity of the analysis results. The Jenks classification method is suitable for non-uniform attribute value classification, and considers the mathematical characteristics of the resilience evaluation value of a regional city obtained by mathematical statistics. Therefore, this study adopted the natural breakpoint classification method using the spatial analysis method of ArcGIS. Based on the mathematical statistics of the natural turning point characteristics of the regional cities’ comprehensive evaluation values, the regional urban resilience level was divided into five grades: Lower resilience, low resilience, medium resilience, high resilience, and higher resilience (see Table 5).
Referring to Figure 3, the comprehensive urban resilience of the GPUA (i.e., the sum of the resilience of all the cities) increased from 4.78 to 5.00 from 2009 to 2016. This represents an overall upward trend. The overall level of urban resilience development was positive, with some fluctuation. Figure 3 shows that the research period can be divided into three development stages. The first stage was from 2009 to 2011. After the global financial crisis in 2008, the GPUA had a low starting point of resilience and was in a stable growth stage. In the second stage, from 2012 to 2014, urban resilience grew rapidly, but there was also significant volatility. The third stage was from 2015–2016, which showed an overall stable trend, moving slightly downward.
It is generally believed that a higher urban resilience aligns with a stronger operational ability to cope with uncertain disturbances. A lower resilience level is generally associated with a less stable ability to maintain the social public order and economic development. From the perspective of specific cities (refer to Table 4), the urban resilience of the GPUA mostly showed different degrees of upward trends in 2009–2016. Facing the external environmental changes and the development of urban internal risks, cities can actively resolve the conflicts and enhance urban resilience.
The specific analysis is as follows:
(1) In 2009–2011, there were two higher-resilient cities in the GPUA and two cities with moderate resilience. This stage covered the period of the successful completion of China’s 11th Five-Year Plan. There were significant economic and social development achievements, and urban resilience improved significantly. Of the GPUA cities, Baoji City and Weinan City experienced a significant economic recovery after the financial crisis and entered a higher-resilience urban sequence. The economic resilience of Baoji City significantly improved, with a more than 40% increase in the per capita GDP. The value of the actual use of foreign capital also increased, providing support and motivation for the city’s overall resilience. As a result of a national ecological demonstration city assessment, a new sewage treatment plant and other urban infrastructure smoothly entered the delivery and use stage. The above measures for Baoji City improved its ecological environment. The comprehensive strength of Weinan City was significantly enhanced. The construction of new industrialization and urbanization was initially effective, with a rapid increase in regional competitiveness. The city’s GDP exceeded 80 billion yuan. However, the economic aggregate was small and the industrial structure was not reasonable. There are still many difficulties in transforming the development mode and promoting energy conservation and emission reduction tasks. These became bottlenecks for the further development of urban resilience.
The urban resilience levels of Shangluo City and Ankang City rose to a moderate level during this stage. These two cities are located in the mountainous area of southwestern Shaanxi. Primary industry accounts for a large proportion of productivity, making resource constraints and environmental pressures very large. Despite this, some progress was made to improve urban resilience. Shangluo City actively attracted investments and expanded by opening up efforts to introduce foreign investment companies. However, the instability of foreign investment in the future will leave hidden dangers for the decline in economic resilience. The non-public economy continued to grow, the city’s economic vitality and the ability to face risks strengthened, and the smooth establishment of a provincial garden city and provincial health city reflected progress that improved social environment resilience.
The market economy vitality of Ankang City also improved, with state-owned enterprise reforms achieving significant results. The development case of the “Ankang Model” has been advanced and learned by other provinces and cities. In terms of infrastructure, Ankang connected the city’s natural gas pipeline and started a gas pipeline project connecting the provincial capital. The number of students in higher education institutions increased, and the introduction and implementation of talent policies alleviated talent shortages in the region. These activities improved Ankang’s urban infrastructure resilience and social environmental resilience.
(2) In the second stage, from 2012–2014, of the 16 cities in GPUA, seven cities improved their urban resilience, five cities rebounded after their resilience values decreased, three cities failed to maintain their maximum levels after an increase in their resilience values, and one city continued to decline. In summary, the overall growth situation remained positive, with a certain level of volatility. In 2012, Dingxi City suffered from natural disasters caused by extremely large hailstones and mudslides. Communication, roads, and medical facilities were damaged to varying degrees, causing the previously lower resilience of Dingxi city to further decline. The floods killed 47 people and damaged 120 km of roads. Some roads in the urban area had water, silt, and roadbeds that collapsed. Communication and medical facilities were damaged to varying degrees, causing the previously lower resilience of Dingxi city to further decline. The flood disaster tested the threshold of urban disaster resistance and exposed the low-standard problems of flood prevention and drainage planning in the early stage of urban construction. The economic loss, infrastructure damage, and social impact caused by the disaster lowered the economic resilience evaluation index and infrastructure resilience evaluation index. After the disaster, the city learned from the past disasters to increase the buffer space of the city when facing a disaster that crosses the threshold. This remedy improved urban resilience. In fact, its resilience improved after industrial restructuring and new urban planning was approved.
Pingliang is a famous resource-dependent city with a low industrial development level and poor ability to cope with market changes. Furthermore, frequently occurring natural disasters have lowered the resilience level of the urban ecological environment. During this stage, Pingliang experienced a volatile city resilience level. As the economy depends on natural resources, fluctuations in the resource market will have an unstable effect on the urban economy. The economic diversification of cities is weak, reflecting the poor rationality of the economic structure. Economic stability, pluralism, innovation ability, and system vitality are the components of economic resilience. Single-resource dependence and the backwardness of other industrial structures have a negative impact on the improvement of economic resilience. The overall industrial layout was ineffective, the industrial level was low, and the total volume was small. This was particularly affected by the decline of the coal and electricity trade market, leading to a decline in the economic development benefits and a decline in the growth rate. The city did not perform well in terms of economic resilience.
Under the influence of the continued sluggish market demand, Weinan’s industrial profits and taxes fell by 8.2% in 2013, and profits fell by 23.3%. In 2014, profits and taxes further fell by 35.9%, and profits fell by 73.1%. The amount of foreign capital fell by 60%, and fiscal expenditure was far greater than the fiscal revenue. Local debt increased. The amount of industrial wastewater discharge increased yearly from 2012 to 2015. Affected by the dual impact of declining economic resilience and low infrastructure resilience, the overall resilience of Weinan has declined since 2013.
(3) During the third stage, 2015–2016, the overall situation stabilized. Due to downward pressure on the economy, the resilience of some resource-dependent cities significantly declined. At the same time, each city’s fiscal revenue was affected by the full implementation of the “replace the business tax with a value-added tax” policy and local income system adjustments. This exerted pressure on the city’s economic resilience. Examples of cities where this occurred included Yuncheng City and Linfen City in the eastern GPUA, in Shanxi Province. This region includes resource-based economic cities, and the main economic bodies depend on coal and other energy industries. The long-term extensive development model makes it difficult for "coal alone" cities when they encounter difficulties in the energy industry. The fiscal revenue and per capita GDP of the two cities experienced a substantial decline. At the same time, due to the difficulty of industrial transformation, the economic development became excessively dependent on a single-pillar industry, the economic support force was unstable, and the resilience level of the cities was significantly reduced.
Shangluo City’s use of foreign capital increased and urban resilience improved from 2009 to 2012. Due to the downward pressure of the domestic economy since 2013, the amount of foreign capital has fallen sharply. In 2016, foreign-, Hong Kong-, Macao-, and Taiwan-invested enterprises fell by 88.9% compared with the previous years, and due to the national "business tax to value-added tax" policy, fiscal revenue decreased. The impact of the Shangluo economy on resilience fluctuates greatly. Therefore, the urban resilience of these cities has declined after rising.

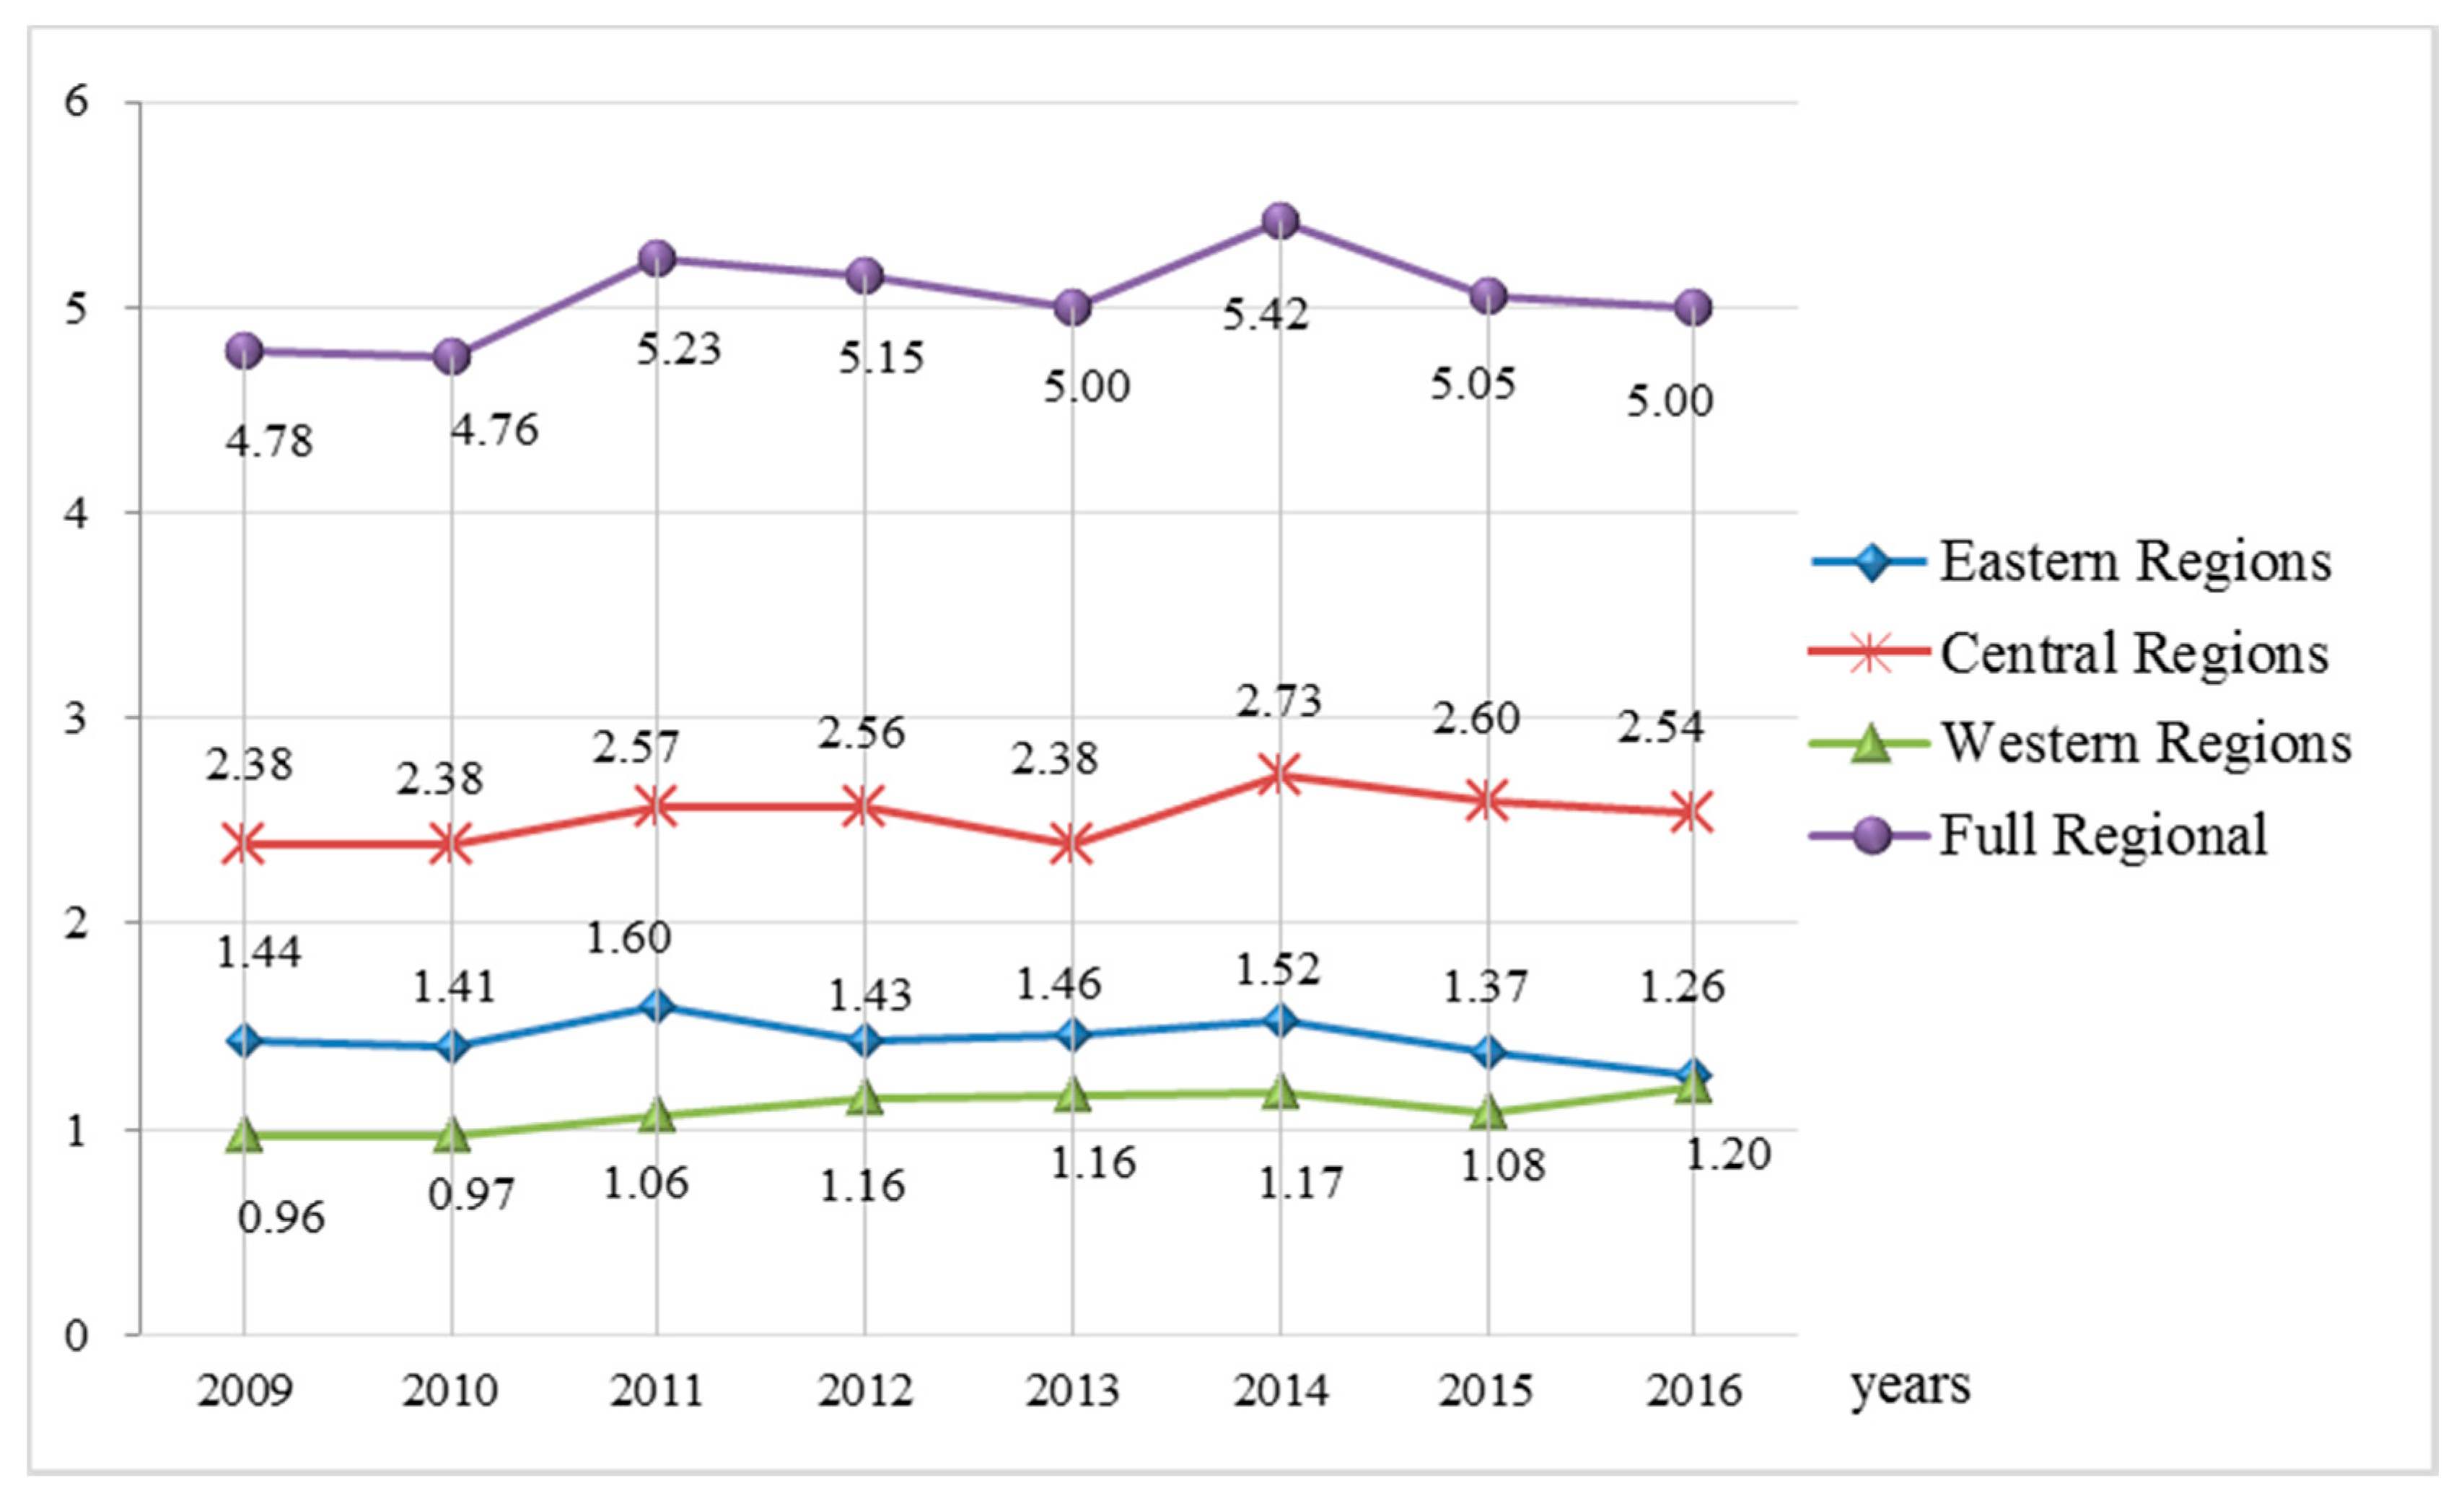
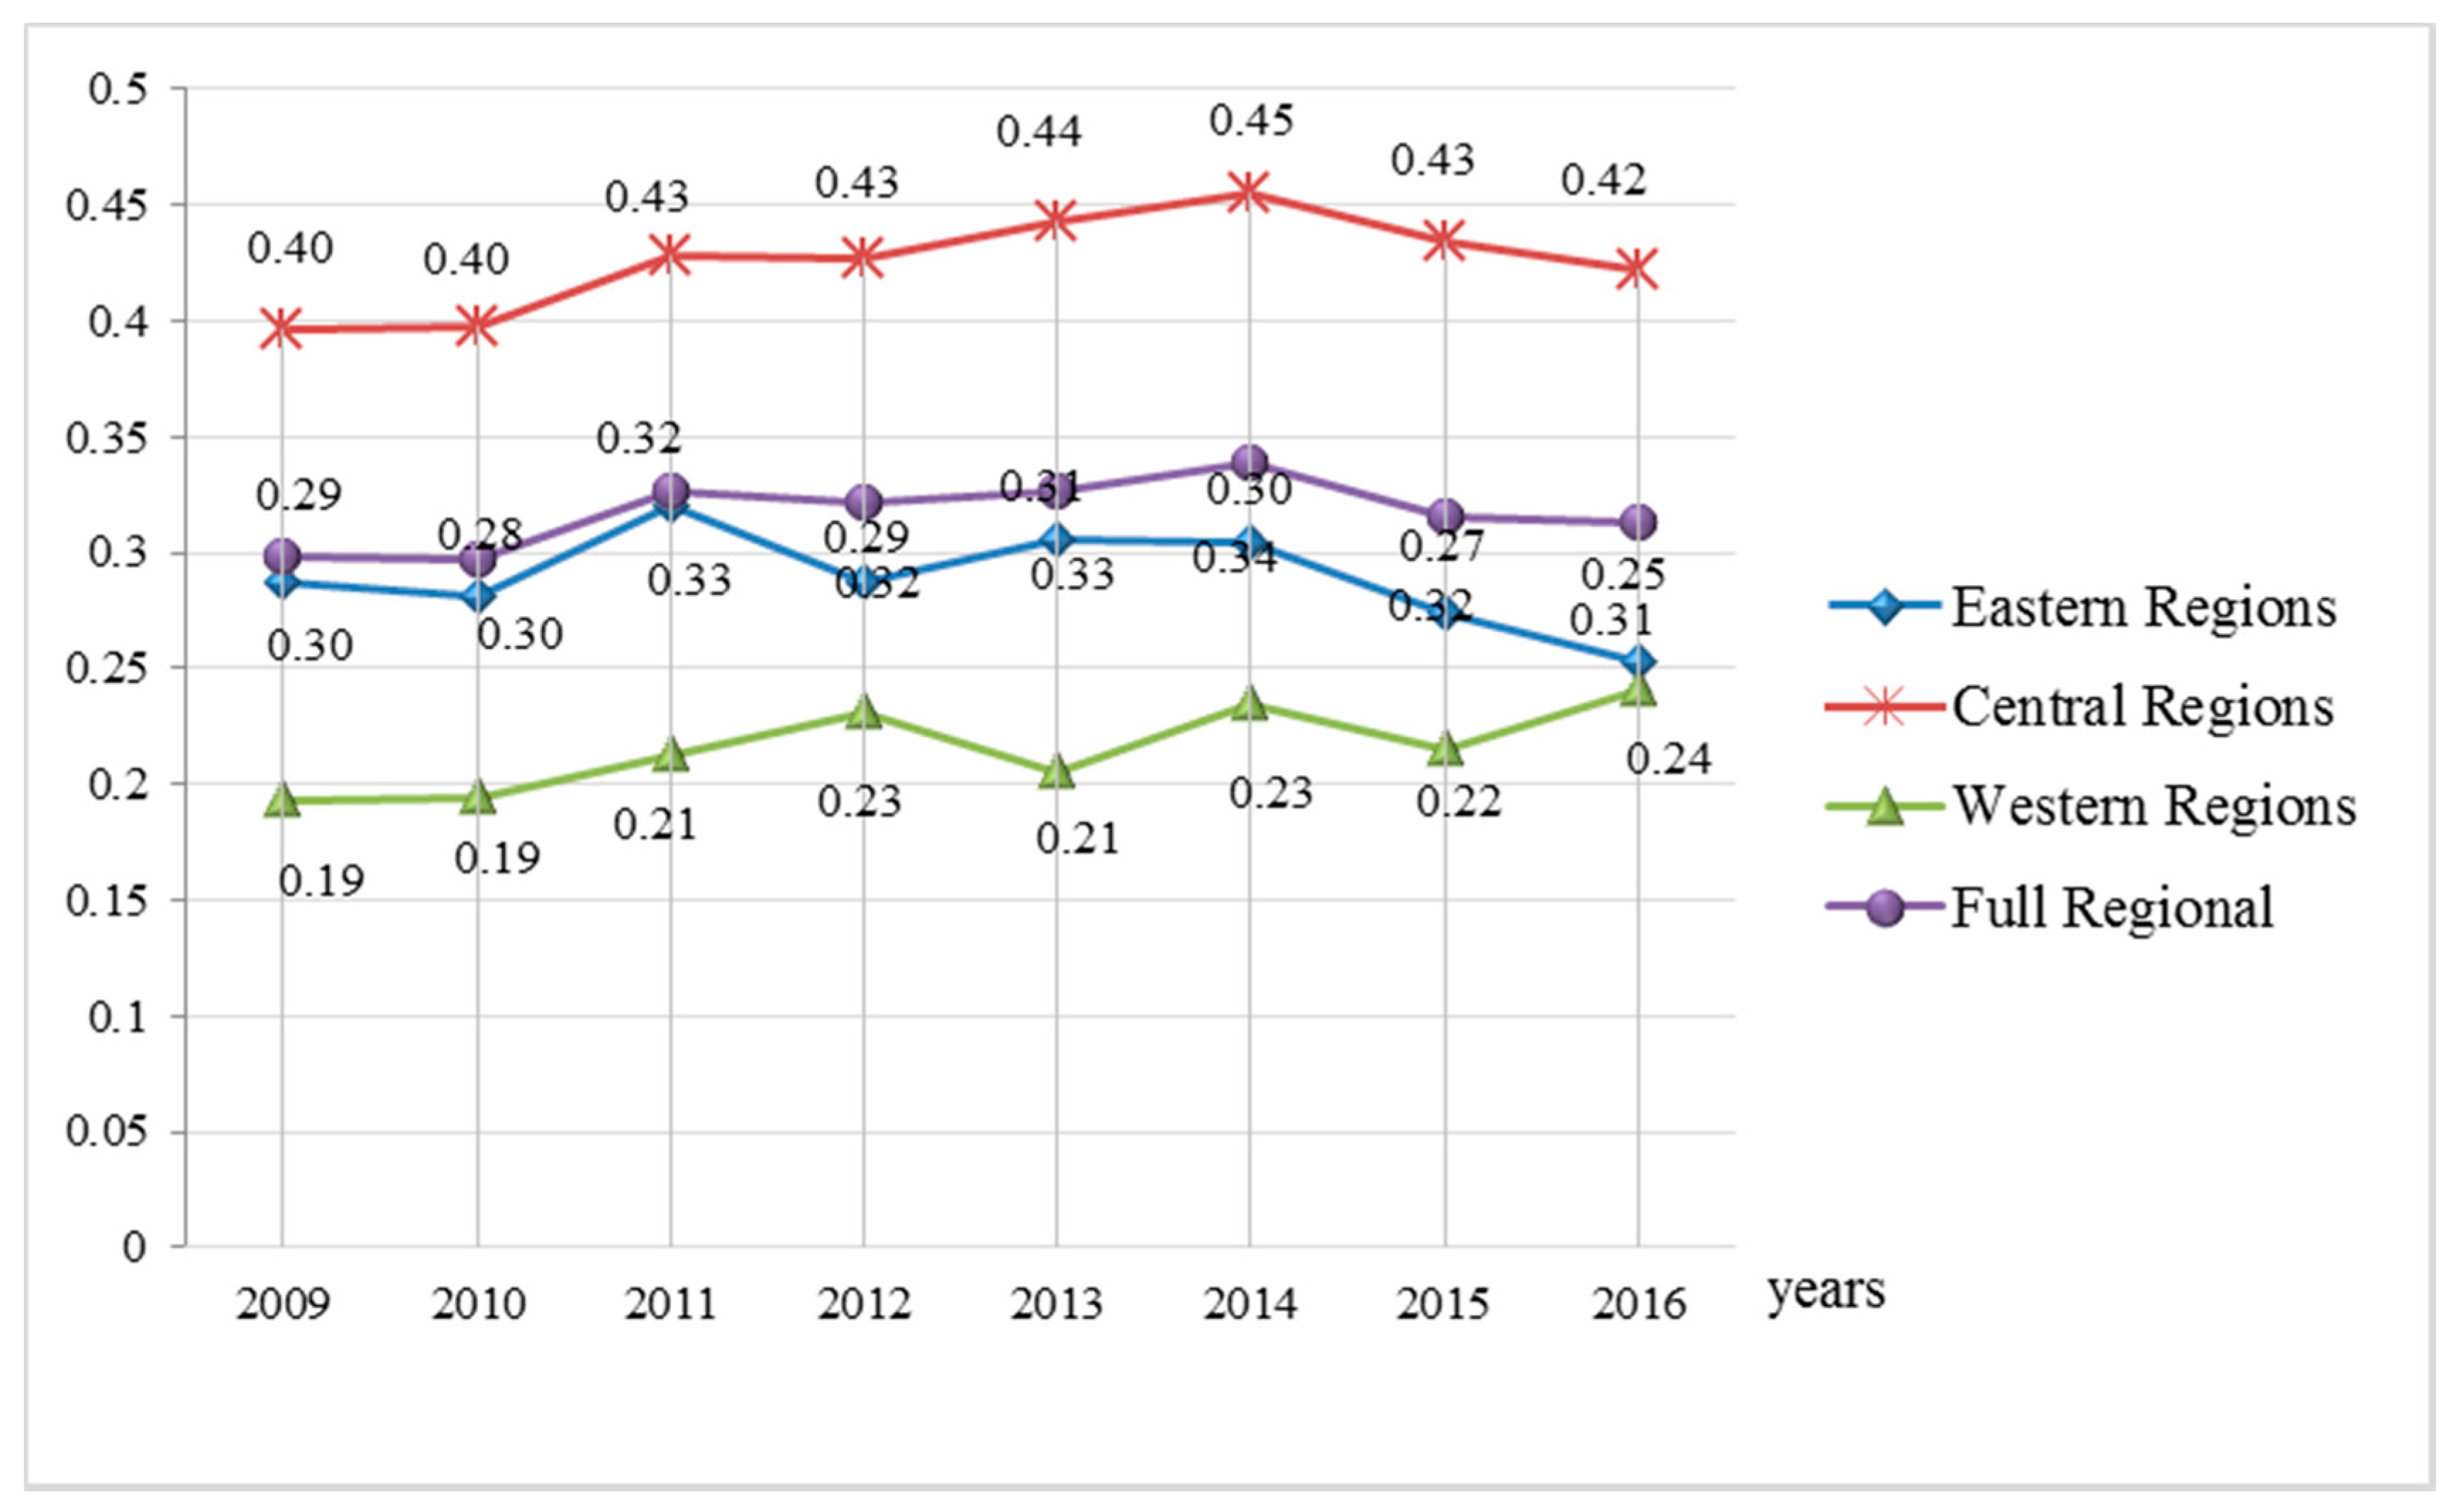
4.3. Spatial–Temporal Evolution of Urban Resilience in the GPUA

To further explore the resilience characteristics and the stage-specific development in the different resilience levels of GPUA cities, ArcGIS was used to analyze the temporal and spatial evolution of urban resilience levels in the GPUA from 2009 to 2016 (see Figure 5).
Figure 5 shows that the high-resilience cities were mainly concentrated in the central and eastern regions of the GPUA in 2009, 2011, 2013, and 2015. The best overall description is that resiliency was “high in the middle, low in the two sides, and east is better than the west.” The central cities had a higher resilience level, and the urban resilience in the eastern and western regions was relatively low. However, the resilience in the east was higher than in the west. More specifically, Xi’an City has always been at the core of the GPUA. It is geographically located at the core of the central part of the GPUA. The surrounding cities have been in a catch-up posture, but the overall level has not significantly changed. Reduced resiliency levels are positively correlated with terrain flatness and traffic accessibility. This also closely relates to the level of regional economic development. The economy in the central and eastern regions of the GPUA is more developed than in the west. The industrial structure and the urban infrastructure are better than in the west.
In the central and eastern parts of the GPUA, social resources are abundant, and the medical systems and the cities are fully functional. In the case of a man-made or natural disaster, the central and eastern regions can quickly respond and bear the high cost of urban development recovery [46]. However, due to the ineffective industrial structures of some cities in the eastern region of the GPUA, most of them have relied on traditional raw material production and the primary industrial product manufacturing industry. This has led to a clear low-resilience environment. In pursuing rapid economic development, the quality of the urban ecological environment has not been comprehensively considered. As such, the environmental carrying capacity has gradually declined. This is an important reason for why the eastern cities’ resilience levels have fluctuated after 2013.
The central region is the most resilient region of the GPUA, with a continuously consolidated and improved urban resilience level. However, only Xi’an was selected as a high-resilience city. First, as a provincial capital city, it is at the core of the province in politics, economy, and culture. Second, based on the geographical area, Xi’an is in the center of the Guanzhong Plain, which is the core city of the urban agglomeration. Xi’an is the national central city. The location and transportation advantages are very significant, with railway, aviation, and highway hubs that have clear effects. The urban population continues to grow in number and density, with many colleges and universities.
This location also represents the starting point of the new era of the “Silk Road” with high resilience growth potential. In 2011, the 41st International Horticultural Exposition was successfully held in the ancient city of Xi’an, enabling the integration of social economy and other factors. In the first stage of the study period, the overall trend of urban resilience evaluation was at a steadily rising level. This shows that high-level activities reflect the comprehensive strength of the city. It also demonstrates that a city’s resiliency can be improved in stages. Xi’an will hold the 14th National Games in 2021, which may create another opportunity to build urban resilience. Xianyang City and Baoji City are adjacent to Xi’an City. They have clear location advantages and are greatly influenced by Xi’an City. They have shown a trend of growth and stable improvements in urban resilience.
The introduction of the integration of Xi’an and Xianyang is expected to advance Xianyang to become the city with the second-highest resilience level. Other cities are also loosely connected, resulting in a weak agglomeration effect of social and economic factors, but with insufficient resilience created from this self-construction. This development trend is consistent with the overall situation of the GPUA, but has occurred at a relatively slow pace.
The urban resilience in the western region of the GPUA was relatively low, with an absolute value that is essentially below 0.3. This is mainly due to the weak economic foundation of the western region and the influence of many factors, such as nature and social history. The level of urban development lagged behind compared to other regions. When natural or man-made disasters have occurred, scientific and reasonable emergency measures have not been implemented. The region is also not able to achieve rapid self-repair and self-improvement.
In this region, Qingyang City has had good economic development due to abundant resources, such as oil and gas. Its urban resilience has continuously improved. Pingliang, Longnan, and other cities showed steady growth; however, the overall level remained low. The western region has maintained an overall wave-like trend, which is projected to continue into the future. As the overall urban economy has steadily risen, the urban spatial structure continued to be optimized; the industrial structure transformation and upgrading continued to strengthen, and the high-energy industry was fully adjusted and controlled. Continuous optimization, enhanced synergy, and linkages with urban development should promote urban self-recovery capacity in the GPUA.

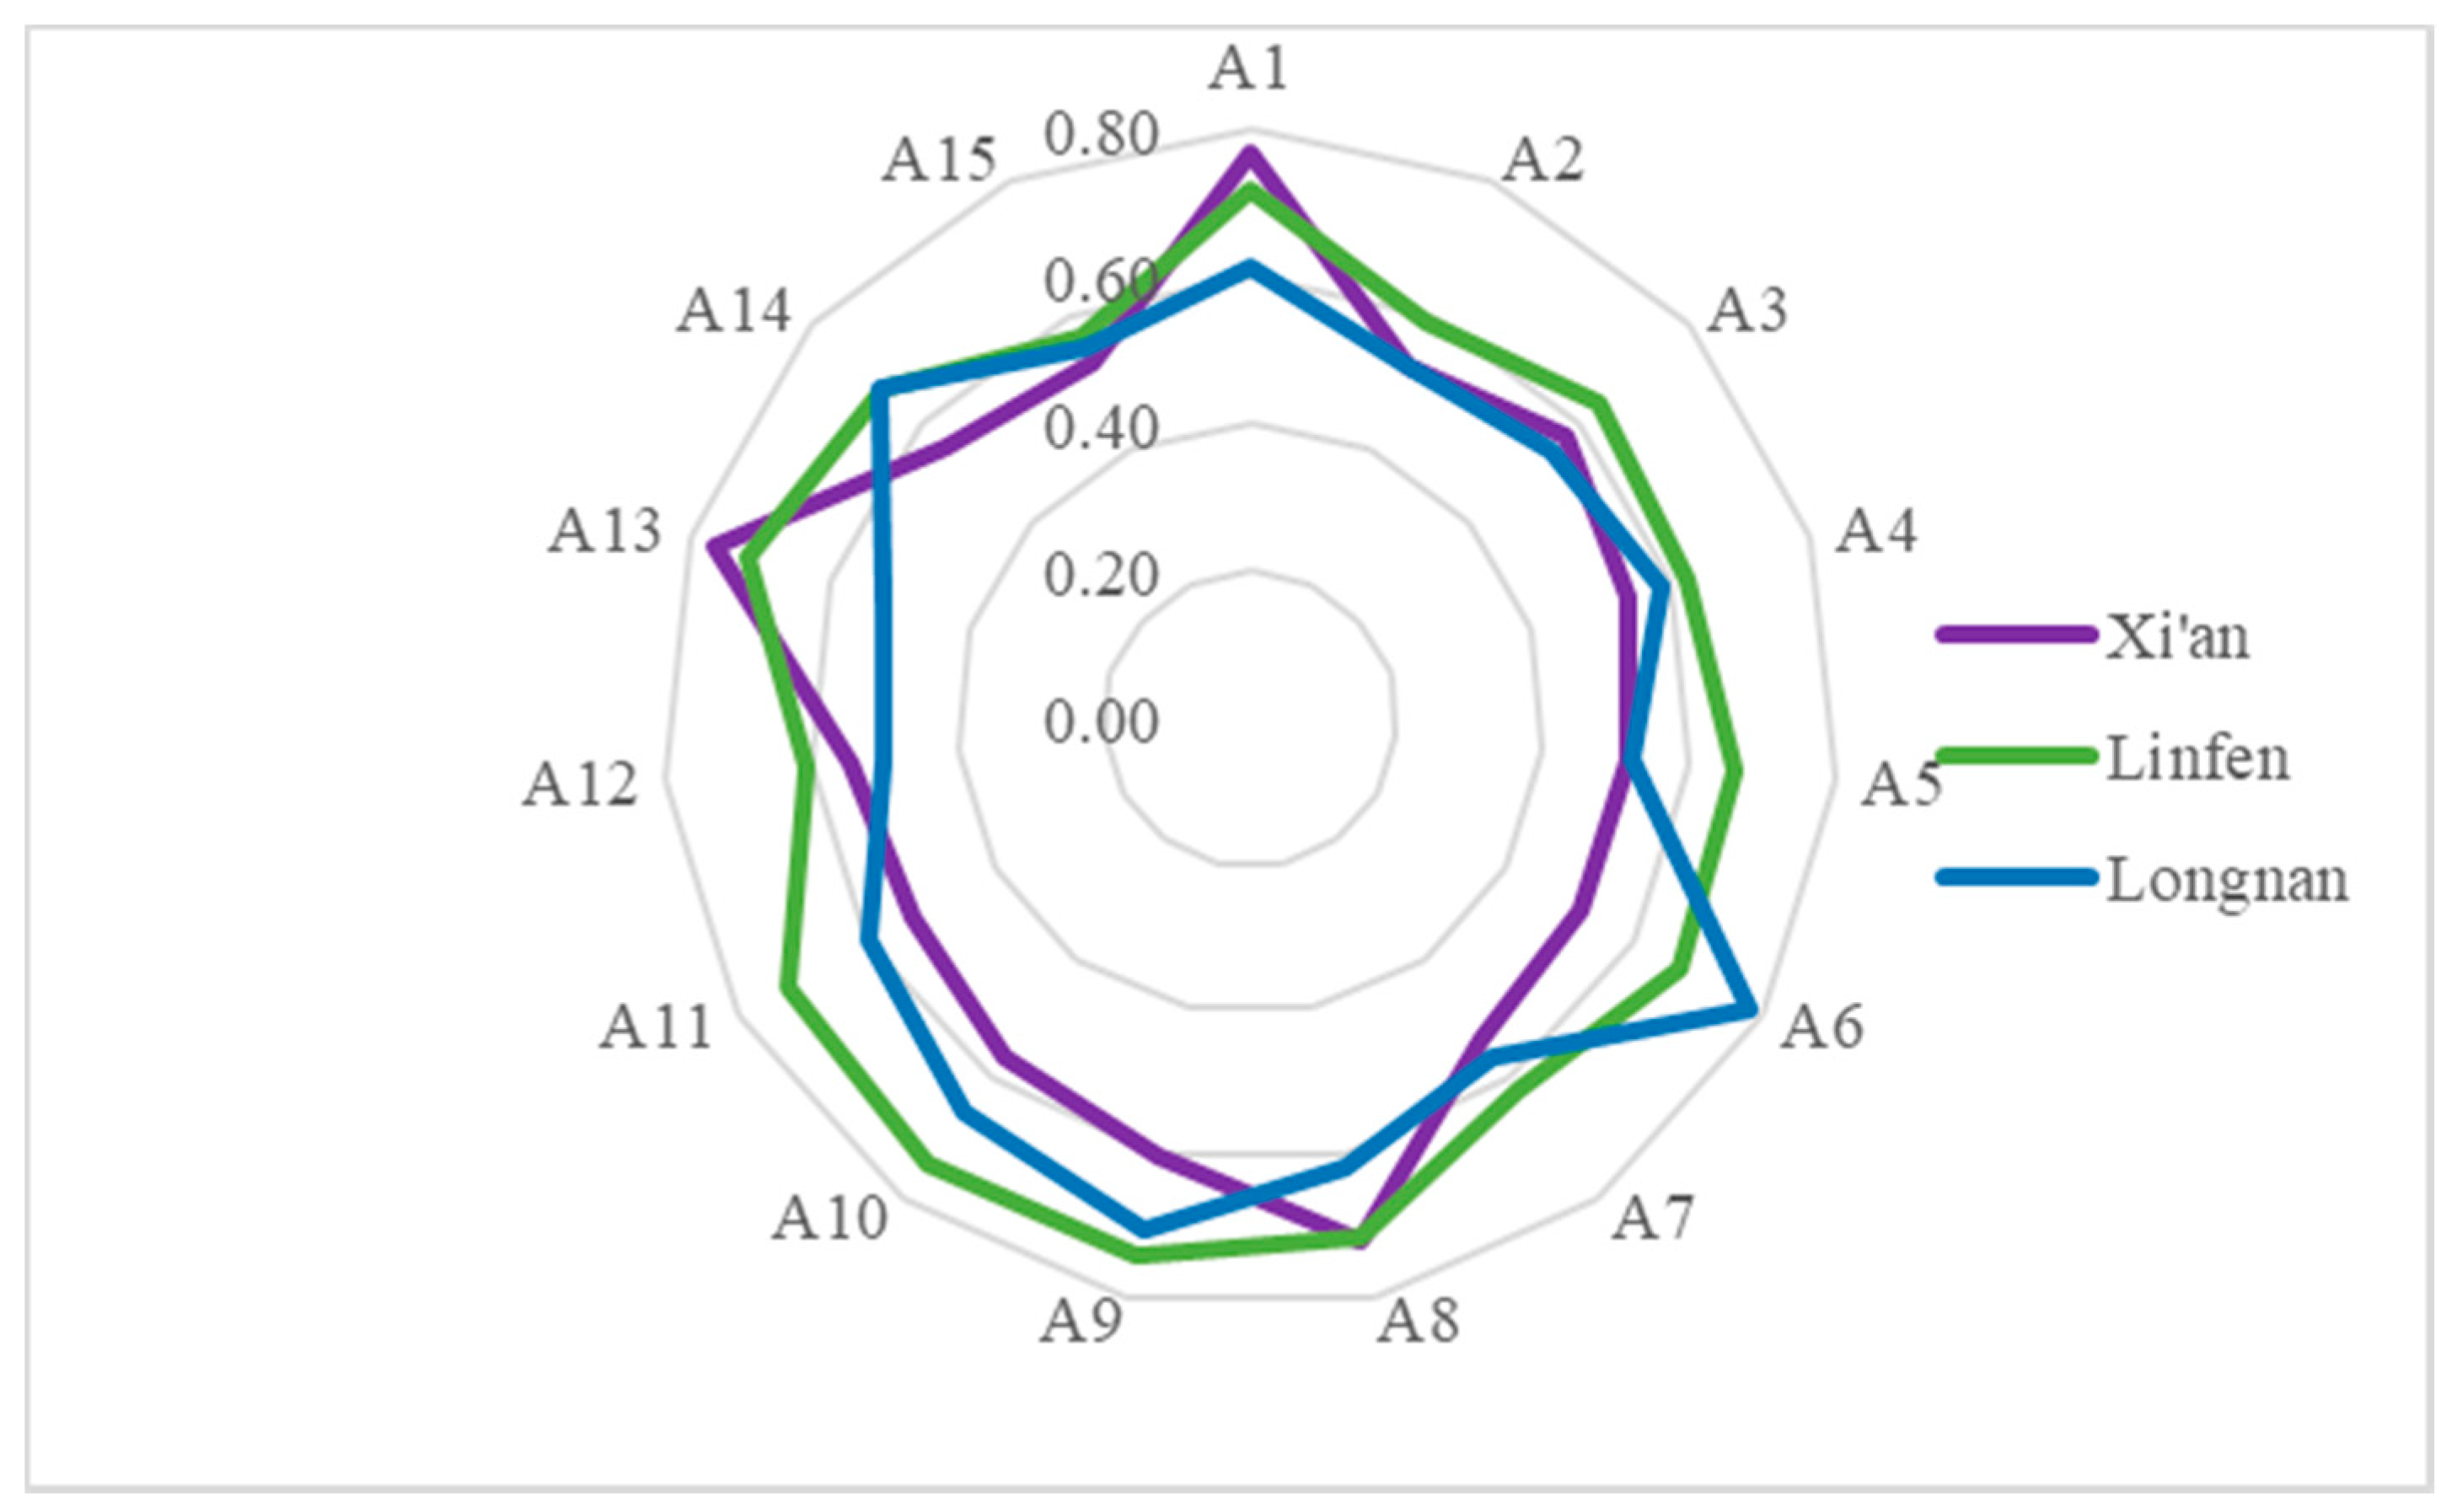
4.4. Influencing Factors Analysis of Urban Resilience

By sorting the total urban resilience evaluation value of each city in the GPUA over the past eight years, we found that Xi’an is in the first place, Linfen is in the middle, and Longnan is in the bottom. Therefore, Xi’an City, Linfen City, and Longnan City were selected as the representative cities with high, moderate, and low urban resilience and of the central, eastern, and western parts of the urban agglomeration. Based on the grey correlation analysis calculation formula, the data of the three cities are taken as samples. First, the influencing factors are investigated and sorted in combination with the aforementioned urban resilience measurement level. Second, the main factors are found among the indicators with different levels of influence. The comprehensive correlation values between the resilience evaluation values of the three cities of Xi’an, Linfen, and Longnan and the 15 sub-indicators in the evaluation system were calculated and ranked in descending order (see Table 6). In Table 6, the Xi’an Sort represents the ranking of the correlation degree between resilience indicators and its value in resilience in descending order. Indicator code represents the code of each indicator, and correlation represents the correlation degree between indicators and urban resilience.
Figure 6 shows that the correlation between the evaluation indicators and urban resilience differs in different regions; however, they do exhibit certain commonalities. Table 7 analyzes the five indicators with the highest correlation with the resilience level of each city, as well as the categories of the indicators.
The analysis results of the three representative cities indicate that social environmental resilience indicators and infrastructure resilience indicators were ahead of other factors in contributing to resilience levels. The main factors influencing the GPUA included urban infrastructure service level and social environmental carrying capacity. Improving urban infrastructure construction and social environment optimization played a key role in improving the resilience of the GPUA cities. In addition, the number of students in regular colleges and universities, the financial revenue, and the amount of foreign investment used positively impacted improvements in urban resilience. The economic resilience indicators showed that the local government’s ability to support urban development and self-storage, social and technological resilience, and the level of scientific and technological education and innovation significantly impacted a city’s resilience. These factors were the driving force of urban infrastructure construction. Outside funding also positively affected urban industrial innovation and urban vitality.
(1) The central cities, with higher resilience, are represented by Xi’an. Xi’an is the largest city in Guanzhong, and colleges and universities are consolidated in the city. This attracts a large floating population and young students from the GPUA and its surrounding cities. The urban population continues to increase. Since the launch of the “Popular Innovation and Entrepreneurship” initiative in 2014, there has been a significant increase in the main market players in Xi’an, and the volume of the city’s economy has fully developed and expanded. The increased population has compressed the city’s original bearing capacity. This has also compressed the urban greening land, the green coverage rate of the built-up area, and the number of buses per 10,000 people. These have become important factors in comprehensively evaluating the resilience level. Industrial wastewater discharge has also become an important factor in the index. The emissions have decreased from 131.68 million tons in 2009 to 40.29 million tons in 2016; this reduction in emissions is significant. In the future, improving the urban resilience in Xi’an should focus on improving the above indicators, particularly on improving the supporting facilities and increasing the infrastructure.
(2) The western part of the GPUA is represented by Longnan. Urbanization in this region is slow, due to the climatic environment and its location in a disadvantaged area. This has led to an underdeveloped industrial structure. In recent years, with the help of national preferential policies and industry support, Longnan has steadily grown its resilience level with the help of economic development and progress in transportation. Of the five important related indicators for Longnan, three are social environmental resilience indicators. This indicates that improving the social environment significantly affects improvements in urban resilience. It is important to rationally plan to upgrade the level of emergency medical care and further build drainage facilities that match the urban carrying capacity.
The primary industry in the northwest region is relatively high, creating a higher pressure on urbanization. The local government should effectively alleviate poverty, create a high-quality business environment, and actively create more jobs. The eastern cities represented by Linfen are in the middle of the Central Plains urban agglomeration and the GPUA. Compared with the western region, the eastern region has had a smoother development in information flows, business flows, and capital flows. Linfen has unique advantages with respect to natural resources. It is one of the few high-quality main coking coal production bases in China. These coal resources provide sufficient power for urban economic development.
(3) The resilience of Linfen City, driven by economic factors, represents a middle position with respect to resilience. Factors outside the economy have had a greater impact on improving urban resilience. These factors include medical facilities, the number of students in higher education institutions, and the per capita road area. Linfen City has faced an industrial transformation, and the city’s tourist attractions bring advantages to tourism industry development. The city is geographically located in a favorable location at the intersection of the provincial capital cities of Shanxi, Shaanxi, and Henan. In the future, efforts should be made to improve urban education and medical care, prevent population loss, focus on linkage effects with developed regions, and increase regional urban coordination.

5. Conclusions and Recommendations

As China’s urbanization has accelerated, urban resilience has become an important research direction for urban planning and sustainable development. This study evaluated 16 cities in the GPUA, providing a case study for urban resilience in underdeveloped areas and growth areas. The results show that: (1) The urban resilience value of the GPUA presents geographical difference in the eastern, central, and western regions. The resilience of cities located in the center of the region is high, while the resilience values of surrounding cities are low. The GPUA can be approximated as a circle; Xi’an is at the center of the circle and has the highest urban resilience. The resilience of the other cities decreased gradually along the radius of the GPUA. (2) The urban resilience of most cities in the GPUA is in the middle and lower levels, and the development of cities is not balanced. Baoji and Xianyang have advantages in development during 2009–2016, and they try to promote the resilience of the GPUA as sub-central cities. (3) Infrastructure resilience and ecological environment resilience are key weaknesses in urban development. Meanwhile, economic resilience is the main factor impacted by fluctuations in urban resilience.
It is important to clarify the spatial and temporal differentiation pattern of urban resilience and its influencing factors, which can enhance the adaptability to urban risk and the potential for urban sustainable development [59]. To improve the overall level of resilience of the GPUA and to narrow the gap between cities, economic development must be established as the leading factor, and different methods should be adopted to improve the economic level. Second, cities should engage in rational planning based on actual conditions. Third, the function of the urban agglomeration should be considered, with overall development established as the goal of regional co-ordination. Finally, the principle of ecological sustainability should be adopted during development, emphasizing development quality. Specific recommendations are as follows.
First, the city should be more open to ensure the smooth flow of economic factors and to further accelerate the stable growth of the economy economic. The city manager should try to create a stable business environment and take advantage of the geographical advantages of cities along the "Silk Road Economic Belt" to actively engage in investment and create rich opportunities for science and innovation education. In particular, resource-dependent cities should pay more attention to diversified development and promote high-quality development in the manufacturing and service industries.
Second, cities should improve infrastructure and reasonably allocate public resources. Most of the GPUA cities are located in underdeveloped areas in western China, where natural disasters are relatively frequent and urban infrastructure is of low resilience. Therefore, it is necessary to mitigate the significant under-development and weaknesses of the current infrastructure. The increase in high-speed railways and logistics stations will help improve infrastructure resilience. Emergency recovery plans for extreme weather, infectious diseases, and power outages are also important.
Third, we need to strengthen the links and cooperation among cities in the urban agglomeration and formulate unified policies and standards. Local conditions should shape the strengthening of policy designs and technical support to build urban resilience. The core cities of each urban agglomeration should guard against the social and environmental pressure caused by dense population; each city should also excel at using the evacuation function of sub-central cities. Urban resilience can also be improved by establishing cooperation between cities [60]. This requires that in overall regional planning and development of urban characteristics, planners and policy makers should strengthen regional coordination and cooperation, coordinate different development demands, and build a spatial coordination mechanism to develop resilient cities.
This study included an in-depth selection of research methods and touched on several research areas. However, the main factors influencing urban resilience will change over time. Hence, the evaluation indicators and evaluation models selected in this study need to be reassessed on a regular basis. In recent years, the frequent presence of haze in the GPUA has significantly influenced the urban environment and resident travel [61]. This should be considered as a factor in evaluating urban resilience, and future studies should adjust the urban resilience evaluation system based on this current situation. In addition, with the rise of smart cities, future studies should investigate the relevant factors influencing smart city construction and focus on the resilience characteristics of a smart city.

Author Contributions

For this study, F.M. proposed the idea of this study; F.M. and Z.W. jointly organized the structure of this study and established the calculation model; H.X., Y.Z., and Z.W. collected the data and carried out the model calculations; Q.S. and S.Z. provided the analysis software; F.M., Z.W., and K.F.Y. analyzed the results and wrote the paper together. All authors have read and agreed to the published version of the manuscript.

Funding

This research was funded by the National Social Science Foundation of China, grant number [18BGL258].

Conflicts of Interest

The authors declare that there is no conflict of interests of this paper.

References

  1. Ng, S.T.; Xu, F.J.; Yang, Y.; Lu, M.; Li, J. Necessities and challenges to strengthen the regional infrastructure resilience within city clusters. Procedia Eng. 2018, 212, 198–205. [Google Scholar] [CrossRef]
  2. Spaans, M.; Waterhout, B. Building up resilience in cities worldwide—Rotterdam as participant in the 100 resilient cities programme. Cities 2016, 61, 109–116. [Google Scholar] [CrossRef] [Green Version]
  3. Klein, R.J.T.; Nicholls, R.J.; Thomalla, F. Resilience to natural hazards: How useful is this concept? Environ. Hazards 2003, 5, 35–45. [Google Scholar] [CrossRef]
  4. Alexander, D.E. Resilience and Disaster Risk Reduction: An Etymological Journey. Nat. Hazards Earth Syst. Sci. 2013, 13, 2707–2716. [Google Scholar] [CrossRef] [Green Version]
  5. Holling, C.S. Resilience and stability of ecological systems. Annu. Rev. Ecol. Syst. 1973, 4, 1–23. [Google Scholar] [CrossRef] [Green Version]
  6. Shao, Y.; Xu, J. Urban resilience: A conceptual analysis based on international literature review. Int. Urban Plan. 2015, 30, 48–54. [Google Scholar]
  7. Jabareen, Y. Planning the resilient city: Concepts and strategies for coping with climate change and environmental risk. Cities 2013, 31, 220–229. [Google Scholar] [CrossRef]
  8. United Nations General Assembly, New Urban Agenda: Resolution adopted by the General Assembly on 23 December 2016 (2017). Available online: http://habitat3.org/wp-content/uploads/New-Urban-Agenda-GA-Adopted-68th-Plenary-N1646655-E.pdf (accessed on 17 May 2019).
  9. Statistics Bureau: By the End of 2019, China’s Urbanization Rate is 60.60% [DB/OL]. Available online: http://finance.sina.com.cn/china/gncj/2020-01-17/doc-iihnzahk4671933.shtml (accessed on 17 January 2020).
  10. Holling, C.S.; Gunderson L, H. Resilience and adaptive cycles. In Panarchy: Understanding Transformations in Human and Natural Systems; Island Press: Columbia, WA, USA, 2001; pp. 25–62. [Google Scholar]
  11. Walker, B.; Holling, C.S.; Carpenter, S.R.; Kinzig, A. Resilience, Adaptability and transformability in social-ecological systems. Ecol. Soc. 2004, 9, 5. [Google Scholar] [CrossRef]
  12. Li, W. New Progress in resilience city research. Int. Urban Plann. 2017, 5, 15–25. [Google Scholar]
  13. Qiu, B. Resilience urban design method and principle based on complex adaptive system theory. Urban Dev. Res. 2018, 25, 1–3. [Google Scholar]
  14. Wilkinson, C. Social-ecological resilience: Insights and issues for planning theory. Plan. Theory 2011, 11, 148–169. [Google Scholar] [CrossRef]
  15. Xiu, C.; Wei, Y.; Wang, W. Evaluation of urban resilience in dalian based on scale-density-form. Acta Geogr. Sin. 2018, 73, 2315–2328. [Google Scholar]
  16. Rafael, S.; Martins, H.; Sá, E.; Carvalho, D.; Lopes, C.B.M. Influence of urban resilience measures in the magnitude and behavior of energy fluxes in the city of Porto (Portugal) under a climate change scenario. Sci. Total Environ. 2016, 566–567, 1500–1510. [Google Scholar] [CrossRef]
  17. Li, Y.; Zhai, G.; Gu, F. A review of quantitative assessment methods for urban infrastructure Resilience. Urban Dev. Res. 2016, 6, 113–122. [Google Scholar]
  18. Kammouh, O.; Noori, A.Z.; Taurino, V.; Mahin, S.A.; Cimellaro, G.P. Deterministic and fuzzy-based methods to evaluate community resilience. Earthq. Eng. Eng. Vib. Engl. Vers. 2018, 17, 261–275. [Google Scholar] [CrossRef]
  19. Yoon, D.K.; Kang, J.E.; Brody, S.D. A measurement of community disaster resilience in Korea. J. Environ. Plan. Manag. 2016, 59, 436–460. [Google Scholar] [CrossRef]
  20. Kim, D.; Lim, U. Urban resilience in climate change adaptation: Aconceptual framework. Sustainability 2016, 8, 405. [Google Scholar] [CrossRef] [Green Version]
  21. Fan, M.F. Disaster care and community resilience: Reflections on Typhoon Morakot in Taiwan. J. Environ. Plan. Manag. 2015, 58, 24–38. [Google Scholar] [CrossRef]
  22. Kim, D.H.; Eisenberg, D.A.; Chun, Y.H.; Park, J. Network topology and resilience analysis of South Korean power grid. Phys. A Stat. Mech. Appl. 2017, 465, 13–24. [Google Scholar] [CrossRef] [Green Version]
  23. Zhao, C.; Li, N.; Fang, D.A. conceptual framework for modeling critical infrastructure interdependency: Using a multilayer directed network modeland targeted attack-based resilience analysis. IEEE Trans. Ultrason. Ferroelectr. Freq. Control 2015, 44, 752–768. [Google Scholar]
  24. Serre, D.; Heinzlef, C. Assessing and mapping urban resilience to floods with respect to cascading effects through critical infrastructure networks. Int. J. Dis. Risk Reduct. 2018, 30, 235–243. [Google Scholar] [CrossRef]
  25. Chan, S.L.; Wey, W.M.; Chang, P.H. Establishing disaster resilience indicators for Tan-sui river basin in Taiwan. Soc. Indic. Res. 2014, 115, 387–418. [Google Scholar] [CrossRef]
  26. Rus, K.; Kilar, V.; Koren, D. Resilience assessment of complex urban systems to natural disasters: A new literature review. Int. J. Dis. Risk Reduct. 2018, 31, 311–330. [Google Scholar] [CrossRef]
  27. Kuscahyadi, F.; Meilano, I.; Riqqi, A. Spatial modelling of disaster resilience using infrastructure components of baseline resilience indicators for communities (BRIC) in special region of Yogyakarta. AIP Conf. Proc. 2017, 1857, 100012. [Google Scholar] [CrossRef]
  28. Gunderson, L.H.; Holling, C.S.; Gunderson, L.H. Panarchy: Understanding transformations in human and natural systems. Ecol. Econ. 2004, 49, 488–491. [Google Scholar]
  29. Wildavsky, A.B. Searching for Safety; TransactionBooks: Piscataway, NJ, USA, 1988. [Google Scholar]
  30. Asprone, D.; Cavallaro, M.; Latora, V. Urban network resilience analysis in case of earthquakes. In Safety, Reliability, Risk and Life-Cycle Performance of Structures and Infrastructures; Deodatis, G., Ellingwood, B.R., Frangopol, D.M., Eds.; CRC Press: London, UK, 2014; pp. 4069–4075. [Google Scholar]
  31. Mileti, D.S. Disasters by Design: A Reassessment of Natural Hazards in the United States; Henry (Joseph) Press: Washington, DC, USA, 1999. [Google Scholar]
  32. Paton, D.; Johnston, D. Disasters and communities: Vulnerability, resilience and preparedness. Dis. Prev. Manag. 2001, 10, 270–277. [Google Scholar] [CrossRef]
  33. Pelling, M. The Vulnerability of Cities: Natural Disasters and Social Resilience; Earthscan: London, UK, 2003. [Google Scholar]
  34. ISDR. International strategy for disaster reduction hyogo framework for action 2005–2015: Building the resilience of nations and communities to disasters. In Proceedings of the World Conference on Disaster Reduction, Kobe, Japan, 18–22 January 2005; pp. 18–22.
  35. Cutter, S.L.; Barnes, L.; Berry, M.; Burton, C.; Evans, E.; Tate, E.; Webb, J. A place-based model for understanding community resilience to natural disasters. Glob. Environ. Chang. 2008, 18, 598–606. [Google Scholar] [CrossRef]
  36. Brown, A.; Dayal, A.; Rio, C.R.D. From practice to theory: Emerging lessons from Asia for building urban climate change resilience. Environ. Urban. 2012, 24, 531–556. [Google Scholar] [CrossRef] [Green Version]
  37. Wardekker, J.A.; Jong, A.D.; Knoop, J.M.; van der Sluijs, J.P. Operationalizing a resilience approach to adapting an urban delta to uncertain climate changes. Technol. Forecast. Soc. Chang. 2010, 77, 987–998. [Google Scholar] [CrossRef] [Green Version]
  38. Wamsler, C.; Brink, E.; Rivera, C. Planning for climate change in urban areas: From theory to practice. J. Clean. Prod. 2013, 50, 68–81. [Google Scholar] [CrossRef] [Green Version]
  39. Wink, R. Regional economic resilience: Policy experiences and issues in europe. Raumforsch. Raumordn. 2014, 72, 83–84. [Google Scholar] [CrossRef] [Green Version]
  40. Lhomme, S.; Diab, Y.; Laganier, R.; Serre, D. Urban technical networks resilience assessment. In Resilience and Urban Risk Management; Laganier, R., Ed.; CRC Press: London, UK, 2013; pp. 109–117. [Google Scholar]
  41. ARUP. City Resilience Index [DB/OL]. Available online: http://www.cityresilienceindex.org (accessed on 28 January 2019).
  42. Suárez, M.; Gómez-Baggethun, E.; Benayas, J.; Tilbury, D. Towards an urban resilience index: A case study in 50 spanish cities. Sustainability 2016, 8, 774. [Google Scholar] [CrossRef] [Green Version]
  43. Gonalves, C.; Marques da Costa, E. Framework and indicators to measure urban resilience: Assay in caldasda rainha and vora urban systems. In Proceedings of the AESOP-ACSP Joint Congress, Dublin, Ireland, 15–19 July 2013. [Google Scholar]
  44. Tang, N. Xiamen Urban Disaster Risk and Resilience Assessment and Promotion Strategy Research[A]. In Sharing and Quality—2018 China Urban Planning Annual Conference Proceedings (01 City Security and Disaster Prevention Planning) [C]; China Urban Planning Association: Hangzhou, China, 2018; Volume 12, pp. 41–52. [Google Scholar]
  45. Zhang, M.; Feng, X. Comprehensive Evaluation of Urban Resilience in China. Urban Probl. 2018, 10, 27–36. [Google Scholar]
  46. Lu, X.; Cheng, Q.; Xu, Z.; Xu, Y.; Sun, C. Real-time city-scale time-history analysis and its application in resilience-oriented earthquake emergency responses. Appl. Sci. 2019, 9, 3497. [Google Scholar] [CrossRef] [Green Version]
  47. Chen, J.; Yang, X.; Yin, S.; Wu, K.; Deng, M.; Wen, X. The vulnerability and simulation of social-ecological systems in a semi-arid area: A case study of Yulin City, China. J. Geogr. Sci. 2018, 28, 152–174. [Google Scholar] [CrossRef] [Green Version]
  48. Roberto, C.; Gianpiero, T. Regional resilience in italy: A very long-run analysis. Reg. Stud. 2014, 48, 1779–1796. [Google Scholar]
  49. Reiner, M.; Mcelvaney, L. Foundational infrastructure framework for city resilience. Sustain. Resil. Infrastruct. 2017, 2, 1–7. [Google Scholar] [CrossRef]
  50. Ma, F.; Liu, F.; Yuen, K.F. Cascading failures and vulnerability evolution in bus-metro complex bilayer network under rainstorm weather conditions. Int. J. Env. Res. Pub. He. 2019, 16, 329. [Google Scholar] [CrossRef] [Green Version]
  51. Su, W. Research on the Theory and Method of Multi-Index Comprehensive Evaluation. Ph.D. Thesis, Xiamen University, Xiamen, China, 2000. [Google Scholar]
  52. Zhu, X.; Wei, G. Discussion on the excellent standard of dimensionless method in entropy method. Stat. Decis. 2015, 31, 12–15. [Google Scholar]
  53. Yi, D.; Guo, P. Grey Theory and Method Summary, Problem Solution, Procedure, Application; Petroleum Industry Press: Beijing, China, 1992; pp. 25–35. [Google Scholar]
  54. North, M.A. A method for implementing a statistically significant number of data classes in the jenks algorithm. In Proceedings of the International Conference on Fuzzy Systems & Knowledge Discovery, Tianjin, China, 14–16 August 2009. [Google Scholar]
  55. Cohen, A.L.; Nosofsky, R.M.; Zaki, S.R. Category variability, exemplar similarity, and perceptual classification. Mem. Cognit. 2001, 29, 1165–1175. [Google Scholar] [CrossRef] [Green Version]
  56. Su, F.; Zhang, P. Evaluation of the vulnerability of daqing city’s economic system based on set pair analysis. J. Geogr. Sci. 2010, 4, 454–464. [Google Scholar]
  57. Yang, Y.; Wang, S.; Chen, X. Study on the dynamic evolution and control of vulnerability of petroleum city economic system: A case study of daqing city. Geogr. Sci. 2015, 4, 456–463. [Google Scholar]
  58. Fang, C.; Wang, Y.; Fang, J. A comprehensive assessment of urban vulnerability and its spatial differentiation in China. J. Geogr. Sci. 2016, 26, 153–170. [Google Scholar] [CrossRef]
  59. Zhang, P.; Yu, W.; Zhang, Y. Spatiotemporal differentiation of urban resilience in Shandong Province and its influencing factors. Urban Probl. 2018, 9, 27–34. [Google Scholar]
  60. Sitinjak, E.; Sagala, S.; Rianawati, E. Opportunity for Sister City Application to Support Resilience City. Available online: https://www.rdi.or.id/file/pdf/8.pdf (accessed on 21 June 2019).
  61. Ma, F.; Liang, Y.; Yuen, K.F.; Sun, Q.P. Assessing the vulnerability of urban rail transit network under heavy air pollution: A Dynamic vehicle restriction perspective. Sustain. Cities Soc. 2020, 52, 101851. [Google Scholar] [CrossRef]
Figure 1. Indicator selection process.
Sustainability 12 02593 g001
Figure 2. The research area.
Sustainability 12 02593 g002
Figure 3. The trends in the total resilience values of the GPUA (2009–2016).
Sustainability 12 02593 g003
Figure 4. The trends of urban resilience means of the GPUA (2009–2016).
Sustainability 12 02593 g004
Figure 5. The evolution of the urban resilience of the GPUA in 2009, 2011, 2013, and 2015.
Sustainability 12 02593 g005
Figure 6. Relationship between urban resilience and evaluation indicators in three cities.
Sustainability 12 02593 g006
Table 1. The overview of urban resilience research.
Research PerspectiveInstitution/Author
(Year)
Analysis Conclusion
Ecological resilienceHolling (1973) [5]Resilience is the ability of an ecosystem to absorb, change, and return to a stable state when subjected to shocks and disturbances.
Gunderson
et al. (2002) [28]
Proposes an ecosystem adaptation cycle model and an evolutionary dynamic mechanism model.
Engineering resilienceWildavsky (1988) [29]Resilience is defined as the ability of the system to rebound, adapt, and return to normal levels in the event of an unexpected disaster.
Asprone et al.(2014) [30]The system is able to adapt and respond to events with fundamental damage.
Social resilienceMileti (1999) [31]Resilience means that after a natural disaster in a certain place, it is not necessary to rely on a large amount of external assistance to minimize damage and ensure basic productivity and quality of life.
Paton and
Johnston (2001) [32]
Treats resilience as a system’s ability to maintain its normal functioning and cope with challenges and changes in the face of external disturbances.
Pelling (2003) [33]Resilience is the ability of an object to handle or adapt to dangerous stress.
UNISDR (2005) [34]Resilience is a system’s ability to resist, absorb, adapt to, and recover from its effects in a timely and effective manner, including protecting and restoring its necessary infrastructure and functions.
Cutter et al. (2008) [35]Resilience is the ability of a social system to respond to and recover from disasters, including the system’s absorption of impacts and response to disaster events and post-event adaptation processes.
Brown et al. (2012) [36]Resilience emphasizes the city’s ability to block and withstand disasters and the ability of cities to recover and reorganize to achieve the lowest levels of catastrophic losses.
Economic resilienceWardekker et al. (2013) [37]A system can respond quickly to disturbances through its own characteristics and measures to reduce damage and to quickly adapt to interference and obtain recovery.
Wamsler
et al. (2013) [38]
Proposes that resilient cities should have four characteristics: To reduce current and future hazards, to reduce sensitivity to disasters, to establish disaster response mechanisms and structures, and to establish post-disaster recovery mechanisms and structures.
Wink (2014) [39]Economic resilience is expressed as the ability to avoid, resist, or adapt to crises and to respond to negative shocks and adverse conditions.
Urban resilienceLhomme
et al. (2013) [40]
Resilience is the ability of a city to absorb and recover from disasters.
American Rockefeller Foundation (2013) [41]Urban resilience index, which includes four dimensions: Health and welfare, economic and social, infrastructure and ecosystem, and leadership and strategy.
Suárez et al. (2016) [42]Diversity, modularity, tight feedback, social cohesion, and innovation are the five most important factors affecting urban resilience and serve as evaluation criteria.
Table 2. The urban index system for resilience evaluation.
Target LayerCriteria LayerIndicator LayerCodeIndicator Meaning and Attribute
Urban resilienceUrban ecological environment resilienceGreen coverage rate in built-up areas (%)A1Reflects the habitability of urban environment (+)
Per capita park green area (m2)A2Reflects the level of urban ecological vitality (+)
Per capita wastewater discharge (tons)A3Reflects the impact of pollution on the environment (-)
Urban economic level resiliencePer capita GDP (yuan)A4Macroeconomic basis reflecting the ability of the economic system to respond (+)
Financial revenue (ten thousand yuan)A5Reflects the ability of local governments to perform public service functions (+)
The actual amount of foreign investment used in the year (10,000 USD)A6Reflects the contribution of foreign capital utilization to economic growth (+)
Per capita year-end balance of urban and rural resident savings (ten thousand yuan)A7Reflects resident living standards (+)
Urban social environment resilienceNon-agricultural employment ratio (%)A8Reflects the level of urban social development (+)
Number of students in regular colleges and universities (person)A9Reflects the city’s ability to innovate (+)
Number of hospital beds per 1000 peopleA10Reflects the level of urban emergency medical care (+)
Urban infrastructure resiliencePer capita road area (m2)A11Reflects urban traffic accessibility (+)
Per capita gas supply (1000 cubic meters)A12Reflects level of living security for residents (+)
Bus number per 10,000 people (vehicles)A13Reflects the comfort of the urban transport system (+)
Per capita drainage pipe length (m)A14Reflects the resilience of urban sewage systems (+)
Proportion of international Internet users (%)A15Reflects the level of urban social system connectivity (+)
Note: The attribute of the indicator is “(+)”, which is expressed as a positive indicator. The larger the value of the indicator is, the better the resilience level. The “(-)” indicates a negative indicator. The smaller the indicator is, the better the resilience level.
Table 3. Urban distribution of the research area.
ProvinceShanxiShaanxiGansu
CityLinfen
Yuncheng
Weinan Shangluo
Yan’an
Xi’an Tongchuan Hanzhoung
Baoji Xianyang Ankang
Dingxi Pingliang Longnan
Tianshui Qingyang
RegionEasternCentralWestern
Table 4. Comprehensive evaluation of urban resilience of the Guanzhong plain urban agglomeration (GPUA) in 2009–2016.
Year20092010201120122013201420152016
City
Xi’an0.8540.8430.8780.8880.8940.9260.912 0.896
Tongchuan0.2750.2910.3160.3050.3360.3370.3220.298
Baoji0.3180.3140.3960.3800.3950.3920.3610.359
Xianyang0.3750.3260.3770.3800.3790.4010.3520.355
Weinan0.2510.2750.3380.2960.2820.2780.2470.248
Yan’an0.3540.3340.3390.3360.3700.3940.3470.297
Hanzhoung0.3060.3500.3060.3070.3250.3330.3110.308
Ankang0.2520.2590.2930.3020.3290.3400.3440.320
Shangluo0.1750.2210.2820.2270.2570.2480.2270.193
Yuncheng0.2880.2350.2990.2880.3300.3170.2760.278
Linfen0.3670.3420.3460.2880.2890.2860.2730.247
Dingxi0.1600.1900.2390.2100.2490.2570.2710.262
Tianshui0.2220.2120.2210.2380.2090.2450.2420.258
Pingliang0.2260.2260.2290.2510.2020.2700.2110.287
Qingyang0.2740.2610.2920.3020.2950.3220.2780.290
Longnan0.0830.0800.0800.1550.0710.0760.0760.104
Full regional average0.2990.2970.3270.3220.3260.3390.3160.313
Eastern Regions0.2870.2820.3210.2870.3060.3050.2740.253
Central Regions0.3970.3970.4280.4270.4430.4550.4340.423
Western Regions0.1930.1940.2120.2310.2050.2340.2150.240
Table 5. Urban resilience classification.
Grades of Urban ResilienceGrade IGrade IIGrade IIIGrade IVGrade V
Lower ResilienceLow ResilienceModerate ResilienceHigh ResilienceHigher Resilience
Comprehensive Evaluation Value of Urban Resilience<0.1600.160–0.2650.265–0.3260.326–0.401>0.401
Table 6. Correlation between urban resilience and evaluation indicators in three cities.
Xi’an SortIndicator CodeCorrelationLinfen SortIndicator CodeCorrelationLongnan SortIndicator CodeCorrelation
1A10.7674 1A100.7465 1A60.7815
2A130.7622 2A90.7402 2A90.7048
3A80.7215 3A110.7220 3A140.6739
4A90.6026 4A80.7180 4A100.6589
5A30.5724 5A10.7154 5A80.6217
6A100.5662 6A130.7151 6A10.6149
7A140.5547 7A60.6735 7A110.6003
8A120.5437 8A140.6698 8A40.5851
9A40.5364 9A50.6586 9A70.5620
10A110.5313 10A30.6389 10A150.5519
11A70.5313 11A40.6211 11A30.5477
12A150.5286 12A70.6174 12A20.5217
13A20.5252 13A120.6080 13A130.5212
14A60.5190 14A20.5896 14A50.5208
15A50.5173 15A150.5666 15A120.5003
Table 7. Correlation between urban resilience and evaluation indicators in three cities.
CityXi’anLinfenLongnan
Important indicatorsA1 A13 A8 A9 A3A10 A9 A11 A8 A1A6 A9 A14 A10 A8
Main categoryUrban social environment resilienceUrban social environment resilienceUrban infrastructure resilience
City categoryHigh resilient cityModerate resilient cityLow resilient city

