Article

Does Sustainable Corporate Governance Enhance Accounting Practice? Evidence from the Korean Market

1
College of Business Administration, Kookmin University, 77 Jeongneung-ro, Seongbuk-gu, Seoul 02707, Korea
2
College of Business Administration, Ewha Womans University, 52 Ewhayeodae-gil, Seodaemun-gu, Seoul 03750, Korea
3
Department of Business Management, The State University of New York, 119-2 Songdo Moonhwa-ro, Yeonsu-gu, Incheon 21985, Korea
4
School of Business Administration, College of Business and Economics, Chung-Ang University, 84 Heukseok-ro, Dongjak-gu, Seoul 06974, Korea
*
Author to whom correspondence should be addressed.
Sustainability 2020, 12(7), 2585; https://doi.org/10.3390/su12072585
Submission received: 20 February 2020 / Revised: 23 March 2020 / Accepted: 23 March 2020 / Published: 25 March 2020
(This article belongs to the Section Economic and Business Aspects of Sustainability)

Abstract

:
As corporate sustainability continues to improve and enhance the principles of good corporate governance, firms are exerting increasing efforts in terms of transparency and public disclosure. Transparency efforts provide information to the general public on the relationship between corporate governance and improved sustainability. The better informed shareholders are about the connection between corporate governance and sustainability, the more apparent the relationship will become over time. Prior studies assume that blockholders engage in active institutional monitoring by intervening directly in firms’ operations. In contrast, we argue that passive institutional monitoring is a more feasible governance mechanism in the Korean market owing to the market’s unique features (i.e., chaebols and pressure sensitivity). In particular, focusing on the blockholdings of the Korean National Pension Service (KNPS), we study the impact of passive monitoring on firms’ earnings quality, represented by earnings persistence, value relevance, and timeliness. The empirical evidence shows that KNPS blockholdings have a positive and significant impact on corporate earnings quality, indicating that passive blockholder monitoring is a more efficient channel for improving earnings quality in South Korea. Our results may be generalized to other emerging markets in which a few entities with concentrated economic power engender pressure-sensitive corporate landscapes for sustainability.

1. Introduction

A sound corporate governance environment is not only important for firms, but also important for society. Decent corporate governance improves the public’s faith and confidence in its corporate leaders. Legislative processes are designed to protect societies from known threats and to prevent problems from occurring or reoccurring. Recent corporate scandals have shed light on the effect that corporations have on social responsibility. The new focus on corporate social responsibility increases corporations’ responsibility and accountability to their stakeholders. Hence, firms have increasingly placed pressure on themselves to improve best practices for corporate governance with the goal of enhancing their relationships with stakeholders, among which they have made more effort with large institutional investors.
Although the literature largely substantiates the institutional monitoring effect in Korea [1,2,3,4,5,6], the channel through which blockholders, that is, institutional investors with large shareholdings in firms, affect managerial behavior requires further consideration. Previous studies mainly assume that Korean blockholders actively participate in institutional monitoring. In other words, they assume that blockholders directly intervene in a firm’s operations and put pressure on its executives and board of directors. However, considering the local characteristics of the Korean market, we believe that passive institutional monitoring, through which blockholders affect managerial behavior by trading their shares and adjusting the firm’s stock price, is a more viable governance mechanism in that market.
The feasibility of passive monitoring is driven primarily by the “pressure sensitivity” of institutional investors and firms in Korea. Brickley et al. [7] and Almazan et al. [8] decompose a sample of institutional investors into pressure-sensitive and pressure-insensitive institutions. They posit that pressure-sensitive institutions, such as banks and insurance firms, are prone to having business ties with investee firms and, thus, are susceptible to colluding with incumbent executives to maintain business connections. On the contrary, pressure-insensitive institutions, such as mutual funds and independent investment advisors, are relatively unlikely to be constrained by business ties and, thus, can actively monitor managerial behavior. In this context, the disparate degrees of pressure sensitivity in different financial markets imply that the viability of active or passive monitoring differs in each market.
The predominance of chaebols (i.e., Korean family-oriented business conglomerates) and their affiliates in the Korean market increases the pressure sensitivity of institutional investors and companies in that market. Chaebols own many financial and non-financial corporations in Korea. Because chaebols are mainly controlled by family members, their firms are vulnerable to poor corporate governance and self-interested managerial behavior, which creates information asymmetry and agency issues. Thus, active monitoring by blockholders is deterred in the Korean market. In this context, we postulate that passive institutional monitoring drives institutional monitoring in Korea to a large extent.
In particular, we examine the influence of passive monitoring on firms’ earnings quality relative to that of non-passive monitoring using a sample of 1432 firm-year observations for the period from 2009 to 2014. The experiences of emerging economies as well as recent financial crises and high-profile corporate scandals in advanced economies have shed light on earnings quality and corporate governance issues. Low earnings quality may diminish investor confidence in financial reports [9,10]. Because the Korean financial market is dominated by chaebols, which have high information asymmetry, reported earnings are susceptible to managerial opportunism. In this context, companies must implement efficient monitoring processes when they have substantial stakes in external entities. Accordingly, we anticipate that the presence of passive institutional monitoring improves firms’ earnings quality in Korea. Here, we measure earnings quality using earnings persistence, value relevance, and timeliness.
In particular, as a proxy for passive blockholder monitoring, we focus on the blockholdings of the Korean National Pension Service (KNPS). We posit that the KNPS is more likely to guide managers to expect a sell-off when their firm’s fundamental value declines than to actively and directly discipline them. Owing to this anticipated “threat of exit,” managers are encouraged to align their management behaviors with shareholders’ interests.
We believe that this passive monitoring channel used by the KNPS for its blockholdings is viable for three reasons. First, the KNPS is Korea’s largest institutional blockholder and the world’s third largest pension fund, with a total of 512 trillion Korean won (US $434 billion) under management as of 2016. The KNPS’s domestic equity investment totals 96 trillion KRW (US $81). Thus, its influence and investment impact on firms, if any, should be the largest among all investors.
Second, the KNPS did not actively cast its shareholder votes until July 2018, when its stewardship code was established and released. When chaebols occasionally exert influence over the government-related National Pension Fund, which is run by the KNPS, to support their claims, the KNPS instead leverages another type of affiliation: political ties. In 2015, the KNPS advocated for the merger between Samsung C&T and Cheil Industries even though this merger was unfavorable to Samsung C&T’s shareholders and the KNPS was its main blockholder. It turns out that the incumbent at that time helped the KNPS’s investment management department so as to assist Lee Jae-Yong, Samsung’s de facto heir, in buying Samsung C&T stocks at a favorable price, which proved to be damaging to other minority shareholders. The individuals directly related to this matter are currently on trial. This case illustrates that even Korea’s largest institutional blockholder, the KNPS, has not actively engaged in corporate governance in the interest of its beneficiaries given the pressure-sensitive investment context of the Korean market.
Lastly, our use of the KNPS’s blockholdings as a proxy variable for passive blockholder monitoring is based on Korea’s institutional background. Thus, the issue of the subjective identification of active and passive institutional blockholders, which arises in previous studies that use types of institutions or institutions’ investment horizons to define blockholders, is not a concern here.
Our empirical results mainly support our hypotheses. We discover that the KNPS’s blockholdings positively and significantly affect the three earnings attributes, implying that the impact of blockholders on earnings attributes is driven primarily by the passive monitoring channel. We conduct two additional tests to incorporate unique features of the Korean market.
First, we incorporate the distinct degrees of information opacity and share liquidity of Korean firms by sorting them based on R&D expenses and share turnover. Because the Korean market is influenced by chaebols, which exhibit elevated information asymmetry and pressure sensitivity, we expect to observe strong passive institutional monitoring of informationally opaque companies. Blockholders face a tradeoff between liquidity and control because their ownership of a large proportion of a firm’s equity prevents them from readily selling their holdings when the shares are illiquid. Thus, institutional blockholders in less liquid firms face liquidity hurdles when they vote with their feet. Hence, we hypothesize that the KNPS’s blockholdings are more (less) likely to exert monitoring efforts for firms with low (high) values of Amihud’s [11] illiquidity ratio. The statistically significant results verify our hypotheses, demonstrating that the KNPS’s blockholdings improve all three earnings quality characteristics for firms with elevated information asymmetry and liquidity sharing.
Second, we include a dummy variable indicating whether a firm is a chaebol affiliate in our regressions to analyze the effect of each institutional subgroup’s monitoring on chaebols and their associates. We anticipate that the effectiveness of passive institutional monitoring is most evident for chaebol affiliates, and our results confirm its efficacy with respect to the earnings attributes. As a robustness check, we apply an instrumental variable approach to address the reverse causality concern and, again, find that passive monitoring by blockholders improves all three earnings attributes.
Overall, the findings of this study are in line with the idea that the largest attraction for firms to direct some of their attention to sustainability is that it ultimately improves corporations’ ability to thrive and prosper. In particular, this study contributes to the literature by identifying the precise blockholder monitoring channel that improves corporate earnings quality in Korea. The study contains empirical evidence verifying the prevalent passive institutional monitoring in this setting. Our findings are unique and differ from the finding in the US market that passive blockholders with high portfolio turnover rates are short term-focused and induce managerial myopia [12,13]. We assume that this difference arises from Korea’s unique institutional context, in which shareholder activism is generally subdued. This finding highlights that the assumptions of existing theories derived from analyses of developed economies may not be valid for emerging economies owing to differences in regional institutions [14,15]. We also believe that our results have significant implications for other emerging markets, where a small number of entities with concentrated economic power are influential, markets are inefficient, government-related organizations are important economic players, and network-based behaviors are prevalent [14,15].
The remainder of this paper is organized as follows. Section 2 discusses the interaction between passive institutional monitoring and the idiosyncrasies of the Korean financial market. We also review various related studies in this section. Section 3 describes the construction of the sample and presents the key variables and descriptive statistics. Section 4 presents the main empirical analysis and additional tests. Section 5 concludes the paper.

2. Institutional Background and Related Literature

2.1. “Passive” Institutional Monitoring Channel and the Chaebol-Dominated Korean Market

In classical studies, blockholders participate in firm-level governance by intervening directly in a firm’s operations. This process is referred to as active institutional monitoring, or “voice” [16,17,18,19,20]. Such monitoring includes any action that an institutional investor may take to boost a firm’s fundamental value that is costly to the investor. Direct intervention can be especially difficult when a manager uses corporate resources to alter shareholders’ decisions in the manager’s favor and when pressure sensitivity prevails in the market. Institutional investors and firms in Korea are likely to be pressure-sensitive owing to the predominance of chaebols. The Korea Fair Trade Commission states that there are 61 chaebol enterprises, including Samsung, Hyundai, LG, and Lotte, with 1606 subsidiaries as of April 2015. According to the Korea Exchange (KRX), the total market capitalization of chaebols exceeds 2258 trillion KRW, and the ten largest chaebol-affiliated firms comprise more than 50% of the KRX’s total market capitalization. This amount is a rather sizable share of the entire market capitalization of KRX-indexed corporations.
For decades, leading Korean companies have received substantial governmental benefits and subsidies as part of Korea’s economic growth strategy [21]. These leading companies now dominate Korea’s corporate environment. Family members who control chaebols are likely to exercise considerable authority in corporate management and are likely to engage in selfish behavior that may damage outside shareholders’ interests. The managers and dependent board members of these firms are vulnerable to poor (voluntary) corporate disclosure and infringements of accounting regulations and other laws, adding to these firms’ information asymmetry.
The literature presents evidence of caveats for chaebol-affiliated firms in terms of corporate governance. Chang and Hong [21] point out that such companies are generally controlled by owner-managers and interconnected through internal business, cross-debt guarantees, and reciprocal shareholdings. Chang [22] states that these companies’ boards are mainly made up of close associates of the chaebol families, eroding the transparency of their decision-making. Such close business ties and weak governance enable managers to implement unwarranted measures to the detriment of other shareholders. Bae et al. [23] claim that to gain profit from acquisitions, the controlling shareholders of chaebol-affiliated companies allocate resources to certain affiliated targets while sacrificing minority shareholders. Baek et al. [24] reveal that chaebol issuers of equity-linked private securities grant controlling shareholders favorable offering prices when the issues are intragroup deals.
Under these circumstances of poor corporate governance, independent institutional investors may mitigate the potential for managerial rent extraction. However, some chaebols have institutional investors of their own. Major Korean conglomerates, such as Samsung, Hyundai Motors, SK, and Hanwha, are affiliated with their own securities companies. These firms’ equity analysts are supposed to provide reliable information on their investee firms. However, the close business ties between investors and investees imply a potential conflict of interest, undermining the credibility of these analysts’ reports. Foreign analysts are more likely to offer sell recommendations than domestic analysts are. However, this difference is not material, and both types of analysts usually offer buy recommendations, especially for chaebol-affiliated firms. A South Korean financial data provider, FnGuide, reports that of the 120,000 to 130,000 equity analysts’ reports released by domestic securities companies from 2008 to 2013, fewer than 5 are sell reports, indicating substantial pressure sensitivity in the Korean financial market. Taken together, the predominance of chaebols, the business and political ties among major stakeholders, and the resulting pressure sensitivity weaken the idea that active institutional monitoring is possible in Korea.
Although empirical evidence confirms the existence of an institutional monitoring effect on earnings quality in Korea [1,2,3,4,5,6], we believe that blockholders in Korea influence managerial decision-making regarding firms’ operations through passive monitoring rather than direct intervention. Edmans [25] and Admati and Pfleiderer [26] claim that even when large institutional investors are unable to intervene in firms’ activities and can only sell their stakes or threaten to do so (“threat of exit”), these investors may influence managerial behavior. This alternative form of monitoring is known as passive monitoring, or “exit.” Because huge institutional shareholdings usually exhibit lengthy investment horizons and low liquidities, blockholders are incentivized to engage in costly monitoring to gather private information about a firm’s fundamental value. By trading their shares, blockholders can support or discipline current management and influence the firm’s stock price. The prevalence of equity-based compensation and the sensitivity of executive turnover to stock prices [27,28] induce managers’ responsiveness to stock prices.
For instance, when a firm announces weak earnings in a period, blockholders bear the cost of searching for information to determine whether these sluggish earnings are due to poor corporate quality or long-term investments. If low quality engenders weak earnings, blockholders may anticipate a diminished long-term firm value and, thus, may profit by selling their stakes in that firm. These sales depress the firm’s stock price, thereby disciplining the firm’s manager ex post. If long-term investments temporarily reduce earnings, blockholders may not sell their shares but rather may expect improved long-term value from their investments, mitigating the stock price decline. Such trading restrains myopic investment behavior (“managerial myopia”) and enables blockholders to impound their private information gained from monitoring into the share price, incorporating fundamental value rather than periodic earnings and boosting market efficiency. “Managerial myopia” refers to underinvestment in long-term, intangible projects, such as R&D, marketing, and personnel training, in favor of meeting short-term goals [12,29]. For example, because International Financial Reporting Standards accounting rules mandate that research costs be expensed in the income statement, managers may be induced to reduce R&D spending to preserve periodic earnings growth [29,30,31]. However, because blockholders have the skills and resources to gather private information and analyze the numbers in financial statements, they can sell their stakes if periodic earnings are not supported by a firm’s solid fundamentals [25]. The notion of passive monitoring departs from prior studies, which assert that blockholders exacerbate managerial myopia [29,31,32]. Moreover, passive monitoring costs are lower than active monitoring costs because passive monitoring does not involve public blockholders’ actions, such as engaging in proxy fights or pressuring boards.
Our departure from the classical studies, which assume that direct institutional intervention is possible, is empirically motivated by the specific characteristics of the Korean market. Because pressure-sensitive institutions and chaebol-affiliated firms are pervasive in Korea, we contend that blockholders in Korea influence corporate decision-making through passive monitoring.

2.2. Other Related Studies

The literature largely finds a positive association between institutional investors and accounting earnings quality [33,34,35,36]. However, few studies have examined the impact of institutional oversight on earnings quality in Korea. The literature presents conflicting arguments on the respective effects of domestic and foreign institutional monitoring on earnings quality in Korea. Cheon [2], Kim and Yoon [4], and Lel [5] argue that foreign institutional monitoring is an effective mechanism in restraining corporate earnings management. In contrast, Kim et al. [3], Byun and Lee [1], and Liu et al. [6] argue for the effectiveness of domestic institutional monitoring.
This study revisits the question of institutional monitoring of earnings quality in Korea because prior studies have various shortcomings. Unlike the works of Kim et al. [3], Kim and Yoon [4], and Lel [5], we focus on institutional investors who own 5% or more of a firm’s shares because substantial ownership stakes are likely to induce institutions to engage in monitoring. Kim et al. [3], Kim and Yoon [4], and Lel [5] do not reflect the heterogeneity of institutional investors but rather use aggregate institutional ownership as a proxy for institutional monitoring incentives. This choice is questionable because not all institutions have equal incentives and put forth equal efforts into monitoring managers [37]. We also decompose institutional ownership into subgroups based on portfolio turnover and nationality to incorporate the disparate effects of each type of blockholder. In addition, our sample period, 2005 to 2014, is more current and relevant than those used by Kim and Yoon [4] and Kim et al. [3] in terms of institutional monitoring. Kim and Yoon [4] use a sample period from 1995 to 2003, during which institutional blockholders did not critically affect corporate governance in Korea according to the Korea Corporate Governance Service (equivalent to the Institutional Shareholder Service in the U.S.), which states that the largest institutional investor in Korea, the National Pension Fund, only actively exercised its voting rights starting in 2006. Similarly, Kim et al. [3] use a sample period from 2001 to 2013 and use questionable aggregate institutional ownership data after 2004 owing to a policy change in that year. Since 2004, the Financial Supervisory Service, a regulatory institution in Korea, has required only investors with 5% or more ownership in a firm to report their holdings. Unlike Kim et al. [3] and Lel [5], who consider international settings, we focus solely on the Korean market to reflect its unique features (i.e., the predominance of chaebols), which pose a distinct challenge for institutional monitoring. Moreover, unlike Byun and Lee [1], we mitigate endogeneity (reverse causality) concerns by applying a lead–lag setup and by adopting an instrumental variable approach. Byun and Lee’s [1] results may be subject to endogeneity issues because they examine the contemporaneous association between earnings management and blockholder ownership. Additionally, we use a more extensive sample than Kim and Yoon [4] and Byun and Lee [1] use. Lastly, we verify that passive institutional monitoring is pervasive in Korea, whereas Liu et al. [6] are uncertain about which monitoring channel prevails aside from the proximity advantage.
Furthermore, we utilize earnings persistence, value relevance, and timeliness to examine the association between institutional monitoring and earnings quality from a different perspective because, as per Kothari et al. [38], prior studies largely focus on discretionary accruals [33,34,35,36]. Because all three earnings attributes are desirable, we expect passive-monitoring blockholders to be most efficient in improving these earnings characteristics owing to the more implicit nature and lower costs of passive monitoring.

3. Sample and Key Variables
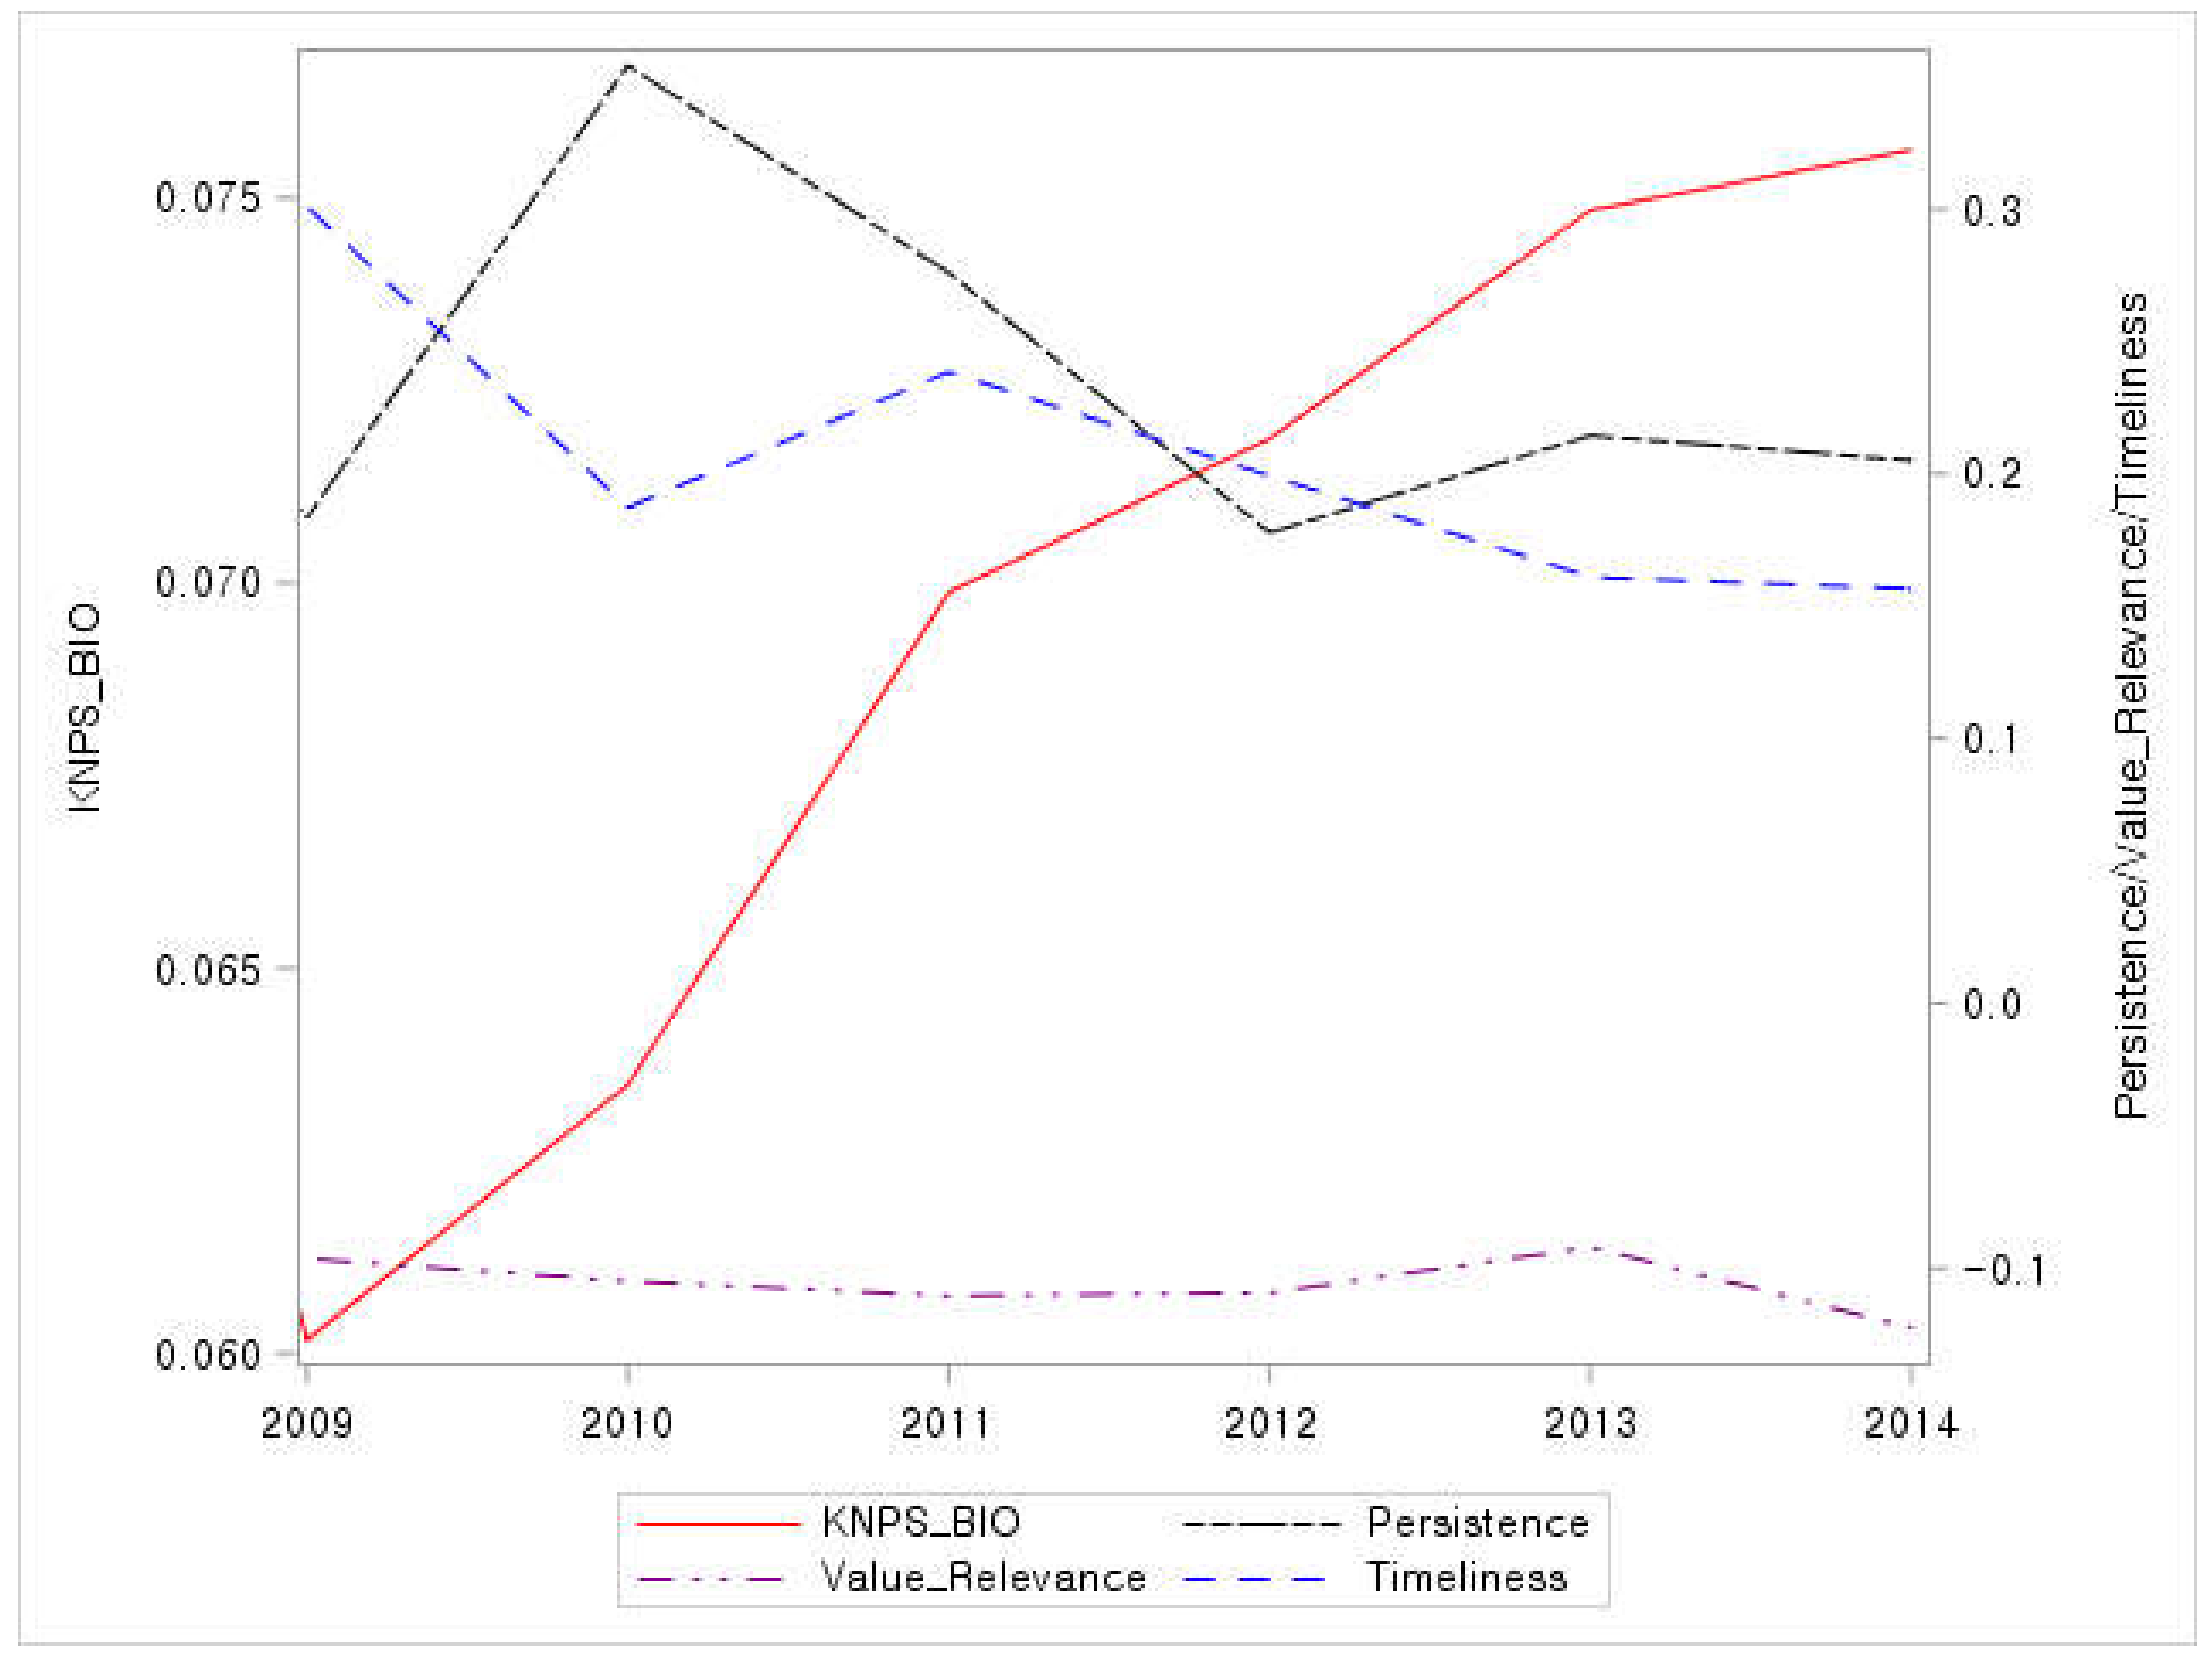
We design our sample dataset by examining the 200 largest firms listed on the KRX for the period from 2009 to 2014. In particular, we obtain financial information on these firms from Data Guide Pro, which is produced by a South Korean financial data provider, FnGuide. Data Guide Pro contains a wide range of financial data, is similar to the Compustat database for the U.S. FnOwnership (which is also managed by FnGuide), and offers the ownership data used to determine each company’s blockholders in this study. Since 2004, Korean legislation has mandated that any blockholder possessing 5% or more of a firm’s shares in the Korean market must submit a report detailing all of its equity positions to the Financial Supervisory Service, which is equivalent to the U.S. Securities and Exchange Commission. These mandatory filings are compiled by FnGuide, which then gathers ownership information on shareholders that own at least 5% of a firm’s outstanding shares. Owing to these disclosure requirements, we incorporate in our sample only those firms for which the KNPS holds 5% or more of shares outstanding. The sample comprises 1432 Korean firm-year observations from 2009 to 2014.
Following Chen et al. [37], we define the variable KNPS_BIO as KNPS blockholdings that include 5% or more of a firm’s outstanding shares. The 5% level triggers disclosure requirements in Korea, and blockholders’ sizable stakes incentivize them to bear the cost of monitoring managerial behavior. The large shareholdings (5% of more) and low liquidities of blockholders render them long-term investors, thus motivating them to vigilantly monitor firms’ fundamental values. According to Edmans [25] and Admati and Pfleiderer [26], the main mechanisms used to motivate or discipline managers within passive institutional monitoring are stock trading and the threat of selling off shares. We obtain data for KNPS_BIO at the most recent quarter-end, prior to the period over which the three accounting earnings attributes are estimated. For example, the proxies for the accounting earnings attributes estimated over the fiscal period from May 2009 to April 2010 are linked to blockholders’ ownership at the end of March 2009.
We also compute three proxies that represent earnings persistence (Persistence), value relevance (ValueRelevance), and timeliness (Timeliness). Earnings persistence is the stability of current net income going forward. Persistent earnings reflect a firm’s fundamental value and, thus, are more desirable than transitory earnings [39,40]. We compute the earnings persistence measure as the estimated regression coefficient (Φ1,i) derived from an autoregressive model of order one on earnings per share, following Ali and Zarowin [41] and Francis et al. [42].
To control for the size effect, Xi,t denotes earnings per share, which are computed as the ratio of firm i’s net income in year t to its weighted average number of outstanding shares in year t. Using time series data on earnings per share from year t-4 to year t, we derive the earnings persistence coefficient (Φ1,i) for each firm-year by rolling the sample period forward by each year. This coefficient (Φ1,i) is a proxy for earnings persistence. The degree of persistent earnings is greater when the proxy’s estimated value is closer to one. However, a value closer to zero implies a higher degree of transitory earnings. Thus, a larger estimated value of this coefficient (Φ1,i) represents stronger earnings persistence.
X i , t = 0 . i + 1 , i X i , t 1 +   v i , t Persistence = 1 , i
Value relevance refers to the explanatory power of accounting earnings over the variation in stock returns [43,44,45,46]. We measure the degree of value relevance following the work of Cheng and Subramanyam [47]. Similar to Gu [48], they measure the extent to which accounting earnings explain excess returns during a fiscal year, and they use this value as a proxy for value relevance.
We set up the regression model as follows:
ARET i , t = b 0 + b 1 NI i , t + b 2 LOSS i , t + b 3 NI i , t × LOSS i , t + b 4 Δ NI i , t + e i , t ,
where ARETi,t, denotes the cumulative market-adjusted excess return of firm i in year t, NIi,t, is the ratio of the net income of firm i in year t to the market value of equity at the end of year t-1, LOSSi,t is a dummy variable equal to one if the net income of firm i in year t is less than zero (NIi,t, < 0) and equal to zero otherwise, and ΔNIi,t is the ratio of the change in the net income of firm i in year t to the market value of equity at the end of year t-1. After setting up the model, we run a cross-sectional analysis in which we first derive the residual error for each firm-year and then multiply the square of the residual by -1. We use this measure as a proxy for value relevance. Greater value relevance implies that the stock price reflects accounting earnings information over a fiscal period more rapidly, suggesting superior corporate disclosure.
ValueRelevance = ARET i , t ARET i , t ^ 2
Timeliness measures the degree to which accounting profits simultaneously reflect a corporation’s economic benefits (stock returns). Ball et al. [49] claim that accounting profits should measure economic benefits, which are defined as the variation in the market value of equity. Stock returns are used to measure the degree of timeliness. Timeliness represents the explanatory power of the reverse regression to that designed to analyze the impact of accounting earnings on the rate of return. We measure timeliness using the following regression model:
EARN j , t = α 0 . i + α 1 , i NET i , t + β 1 , i RET i , t + β 2 , i NET i , t × RET i , t + ε i , t ,
where EARNi,t is the ratio of the net income of firm i in year t to the market value at the end of year t-1, NETi,t, is a dummy variable that equals one if RETi,t, < 0 and equals zero otherwise, and RETi,t, denotes the 15-month rate of return of firm i from the beginning of year t to the end of March in year t+1. Applying time series data from year t-4 to year t, we compute the adjusted R2 of this reverse regression. By rolling the regression forward for each year of the sample period, we derive the adjusted R2 of the regression by firm-year, which we use as a proxy for timeliness [49,50]. In other words, if the explanatory power of the variation in stock returns over the variation in earnings is large, then the stock price promptly reflects accounting earnings.
Timeliness = adjusted   R i , t 2 .
To evaluate the incremental impact of each subgroup of blockholders on various earnings attributes, we use other relevant factors as control variables. Becker et al. [51], DeFond and Park [52], and Roychowdhury [36] state that a company’s total assets (Asset) are related to its earnings management practices, which affect earnings quality. We compute Assett as the natural logarithm of the total assets of firm i in year t. According to Chung et al. [33] and Kim et al. [3], the financial leverage (DOE) of a firm also affects its earnings quality. Dichev and Skinner [53] even assert that leveraged firms are likely to adjust their reported earnings to ward off debt covenant violations. Our DOEt calculation divides the total debt of firm i in year t by its market value of equity (i.e., common shares outstanding multiplied by the stock price) in that year. Ayers et al. [54] and Kim et al. [3] incorporate proxies for profitability, growth prospects, and the volatility of sales and cash flows as control variables when examining ties with earnings management. Becker et al. [51] and Dechow et al. [55] show that cash flow performance and earnings management have a negative association.
We calculate the return on assets (ROAt) by dividing firm i’s earnings before interest and tax (EBIT) by its total assets in year t. The market-to-book-value ratio (MBt) is the sum of the market value of equity, long-term debt, and short-term debt divided by total assets for firm i in year t. Growth in sales (Sales_Gt) for firm i is sales in year t divided by sales in year t−1 minus 1. SD_Salest and SD_OCFt are the standard deviations of sales scaled by total assets and of operating cash flows scaled by total assets, respectively, for firm i during years t-4 to t. Ayers et al. [54] and Kim et al. [3] state that companies that have severe information asymmetry are sensitive to profit management. Helwege and Liang [56] find that older firms exhibit less extreme information asymmetry. Firm_Aget is the natural logarithm of the number of years since firm i was founded. Barth and Kasznik [57] and Barth et al. [43] use R&D expenses as a proxy for the presence of intangible assets, which are related to high information opacity. RND_Expt is R&D expenditures divided by sales for firm i in year t. The definitions of the control variables are provided in Appendix A.
After we incorporate KNPS blockholdings, earnings attribute proxies, and the control variables for firm characteristics into our dataset, we conduct an empirical analysis with a sample of 1432 firm-year observations for non-financial corporations for the period from 2009 to 2014. Descriptive statistics of the sample used in our study are provided in Table 1. We find that, on average, KNPS blockholdings account for approximately 7.11% of these firms’ total shares outstanding. These results demonstrate the importance of restricting institutional ownership to large-scale shareholdings, as only significant positions can encourage monitoring by blockholders. The standard deviation of KNPS_BIO is 1.92%, revealing that this variable displays adequate variation in this sample. In addition, Passive_BO has a mean of 1.4%, and Non_Passive_BO has a mean of 1.9%. Moreover, we find that all the proxies for accounting earnings attributes are sufficiently distributed, indicating adequate variation in the sample. Thus, the quality of Korean firms’ reported earnings may vary significantly across firms. This setting validates the need for an effective corporate governance mechanism, such as institutional monitoring.
Figure 1 presents the yearly cross-sectional average of KNPS_BIO and the three earnings attributes for the sample period. The red line represents KNPS_BIO, and it indicates that KNPS blockholdings have persistently increased over the preceding years, suggesting that the influence of these blockholdings on firms has also become increasingly important. Our analyses in this study focus on the relation between KNPS blockholdings and future corporate governance quality to consider the time that it takes for institutional monitoring to influence a managerial decision and for governance improvements to materialize. Figure 1 does not clearly indicate that the quality of corporate earnings tends to comove with KNPS_BIO. However, it only shows the relation at the aggregate level. Hence, an investigation of the causal relation at the firm level is needed.

4. Results

The table in Appendix B presents Pearson’s (contemporaneous) correlation coefficients for the lagged blockholder ownership subgroups and the accounting earnings attribute variables. We find that the three earnings attributes are significantly and positively correlated with KNPS_BIO, implying that a large fraction of reported earnings is likely to be sustained going forward for firms with high KNPS blockholdings. This finding also indicates that passive institutional monitors may improve the extent to which accounting earnings reflect a firm’s fundamental value because value relevance indicates how well reported earnings explain stock returns, and passive monitoring induces the stock price to reflect the firm’s value. Furthermore, the findings are consistent with our hypothesis that passive institutional monitoring prevails in Korea. Although the table provides insight into the interaction between KNPS blockholdings and accounting earnings attributes, it does not allow us to establish causal links because the correlations are contemporaneous. Given that corporate financial statements are audited and disclosed after the end of the fiscal year, we posit that institutional monitoring takes time to impact a company’s accounting quality. Thus, we further examine the relationship between lagged KNPS blockholdings and the accounting earnings attributes in the subsequent tests.
We apply a Fama–MacBeth cross-sectional regression to evaluate the incremental effect of KNPS blockholdings on each earnings attribute. This multivariate setting allows us to control for additional factors that may affect accounting earnings quality. We incorporate a dummy variable (Index_D) that equals one if a firm’s stock is included in the Korea Composite Stock Price Index (KOSPI) 200 and equals zero otherwise. Compared with non-constituent firms, KOSPI 200 firms generally have large market capitalizations and are affiliated with chaebols, which have high information asymmetry [58]. Thus, corporate governance and earnings quality may be more important for investors in KOSPI 200 firms.
Panel A of Table 2 presents the coefficient estimates derived from the cross-sectional model of Fama and MacBeth [59]. Only 1214 firm-year observations for the sample period from 2009 to 2014 are incorporated into the tests owing to use of lagged independent variables. The results are shown in Table 2, Table 3, Table 4 and Table 5. We also adjust the pertinent t-statistics for Newey–West [60] autocorrelations with three lags in all tests that utilize Fama and MacBeth’s [59] approach.
The coefficient of KNPS_BIO is positive and statistically significant at the 5% level when Persistence is the dependent variable. This result indicates that firms with larger KNPS blockholdings generally have higher earnings persistence. The control variables largely exhibit significant associations with Persistence, consistent with the results of prior studies. For instance, Persistence is positively and significantly associated with Asset [42] and negatively and significantly associated with SD_Sales [61] and SD_OCF [62].
When ValueRelevance is the dependent variable, we find that the coefficient of KNPS_BIO is positive and statistically significant at the 1% level. This result suggests that the earnings of firms with larger KNPS blockholdings are more likely to be promptly reflected in firms’ stock prices within a fiscal period, suggesting that these companies have a greater quality of corporate disclosure. The control variables generally have significant correlations with ValueRelevance.
In the regression analysis of Timeliness on KNPS_BIO, the coefficient of KNPS_BIO is also statistically significant. Thus, the results are consistent with our hypothesis that passive blockholder monitoring by the KNPS is a more effective channel for improving earnings quality in Korea. In addition, we estimate the models in Table 2 based on Petersen’s [63] bi-directional clustered standard errors considering both time-series and cross-sectional correlations. Panel B reports the results, which are consistent with those in Panel A, corroborating our hypothesis.
Our baseline results are largely in line with our hypothesis that blockholders’ passive monitoring significantly improves earnings quality, which is reflected by earnings persistence, value relevance, and timeliness. To examine whether our findings hold true in the specific settings that render the Korean market unique, we conduct two additional tests. First, we examine the effects of disparate degrees of information opacity on the results of regressing each earnings attribute on lagged KNPS blockholdings. Because chaebol-affiliated firms exhibit high information asymmetry owing to deficient corporate governance and because they dominate the Korean corporate landscape, we anticipate that passive monitoring has a more pronounced impact for firms with higher information opacity.
Specifically, we posit that firms with higher R&D expenditures (RND_Exp) obtain a larger share of their company values from intangibles. As a result, more R&D-intensive firms are more likely to manufacture unique products, increasing information opacity between executives and outside shareholders [64,65]. We therefore use RND_Exp as a proxy for the degree of information asymmetry, sort the firms in our sample into two groups in each year based on the median value of RND_Exp, and regress each earnings attribute on the subgroups of lagged KNPS blockholdings. Panel A in Table 3 displays the regression results for companies with both high and low information ambiguity. In Panel A, we find that KNPS_BIO has positive and significant associations with the three earnings attributes. However, the results for firms with low information opacity do not indicate a statistically significant relationship between KNPS_BIO and the three earnings attributes. This finding aligns with our conjecture that passive institutional monitoring has a greater influence on firms with higher information asymmetry.
Panel B of Table 3 displays the results of regressions of earnings attributes on subgroups of lagged KNPS blockholdings based on share liquidity. The analysis shown in Panel B considers institutional blockholders’ monitoring incentives in relation to their tradeoffs between liquidity and control. Owing to their large shareholdings in investee firms, institutional blockholders inherently face liquidity hurdles to “voting with their feet” when they are dissatisfied with firm management [66]. Accordingly, we hypothesize that the KNPS is more (less) likely to exert passive monitoring efforts for high (low) liquidity firms. To examine this hypothesis, we use Amihud’s [11] illiquidity ratio to proxy for a company’s liquidity level. Specifically, by using the daily stock returns and trading volumes that the KRX provides, we compute the yearly average of daily Amihud’s illiquidity ratios as
Amihud i = d = 1 t r i , d Vol i , d D i ,
where r i , d is the return of stock i on day d, Vol i , d is the dollar value of the trading volume of stock i on day d, and D i is the number of trading days in a year. In each year, we partition firms into two groups based on the median illiquidity ratio and repeat the main analysis for the firms with high and low illiquidity ratios.
Panel B of Table 3 reports the results of this analysis. The low (high) liquidity subsample includes firms with high (low) Amihud’s illiquidity ratios. We find that KNPS blockholdings serve as more effective monitors in high liquidity environments. For instance, the relationships between KNPS_BIO and the three earnings attributes are positive and statistically significant at the 5% level or higher only for high liquidity firms. This relationship does not hold for low liquidity firms. Thus, these results provide additional insight into institutions’ tensions between monitoring and speculation; passive institutional blockholders are more likely to serve as indirect firm monitors when facing low liquidity costs.
Next, we specifically examine the effect of lagged KNPS blockholdings on earnings attributes for chaebol firms. Chaebols’ weak internal governance can cause information asymmetry between managers and external shareholders. We include a dummy variable that indicates whether a firm is chaebol-affiliated (Chaebol_Dummy) as well as the interaction between lagged KNPS blockholdings and the chaebol dummy. We use the annual classification of the Korea Fair Trade Commission to define firms as chaebol affiliates or non-chaebol affiliates.
Table 4 presents the pertinent findings. We find that chaebol affiliates, designated by Chaebol_Dummy, show a positive and significant association with Persistence at the 5% level. This outcome is perfectly understandable because chaebols and their affiliates usually run huge businesses with sustainable business models and, thus, have higher earnings persistence than relatively small businesses have. Notably, we find that the coefficient of the mutual interaction between the chaebol dummy and KNPS_BIO is positive and statistically significant when Persistence, ValueRelevance, and Timeliness are the dependent variables, whereas the other interaction terms have no statistically significant effects. This outcome substantiates our hypothesis that passive monitoring by blockholders improves earnings quality for chaebols.
For a robustness check, we use an instrumental variable approach akin to that of Appel et al. [67] to mitigate the reverse causality issue. They examine the impact of passive institutional investors on corporate governance by testing investors’ shareholdings in a subset of Russell 1000 and 2000 stocks. They develop the fascinating argument that the bottom 250 stocks in the Russell 1000 and the top 250 stocks in the Russell 2000 are alike with regard to certain firm characteristics (i.e., market capitalization) but are different in terms of institutional ownership because of value-weighted index tracking. Their study posits that institutional investors benchmarking the Russell 2000 (1000) place a larger (smaller) weight on the top (bottom) stocks in the Russell 2000 (1000), indicating exogenous variation in institutional shareholdings between the two groups of stocks. We similarly utilize the KOSPI 100 and 200 in our analysis. KOSPI 200 companies are usually larger and more likely to be chaebol-affiliated than non-KOSPI 200 companies are, and, thus, weak internal governance is likely to concern outside shareholders. Because the KOSPI 100 includes the largest 100 stocks in the KOSPI 200, institutional investors tracking the two indices place a greater weight on KOSPI 100 stocks than on other stocks. This weighting results in a discrepancy between the institutional shareholdings of the two groups of stocks that is not attributable to differences in the institutions’ portfolio turnovers or nationalities.
In this context, we evaluate the influence of each subgroup of lagged KNPS blockholdings on each earnings attribute for stocks in the KOSPI 100 and 200. We exclude Index_D from this test because we only focus on KOSPI 200 firms. Following Appel et al. [67], we compute each lagged instrumented KNPS blockholding as follows:
KNPS _ BIO _ IV i , t =   α +   β 1 KOSPI 100 i , t + β 2 Log MarkCap i , t +   β 3 Year   Dummy i , t + ε i , t , .
where KOSPI100i,t is a dummy variable that equals one if firm i belongs to the KOSPI 100 in reconstitution year t (i.e., from mid-June in year t to mid-June in year t+1). Log(MarkCap)i,t is the natural logarithm of the average daily market capitalization over the year prior to the end of April in year t; this variable assumes that reconstitutions of the KOSPI 100 are based on market capitalization. We measure the corresponding KNPS blockholdings for firm i at the end of September in year t. For the instrumental variable for lagged KNPS blockholdings, we use the predictive value of the regression equation above. In particular, we link the quarterly instrumented KNPS blockholdings in September of each year to the proxy for each earnings attribute in the following fiscal year. Then, we re-run the regression analysis shown in Table 2 and present the pertinent findings in Table 5. Again, we find that the passive monitoring of domestic blockholders improves all three earnings attributes with statistical significance, corroborating the effectiveness of passive monitoring by the KNPS for firms in the Korean market.

5. Conclusions

Firms that recognize that their business impacts the environment around them create an innate sense of accountability to their societies. Sustainability takes into account a strong concern for the future. Hence, the sustainable operation of a firm is in the best interests of social responsibility and innovation as the firm and society will see evidence of that impact now and in the future. In particular, large stakeholders such as institutional blockholders appreciate the effort that firms make to facilitate sound and reliable corporate governance systems. Sound corporate governance ultimately fosters sustainability, creates sustainable values, and helps firms achieve their values. Firms also realize long-term benefits, including reducing risks, attracting new investors and shareholders, and increasing their equity. Thus, more firms have tried to find ways to implement trustworthy and transparent accounting reporting practice since it provides the benefit of positive impacts for their efforts.
In particular, the recent financial crises highlighting the importance of earnings quality and the inherent agency problem between managers and outside shareholders both imply a need for a corporate governance mechanism to prevent the qualitative deterioration of reported earnings. Although existing studies largely agree that institutional monitoring is effective in this context, they present distinct arguments regarding the monitoring channel used by institutional investors. Using data from Korea, where chaebols dominate the corporate landscape and exhibit high pressure sensitivity and information asymmetry, we provide empirical evidence that blockholders that perform passive monitoring are most effective in improving firms’ earnings quality, which is represented by earnings persistence, value relevance, and timeliness. In particular, we find that lagged KNPS blockholdings are positively associated with all three earnings attributes, suggesting that blockholders’ passive monitoring improves earnings quality on average. This finding simultaneously substantiates the pronounced presence of passive institutional monitoring [25,26] in terms of improving earnings quality in Korea. To examine the robustness of our assertion, we integrate extra components into our analysis and find that the results support our hypotheses.
This study differs from existing studies that postulate an active institutional monitoring channel in Korea [1,2,3,4,5]. We assert that the interconnected business and political ties manifested by chaebols and the recent KNPS scandal support the argument that active institutional monitoring is not a viable corporate governance mechanism. We propose that the institutional monitoring effect in Korea originates from the passive channel, through which blockholders affect managerial behavior by trading their shares and, thus, influencing the stock price, to which managers are sensitive. This study therefore contributes to the literature by presenting empirical evidence to support our hypotheses. Korean financial regulatory authorities have greatly endeavored to improve the corporate governance of Korean companies since the 1997 Asian financial crisis. Weak firm-level governance is one of the critical factors that exacerbated the 1997 crisis [68], and the firm values of chaebol affiliates deteriorated substantially during the crisis, especially among firms with poor governance structures [6,69,70,71,72,73,74,75]. With institutional monitoring being recognized as an important governance mechanism, this study provides policy implications by ascertaining the precise monitoring channel that contributes to improving shareholders’ interests and mitigating the agency problem in Korea.
This study shows that inconspicuous, passive institutional monitoring, as an alternative to conspicuous, active monitoring, can be a viable long-term corporate governance mechanism in a unique economic environment in which relatively few business conglomerates wield disproportionate influence over the market and society. We humbly argue that this study serves as a genuine example of sustainability in an advanced emerging market in which an oligopolistic market structure consistently leads to technological and even cultural innovations. For example, Samsung Electronics, a well-known technology giant, and CJ Entertainment, the producer of the movie Parasite, which won four Academy Awards in 2020 [76], are a Samsung affiliate and spin-off, respectively. Korea serves as a stark counterexample to the “conglomerate discount” [77,78]. We therefore argue that the results of this study make a novel contribution to the literatures on economic sustainability and long-run equilibria. An immediate policy implication of the results is that an economy in which relatively few business conglomerates hold a high concentration of wealth or market power, such as the Russian Federation [79], may consider mobilizing its sovereign wealth fund or national pension fund as a passive steward of its invested firms’ operational and financial management.

Author Contributions

C.Y.C. designed and performed the research and analyzed the data. C.Y.C. wrote the paper. D.C., P.M.S.C., and J.H.C. revised the paper. All authors have read and agreed to the published version of the manuscript.

Funding

This work was supported by the research program of Kookmin University in Korea.

Conflicts of Interest

The authors declare no conflicts of interest.

Appendix A

Table A1. Definitions of the control variables.
VariableDefinitions
SIZENatural logarithm of the total assets of firm i in year t
LEVTotal debt divided by the market value of equity (common shares outstanding multiplied by the stock price) for firm i in year t
ROAEarnings before interest and tax (EBIT) divided by total assets for firm i in year t
MBSum of the market value of equity, long-term debt, and short-term debt divided by total assets for firm i in year t
Sales_GSales in year t divided by sales in year t-1 minus 1 for firm i
STD_SalesStandard deviation of sales scaled by total assets for firm i during years t-4 to t
STD_OCFStandard deviation of operating cash flows scaled by total assets for firm i during years t-4 to t
Firm_AgeNatural logarithm of the number of years since firm i was established
RND_ExpR&D expenditures divided by sales for firm i in year t
Index_DDummy variable equal to 1 for a firm listed on the KOSPI and equal to 0 otherwise

Appendix B

Table A2. Correlations.
KNPS_BIOPersistenceValue
Relevance
TimelinessSIZELEVROAMBSales_GSTD_SalesSTD_OCFFirm_AgeRND_ExpIndex_D
KNPS_BIO1
Persistence0.037 ***1
[<0.0001]
Value
Relevanc
0.068 ***0.017 **1
[<0.0001][0.0373]
Timeliness0.028 ***0.015 *0.030 ***1
[0.0008][0.0602][0.0003]
SIZE0.407 ***0.074 ***0.128 ***0.032 ***1
[<0.0001][<0.0001][<0.0001][0.0006]
LEV−0.0010.002−0.037 ***0.0120.272 ***1
[0.8459][0.7923][<0.0001][0.1892][<0.0001]
ROA0.089 ***−0.047 ***0.082 ***0.017 *0.188***−0.229 ***1
[<0.0001][<.0001][<0.0001][0.0685][<0.0001][<0.0001]
MB0.059 ***0.028 ***−0.212 ***−0.006−0.192 ***−0.337 ***−0.037 ***1
[<0.0001][0.0024][<0.0001][0.4808][<0.0001][<0.0001][<0.0001]
Sales_G−0.010−0.0090.0020.0050.0150.029 ***0.008−0.0071
[0.2723][0.3507][0.8177][0.5385][0.1047][0.0026][0.3988][0.4236]
STD_Sales−0.027 ***−0.003−0.090 ***−0.012−0.122 ***0.088 ***−0.108 ***0.048 ***0.076 ***1
[0.0039][0.7283][<0.0001][0.1990][<0.0001][<0.0001][<0.0001][<0.0001][<0.0001]
STD_OCF−0.058 ***−0.031 ***−0.085 ***−0.005−0.193 ***0.064 ***−0.224 ***0.117 ***0.186 ***0.316 ***1
[<0.0001][0.0007][<0.0001][0.5428][<0.0001][<0.0001][<0.0001][<0.0001][<0.0001][<0.0001]
Firm_Age0.081 ***0.0030.093 ***0.0080.293 ***0.071 ***0.082 ***−0.209 ***−0.009−0.140 ***−0.183 ***1
[<0.0001][0.6707][<0.0001][0.3564][<0.0001][<0.0001][<0.0001][<0.0001][0.3125][<0.0001][<0.0001]
RND_Exp−0.008−0.014−0.033 ***0.004−0.093 ***−0.098 ***−0.084 ***0.213 ***−0.009−0.0050.039 ***-0.162 ***1
[0.3676][0.1338][0.0004][0.6628][<0.0001][<0.0001][<0.0001][<0.0001][0.3043][0.5559][<0.0001][<0.0001]
Index_D0.3630.053 ***0.048 ***0.021 **0.583 ***0.027 ***0.095 ***0.131 ***0.019 **−0.092 ***−0.068 ***0.116 ***0.024 **1
[<0.0001][<0.0001][<0.0001][0.0207][<0.0001][0.0031][<0.0001][<0.0001][0.0413][<0.0001][<0.0001][<0.0001][0.0102]
Notes: This table provides Pearson’s (contemporaneous) correlation coefficients for the key variables used in this study. The values in brackets are the pertinent p-values.

References

  1. Byun, S.H.; Lee, Y.J. Institutional blockholders and earnings management. Korean J. Account. Res. 2013, 18, 251–273. [Google Scholar]
  2. Cheon, Y.S. The association between foreign and domestic institutional ownership and earnings quality. Korean Manag. Rev. 2003, 32, 1001–1032. [Google Scholar]
  3. Kim, I.; Miller, S.; Wan, H.; Wang, B. Drivers behind the monitoring effectiveness of global institutional investors: Evidence from earnings management. J. Corp. Financ. 2016, 40, 24–46. [Google Scholar] [CrossRef]
  4. Kim, M.T.; Yoon, S.S. Impact of foreign institutional investors on earnings management: Comparison with domestic institutional investors. Korean Acad. Assoc. Bus. Adm. 2009, 22, 1093–1114. [Google Scholar]
  5. Lel, U. The Role of Foreign Institutional Investors in Restraining Earnings Management Activities across Countries; Working Paper; University of Georgia: Athens, GA, USA, 2016. [Google Scholar]
  6. Liu, C.; Chung, C.Y.; Sul, H.K.; Wang, K. Does hometown advantage matter? The case of institutional blockholder monitoring on earnings management in Korea. J. Int. Bus. Stud. 2018, 49, 196–221. [Google Scholar]
  7. Brickley, J.A.; Lease, R.C.; Smith, C.W. Ownership structure and voting on antitakeover amendments. J. Financ. Econ. 1988, 20, 267–291. [Google Scholar] [CrossRef]
  8. Almazan, A.; Hartzell, J.C.; Starks, L.T. Active institutional shareholders and costs of monitoring: Evidence from executive compensation. Financ. Manag. 2005, 34, 5–34. [Google Scholar] [CrossRef]
  9. Fodio, M.I.; Ibikunle, J.; Oba, V.C. Corporate governance mechanisms and reported earnings quality in listed Nigerian insurance firms. Int. J. Financ. Account. 2013, 2, 279–286. [Google Scholar]
  10. Loomis, C.J. Lies, damned lies, and managed earnings. Fortune 1999, 140, 74–92. [Google Scholar]
  11. Amihud, Y. Illiquidity and stock returns: Cross-section and time-series effects. J. Financ. Mark. 2002, 5, 31–56. [Google Scholar] [CrossRef] [Green Version]
  12. Bushee, B.J. The influence of institutional investors on myopic R&D investment behavior. Account. Rev. 1998, 73, 305–333. [Google Scholar]
  13. Bushee, B.J. Do institutional investors prefer near-term earnings over long-run value? Contemp. Account. Res. 2001, 18, 207–246. [Google Scholar] [CrossRef]
  14. Wright, M.; Filatotchev, I.; Hoskisson, R.E.; Peng, M.W. Strategy research in emerging economies: Challenging the conventional wisdom. J. Manag. Stud. 2005, 42, 1–33. [Google Scholar] [CrossRef]
  15. Xu, D.; Meyer, K.E. Linking theory and context: “Strategy research in emerging economies” after Wright et al. (2005). J. Manag. Stud. 2013, 50, 1322–1346. [Google Scholar]
  16. Carleton, W.T.; Nelson, J.M.; Weisbach, M.S. The influence of institutions on corporate governance through private negotiations: Evidence from TIAA-CREF. J. Financ. 1998, 53, 1335–1362. [Google Scholar] [CrossRef]
  17. Del Guercio, D.; Hawkins, J. The motivation and impact of pension fund activism. J. Financ. Econ. 1999, 52, 293–340. [Google Scholar] [CrossRef]
  18. Gillan, S.L.; Starks, L.T. Corporate governance proposals and shareholder activism: The role of institutional investors. J. Financ. Econ. 2000, 57, 275–305. [Google Scholar] [CrossRef]
  19. Shleifer, A.; Vishny, R.W. Large shareholders and corporate control. J. Political Econ. 1986, 94, 461–488. [Google Scholar] [CrossRef] [Green Version]
  20. Smith, M.P. Shareholder activism by institutional investors: Evidence from CalPERS. J. Financ. 1996, 51, 227–252. [Google Scholar] [CrossRef]
  21. Chang, S.J.; Hong, J. Economic performance of group-affiliated companies in Korea: Intragroup resource sharing and internal business transactions. Acad. Manag. J. 2000, 43, 429–448. [Google Scholar]
  22. Chang, S.J. Ownership structure, expropriation, and performance of group-affiliated companies in Korea. Acad. Manag. J. 2003, 46, 238–253. [Google Scholar]
  23. Bae, K.H.; Kang, J.K.; Kim, J.M. Tunneling or value added? Evidence from mergers by Korean business groups. J. Financ. 2002, 57, 2695–2740. [Google Scholar]
  24. Baek, J.S.; Kang, J.K.; Lee, I. Business groups and tunneling: Evidence from private securities offerings by Korean chaebols. J. Financ. 2006, 61, 2415–2449. [Google Scholar] [CrossRef] [Green Version]
  25. Edmans, A. Blockholder trading, market efficiency, and managerial myopia. J. Financ. 2009, 64, 2481–2513. [Google Scholar] [CrossRef] [Green Version]
  26. Admati, A.R.; Pfleiderer, P. The “Wall Street Walk” and shareholder activism: Exit as a form of voice. Rev. Financ. Stud. 2009, 22, 2645–2685. [Google Scholar] [CrossRef] [Green Version]
  27. Kaplan, S.N.; Minton, B. How Has CEO Turnover Changed? Increasingly Performance Sensitive Boards and Increasingly Uneasy CEOs; No. w12465; National Bureau of Economic Research: New York, NY, USA, 2006. [Google Scholar]
  28. Murphy, K. Stock-based pay in new economy firms. J. Account. Econ. 2003, 34, 129–147. [Google Scholar] [CrossRef]
  29. Porter, M.E. Capital choices: Changing the way America invests in industry. J. Appl. Corp. Financ. 1992, 5, 4–16. [Google Scholar] [CrossRef]
  30. Drucker, P. A crisis of capitalism. Wall Street J. 1986, 30, 30–31. [Google Scholar]
  31. Jacobs, M.T. Short-term America: The Causes and Cures of Our Business Myopia; Harvard Business School Press: Boston, MA, USA, 1991. [Google Scholar]
  32. Graves, S.B.; Waddock, S.A. Institutional ownership and control: Implications for long-term corporate strategy. Executive 1990, 4, 75–83. [Google Scholar] [CrossRef]
  33. Chung, R.; Firth, M.; Kim, J.B. Institutional monitoring and opportunistic earnings management. J. Corp. Financ. 2002, 8, 29–48. [Google Scholar] [CrossRef]
  34. Cornett, M.M.; Marcus, A.J.; Tehranian, H. Corporate governance and pay-for-performance: The impact of earnings management. J. Financ. Econ. 2008, 87, 357–373. [Google Scholar] [CrossRef]
  35. Mitra, S.; Cready, W.M. Institutional stock ownership, accrual management, and information environment. J. Account. Audit. Financ. 2005, 20, 257–286. [Google Scholar] [CrossRef]
  36. Roychowdhury, S. Earnings management through real activities manipulation. J. Account. Econ. 2006, 42, 335–370. [Google Scholar] [CrossRef]
  37. Chen, X.; Harford, J.; Li, K. Monitoring: Which institutions matter? J. Financ. Econ. 2007, 86, 279–305. [Google Scholar] [CrossRef]
  38. Kothari, S.P.; Leone, A.J.; Wasley, C.E. Performance matched discretionary accrual measures. J. Account. Econ. 2005, 39, 163–197. [Google Scholar] [CrossRef]
  39. Penman, S.H.; Zhang, X.J. Accounting conservatism, the quality of earnings, and stock returns. Account. Rev. 2002, 77, 237–264. [Google Scholar] [CrossRef] [Green Version]
  40. Richardson, S. Earnings quality and short sellers. Account. Horiz. 2003, 17, 49. [Google Scholar] [CrossRef]
  41. Ali, A.; Zarowin, P. The role of earnings levels in annual earnings-returns studies. J. Account. Res. 1992, 30, 286–296. [Google Scholar] [CrossRef]
  42. Francis, J.; LaFond, R.; Olsson, P.M.; Schipper, K. Costs of equity and earnings attributes. Account. Rev. 2004, 79, 967–1010. [Google Scholar] [CrossRef] [Green Version]
  43. Barth, M.E.; Beaver, W.H.; Landsman, W.R. The relevance of the value relevance literature for financial accounting standard setting: Another view. J. Account. Econ. 2001, 31, 77–104. [Google Scholar] [CrossRef]
  44. Collins, D.W.; Maydew, E.L.; Weiss, I.S. Changes in the value-relevance of earnings and book values over the past forty years. J. Account. Econ. 1997, 24, 39–67. [Google Scholar] [CrossRef]
  45. Francis, J.; Schipper, K. Have financial statements lost their relevance? J. Account. Res. 1999, 37, 319–352. [Google Scholar] [CrossRef]
  46. Lev, B.; Zarowin, P. The boundaries of financial reporting and how to extend them. J. Account. Res. 1999, 37, 353–385. [Google Scholar] [CrossRef] [Green Version]
  47. Cheng, M.; Subramanyam, K.R. Analyst following and credit ratings. Contemp. Account. Res. 2008, 25, 1007–1044. [Google Scholar] [CrossRef]
  48. Gu, Z. Cross-sample incomparability of R2s and additional evidence on value relevance changes over time. J. Bus. Financ. Account. 2002, 34, 1073–1098. [Google Scholar] [CrossRef]
  49. Ball, R.; Kothari, S.P.; Robin, A. The effect of international institutional factors on properties of accounting earnings. J. Account. Econ. 2000, 29, 1–51. [Google Scholar] [CrossRef] [Green Version]
  50. Bushman, R.; Chen, Q.; Engel, E.; Smith, A. Financial accounting information, organizational complexity and corporate governance systems. J. Account. Econ. 2004, 37, 167–201. [Google Scholar] [CrossRef]
  51. Becker, C.L.; DeFond, M.L.; Jiambalvo, J.; Subramanyam, K.R. The effect of audit quality on earnings management. Contemp. Account. Res. 1998, 15, 1–24. [Google Scholar] [CrossRef]
  52. DeFond, M.L.; Park, C.W. Smoothing income in anticipation of future earnings. J. Account. Econ. 1997, 23, 115–139. [Google Scholar] [CrossRef]
  53. Dichev, I.D.; Skinner, D.J. Large–sample evidence on the debt covenant hypothesis. J. Account. Res. 2002, 40, 1091–1123. [Google Scholar] [CrossRef]
  54. Ayers, B.C.; Ramalingegowda, S.; Yeung, P.E. Hometown advantage: The effects of monitoring institution location on financial reporting discretion. J. Account. Econ. 2011, 52, 41–61. [Google Scholar] [CrossRef]
  55. Dechow, P.M.; Sloan, R.G.; Sweeney, A.P. Causes and consequences of earnings manipulation: An analysis of firms subject to enforcement actions by the SEC. Contemp. Account. Res. 1996, 13, 1–36. [Google Scholar] [CrossRef]
  56. Helwege, J.; Liang, N. Is there a pecking order? Evidence from a panel of IPO firms. J. Financ. Econ. 1996, 40, 429–458. [Google Scholar]
  57. Barth, M.E.; Kasznik, R. Share repurchases and intangible assets. J. Account. Econ. 1999, 28, 211–241. [Google Scholar] [CrossRef]
  58. Chung, C.Y.; Sul, H.K.; Wang, K. Geographic and Market Proximity: Which One Matters? Working Paper; Chung-Ang University: Seoul, Korea, 2017. [Google Scholar]
  59. Fama, E.F.; MacBeth, J.D. Risk, return, and equilibrium: Empirical tests. J. Political Econ. 1973, 81, 607–636. [Google Scholar] [CrossRef]
  60. Newey, W.K.; West, K.D. Automatic lag selection in covariance matrix estimation. Rev. Econ. Stud. 1994, 61, 631–653. [Google Scholar] [CrossRef]
  61. Dechow, P.M.; Dichev, I.D. The quality of accruals and earnings: The role of accrual estimation errors. Account. Rev. 2002, 77, 35–59. [Google Scholar] [CrossRef]
  62. Sloan, R.G. Do stock prices fully reflect information in accruals and cash flows about future earnings? Account. Rev. 1996, 71, 289–315. [Google Scholar]
  63. Petersen, M.A. Estimating standard errors in finance panel data sets: Comparing approaches. Rev. Financ. Stud. 2009, 22, 435–480. [Google Scholar] [CrossRef] [Green Version]
  64. Aboody, D.; Lev, B. Information asymmetry, R&D, and insider gains. J. Financ. 2000, 55, 2747–2766. [Google Scholar]
  65. Armstrong, C.S.; Core, J.E.; Taylor, D.J.; Verrecchia, R.E. When does information asymmetry affect the cost of capital? J. Account. Res. 2011, 49, 1–40. [Google Scholar] [CrossRef] [Green Version]
  66. Coffee, J.C. Liquidity versus control: The institutional investor as corporate monitor. Columbia Law Rev. 1991, 91, 1277–1368. [Google Scholar] [CrossRef]
  67. Appel, I.R.; Gormley, T.A.; Keim, D.B. Passive investors, not passive owners. J. Financ. Econ. 2016, 121, 111–141. [Google Scholar] [CrossRef] [Green Version]
  68. Johnson, S.; Boone, P.; Breach, A.; Friedman, E. Corporate governance in the Asian financial crisis. J. Financ. Econ. 2000, 58, 141–186. [Google Scholar] [CrossRef] [Green Version]
  69. Chung, C.Y.; Liu, C.; Wang, K.; Zykaj, B.B. Institutional monitoring: Evidence from the F-score. J. Bus. Financ. Account. 2015, 42, 885–914. [Google Scholar] [CrossRef]
  70. Choi, P.M.S.; Chung, C.Y.; Hwang, J.H.; Liu, C. Heads I win, tails you lose: Institutional monitoring of executive pay rigidity. J. Financ. Res. 2019, 42, 789–816. [Google Scholar] [CrossRef]
  71. Choi, P.M.S.; Chung, C.Y.; Liu, C. Self-attribution of overconfident CEOs and asymmetric investment-cash flow sensitivity. N. Am. J. Econ. Financ. 2018, 46, 1–14. [Google Scholar] [CrossRef]
  72. Chung, C.Y.; Hur, S.K.; Liu, C. Institutional investors and cost stickiness: Theory and evidence. N. Am. J. Econ. Financ. 2019, 47, 336–350. [Google Scholar] [CrossRef]
  73. Chung, C.Y.; Jung, S.; Young, J. Do CSR activities increase firm value? Evidence from the Korean market. Sustainability 2018, 10, 3164. [Google Scholar]
  74. Cho, S.J.; Chung, C.; Young, J. Study on the relationship between CSR and financial performance. Sustainability 2019, 11, 343. [Google Scholar]
  75. Baek, J.S.; Kang, J.K.; Park, K.S. Corporate governance and firm value: Evidence from the Korean financial crisis. J. Financ. Econ. 2004, 71, 265–313. [Google Scholar] [CrossRef]
  76. Watson, R.T.; Flint, J. ‘Parasite’ financial backer started as a food maker. Wall Street J. 10 February 2020. [Google Scholar]
  77. Berger, P.G.; Ofek, E. Diversification’s effect on firm value. J. Financ. Econ. 1995, 37, 39–65. [Google Scholar] [CrossRef]
  78. Lang, L.H.P.; Stulz, R.M. Tobin’s q, corporate diversification, and firm performance. J. Political Econ. 1994, 102, 1248–1280. [Google Scholar]
  79. Guriev, S.; Rachinsky, A. The role of oligarchs in Russian capitalism. J. Econ. Perspect. 2005, 19, 131–150. [Google Scholar] [CrossRef] [Green Version]
Figure 1. Yearly cross-sectional averages of KNPS_BIO and earnings quality attributes. Note: This figure shows the yearly cross-sectional averages of KNPS_BIO and three earnings quality attributes from 2009 to 2014. The left (right) y-axis measures KNPS_BIO (the earnings quality attributes). The dash-dotted lines represent various earnings attributes, and the solid red line represents KNPS_BIO.
Sustainability 12 02585 g001
Table 1. Descriptive statistics.
VariableMeanSD5th
Percentile
25th
Percentile
Median75th
Percentile
95th
Percentile
KNPS_BIO0.07110.01920.05030.05440.06600.08390.1084
Persistence0.12710.7306−0.6701−0.22700.05220.39021.1596
ValueRelevance−0.17290.2961−0.8130−0.1902−0.0562−0.0112−0.0003
Timeliness0.13240.7870−1.4503−0.32760.30190.81770.9912
SIZE19.08631.544817.143218.050218.761919.836622.2368
LEV0.46540.20850.13480.30200.47030.61560.7946
ROA0.00110.2001−0.2004−0.00530.02600.06050.1290
MB492.5660677.855563.3021165.7285310.0427575.80161485.9900
Sales_G0.24744.7496−0.3267−0.05230.05980.19450.6852
STD_Sales0.16600.18140.00000.06540.12220.21220.4521
STD_OCF0.06440.06060.00000.03110.05230.08200.1552
Firm_Age3.29630.55392.30262.89043.40123.71364.0604
RND_Exp0.01300.04340.00000.00000.00110.01100.0598
Index_D0.19560.39670.00000.00000.00000.00001.0000
Notes: This table presents the mean, standard deviation, 5th percentile, 25th percentile, median, 75th percentile, and 95th percentile values of the key variables in the sample of 1432 firm-year observations for the sample period from 2009 to 2014. The data are winsorized at the 1% and 99% levels, as per Ayers et al. [54]. Abbreviations are defined in the main text above.
Table 2. Impact of lagged blockholdings of the Korean National Pension Service (KNPS) on earnings attributes.
Panel APersistencetValueRelevancetTimelinesst
Intercept0.1168 **−0.2381 ***0.0530
(2.61)(−7.32)(1.16)
KNPS_BIOt-10.4572 **0.3599 ***1.3165 **
(2.28)(7.90)(2.92)
SIZEt-10.0373 **0.0125 *0.0412 **
(2.66)(2.20)(2.60)
LEVt-1−0.0093−0.0780 ***0.1192
(−0.28)(−9.51)(1.57)
ROAt-10.0820 **0.0908 **0.1061 **
(3.02)(3.28)(2.41)
MBt-10.0001 *−0.0001 **0.0001
(2.19)(−2.56)(0.21)
Sales_Gt-1−0.00580.0117 **−0.0202
(−0.25)(2.66)(−1.06)
STD_Salest-1−0.0208 *−0.0235 ***−0.0064
(−2.10)(−7.68)(−0.45)
STD_OCFt-1−0.3787 **−0.03720.2169
(−2.40)(−0.49)(0.75)
Firm_Aget-1−0.01020.0254 ***−0.0053
(−0.72)(4.50)(−0.53)
RND_Expt-1−0.4145 ***−0.3939 ***0.5583
(−10.45)(−3.51)(1.32)
Index_D0.0462 ***0.0244 *0.0005
(3.94)(2.26)(0.01)
Adjusted R20.01060.04180.0063
Observations121412141214
Panel BPersistencetValueRelevancetTimelinesst
Intercept0.121 **−0.183 ***0.077
(2.22)(−11.47)(1.27)
KNPS_BIOt-10.821 **0.429 ***1.273 ***
(2.32)(3.23)(3.21)
SIZEt-10.037 ***0.013 ***0.040 ***
(2.75)(2.66)(2.69)
LEVt-1−0.022−0.076 ***0.097 **
(−0.56)(−5.20)(2.23)
ROAt-10.083 **0.087 ***0.089 **
(2.12)(5.93)(2.03)
MBt-10.001 ***−0.001 ***0.001
(2.64)(−5.54)(0.98)
Sales_Gt-1−0.0190.006−0.012
(−1.06)(0.94)(−0.58)
STD_Salest-1−0.018 *−0.020 ***−0.005
(−1.96)(−5.94)(−0.52)
STD_OCFt-1−0.349 ***−0.0310.240 *
(−2.73)(−0.64)(1.68)
Firm_Aget-1−0.0060.026 ***−0.010
(−0.44)(5.07)(−0.65)
RND_Expt-1−0.374 *−0.150 **0.171
(−1.95)(−2.08)(0.80)
Index_D0.054 ***0.021 ***0.003
(2.72)(2.77)(0.13)
Adjusted R20.00690.03140.0025
Observations121412141214
Notes: This table shows the estimation results for Fama–MacBeth cross-sectional regressions (Panel A) panel regressions (Panel B) of the earnings attribute variables on lagged values of KNPS_BIO. The t-statistics are reported in parentheses and are adjusted for two-way clustered standard errors at the firm level, allowing for heteroscedasticity and arbitrary within-firm correlation. This approach is based on Petersen’s [63] methodology. ***, **, and * denote statistical significance at the 1%, 5%, and 10% levels, respectively.
Table 3. Impact of lagged blockholdings of the KNPS on earnings attributes for firms with different information opacities and share liquidities.
Panel APersistencetValueRelevancetTimelinesst
VariableLow
Opacity
High
Opacity
Low
Opacity
High
Opacity
Low
Opacity
High
Opacity
Intercept0.1168 **0.1141 ***−1.0880***−0.2484***−1.8791***0.0530
(2.61)(5.78)(−357.75)(−7.32)(−10.12)(1.16)
KNPS_BIOt-10.45720.0760 ***−0.01550.3599***0.25101.3165**
(0.58)(3.61)(−0.56)(7.90)(0.28)(2.92)
SIZEt-10.0373 **−0.0053 ***−0.00100.0125*0.5042***0.0412**
(2.66)(−3.48)(−0.57)(2.20)(10.76)(2.60)
LEVt-1−0.00930.0255 ***−0.0079**−0.0780***−0.4658***0.1192
(−0.28)(4.57)(−2.46)(−9.51)(−4.36)(1.57)
ROAt-10.0820 **−0.0677 ***0.00640.0908**1.3482***0.1061**
(3.02)(−6.95)(1.41)(3.28)(8.69)(2.41)
MBt-10.0001 *0.0001 ***−0.0001−0.0001**−0.0001***0.0001
(2.19)(8.39)(−0.40)(−2.56)(−4.92)(0.21)
Sales_Gt-1−0.00580.0001−0.00090.0117**−0.1368**−0.0202
(−0.25)(0.03)(−0.59)(2.66)(−2.50)(−1.06)
STD_Salest-1−0.0208 *0.0095 ***0.0019**−0.0235***−0.1900***−0.0064
(−2.10)(6.08)(2.86)(−7.68)(−4.01)(−0.45)
STD_OCFt-1−0.3787 **0.1569 ***0.0024−0.03722.3434***0.2169
(−2.40)(8.69)(0.38)(−0.49)(3.44)(0.75)
Firm_Aget-1−0.0102−0.0138 ***−0.0032***0.0254***0.1483**−0.0053
(−0.72)(−4.35)(−3.48)(4.50)(2.78)(−0.53)
RND_Expt-1−0.4145 ***0.01950.0270−0.3939***1.4102*0.5583
(−10.45)(0.25)(1.32)(−3.51)(2.07)(1.32)
Index_D0.0462 ***−0.0041 *−0.00150.0244*0.03030.0005
(3.94)(−2.20)(−1.80)(2.26)(0.39)(0.01)
Adjusted R20.12300.01060.00060.12170.04180.0063
Observations713501713501713501
Panel BPersistencetValueRelevancetTimelinesst
VariableLow
Liquidity
High LiquidityLow
Liquidity
High
Liquidity
Low
Liquidity
High
Liquidity
Intercept0.1141 ***0.1168 **−0.2381 ***−1.0880 ***0.0530−1.8791 ***
(5.78)(2.61)(−7.32)(−357.75)(1.16)(−10.12)
KNPS_BIOt-10.45720.0760 ***−0.01550.3599 ***0.25101.3165 **
(0.58)(3.61)(−0.56)(7.90)(0.28)(2.92)
SIZEt-1−0.0053 ***0.0373 **0.0125 *−0.00100.0412 **0.5042 ***
(−3.48)(2.66)(2.20)(−0.57)(2.60)(10.76)
LEVt-10.0255 ***−0.0093−0.0780 ***−0.0079 **0.1192−0.4658 ***
(4.57)(−0.28)(−9.51)(−2.46)(1.57)(−4.36)
ROAt-1−0.0677 ***0.0820 **0.0908 **0.00640.1061 **1.3482 ***
(−6.95)(3.02)(3.28)(1.41)(2.41)(8.69)
MBt-10.0001 ***0.0001 *−0.0001 **−0.00010.0001−0.0001 ***
(8.39)(2.19)(−2.56)(−0.40)(0.21)(−4.92)
Sales_Gt-10.0001−0.00580.0117 **−0.0009−0.0202−0.1368 **
(0.03)(−0.25)(2.66)(−0.59)(−1.06)(−2.50)
STD_Salest-10.0095 ***−0.0208 *−0.0235 ***0.0019 **−0.0064−0.1900 ***
(6.08)(−2.10)(−7.68)(2.86)(−0.45)(−4.01)
STD_OCFt-10.1569 ***−0.3787 **−0.03720.00240.21692.3434 ***
(8.69)(−2.40)(−0.49)(0.38)(0.75)(3.44)
Firm_Aget-1−0.0138 ***−0.01020.0254 ***−0.0032 ***−0.00530.1483 **
(−4.35)(−0.72)(4.50)(−3.48)(−0.53)(2.78)
RND_Expt-10.0195−0.4145 ***−0.3939 ***0.02700.55831.4102 *
(0.25)(−10.45)(−3.51)(1.32)(1.32)(2.07)
Index_D−0.0041 *0.0462 ***0.0244 *−0.00150.00050.0303
(−2.20)(3.94)(2.26)(−1.80)(0.01)(0.39)
Adjusted R20.12300.01060.00060.12170.04180.0063
Observations604610604610604610
Notes: This table shows the estimation results of regressions of the earnings attribute variables on lagged values of KNPS_BIO for different levels of information opacity (Panel A) and share liquidity (Panel B). The values in parentheses are the pertinent t-statistics adjusted for Newey–West autocorrelations with three lags. ***, **, and * denote statistical significance at the 1%, 5%, and 10% levels, respectively.
Table 4. Impact of lagged blockholdings of the KNPS on earnings attributes by chaebol affiliation.
VariablePersistencetValueRelevancetTimelinesst
Intercept−1.7944 ***−0.2116 ***0.0779
(−8.26)(-5.67)(1.09)
KNPS_BIOt-1−0.0033−0.0451 *−0.0011
(−0.69)(−2.74)(−0.54)
Chaebol_Dummy0.0723 **0.0070−0.0456
(2.41)(0.60)(−0.81)
KNPS_BIOt-1 x Chaebol_Dummy1.6092 ***0.4066 ***1.4425 *
(8.46)(6.32)(2.39)
SIZEt-10.5363 ***0.0157 **0.0219
(8.42)(3.00)(1.91)
LEVt-1−0.6164 ***−0.0765 ***0.0322
(−15.18)(−12.31)(0.61)
ROAt-11.4482 ***0.1215 ***0.1676 **
(11.55)(6.47)(4.33)
MBt-1−0.0001 ***−0.0001 *0.0001
(−5.81)(−2.64)(0.71)
Sales_Gt-1−0.06830.0140 *−0.0083
(−1.76)(2.58)(−0.57)
STD_Salest-1−0.2512 ***−0.0203 ***−0.0053
(−6.46)(−7.92)(−0.36)
STD_OCFt-11.4074 *−0.04350.4850 **
(2.76)(−0.36)(4.05)
Firm_Aget-10.11060.0250 **−0.0067
(1.64)(3.68)(−0.36)
RND_Expt-12.2243 ***−0.3874 *−0.0585
(5.43)(−2.29)(−0.40)
Index_D−0.06750.01150.0086
(−0.84)(0.83)(0.12)
Adjusted R20.11530.04570.0056
Observations121412141214
Notes: This table shows the estimation results for regressions of the earnings attribute variables on lagged values of KNPS_BIO when a dummy variable indicating chaebol affiliation is incorporated into the regression. The values in parentheses are pertinent t-statistics adjusted for Newey–West autocorrelations with three lags. ***, **, and * denote statistical significance at the 1%, 5%, and 10% levels, respectively.
Table 5. Influence of blockholdings of the KNPS on earnings attributes for Korea Composite Stock Price Index (KOSPI) 100 and KOSPI 200 firms (instrumental variable approach).
VariablePersistencetValueRelevancetTimelinesst
Intercept−1.3432 ***−0.2080 ***−0.0974
(−7.50)(−5.99)(−0.37)
KNPS_BIO_IVt-12.1578 **1.3335 ***1.5858 *
(2.90)(3.40)(2.09)
SIZEt-10.1866 ***0.0028−0.0209
(4.05)(0.42)(−0.64)
LEVt-1−0.0237−0.00090.0742
(−0.17)(−0.04)(0.55)
ROAt-11.7174 ***0.2044 **−0.2462
(4.45)(3.19)(−0.94)
MBt-10.0001−0.0001 **0.0001
(0.25)(−2.53)(1.15)
Sales_Gt-10.07370.00080.0475
(0.50)(0.10)(0.54)
STD_Salest-1−0.1866 *−0.0154 ***−0.0013
(−2.13)(−9.09)(−0.04)
STD_OCFt-11.0573−0.05870.3337 *
(1.42)(−0.56)(2.15)
Firm_Aget-1−0.08060.0159 *0.0396
(−0.77)(1.97)(0.96)
RND_Expt-1−1.0908−0.6349−0.3272
(−0.45)(−1.69)(−0.48)
Adjusted R20.12680.10950.0536
Observations121412141214
Notes: This table shows the estimation results of regressions of the earnings attribute variables on lagged values of KNPS_BIO. We compute the instrumented KNPS_BIO based on whether a firm is assigned to the KOSPI 100, a subset of the KOSPI 200, in each year. The values in parentheses are pertinent t-statistics adjusted for Newey–West autocorrelations with three lags. ***, **, and * denote statistical significance at the 1%, 5%, and 10% levels, respectively.

