Article

Collaborative Learning Communities for Sustainable Employment through Visual Tools

by
Rodrigo Martín-García
*,
Carmen López-Martín
and
Raquel Arguedas-Sanz
Department of Business Economics and Accounting, National Distance Education University (UNED), 28040 Madrid, Spain
*
Author to whom correspondence should be addressed.
Sustainability 2020, 12(6), 2569; https://doi.org/10.3390/su12062569
Submission received: 9 February 2020 / Revised: 19 March 2020 / Accepted: 21 March 2020 / Published: 24 March 2020

Abstract

:
Higher education institutions must enable students to acquire skills and capacities that prepare them for working life and enhance their employability. This will lead to an applied learning- and teaching-enhancement-oriented sustainable Higher Education System. This research aims to contribute to that goal by analyzing student interactions in a collaborative learning community. It assesses the impact of visual tools on academic performance and student satisfaction in employment-focused blended studies, in which enrollees were geographically dispersed undergraduates with a diversity of profiles. A financial studies learning community was created to test students’ interactions in a model conducive to participation as visual content creators and users. Three surveys (pre-project, appraisal of classmates’ visual exercises, and post-project) were conducted to assess project impact. First, we used a univariate approach, focused on students’ characteristics, course and project appraisals, and the effects of the project on academic performance and expectations. Secondly, a bivariate approach was conducted to detect relationships between respondents’ appraisals and personal characteristics and to determine whether their mean scores were the same irrespective of such characteristics. The findings showed that: (1) Students’ preferences concur with those of their employers; (2) participation in innovative initiatives improves students’ perception of course procedures; (3) visual tools have a positive impact on learning, in terms of both academic performance and student satisfaction. The study concludes by providing support for educational institutions´ decision-making around courses and the overall curricula by defining the factors determining academic performance and student satisfaction.

1. Introduction

Interdisciplinary vision and teamwork are imperative to the agility, flexibility, and innovation that are so essential in today’s corporate culture [1]. Worker, management, and organizational creativity is vital not only to respond nimbly to problems [2], but to identify opportunities [3], allocate resources efficiently [4], and introduce and captain organizational change [5].
Encouraging creativity is consequently essential and should be furthered in companies, but also across the whole education system, so present and future workers can meet labor market needs and demands. A recent survey by the World Economic Forum [6] on the impact of technological change showed that most employers deem “creativity” to be one of the three most demanded skills for 2020. The ability to work effectively with others, in turn, is a skill commonly and constantly called for by employers [7,8]. According to many authors, however, managers perceive recent graduates’ education to be wanting in that respect [9,10,11]. Teamworking is therefore a curriculum imperative, particularly in environments where classmate interaction is close to nil, such as in distance education.
Universities and business schools must encourage creativity and teamwork to afford graduates some of the aptitudes in greatest corporate demand. Current trends in higher education revolve around education procedures, innovative learning, and graduate employability [12]. In recent years, the focus has moved to problem- and inquiry-based learning, in which students apply their knowledge to solve specific (often real-world) problems [13,14]. In blended learning, with the institution of interactive environments, such as problem solving and discussion sessions, the approach is gradually eclipsing passive knowledge absorption.
Empirical evidence of the effectiveness of higher education in favoring creativity is still patchy, however, prompting EU authorities to express concern in that regard [14], such as in the Dutch Strategic Agenda For Higher Education 2015–2025, which sets as one of its focuses the sustainable regional and sector-based collaboration.
In a survey on the EU’s agenda for modernizing higher education, fewer than half of the respondents overall and fewer than 40% of students and recent graduates agreed that “current programs encourage students to be creative and innovative” [15].
According to the Organisation for Economic Co-operation and Development (OECD) [16], students need to acquire a broad range of skills, including cognitive and meta-cognitive skills (e.g., critical and creative thinking), social skills such as partnering, and practical and physical skills (e.g., using new information and communication technology devices).
The European Commission [14] shows that higher education needs to further cross-curricular skills to enhance student employability. In response to that need, the Entrepreneurship Competence Framework calls for favoring initiatives and good practices that afford students a suite of tools and skills along with formal training in leadership, creative thinking, innovation, and teamwork.
Moreover, universities should align their practice with the highest level of strategic objectives in education. Spain’s 2018 employment policy plan [17] defines one of its five strategic objectives to be: “To match the skills acquired with training geared to a changing labor market to personal as well as productive system needs”.
With a view to address these problems, the National Distance University (UNED) delivers long-term lifelong learning for students in Spain and further abroad through a blended learning model. The aim is to deploy the most widely used visual tools in a context of professor and student partnering by creating a knowledge community where all of the members are both creators and users of the visual content associated initially with one and, in the future, with several courses on the curriculum. The UNED’s status as a public, central state institution delivering formal education, along with its size and broad geographic reach, makes it a paradigm of blended learning. They therefore draw from many diverse components of training that favor lifelong learning and its penetration into large-scale learning environments with innovative tools, such as interactive programs and simulations, webinars, and social networks. At this time, it is Spain’s largest university, with over 140,000 students enrolled per year in official studies; it has 1400 professors, 6300 tutors, and a large network of associated institutions across the country and beyond. It offers 28 four-year degrees, 11 combined four-year degrees, 75 masters’ degrees, 19 doctoral programs, 465 university-specific diplomas, university access for people over 25, 40, and 45, and 19 language certificates.
The purpose of this research is to assess, in a context of collaborative learning communities, the impact of visual tools on academic performance and student satisfaction. The study was developed in employment-focused blended studies in which enrollees were geographically dispersed undergraduates with a diversity of profiles.
The two key objectives sought are to improve student experience and enhance graduate employability.
The study’s main contributions to the literature revolve around: (1) Blended learning teaching methodology; (2) the demographic (age, sex), sociological (profession, education), and psychographic diversity of the group studied; (3) the research design, which combines blended mentoring with the creation of a knowledge community of both educators and learners and a working approach in which simultaneous role playing affords exercises a dual (author and user) folksonomy (a series of terms used to describe the content of a web document or resource for social labeling in the context of the social web).
The rest of this paper is structured as follows: Section 2 reviews the literature relevant to this research. The description of the fieldwork and the information processing methodology in Section 3 is followed by a discussion of the findings in Section 4 and the conclusions in Section 5.

2. Review of the Literature

Representing ideas, concepts, mechanisms, or relationships with visual tools fuels metacognition, the thought processes involved in organizing content knowledge into patterns, and solving situations and problems [18]. That involves using a different language to: (1) Represent cognitive patterns that integrate prior experience and content knowledge, (2) build abstract concepts, and (3) integrate concepts from different disciplines [19]. According to Antón et al. [20], this entails introducing new means for acquiring knowledge and furthering “pluri-languages”, which the author contends yield better academic results and greater satisfaction than conventional educational resources (summaries, synoptic charts) [21].
The range of visual and multimodal resources, texts, and technologies that come into learning spaces offer new possibilities and challenges for the design of teaching and learning [22,23,24,25,26]. Visual techniques prompt reflective learning, as is shown in [27,28,29], which is reinforced with collaborative sharing [30]. This is the entrance door to collaborative problem solving, which is their second core objective. However, the learning and teaching processes should not focus exclusively on the uses of technology in educational settings—at least until the technology evolves to a point where it becomes invisible in the learning and teaching processes [31], although technology’s impact on them is clear.
The link with the different dimensions of creativity is the third core issue of visual techniques, and it has been extensively studied in the literature. Kozhevnikov et al. [32] show that object visualization relates to artistic creativity and spatial visualization relates to scientific creativity, while both are distinct from verbal creativity. Visual material is very useful to support students’ learning; it allows students to experience information and new concepts in a sensorial way and puts them in a position to be able to process more abstract reasoning [33]. So, a thematic approach must be used, and this is why multiple creativity-oriented visual tools have been used in multiple fields in bachelor degrees: In engineering [34,35,36], in chemistry [37], in informatics [38], in economics [39,40,41], and in microbiology [42]; Reference [43] used visual tools in the framework of medicine in order to efficiently communicate the key elements of the research article.
Despite the fact visual thinking (VT) techniques have been utilized in other fields of knowledge, there very few or rare the finance programs where such tools have been used.
Buhl [44] states that the diversity of visual tools has not traditionally been an integrated aspect of the pedagogical planning of a learning process in higher education. Instead, only texts were used as the predominant source for knowledge generation. The effectiveness of the distance education system “depends heavily on the study material, particularly in the form of printed course material” [45].
A non-exhaustive list of the wide variety of visual tools might include infographics, mind maps, concept maps, webbing, word clouds, sketchnoting, visual notes, graphic jams, empathy maps, and manual thinking. Hyerle [19] classified these visual tools into three groups that help develop metacognition: Brainstorming webs, task-specific graphic organizers, and thinking process maps (see Table 1).
This project applied three of the visual tools listed in Table 1 (mind mapping, concept mapping, and webbing) based on the ease with which they could be initially introduced and the type of content to which they would be applied. To encourage creativity, students were invited to freely choose any of these tools or others within their reach.
Mind mapping was developed by Buzan [46] to represent ideas with images (concepts) based on a central idea to enable users to grasp non-linear relationships and associations. It stimulates visual perception, memory, and creativity, stokes learning, displays connections between ideas, encourages collective thinking, improves teams’ analytical capacities, and constitutes a problem-solving tool [46,47]. University students find mind maps particularly valuable, for the association between new and prior information fosters cognitive development [48]. The literature contains descriptions of the use of visual tools in universities [49,50,51,52].
Concept mapping is used to visually display hierarchically inter-related ideas or concepts. Developed by Novak [53] in the 1970s, it is especially useful in scientific training and practice [54,55,56]. References [57,58,59] discuss the benefits of this tool in science, technology, engineering, and mathematics courses. Connolly and Spiller [60] describe using concept mapping to help students build their own meanings from course material by inter-connecting key concepts. They report that when provided with the tools to develop meaningful knowledge connections, students learn more effectively.
Webbing, also known as bubble maps, is a technique for relating or connecting topics, ideas, or concepts using bubbles and lines. Described by Ayed et al. [61] and Hyerle [19], it renders some of the characteristics of the preceding techniques more flexible.
Visual thinking techniques, which are acquiring growing significance as tools for structured and organized access to complex information to facilitate learning, are particularly useful in collaborative contexts; hence, the increasing importance of knowledge communities and social networks [62]. As De Haro [63] noted, knowledge communities (1) help students develop a series of skills, notably exploration, evaluation, and selection of information sources, (2) establish channels for collaborating with third parties (wikis, blogs, etc.), (3) drive the generation of different forms of digital products (not only descriptive texts), (4) stimulate communication for creating joint knowledge, and (5) facilitate multicultural collaboration and adaptation of educational resources [64]. Social networks, the technological tools most familiar to university students [65], mutually reinforce education and the digital society, creating synergies that favor excellence in educational innovation [66].

3. Materials and Methods

The initial assumptions adopted in this study, conducted in the context of the UNED’s Visual-Thinking-Mediated Innovation and Creativity project, were: (1) Visual tools stimulate creativity and adapt learning mechanisms to mind function [46]; (2) students using visual thinking (VT) techniques understand financial course content more readily, according to findings by Messina et al. [67]; (3) just as students choose the learning tools best adapted to their characteristics and needs, the choice of VT tools should likewise be voluntary; (4) partnering yields good academic results, motivates students to work in groups, and affords greater satisfaction than traditional individualized study. These assumptions are a necessary corollary to the project’s aim to cater to each student’s interests, skills, and availability in a community as varied as the UNED’s student body.
The main working hypotheses in this piece of work are:
H1: Visual tools have a positive impact on learning, perceptible in academic results.
H2: Visual tools have a positive impact on learning, perceptible in student satisfaction after their use.
According to those hypotheses, action guidelines and results were sought in keeping with participant characteristics.

3.1. Data

The use of VT tools by geographically dispersed undergraduates with a diversity of profiles was based on three tasks.
Project participants were enrolled in “Investment and Financing”, a third-year undergraduate BA course or “Corporate Economy: Investment and Financing”, a second-year undergraduate economics course, delivered as semester courses in the first half of the 2016–2017 school year at the UNED’s Faculty of Economics and Management, with 662 students. Of them, 51 students participated voluntarily, were aware of the activities involved, and committed to completing them within the semester.
As a pilot study, it was important to have an active and motivated group that proves the interest of the activities and to ensure the representativeness of the responses received. Thus, within the field work, in turn, a questionnaire definition pilot plan was carried out.
Each student prepared two syllabus-based exercises, one chosen by the participant and the other assigned by the teaching team (to ensure that, taken together, all of the exercises covered the 10 key course topics). Exercises were allocated after the participating student base was established (Activity 1).
Each participant reviewed and, using a standard questionnaire, assessed some of their virtual classmates’ exercises (at least one per each of the 10 topics on the syllabus) to grasp the relative utility of the tool and its application by the user community (Activity 2a).
Students classified their own exercises and the ones they assessed (at least one per subject area) based on the existing taxonomy or using their own classification systems (Activity 2b).
A series of supplementary activities was undertaken to analyze the impact of visual thinking tools used by university students in a collaborative environment: VT instrumental technique- and content-related training, monitoring through teaching team and alumnus mentor videoconferencing, self-assessment, and information compilation to analyze project impact on students. The activities conducted under this initiative are listed in Table 2.

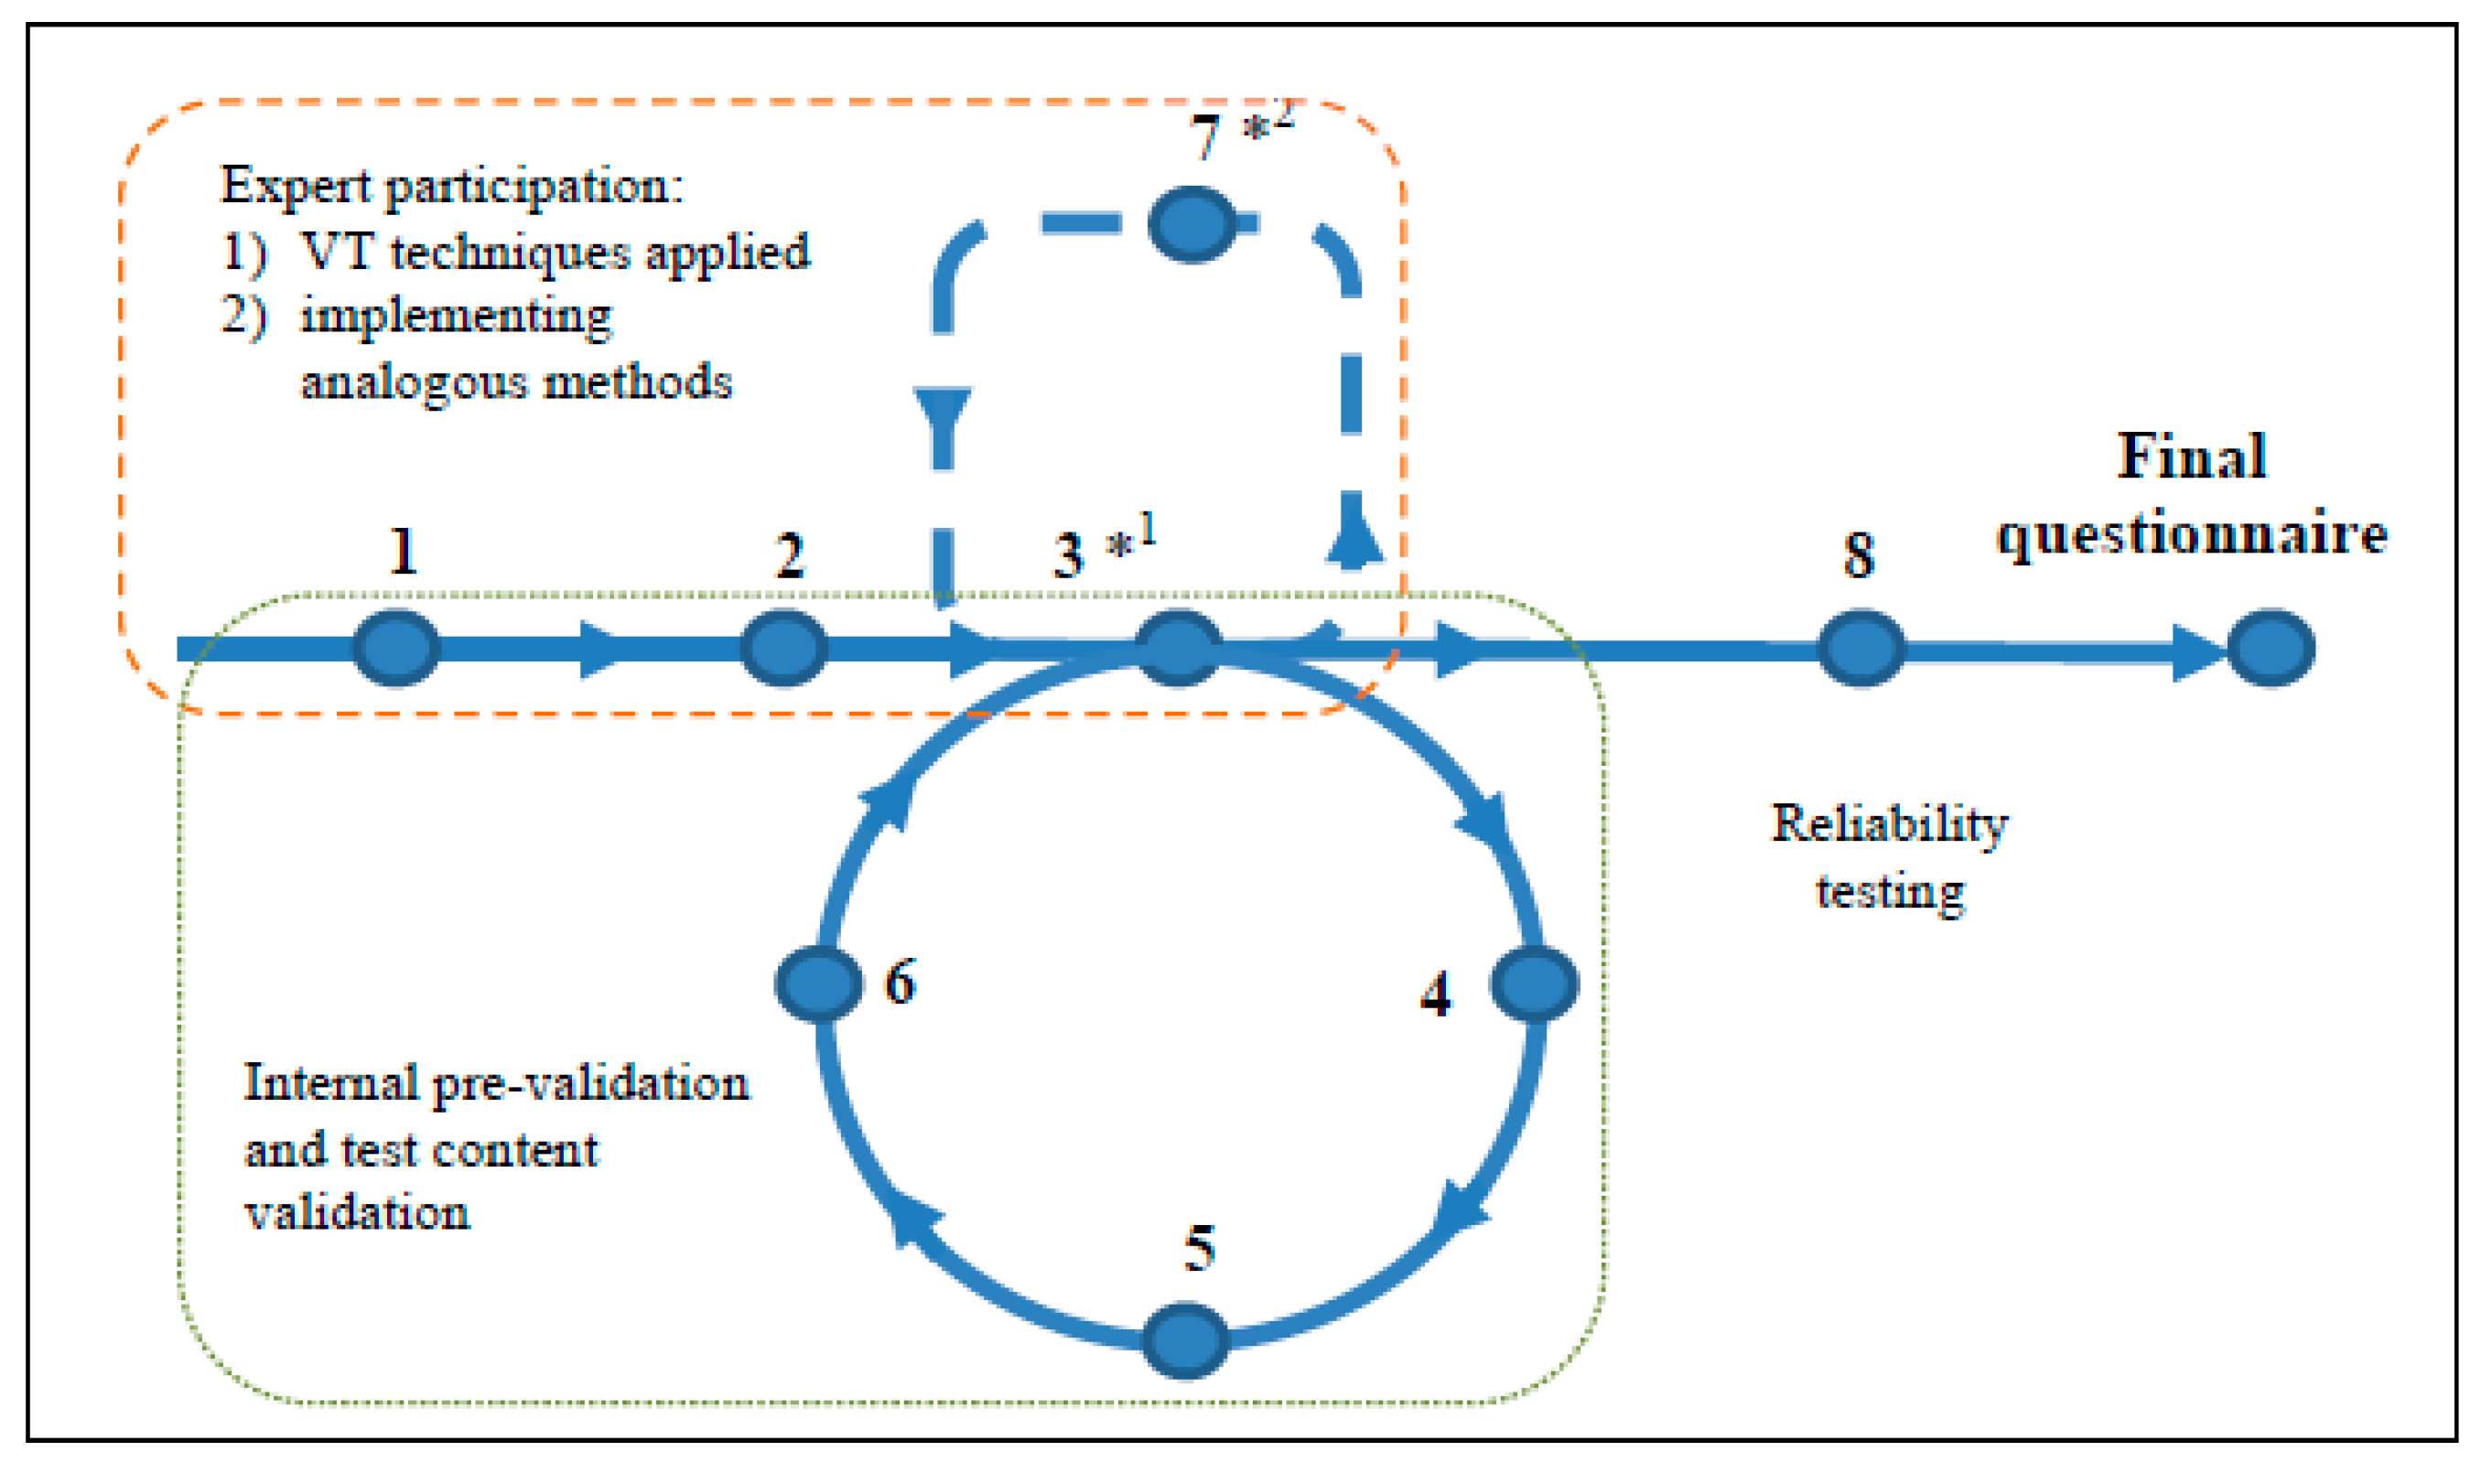
3.2. Questionnaire Design and Management: Pilot Test

Three surveys (pre- and post-project and appraisal of classmates’ visual exercises) were formulated to assess project impact. The pre-project survey aimed to identify the circumstances present at the outset, the interests and expectations of students who had showed an interest in participating in the project, and participant characterization. The post-project survey was designed to determine students’ opinions of the project’s modus operandi and course activities in terms of educational innovation, learning, fulfilment of expectations, applicability of VT techniques, and perception of the course and the project. The survey on appraisal of classmates’ visual exercises intended to assess the user-perceived quality of the exercises, ascertain the most significant parameters for defining quality (content, technique, format, etc.), and generate a collective user community taxonomy for the respective academic content. The questionnaires were created with Google Docs form tools around four types of questions: Five-point Likert scale (with 1 meaning total disagreement and 5 meaning total agreement with the statement), single-answer (two or more alternatives) closed multiple choice, multiple-answer closed multiple choice, and open questions.
One prominent outcome was a service-learning-like model in business management education, similar to Nikolova and Andersen’s [68], but run with a geographically dispersed student body exhibiting a diversity of profiles.
The questionnaires used in this study were designed as part of a longer-term project launched in 2017 and conducted over two academic years, during which the utility of the visual tools at issue was tested. This paper describes the results of the second academic year, as the first was devoted to selecting the visual tools adapted to the community targeted by the initiative, establishing the starting hypotheses, adjusting those hypotheses to the aim of the study, i.e., the identification of educational initiatives aligned with job offerings (through visual tools), and conducting a pilot test to design a set of questionnaires with which to assess the parameters defined. For that reason, the first year’s work is synthesized very briefly here.
The methodology applied to process the data is summarized below (see Figure 1):
  • Definition of questionnaire objectives and construct delimitation.
  • Definition of scope (content, target population, administration, structure).
  • Test item composition and number.
  • Item content.
  • Item definition and arrangement.
  • Test assessment by research team and content validation.
  • Pilot test: User interview: By telephone, involving 10 student volunteers (four men and six women, aged 23 to 48; M = 36; SD = 8.33) pursuing a degree in BA in year 0 of the educational innovation project. The aim of this cognitive pre-testing was to identify the most suitable questions, the ones best focused, any prompting a respondent’s reluctance to answer, and test duration (although the reward for participating in the project limited attrition substantially).
  • Reliability testing (Cronbach’s α = 0.949).

3.3. Data Analysis

The electronic files containing the questionnaire data were coded, and the findings were tabled and statistically analyzed using a two-stage procedure. The first, a univariate approach, analyzed students’ sociological characteristics, a description of course and project appraisals, and the effect of the project on their academic performance and expectations. The second, a bivariate analysis, aimed to detect possible relationships between respondents’ appraisals and a series of personal characteristics and to determine whether their mean scores were the same irrespective of such characteristics. According to routine practice, the F test (one-way analysis of variance (ANOVA)) was performed to test the null hypothesis, i.e., the absence of significant differences in the mean scores for each item within each characteristic. Student’s t, a specific case of the F test, was calculated for characteristics with just two values. The aim was to identify behavioral patterns associated with groups to determine initiatives deemed to be strategic by students that can be implemented by the university (the institution and teaching teams) to improve student performance and satisfaction. The market-oriented approach adopted sought to enhance students’ employability and acquisition of the skills, capacities, and attitudes demanded by today’s employers.

4. Results

The statistical analyses conducted included: Frequency analysis to describe the sociological characteristics of the sample, descriptive analysis to assess the activities proposed and students’ perceived impact, and analysis of variance (ANOVA) to ascertain the existence or otherwise of statistically significant differences in the mean marks calculated for the various groups. Contrast testing was also performed to analyze the impact of the VT project on participants’ final marks.

4.1. Sociological Characteristics of Project Participants

Of the 62 students who signed onto the project, 11, or 20%, dropped out, a rate within the normal range for the UNED’s student profile. Martín-García et al. [21] documented drop-out rates of over 30% in similar projects. Table 3 gives the profiles of the 51 students who completed all of the activities and answered all of the questionnaires.
As Table 3 shows, project participants were atypical of university students in terms of age, prior training, and extracurricular personal obligations. A substantial percentage (82.4%) were employed, and 100% claimed to have occupational (43.1%) or caregiving (23.5%) obligations or both (33.3%) that limited the time they could devote to study. A total of 27.45% had earned at least one university degree prior to enrollment in BA or economics. The student profile for this community fell within the normal UNED pattern: A wide range of ages (19–71, mean = 38.5), geographies, and level of schooling. Just 7.8% had participated in at least one prior teaching innovation project.
The first outcome of the project was the creation of a knowledge community to which all participants contributed from a dual perspective: As content generators as well as users and advocates of content formulated by others. The 105 visual exercises that constituted the first type of contribution entailed: (1) Manual formulation and subsequent digitization, (2) use of general market software (MSOffice, open access processors), and (3) a command of specific visual applications (such as Xmind and Mindnode). The techniques used were the ones recommended: 62.7% of participants applied mind mapping, 56.9% concept mapping, and 33.3% webbing. Sketchnoting, in turn, while not recommended, was chosen by nearly one in every three participants (31.4%). The second outcome consisted of 610 appraisals subsequently used to label content with a view to include it in a data warehouse as a collective knowledge base associated with the courses involved.
Students’ replies to the post-project questionnaire described above (Table 2) were revealing. Promisingly, 82.4% of participants consented to the identification and labeling of their exercises for use by other students or people interested in future editions of the project. Even more (84%) were willing to share them with classmates enrolled in the same undergraduate course, 75% with students in different courses, and 82% with anyone interested. They were less keen on sharing content on social networks, as only 58.8% agreed to upload their exercises to Facebook, Twitter, or Pinterest, and 27.5% refused to do so.
Prior to participation in the project, 64.71% of the students claimed to be unaware of visual tools or their application for professional or academic purposes, corroborating the initial hypothesis. That, together with the growing applicability of such tools in the business world, led to the choice of these VT techniques for the project at hand. According to the pre- and post-project awareness of the most common visual techniques, depicted in Figure 2, participants focused on the most useful techniques, disregarding others.
Their command of the tools proposed (mind mapping, concept mapping, and webbing) rose significantly, along with the mastery of others not proposed, sketchnoting in particular. Use of other tools that were initially unknown, such as word clouds, visual notes, infographics, and design thinking, also grew significantly. Although awareness of other tools also climbed, their presence was nearly negligible. Students reported that mind (80.4%) and concept (74.5%) mapping were the most useful techniques. Webbing was scored lower (52.9%) and, while not proposed, sketchnoting was judged highly by nearly half (47.1%) of the participants. New users scored the future utility of visual tools very highly: 74.5% of participants had recommended or would recommend them to others, and 70.6% were applying them in their everyday study or work routines or intended to do so soon.
The inference is that students viewed collaboration with others very positively. That positive experience will predispose them to workplace cooperation and inspire teamwork, which are so highly esteemed by employers. Students also had a positive opinion of VT tools that spur creativity in authors and users, with over three-quarters assimilating them into their daily routines and urging others to do so. The project contributed, then, to align the needs of potential employers to students’ skills, aptitudes, and interests.

4.2. Univariate Analysis of the Project and Its Effect on Academic Performance in Undergraduate Courses

Descriptive statistical analysis was conducted for evaluation of the course, project, associated activities, and perceived impact on academic performance. Items, means, medians, and standard deviations for the five-point Likert scale items on the questionnaire are given in Appendix A. In addition, the α coefficients for each section of the questionnaire are included.
Course evaluation: All of the course features analyzed were judged very highly by students. The item on teaching team response to queries posed by students scored most highly (4.67), followed by general satisfaction with teaching team assistance (4.65) and the utility of self-assessment for course work (4.57). The items on the other end of the scale were the accuracy of the final exam as a measure of students’ command of the subject matter (3.8) and the overall evaluation of traditional assessment procedures (3.98). Whilst students were most critical of the assessment procedures, they scored these items much higher than the 2.5 Likert scale mid-point. In today’s environment of increasingly demanding students, the challenge consists of maintaining such high satisfaction levels in future academic years.
Evaluation of project activities: First, students scored all of the project activities very highly, with a mean of over 4 on a scale of 5 for all of the items. The activity that scored most highly was self-assessment, with a mean of 4.57, followed by watching VT videos prepared by the teaching team, at 4.33. The activity with the lowest score, although still a very good 4.01, was mentoring. Students attached importance to peer contributions, scoring use of materials formulated by others (4.24), and classmates’ exercises (4.20) more highly than their own (4.12).
Assessment of project impact on the course: This was assessed in terms of a suite of items grouped into three major categories. The first was designed to analyze student perception of the impact of their participation on course work and results; the second analyzed project compliance with their expectations and the factors that were as significant as initially believed (fulfilment of expectations). The third, the analysis of the impact of project participation on marks, is discussed in Section 4.3.2. Participants responded positively to all four assertions, with means of at least 3.4 over 5. All students claimed that project participation had a positive effect on course work (4.43 over 5), although the other items on project impact on marks and results scored lower. The one with the lowest mean (3.41) was the perception that the time and effort invested were fairly reflected in the course mark. As the discussion below on bivariate analysis shows, that subjective perception was wholly unrelated to the actual effect of the project on students’ marks. Participants received the project very warmly; 88.24% would repeat the experience and 92.16% deemed that similar projects should be available for all courses. All of the items on fulfilment of expectations were scored at 3.9 over 5 or higher. The item most highly appraised, at 4.59, was learning to use visual tools. That finding attests to the need for program continuation, since one of the main objectives is for students to learn to apply VT tools. Student expectations around the teaching team were likewise fulfilled with respect to the utility of guidance furnished through both webinars (4.51) and virtual lessons (4.49). Mentoring received the lowest score (albeit an acceptable 3.7), perhaps due to comparison with the guidance afforded by the teaching team.

4.3. Bivariate Analysis

This section describes two types of findings: Student evaluation of the items on the questionnaire and project impact on their final mark, both bearing in mind the possible effect of their personal characteristics on their perceptions and marks. The study focused on the difference in the means between the groups defined by the characteristics listed in Table 3. The results of this analysis can be applied to academic decision-making (respecting both course and innovation project parameters).

4.3.1. Equality of Mean Scores for Questionnaire Items

Assuming the requisites for using ANOVA to be met, that procedure was applied to test for the equality of inter-group means in evaluation of the course, project, associated activities, perceived impact of participation on academic performance, and fulfilment of expectations. Table 4 lists only the differences detected.
The F statistical value showed that students’ mean evaluations of the course (F = 5.21; p = 0.00), project and associated activities (F = 6.645; p = 0.00), and fulfilment of expectations (F = 7.23; p = 0.00) were not statistically equal. Significant inter-group differences were detected in the following cases.
Women (4.83) scored the teaching team’s performance significantly more highly than men (4.5) (Student’s t = 2.14; p = 0.04). The timing of university studies also conditioned students’ evaluation. Those who enrolled the year after completing secondary school: (1) Appraised quarterly exams more highly, and (2) deemed that their pre-enrollment knowledge sufficed to take the course. That response attests to the need to reinforce content for students resuming training after a pause through refresher courses or materials adapted to that circumstance. Obligations that limit study time constituted a significant factor in the perception of course materials. The findings revealed that the value recorded for students whose primary limitation for study time was caregiving was much higher than the score for students whose primary limitation was paid work and for those limited by both factors (4.83/4.36/4.41 over 5).
The findings showed women’s evaluation of the project and associated activities to be higher than men’s in visual technique teaching materials (4.57 vs. 4.14), multimedia materials on course content (4.65 vs. 4.07), and alumnus mentoring (4.18 vs. 3.79). Reviewing classmates’ exercises was significantly more useful for BA (4.38) than for economics (3.94) students, even though the materials were the same for both. That may be because the less intense use of visual media in BA induced those students to value such materials more highly.
The ANOVA conducted to test for equality among the means on fulfilment of expectations yielded a value of 7.23 (p = 0.00). Significant inter-group differences were detected in the following cases. In terms of classmate assistance (use of content formulated by other students and an alumnus mentor), women reported significantly higher fulfilment of expectations than men. Students enrolled in BA (4.53) scored the use of content formulated by classmates more positively than participants studying economics (3.83). Prior participation in innovative teaching activities also conditioned opinions on the initiative. Students with no prior experience exhibited a higher mean score (4.66) than those who had participated in such projects (3.75).
Possible explanations include: (a) Some participants were already conversant with the tools introduced and expected to find others new to them, (b) activities in prior innovation projects were found more interesting (no indication of this was detected in any of the replies, even those to the open questions), or (c) first-time participants may have been drawn to the project by the nature of the visual techniques whilst the others signed on to continue with the good results obtained in earlier experiences. Significant age-based differences were also identified. According to a study of different possible groupings, the cut-off that proved to be most significant for decision-making was 35. The mean scores around project fulfilment of expectations showed that students that were 35 or under had a more positive view of classmate mentor guidance (4.32) and webinar or chat guidance sessions (4.82) than their older peers (with scores of 3.55 and 4.28, respectively). The explanation for that difference may lie in the independence and maturity of the latter, who would require less guidance from others.

4.3.2. Impact of VT Project on Participants’ Final Marks

Project impact on participants’ final marks was verified by contrasting the null hypothesis that the mean marks for project participants (µ1) and non-participants (µ2) were equal. According to the mean marks earned on the final exam by the two groups listed in Table 5, the participants’ mean mark (5.98) was significantly higher than the mark earned by nonparticipants (4.90) (Student’s t for the null hypothesis was 2.59 at p = 0.012), attesting as well to the objective utility of the innovation project. That implies that we can reject the hypothesis of equality of means and, consequently, we can conclude that the participants´ marks and non-participants´ marks are not the same, which proves that students who take part in our innovation project based on collaborative visual techniques get higher marks.
The null hypothesis (no significant difference in the means) was also tested for project participants and non-participants by the degree pursued by students. The findings given in Table 6 show no statistically significant differences in the mean marks earned by project participants and non-participants enrolled in economics. In contrast, the mean mark calculated for project participants studying BA was a significant 1.48 points higher than for non-participants in the same program. That finding, which confirms that BA students require more support than their economics counterparts, was corroborated by the BA students themselves, who valued the utility of the complementary visual materials formulated by their peers more highly than those pursuing a degree in economics.

5. Conclusions

Unemployment is a serious challenge that has been rising day by day. Skill development and creation of employment opportunities are key factors for addressing sustainable employment [69]. Evidence from contemporary literature suggests that Soft Skill Attributes contribute to the sustainable employment of the business graduates significantly [70]. Furtherance by higher education institutions of measures in line with labor market demands enables students to acquire skills and capacities that prepare them for working life and enhance their employability, in line with what was expressed by Laguna-Sánchez et al [71]. This study explored the importance of creativity and team working measured in terms of academic results and student satisfaction. The tools used were visual techniques and partnering within a knowledge creation and use community established explicitly for that purpose. The findings showed compliance with the starting hypotheses. On one hand, our innovation initiatives through collaborative activities improve learning, as the academic results showed. On the other hand, these initiatives have a positive impact on student satisfaction, as they improved students’ perception of course procedures. The fact that participation was the only motivation for participation in this initiative is remarkable. Of particular interest was the finding that, in the group of students that were already employed, by the end of the semester, collaboration was the general feature that was most highly valued. Teaching team monitoring and self-assessment exercises were deemed to be key course characteristics. Visual tools (especially mind and concept mapping) proved to have a positive impact on learning, both in terms of academic performance and student satisfaction. A large majority of participants became routine users and advocates of such tools, not only for academic but also for professional and personal use. Participation in the experience drove interest in other visual techniques, command of which reached very high levels, despite not being proposed or used in the project. Teamwork, so highly demanded by employers, was evaluated positively by students, not as recipients, but rather as participants willing to share the results of their work, attesting to their interest in contributing to the community of present and future users. The creation of knowledge communities therefore encourages teamwork and gears the educational offering toward the skills and capacities demanded by employers and by students that are already mainstream in the labor market.
Both findings suggest that students’ preferences concur with those of their present or potential employers. Educational institutions should focus on those elements, among others, which drive sustainable employment by working with students with family or occupational obligations, pursuing an employment-focused education for all. The conclusions applicable to students both at the beginning and throughout their careers when engaging in lifelong education include: (1) Follow-up activities are highly appreciated by students; (2) such activities should have a clear purpose-related focus, aligned with professional objectives and employer demands; (3) working groups and learning communities add considerable value for students, who take a very positive view of the importance of their own exercises and the use and assessment of those of others; (4) although incentives are the key for engaging students in initiatives that are not mandatory to pass their courses, when such initiatives are well defined, the incentives are appraised much less positively ex-post than the initiatives themselves; (5) such initiatives not only enhance engagement, but spur student satisfaction with the course and its parameters and have a direct effect on academic results; (6) the major university policy decisions to be made refer to: (6a) For under 35s, informal and social guidance through institutional mentoring and formal guidance via periodic chats or webinars throughout the course; (6b) refresher materials for students that are re-training after a pause.
The univariate and bivariate analyses, in turn, provide support for decision-making around courses and the curriculum overall by defining the factors determining academic performance and student satisfaction. The results show, according to the initial objectives of this piece of work, what profile characteristics (demographic, sociological, and psychographic) are linked to students´ satisfaction—and, thus, concerns and motivations—and academic results.
The main limitations of the study are related to the sample size and the pilot study nature of this initiative, which had an admission quota for a correct definition and execution of tasks and questionnaire design. That can be solved by automating field work activity management and introducing a peer-review test mechanism. These activities are ongoing and will be incorporated in successive editions of the innovation project, in order to start them up with all of the students enrolled in the course. In fact, the aim of the entire project was the implementation for all students enrolled in the course. This second phase will allow comparing the voluntary participant group’s results against those obtained after running the program activities for all students enrolled in the course.
The entire institution, along with its academic and institutional stakeholders and any others generating labor market impact, should be involved in the creation of immersive learning environments. In a similar vein, partnering would benefit highly from the construction of a network able to structure programs, content, and other elements required for students to acquire professional skills, thereby favoring the convergence between university offerings and labor market demands.
The future lines of research of greatest interest in this regard revolve around the activities associated with the experience described in the context of courses on finance. Other conclusions to be drawn from the findings allude to graduates’ financial skills, to which growing importance has been attached at all levels of education since the onset of the crisis. All of the findings described are being applied in the next stage of the research, currently underway. The team is presently expanding these activities to other BA finance courses, as well as creating a meta-search engine that will enable students to conduct intelligent searches filtered by the exercise name and author, visual technique used, and syllabus content based on the metadata available. The present findings and others not discussed here for lack of space are being taken into consideration in that endeavor. Semantic labeling is deemed to be a key factor by material users. In a second line of research exploring the most useful parameters for generating collective taxonomies (folksonomies), guidelines are being proposed to enhance the effectiveness of user definitions of the terms of greatest utility in collective knowledge creation.

Author Contributions

The authors contributed equally to this work. All the authors contributed to the conceptualization, formal analysis, investigation, methodology, writing of the original draft, and review and editing. All authors have read and agreed to the published version of the manuscript.

Funding

This research received no external funding.

Acknowledgments

The authors would like to thank all the referees for the time spent in this work, as well as the recommendations and suggestions made by them, which have contributed to the improvement of the paper.

Conflicts of Interest

The authors declare no conflict of interest.

Appendix A

Table A1. Descriptive statistics of the course evaluation, project, and activities.
MeanMedianStd Dev.Cronbach’s α
ItemCourse Evaluation 0.906
1I believe my pre-enrollment knowledge sufficed to take the course4.1240.82
2The study guide contains clear and detailed information on course content and procedures4.4140.67
3The basic ink print material on the course is clear and well suited to distance education4.3140.76
4The virtual supplementary materials provided are useful for course work4.3140.68
5The self-assessment activities are useful for course work4.5750.64
6The virtual lessons are clearly structured and organized4.3140.88
7The teaching team responds appropriately to students’ queries4.6750.52
8Participation in virtual lessons is useful for course work4.3940.67
9The information and examples on the final mark furnished by the teaching team help prepare the final exam4.3140.79
10The quarterly exams prepare the final4.2440.86
11The face-to-face (final) exam provides a fair measure of my command of course content3.8040.92
12I am generally satisfied with the course materials4.4950.54
13I am generally satisfied with the teaching team’s assistance4.6550.56
14I am generally satisfied with the assessment system3.9840.99
15I am generally satisfied with the training received4.4540.54
Project activities 0.904
20Time estimates furnished by teaching team4.2740.72
21Study and review of initial VT technique guide4.3340.65
22Watching teaching team’s VT videos 4.3340.74
23Formulating your own visual exercises4.1240.68
24Labeling your own visual exercises4.1840.68
25Review of classmates’ exercises4.2440.65
26Labeling classmates’ exercises4.0640.68
27Assessing classmates’ exercises4.2040.69
28Self-assessments4.5750.61
29Q&A videoconference sessions 4.2940.70
30Mentoring4.0140.82
Perceived effect of project participation 0.864
48The project contributed positively to course work4.4350.81
49The project improved course results3.9641.08
51Your mark fairly reflects the time and effort invested3.4141.25
52Project participation affected your mark3.8041.28
The project fulfilled your expectations relative to: 0.842
55Course work, study time optimization, and planning4.3751.06
56Expected improvement in academic results4.2451.34
57Extracurricular credits4.5751.33
58Teaching team guidance, particularly in virtual lessons4.4950.92
59Learning use of visual tools 4.5950.85
60Use of classmates’ visual content4.2751.13
61Alumnus mentor’s study guidance3.8841.32
63Utility of guidance webinars/chats4.5150.86
Source: Calculated by the authors from the results of the post-project questionnaire.

References

  1. Chiavenato, I.; Villamizar, G. Gestión del Talento Humano, 3rd ed.; McGraw-Hill: Ciudad de México, México, 2009; ISBN 978-97-0107-340-7. [Google Scholar]
  2. Armstrong, A.; Page, N. Creativity and Constraints: Leadership and Management in the UK Creative Industries; Creative Skill Set; Ashridge Business School: London, UK, 2015. [Google Scholar]
  3. Yordanova, S. Creativity as managerial competence. Rom. Econ. Bus. Rev. 2016, 11, 142–147. [Google Scholar]
  4. Seidel, S.; Rosenmann, R. Creativity Management-The New Challenges for BPM; BPM Trends. 2008. Available online: https://www.bptrends.com/creativity-management-the-new-challenge-for-bpm/ (accessed on 11 February 2019).
  5. Turkson, J.K.; Appiah, K.O. Managerial Creativity and Innovation: A Panacea for Organizational Change and Development. Glob. Bus. Econ. Anthol. 2010, 2, 117–126. [Google Scholar]
  6. World Economic Forum. Future of Jobs Report; World Economic Forum: Geneva, Switzerland, 2016. [Google Scholar]
  7. McMurray, S.; Dutton, M.; McQuaid, R.; Richard, A. Employer demands from business graduates. Educ. Train. 2016, 58, 112–132. [Google Scholar] [CrossRef]
  8. Riebe, L.; Girardi, A.; Whitsed, C. Teaching teamwork in Australian university business disciplines: Evidence from a systematic literature review. Issues Educ. Res. 2017, 27, 134–150. [Google Scholar]
  9. Australian Industry Group Deloitte Touche Tohmatsu. Skilling Business in Tough Times. 2009. Available online: http://hdl.voced.edu.au/10707/98810 (accessed on 11 February 2019).
  10. Harder, C.; Jackson, G.; Lane, J. Talent Is Not Enough: Closing the Skills Gap; Canada West Foundation: Calgary, AB, Canada, 2014. [Google Scholar]
  11. Robescu, L.D.; Manea, E.E. Improving Teamwork Skills of the Students by Extra Curricular Activities. Balk. Reg. Conf. Eng. Bus. Educ. 2015, 1. [Google Scholar] [CrossRef] [Green Version]
  12. Epure, M. University-business cooperation: Adapting the curriculum and educational package to labor market requirements. In Proceedings of the International Conference on Business Excellence, Bucharest, Romania, 30–31 March 2017; Volume 11, pp. 339–349. [Google Scholar]
  13. European Commission/EACEA/Eurydice. Structural Indicators on Graduate Employability in Europe—2016; Eurydice Report; Publications Office of the European Union: Luxembourg, 2016; ISBN 978-92-9492-447-6. [Google Scholar] [CrossRef]
  14. European Commission. Commission Staff Working Document Accompanying the Document Communication from the Commission to the European Parliament, the Council, the European Economic and Social Committee and the Committee of the Regions. A Renewed EU Agenda for Higher Education. 2017. Available online: https://eur-lex.europa.eu/legal-content/EN/TXT/?uri=SWD%3A2017%3A164%3AFIN (accessed on 26 April 2019).
  15. European Commission. Staff Working Document SWD. 195 Final, Annex II—Results of the Public Consultation on the EU’s Modernisation Agenda for Higher Education, 10.06.2016. Available online: http://ec.europa.eu/social/main.jsp?catId=1223&langId=en&moreDocuments=yes (accessed on 26 April 2019).
  16. OECD. The Future of Education and Skills. Education 2030. 2018. Available online: https://www.oecd.org/education/2030/E2030%20Position%20Paper%20(05.04.2018).pdf (accessed on 23 September 2019).
  17. Ministerio de Empleo y Seguridad Social. Plan Anual de Política de Empleo Para 2018. Boletín Oficial del Estado 2018, 77, 34109–34198. [Google Scholar]
  18. Hyerle, D. Visual Tools for Constructing Knowledge; Association for Supervision and Curriculum Development: Alexandria, VA, USA, 1996. [Google Scholar]
  19. Hyerle, D. Thinking maps: Visual tools for activating habits of mind. In Learning and Leading with Habits of Mind; ASCD: Alexandria, VA, USA, 2008; pp. 149–174. ISBN 978-14-1660-741-0. [Google Scholar]
  20. Antón, C.S.; Herrero, M.E.; Castillo, A.S.; Sartori, M. Los plurilenguajes en la construcción del conocimiento en los Talleres de Elaboración de Trabajo Final en las carreras de comunicación social de universidades nacionales. Actas de Periodismo y Comunicación 2016, 2. Available online: http://sedici.unlp.edu.ar/bitstream/handle/10915/60729/Documento_completo.pdf-PDFA.pdf?sequence=1&isAllowed=y (accessed on 16 December 2019).
  21. Martín-García, R.; Arguedas-Sanz, R.; López-Martín, C. La aplicación de técnicas de Visual Thinking en la materia de Finanzas en estudios de Grado. In Ensayos sobre investigación y experiencias docentes en Economía, Empresa y Turismo; UNED: Madrid, Spain, 2018; pp. 107–124. [Google Scholar]
  22. Jewitt, C. The Visual in Learning and Creativity: A Review of the Literature; Arts Council: London, UK, 2008; ISBN 978-0-7287-1401-4. [Google Scholar]
  23. Fan, R.J.D.; Tan, P.J.B. Application of Information Technology in Preschool Aesthetic Teaching from the Perspective of Sustainable Management. Sustainability 2019, 11, 2179. [Google Scholar] [CrossRef] [Green Version]
  24. Li, Y.; Wang, L. Using iPad-based mobile learning to teach creative engineering within a problem-based learning pedagogy. Educ. Inf. Technol. 2018, 23, 555–568. [Google Scholar] [CrossRef]
  25. Papadakis, S.; Kalogiannakis, M.; Zaranis, N. The effectiveness of computer and tablet assisted intervention in early childhood students’ understanding of numbers. An empirical study conducted in Greece. Educ. Inf. Technol. 2018, 23, 1849–1871. [Google Scholar]
  26. Ahmed, R.R.; Salman, F.; Malik, S.A.; Streimikiene, D.; Soomro, R.H.; Pahi, M.H. Smartphone Use and Academic Performance of University Students: A Mediation and Moderation Analysis. Sustainability 2020, 12, 439. [Google Scholar] [CrossRef] [Green Version]
  27. Ryan, M.; Ryan, M. Theorising a model for teaching and assessing reflective learning in higher education. High. Educ. Res. Dev. 2013, 32, 244–257. [Google Scholar] [CrossRef]
  28. Carter, S.; Sturm, S.; González Geraldo, J. Situating e-Learning: Accelerating Precepts from the Past. Int. J. Pedagog. Learn. 2014, 9, 1–9. [Google Scholar] [CrossRef]
  29. Kauffman, H. A review of predictive factors of student success in and satisfaction with online learning. Res. Learn. Technol. 2015, 23. [Google Scholar] [CrossRef] [Green Version]
  30. Wakefield, C.; Watt, S. Practical applications of teaching visual methods. In Teaching Visual Methods in the Social Sciences; Routledge: London, UK, 2017; pp. 203–214. ISBN 978-1-1381-0134-0. [Google Scholar]
  31. Bower, M.; Lee, M.J.; Dalgarno, B. Collaborative learning across physical and virtual worlds: Factors supporting and constraining learners in a blended reality environment. Br. J. Educ. Technol. 2017, 48, 407–430. [Google Scholar] [CrossRef]
  32. Kozhevnikov, M.; Kozhevnikov, M.; Yu, C.J.; Blazhenkova, O. Creativity, visualization abilities, and visual cognitive style. Br. J. Educ. Psychol. 2013, 83, 196–209. [Google Scholar] [CrossRef]
  33. Pezzino, M. Online assessment, adaptive feedback and the importance of visual learning for students. The advantages, with a few caveats, of using MapleTA. Int. Rev. Econ. Educ. 2018, 28, 11–28. [Google Scholar] [CrossRef] [Green Version]
  34. Nordstrom, K.; Korpelainen, P. Creativity and inspiration for problem solving in engineering education. Teach. High. Educ. 2011, 16, 439–450. [Google Scholar] [CrossRef]
  35. Vieira, E.R.; Alves, C.; Duboc, L. Creativity patterns guide: Support for the application of creativity techniques in requirements engineering. In International Conference on Human-Centred Software Engineering; Springer: Berlin/Heidelberg, Germany, 2012; pp. 283–290. ISBN 978-3-030-05909-5. [Google Scholar]
  36. Martin-Erro, A.; Dominguez, M.; Espinosa, M.D.M. Creativity and Engineering Design: Analysis into the educational environment. In EDULEARN15 Proceedings; IATED Academy: Valencia, Spain, 2015; pp. 1304–1310. ISBN 978-84-606-8243-1. [Google Scholar]
  37. Hayes, C.J. Adapting Visual Art Techniques via Collaborations with a Local Museum to Engage Students in an Interdisciplinary Chemistry and Art Course. In Liberal Arts Strategies for the Chemistry Classroom; American Chemical Society: Washington, DC, USA, 2017; pp. 99–112. ISBN 978-0-8412-3264-8. [Google Scholar]
  38. Carter-Templeton, H.; Fitzgerald, K.S.; Carter, M. Application of Concept Mapping as a Visual Thinking Strategy in an Asynchronous Online Graduate Informatics Course. CIN Comput. Inform. Nurs. 2016, 34, 331–335. [Google Scholar] [CrossRef]
  39. Davis, M.E. Bringing imagination back to the classroom: A model for creative arts in economics. Int. Rev. Econ. Educ. 2015, 19, 1–12. [Google Scholar] [CrossRef] [Green Version]
  40. Watts, M.; Christopher, C. Using art (paintings, drawings, and engravings) to teach economics. J. Econ. Educ. 2012, 43, 408–422. [Google Scholar] [CrossRef]
  41. Wooten, J.; Al-Bahrani, A.; Patel, D.; Holder, K. Art of econ: Incorporating the arts through active learning assignments in principles courses. J. Econ. Financ. Educ. 2016, 15, 1–16. [Google Scholar]
  42. McCabe, B. An integrated approach to the use of complementary visual learning tools in an undergraduate microbiology class. J. Biol. Educ. 2011, 45, 236–243. [Google Scholar] [CrossRef]
  43. Nikolian, V.C.; Ibrahim, A.M. What does the future hold for scientific journals? Visual abstracts and other tools for communicating research. Clin. Colon Rectal Surg. 2017, 30, 252–258. [Google Scholar] [CrossRef]
  44. Buhl, M. The Role of Visualizations for Digital Learning Designs in Collaborative Group Work. In Proceedings of the 17th European Conference on e-Learning, Athens, Greece, 1–2 November 2018; University of West Attica and Hellenic Air Force Academy: Athens, Greece, 2018; pp. 68–73, ISBN 978-1-912764-07-5. [Google Scholar]
  45. Jayaram, K.; Dorababu, K.K. Self learning materials in distance education system. Int. J. Curr. Res. 2015, 7, 21929–21934. [Google Scholar]
  46. Buzan, T. The Ultimate Book of Mind Maps: Unlock your Creativity. Boost Your Memory. Change Your Life; HarperCollins: London, UK, 2006; ISBN 978-0-0072-1291-0. [Google Scholar]
  47. Buzan, T.; Griffiths, C. Mind Maps for Business: Revolutionise Your Business Thinking and Practice; Pearson: Cambridge, UK, 2014; ISBN 978-1406642902. [Google Scholar]
  48. Zipp, G.; Maher, C.; D’Antoni, A.V. Mind Mapping: Teaching and Learning Strategy for Physical Therapy Curricula. J. Phys. Ther. Educ. 2015, 29, 43–48. [Google Scholar] [CrossRef]
  49. Somers, M.J.; Passerini, K.; Parhankangas, A.; Casal, J. Using mind maps to study how business school students and faculty organize and apply general business knowledge. Int. J. Manag. Educ. 2014, 12, 1–13. [Google Scholar] [CrossRef]
  50. Beel, J. Towards effective research-paper recommender systems and user modeling based on mind maps. arXiv 2017, arXiv:1703.09109. [Google Scholar]
  51. Franklin, A.; Li, T.; Jamieson, P.; Semlak, J.; Vanderbush, W. Evaluating metrics for automatic mind map assessment in various classes. In Proceedings of the 2015 IEEE Frontiers in Education Conference (FIE), El Paso, TX, USA, 21–24 October 2015; pp. 1–8, ISBN 978-1-4799-8455-8. [Google Scholar]
  52. Dina, N.Z.; Wuryanto, E.; Marjianto, R.S. Evaluation on the effectiveness of visual learning environment on programming course from students’ perspectives. IIUM Eng. J. 2019, 20, 100–107. [Google Scholar] [CrossRef]
  53. Novak, J.D. A Theory of Education; Cornell University Press: Ithaca, NY, USA, 1977. [Google Scholar]
  54. Novak, J.D. Concept mapping: A useful tool for science education. J. Res. Sci. Teach. 1990, 27, 937–949. [Google Scholar] [CrossRef]
  55. Novak, J.D. Clarify with concept maps. Sci. Teach. 1991, 58, 45–49. [Google Scholar]
  56. Novak, J.D.; Cañas, A.J. The origins of the concept mapping tool and the continuing evolution of the tool. Inf. Vis. 2006, 5, 175–184. [Google Scholar] [CrossRef]
  57. Colosimo, A.; Fitzgibbons, M. Teaching, designing, and organizing: Concept mapping for librarians. Partnership 2012, 7, 1–15. [Google Scholar] [CrossRef] [Green Version]
  58. Tseng, K.H.; Chang, C.C.; Lou, S.J.; Hsu, P.S. Using creative problem solving to promote students’ performance of concept mapping. Int. J. Technol. Des. Educ. 2013, 23, 1093–1109. [Google Scholar] [CrossRef]
  59. Schwendimann, B.A. Concept maps as versatile tools to integrate complex ideas: From kindergarten to higher and professional education. Knowl. Manag. E Learn. 2015, 7, 73–99. [Google Scholar]
  60. Connolly, H.; Spiller, D. Developing Knowledge Connections to Promote an Integrated Learning Experience for Students in a First Year Management Course. J. Manag. Educ. 2017, 41, 873–906. [Google Scholar] [CrossRef]
  61. Ayed, R.; Harrathi, F.; Gammoudi, M.M.; Farhat, M. A Mind map query in information retrieval: The ‘user query idea’ concept and preliminary results. Comput. Sci. Inf. Technol. 2014, 197–214. [Google Scholar] [CrossRef] [Green Version]
  62. Serrano, M.D.; da Cunha, E.F. Uso de las redes sociales por los alumnos universitarios de educación: Un estudio de caso de la península ibérica/Use of social networks by college students: A study case in the Iberian Peninsula. Tendencias Pedagógicas 2016, 28, 33–44. [Google Scholar]
  63. De Haro, J.J. Redes Sociales Para la Educación; Anaya: Madrid, Spain, 2010; ISBN 978-84-415-2796-6. [Google Scholar]
  64. Rodrigo, C.; Martín, R.; Arguedas, R. Adaptación multicultural de recursos educativos en abierto: Factores de éxito en el portal Openscout. El Profesional de la Información 2013, 22, 537–544. [Google Scholar] [CrossRef] [Green Version]
  65. Cabero, J.; Marín, V. Posibilidades educativas de las redes sociales y el trabajo en grupo. Percepciones de los alumnos universitarios. Comunicar 2014, 21, 165–172. [Google Scholar]
  66. Ruiz, R.M.; López, F.C.; Millán, J. Experimentando con las redes sociales en la enseñanza universitaria en ciencias. Revista Eureka Sobre Enseñanza y Divulgación de las Ciencias 2013, 10, 394–405. [Google Scholar]
  67. Messina, P.; Dominquez, V.; Parra, D.; Trattner, C.; Soto, A. Exploring Content-based Artwork Recommendation with Metadata and Visual Feature. arXiv 2017, arXiv:1706.05786. [Google Scholar]
  68. Nikolova, N.; Andersen, L. Creating Shared Value Through Service-Learning in Management Education. J. Manag. Educ. 2017, 41, 750–780. [Google Scholar] [CrossRef]
  69. Garimella, B.; Shenoy, S.; Pai, R.Y.; Shetty, R. Structured Education for Sustainable Employment: Technology enabled queueing theory applications. Found. Manag. 2018, 10, 75–86. [Google Scholar] [CrossRef] [Green Version]
  70. Nusrat, M.; Naz, K. Soft Skills for Sustainable Employment: Does it really Matter? IJMEI 2018, 4, 1835–1837. [Google Scholar] [CrossRef]
  71. Laguna-Sánchez, P.; Abad, P.; de la Fuente-Cabrero, C.; Calero, R. A University Training Programme for Acquiring Entrepreneurial and Transversal Employability Skills, a Students’ Assessment. Sustainability 2020, 12, 796. [Google Scholar] [CrossRef] [Green Version]
Figure 1. Questionnaire design. Notes: *1 Internal pre-validation (stages 1–6) and the pilot test (stage 7), in conjunction with the participation of outside experts (stages 1, 2, 3, and 7), led to an abridgement of the questionnaires and a redefinition of their content. *2 As the stage 3–6 loop had to be repeated once in the first round of telephone interviews for the initial and final surveys, a second round was required in both. In contrast, the questionnaire on the appraisal of classmates’ exercises called for only a single round of interviews, indicating that the results were apt for direct processing. The final design of that questionnaire was based on the five-point Likert scale routinely used in online surveys and deemed here to preclude bias in the measures of central tendency and the presence of logical error, according to the results of the aforementioned interviews.
Sustainability 12 02569 g001
Figure 2. Pre- and post-project command of visual thinking (VT) techniques.
Sustainability 12 02569 g002
Table 1. Types of visual tools.
Brainstorming WebsTask-Specific Graphics OrganizersThinking Process Maps
WebbingStoryboardsConcept mapping
Mind mappingTimelinesSystem diagrams
ClusteringProblem solvingThinking maps
Source: Hyerle [19].
Table 2. Project activity sequence.
DenominationPerformed
Initial surveyAt project outset
TimetableAt the beginning of the course
Visual thinking materialsAfter the second month
Activity 1: Own exercise using VT techniquesEvery two syllabus topics
Activity 2: Review, labeling, and appraisalAfter each syllabus topic (10 in all) according to timetable established by teaching team
Activity 3: Self-assessment testAfter each topic
Activity 4: Videoconference sessionsAfter each group of topics
Activity 5: MentoringTwo online sessions + continuous monitoring
Final surveyUpon project finalization
Table 3. Project participants’ sociological characteristics.
Sex Total
Male2854.9%
Female2345.1%
Age
35 or under 2243.1%
Over 352956.9%
Degree pursued
BA3262.7%
Economics1937.3%
Obligations possibly conditioning course work
Paid employment2243.1%
Caregiving1223.5%
Both1733.3%
Paid employment
Yes4282.4%
No917.6%
Working hours
Full time3058.8%
Part time1223.5%
Prior knowledge of VT
Yes1835.3%
No3364.7%
Prior participation in teaching innovation project
Yes47.8%
No4792.2%
Prior university training
No3772.5%
Yes1427.5%
Enrollment in BA or economics immediately after secondary school or other university courses
Yes2039.2%
No3160.8%
Table 4. Test analysis of variance (ANOVA).
Course Evaluation
ItemSexEnrollment in BA or Economics immediately after secondary school or other university courseObligations
MaleFemalet-testNoYest-testJobCaregivingBothANOVA
1 4.034.25−0.93
(0.04)
10 4.194.30−0.43
(0.02)
12 4.364.834.413.49
(0.04)
134,504.832.14
(0.04)
Project Activities
SexDegree pursued
MaleFemalet-testEconomicsBAt-test
214.144.57−2.41
(0.02)
224.074.65−3.0
(0.00)
25 3.944.38−2.36
(0.02)
303.794.184.43
(0.04)
Project Fulfilment of Expectations
SexAgeDegree pursuedPrior participation in teaching innovation project
MaleFemalet-test<35>35t-testEconomicsBAt-testNoYest-test
59 4.663.752.12
(0.04)
603.964.65−2.24
(0.03)
3.834.53−2.15
(0.04)
613.364.52−3.46
(0.00)
4.323.552.12
(0.04)
63 4.824.282.34
(0.02)
Source: Calculated by the authors from the results of the post-project questionnaire. The tables show only the differences detected. In brackets: p-values.
Table 5. Test for equality between mean marks earned by project participants and non-participants.
H0: μ1 = μ2; H1: μ1 ≠ μ2
ParticipantsNon-participants
Mean5.984.90
Std dev.2.863.00
Sample size51611
Student’s t2.589
p-value0.012
Table 6. Test for equality between mean marks earned by project participants and non-participants by degree pursued.
H0: μ1 = μ2; H1: μ1 ≠ μ2
EconomicsBA
ParticipantsNon-participantsParticipantsNon-participants
Mean5.034.556.555.07
Std dev.3.473.022.312.98
Sample size1920332408
Student’s t0.5783.404
p-value0.570.002

