1. Introduction
From the Millennium Development Goals (MDG) of the United Nations in 2000 to the Sustainable Development Goals (SDG) in 2015, eliminating poverty and inequality has been one of the top global priorities. Poverty can be divided into regional (place) and individual (person) poverty [
1]. Individual poverty and regional poverty are closely related, and they affect and interact with each other. Regional poverty often leads to a lack of internal motivation for individual development in a region. However, personal poverty leads to the slow social and economic development of the whole region and a lack of basic welfare, which eventually accumulates into regional poverty [
2,
3]. The World Bank (2006) divided the inequality in the economic field into two categories. One is the inequality of results, such as the distribution of income and wealth; the other is the inequality of opportunities, such as the opportunity to participate in economic activities, the opportunity to receive education, the opportunity to work, etc. Income inequality is an important manifestation of economic inequality. It measures the income distribution of participants in a particular economy, such as a country or region. Reducing poverty and inequality is increasingly a critical issue and challenge for most countries. As the world’s largest developing country and the world’s second largest economy, China’s rapid economic development is accompanied by imbalances in regional economic development. The spatial imbalance of regional wealth distribution is one of the most prominent features of regional development in China [
4]. In terms of the total Gross Domestic Product (GDP)of each province, Guangdong’s GDP (136.02 billion dollars) ranked first in 2018, while the lowest was Tibet, where it was only 19.57 billion dollars. Tibet, Qinghai, Ningxia, and other western provinces ranked lower, with a large gap in GDP between them and the eastern coastal provinces. In terms of per capita GDP, Beijing’s GDP per capita (19,568.7 dollars) was the highest in 2018. The per capita GDPs of central and western provinces such as Gansu, Yunnan, Guizhou, and Tibet were relatively low, ranging from 4333.1 dollars to 5730.8 dollars. As the world’s largest economy, the United States also has an imbalance of economic development. In 2018, California’s GDP was 2988.1 billion dollars, far exceeding Vermont’s 33.73 billion dollars. In terms of GDP per capita, the District of Columbia’s per capita GDP reached 200,000 dollars, while Mississippi had the lowest at only 37,949 dollars. In both developed and developing countries, regional poverty and inequality still exist and vary greatly. Excessive regional inequality not only affects regional sustainable development, but also affects social harmony and stability. Therefore, accurately, efficiently, and objectively measuring regional poverty and inequality is a key procedure in achieving regional coordinated development.
To measure poverty and inequality in regional economic development, a large number of works of literature have evaluated regional poverty and inequality from different perspectives and using different methods. These studies used different measures to assess inequality, including coefficient of variation, generalized entropy index [
5,
6], Gini coefficient [
6,
7,
8], Theil index [
7,
9], and Atkinson’s coefficient [
6]. The main methods used to measure regional poverty are one-dimensional poverty measurement methods and multidimensional poverty measurement methods [
10]. The statistics used are often derived from local governments, and there are lags (for example, the most up-to-date annual statistical yearbook will be released in September–October of next year in China) and high survey costs (censuses or surveys require lots of time and money). In addition, economic indicators such as GDP or per capita GDP are often used as the only indicators to study the inequality of regional economic development in China [
11,
12]. However, using only GDP indicators cannot accurately assess regional poverty, distinguish regional cost and benefits, sustainable and unsustainable behavior, and productive and destructive activities [
5]. Therefore, the issue of how to measure regional poverty and inequality in a timely, accurate and effective manner is a problem that needs to be overcome.
In this context, the emergence of the Defense Meteorological Satellite Program Operational Line Scanner (DMSP/OLS) remote sensing Night-Time Light (NTL) data provides a new perspective for exploring human economic activities. Compared with traditional methods, NTL images have many advantages, including the close relationship between NTL and human residential areas, easy access, relative objectivity, high computational efficiency (such as the small amount of data), wide spatial coverage, and a relatively long time span [
13]. Since the late 1990s, numerous studies have shown that Night-Time Light (NTL) satellite imagery is highly correlated with socioeconomic parameters including urbanization, economic activity, and population [
14,
15,
16,
17,
18,
19,
20,
21,
22,
23]. The DMSP/OLS data set spans from 1992 to 2013 and has a long time series of 22 years. Many NTL studies were based on these data but were discontinued in 2013. In addition, DMSP/OLS has shortcomings such as low spatial resolution, oversaturation of lighting data, and lack of on-board calibration and correction for satellite interannual differences. At the beginning of 2013, the Earth Observation Group of the National Oceanic and Atmospheric Administration (NOAA)/ National Geophysical Data Center (NGDC) in the United States released a new generation of night-time light composite data from the Visible Infrared Imaging Radiometer Suite (VIIRS) Day Night Band (DNB) carried by the Suomi National Polar-orbiting Partnership (NPP) satellite [
24,
25]. The new generation of night-time light data NPP/VIIRS has made some improvements to DMSP/OLS data. It eliminates three key problems that plague conventional satellite programs: oversaturation, overshine, and lack of airborne alignment. At the multiscale level, VIIRS data are superior to DMSP/OLS data in detecting and estimating socioeconomic dynamics. Due to the above advantages of NTL data, some scholars have used night-time light data to study regional poverty and inequality [
5,
6,
7,
9,
10,
26,
27]. These studies suggest that NTL data can be used to estimate poverty and socioeconomic disparities. However, most studies have focused on large-scale regional poverty and inequality. For example, Christian et al. used DMSP/OLS night-time lighting data to predict local per capita income in 180 countries from 1992 to 2012. Based on these projections, income inequality in different regions was calculated [
6]. Elvidge et al. used population data and DMSP/OLS night light intensity to generate national and sub-national maps of global poverty [
27]. Wu et al. used the revised NPP/VIIRS NTL data and combined them with the two-stage nested Thiel decomposition method to study multiscale horizontal regional inequalities in Chinese provinces from 2014 to 2017 [
9]. However, in the context of globalization and urbanization, the current economic development trend has changed from a single urban development to an urban agglomeration development pattern relying on a central city, which is the core to drive the growth of the surrounding cities and the regional economy. An urban agglomeration can allocate economic resources in a larger scope, enhance the radiation capacity of the economy, and improve the industrial structure and the quality of economic development in the region. The balanced and coordinated development of the overall economy is of great significance to the economic development of the agglomeration itself and the surrounding cities [
28,
29,
30]. At present, China has formed ten major city clusters, and will further promote nine regional city clusters. As the region with the highest level of urbanization and the most developed economy, the eastern coastal areas of China have formed four major urban agglomerations including Beijing-Tianjin-Tangshan, Yangtze River Delta, Pearl River Delta and Shandong Peninsula. Although the social and economic development of coastal urban agglomerations has made great achievements, it is also faced with the pattern of unbalanced regional development. For example, as the largest city cluster in China, the GDP ranking of the Yangtze River Delta city group in 2018 saw Shanghai ranked first with 467.14 billion dollars, while Chizhou ranked last with 9.79 billion dollars, a difference of nearly 48 times. Even in the same province, the GDP difference between Hefei and Chizhou is 11 times (are located in Anhui Province). Therefore, it is the focus of this paper to understand the status of regional economic development in urban agglomerations and to estimate regional economic differences.
Based on a literature review, it is appropriate to use NPP/VIIRS NTL data to analyze poverty and inequality in large-scale regions. However, a poverty assessment from large-scale research cannot be directly applied to results that are on a more detailed scale. Therefore, this study uses traditional statistics and NPP/VIIRS NTL data as data sources. It is worth noting that the current NPP/VIIRS images have some defects; Shi et al. [
31] pointed out that under the influence of solar light, VIIRS DNB composites in summer have no data pixels at high latitudes in the northern hemisphere. In addition, the image products have not removed temporary lights such as fires and fishing boats, which affects the accuracy of subsequent evaluations. Finally, there is contamination from seasonal noise, which is manifested by higher radiation in winter images and lower radiation in summer images. Therefore, it is necessary to pretreat the existing VIIRS DNB composites to estimate the socioeconomic factors more accurately. In order to overcome the above problems, Shi et al. [
31], Li et al. [
24], and Ma et al. [
32] proposed improved methods for NPP/VIIRS, which were recognized by many scholars [
5,
7,
9]. In this paper, NPP/VIIRS NTL data are modified by referring to the methods of the above scholars. In addition, we focus on the dynamics of regional poverty and inequality on small and medium scales from 2012 to 2018, not just one year. Regression analysis was used to examine the correlation between the comprehensive poverty index, Theil index and NPP/VIIRS NTL, to verify whether the NPP/VIIRS data can be used as an alternative data source for estimating poverty and inequality in city clusters. Finally, the factors affecting regional poverty and inequality in city clusters are analyzed.
2. Materials and Methods
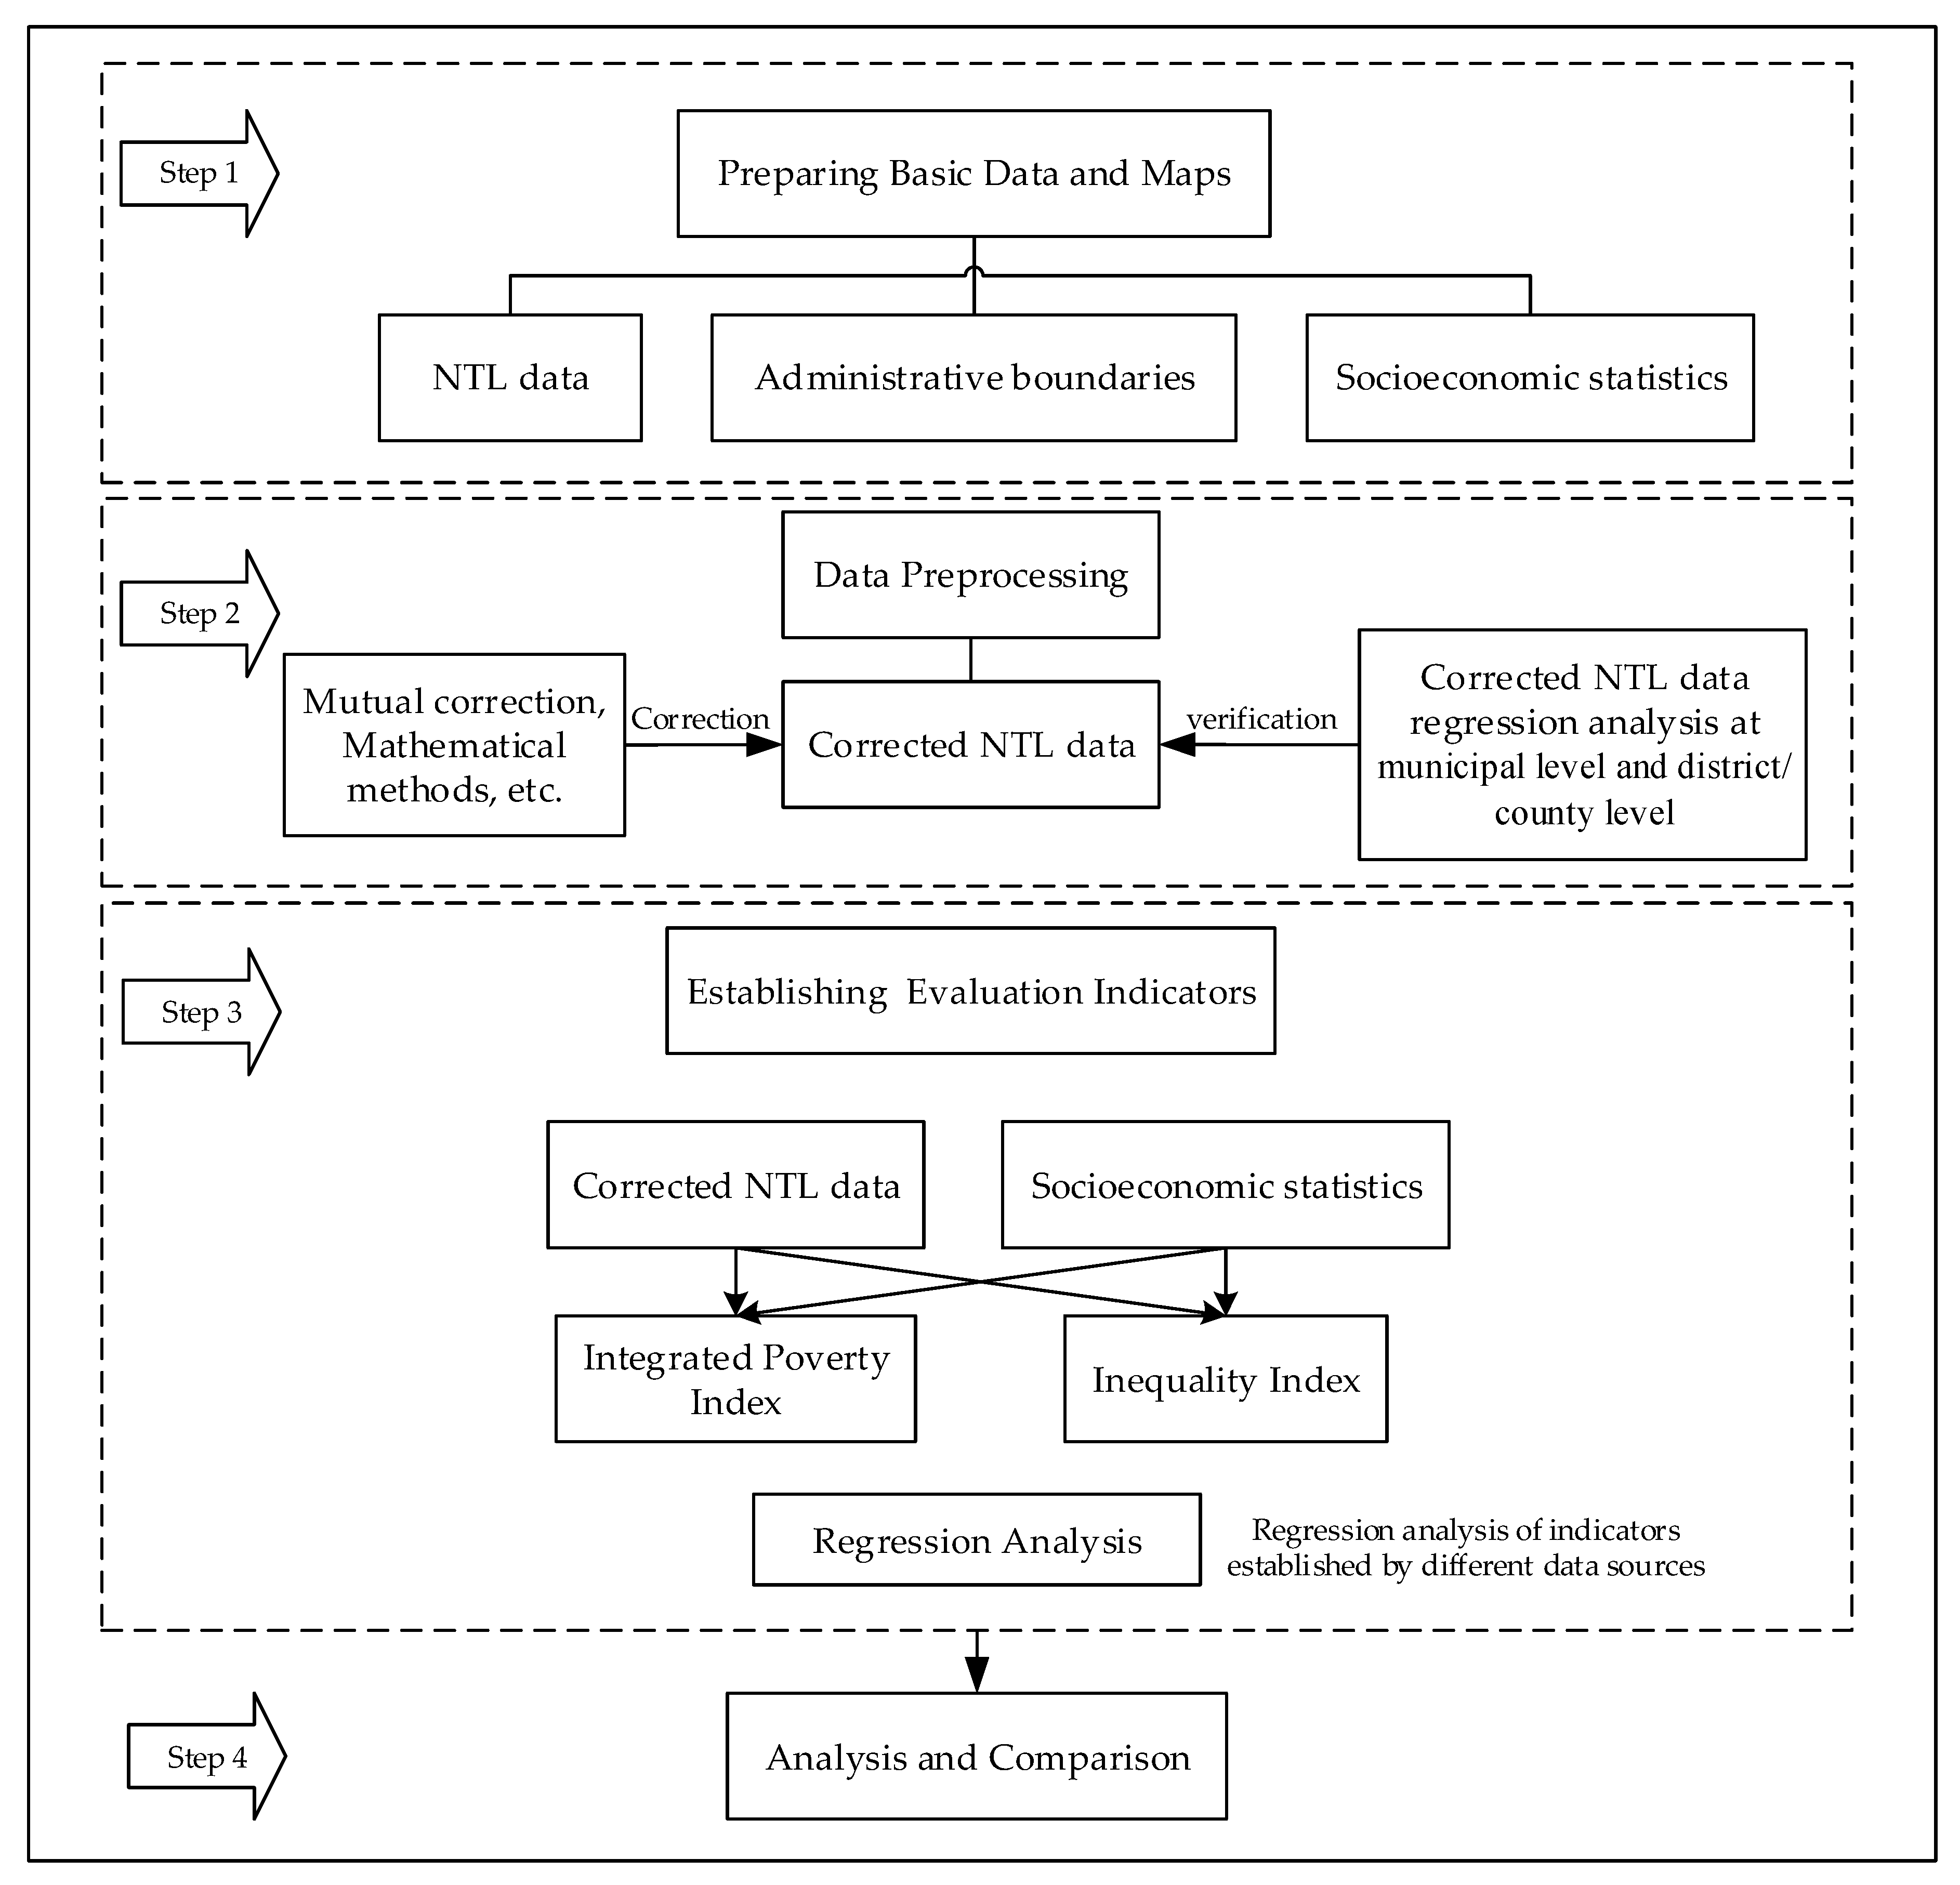
Four main steps were used to measure poverty and inequality in city clusters using socioeconomic statistics and NTL data: Firstly, the basic data needed for evaluation indicators were collected. Secondly, the NTL data were corrected by referring to previous studies. Thirdly, the integrated poverty index and inequality index were created by using socioeconomic statistics and NTL data, respectively. Finally, the spatiotemporal poverty and inequality of urban agglomerations from 2013 to 2018 were compared and analyzed (
Figure 1).
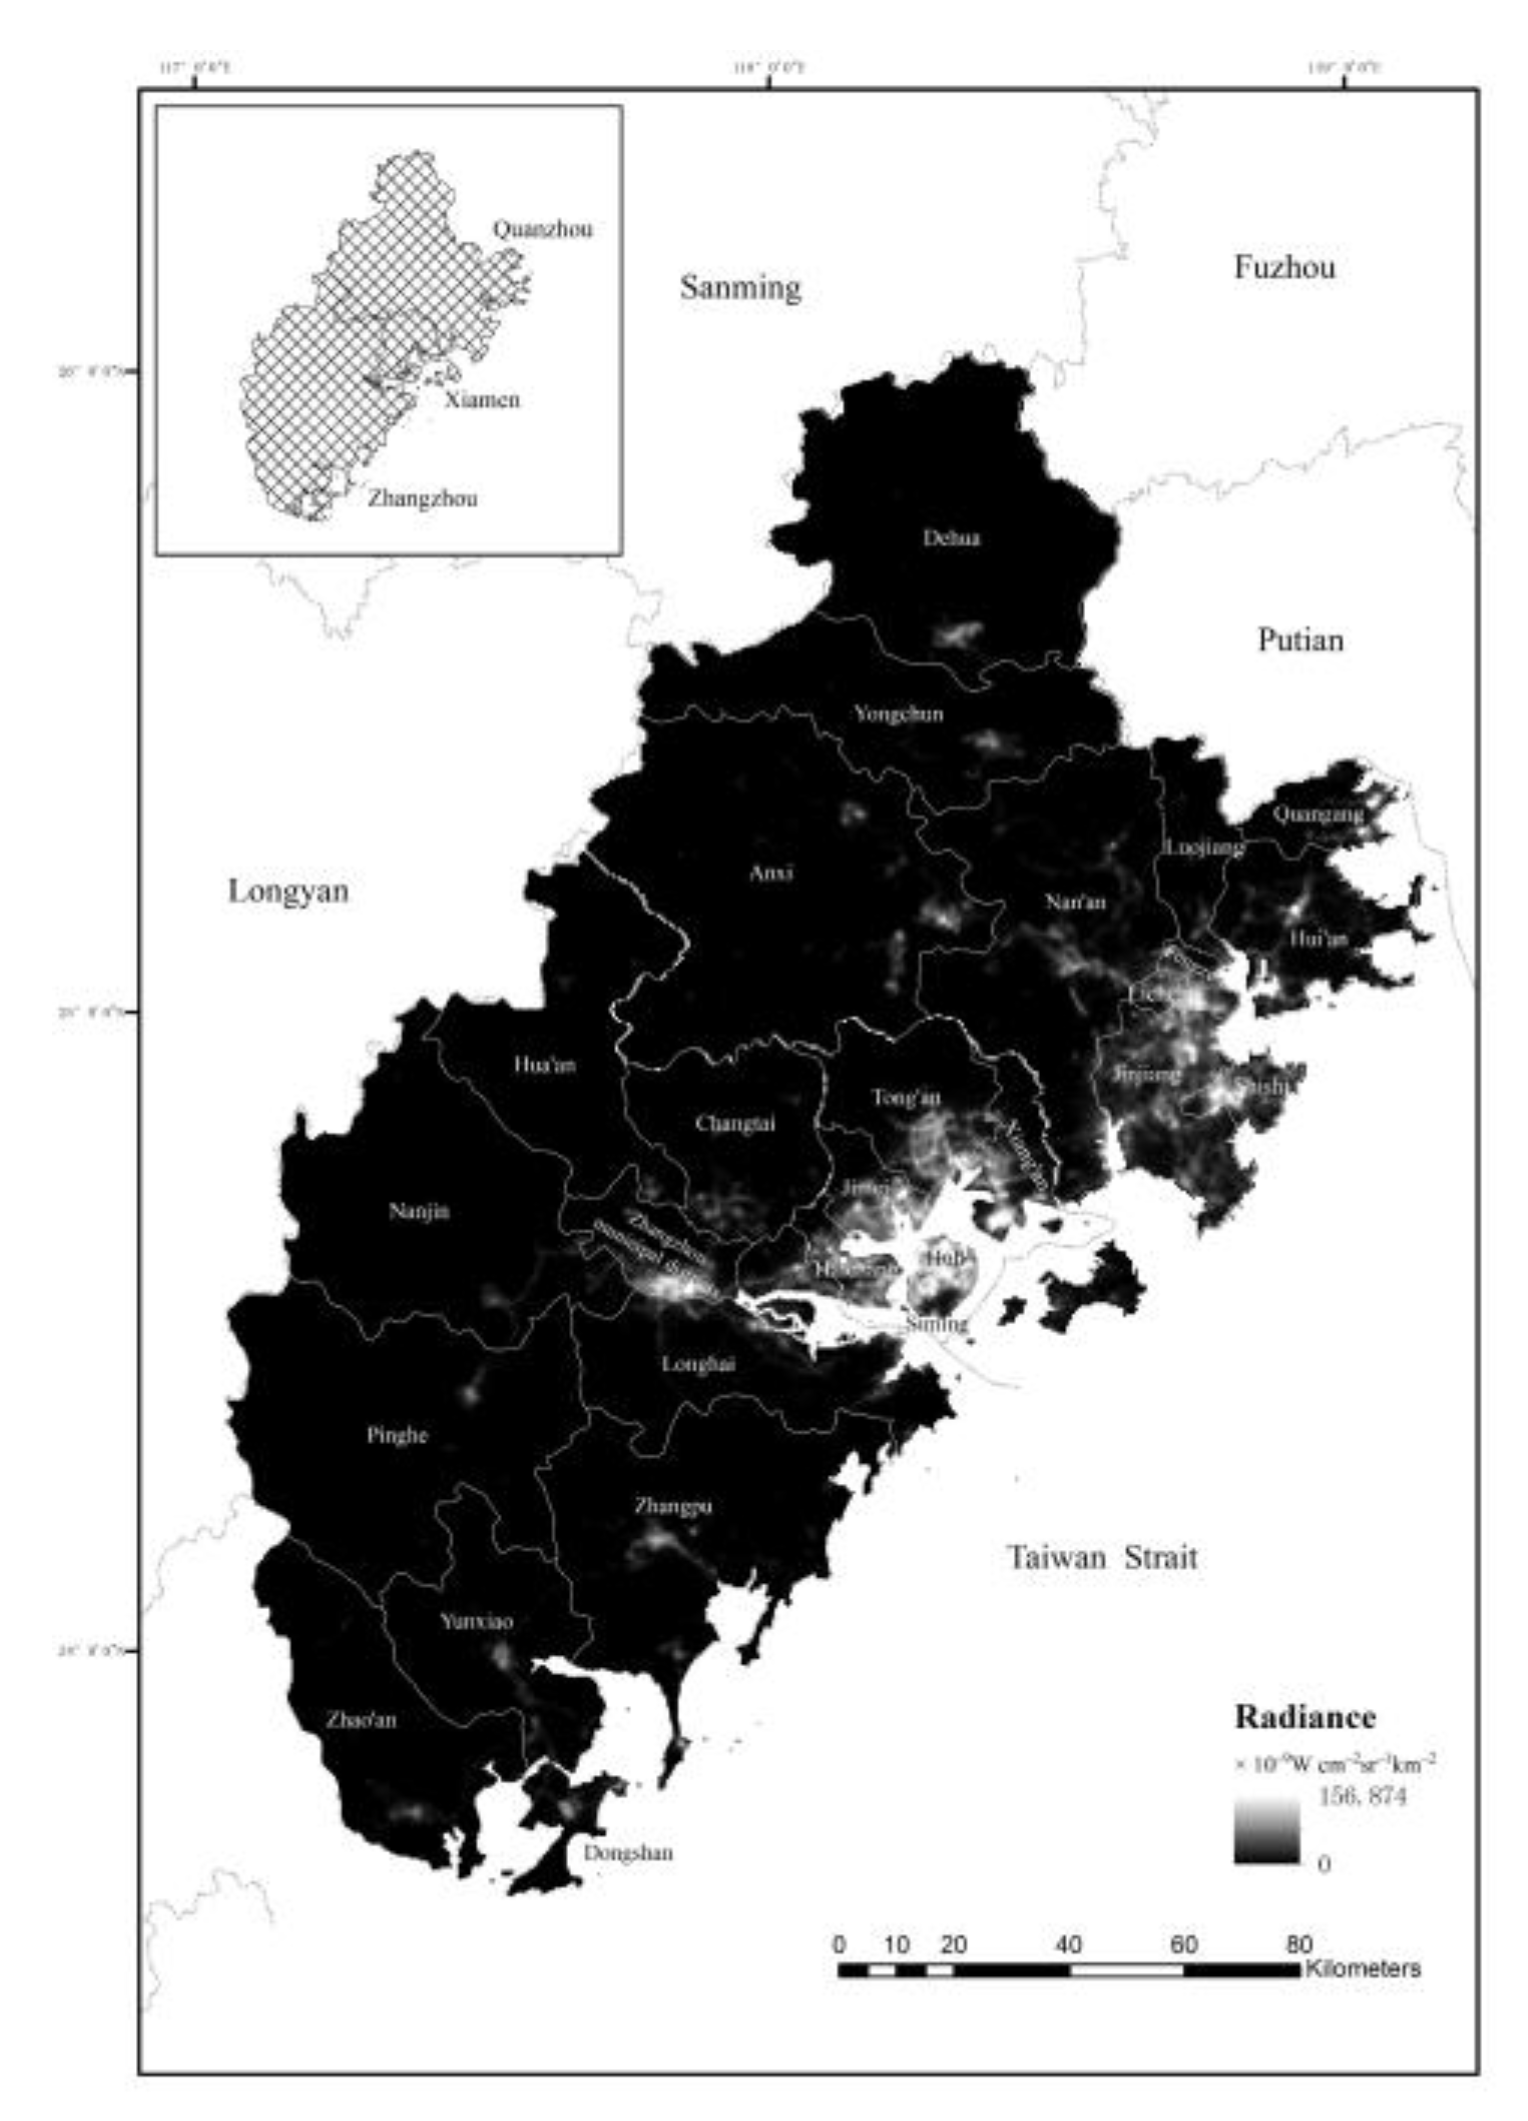
2.1. Overview of the Research Area
The Xiamen-Zhangzhou-Quanzhou city cluster (116°53′E-119°01′E, 23°33′N-25°56′N) is located on the southeast coast of China (
Figure 2).
Xiamen-Zhangzhou-Quanzhou is a city group developed earlier in the economic zone on the western coast of the Taiwan Straits, and the urban space system has long been formed. However, the development of the city cluster has been affected by the fault points of the Yangtze River Delta city cluster and Pearl River Delta city cluster (the Xiamen-Zhangzhou-Quanzhou city cluster is located between the two city clusters); the development quality of the urban cluster is not high, and the spatial development is not perfect. In order to improve the economic development of the city cluster, since the founding of the People’s Republic of China 70 years ago, Fujian Province has provided a multiregional advantage in the core areas of China’s 21st century Maritime Silk Road, special economic zones, and free trade pilot zones. It has made important achievements in social development. Among them, Quanzhou City is one of the starting points of the Maritime Silk Road, and its GDP output value is the first in the province. The proportion of the three major industries is 2.4%:57.7%:39.9%, and secondary industry is dominant. Xiamen City has the smallest administrative area, and it has a unique economic and policy advantage as a special economic zone. The proportion of the three major industries is 0.5%:41.3%:58.2%, and tertiary industry is dominant. As the largest plain in Fujian Province, Zhangzhou City has a unique agricultural advantage. The three major industries account for 11.1%:47.8%:41.1%, and Zhangzhou’s primary industry far exceeds those of Xiamen and Quanzhou. The three cities together constitute a provincial city cluster. The proportion of secondary industry in the Xiamen-Zhangzhou-Quanzhou city cluster is higher than that of tertiary industry, and the proportion of tertiary industry is relatively low. Only Xiamen’s tertiary industry accounts for more than 50%, which indicates that the economic development of the Xiamen-Zhangzhou-Quanzhou city cluster is driven by manufacturing industries, and the industrial structure is not reasonable.
2.2. Data Source
Due to the lack of data on a fine scale, in order to improve the accuracy of poverty and inequality measurement in the Xiamen-Zhangzhou-Quanzhou city cluster, we adopted two different data sources. One is night-time light imagery, and the other is socioeconomic statistical data.
This study mainly relied on one-monthly cloud-free versions of VIIRS NTL composites from April 2012 to December 2018 (
https://www.ngdc.noaa.gov/eog/viirs/download_dnb_composites.htm). Both the “vcm” (any data impacted by stray light were excluded, which resulted in the product containing a large number of missing values and discontinuous space and time) and “vcmsl” (stray light-impacted data were corrected and would have more data coverage toward the poles, but would be of reduced quality) versions of monthly composites were used. Before synthesizing the annual composites, the VIIRS NTL data were first filtered to eliminate the effects of stray light, lightning, lunar illumination, and cloud cover. The study area is in a low latitude area, and the summer NTL is less affected by stray light.
The seven-year socioeconomic statistical data (from 2012 to 2018) for the selected 28 regions were obtained from the municipal statistical office. The administrative boundary data of the study area were derived from the China National Geographic Information Center.
2.3. Time-Series NTL Preprocessing
Preprocessing of the original monthly NTL image involved the following steps. Firstly, in order to reduce the distortion of the projected area, all the night light data were projected into Albers equal-area conic projection. Secondly, stray light-impacted values (zero in the vcm version of monthly composites) were replaced by vcmsl values from the same month. For April 2012–December 2013, “vcm” images were not affected by stray light from default stray because “vcmsl” images for these months were not available in 2012–2013. Thirdly, manual processing of obvious outliers was carried out (assign digital number (DN) values less than 0 to zero, such as −0.15, −0.01, etc.; assign a value significantly larger than the normal DN value to the DN value of adjacent months, such as 432.12, 2174.33, 4789.68, etc.). Fourthly, the Savitzky–Golay (SG) filter was adopted to remove abnormal observations in the NTL time series while preserving its overall trends. It is a simplified least-square-fit filter developed for smoothing and computing derivatives of a set of consecutive values [
33] and has been applied intensively in remote sensing analysis [
34,
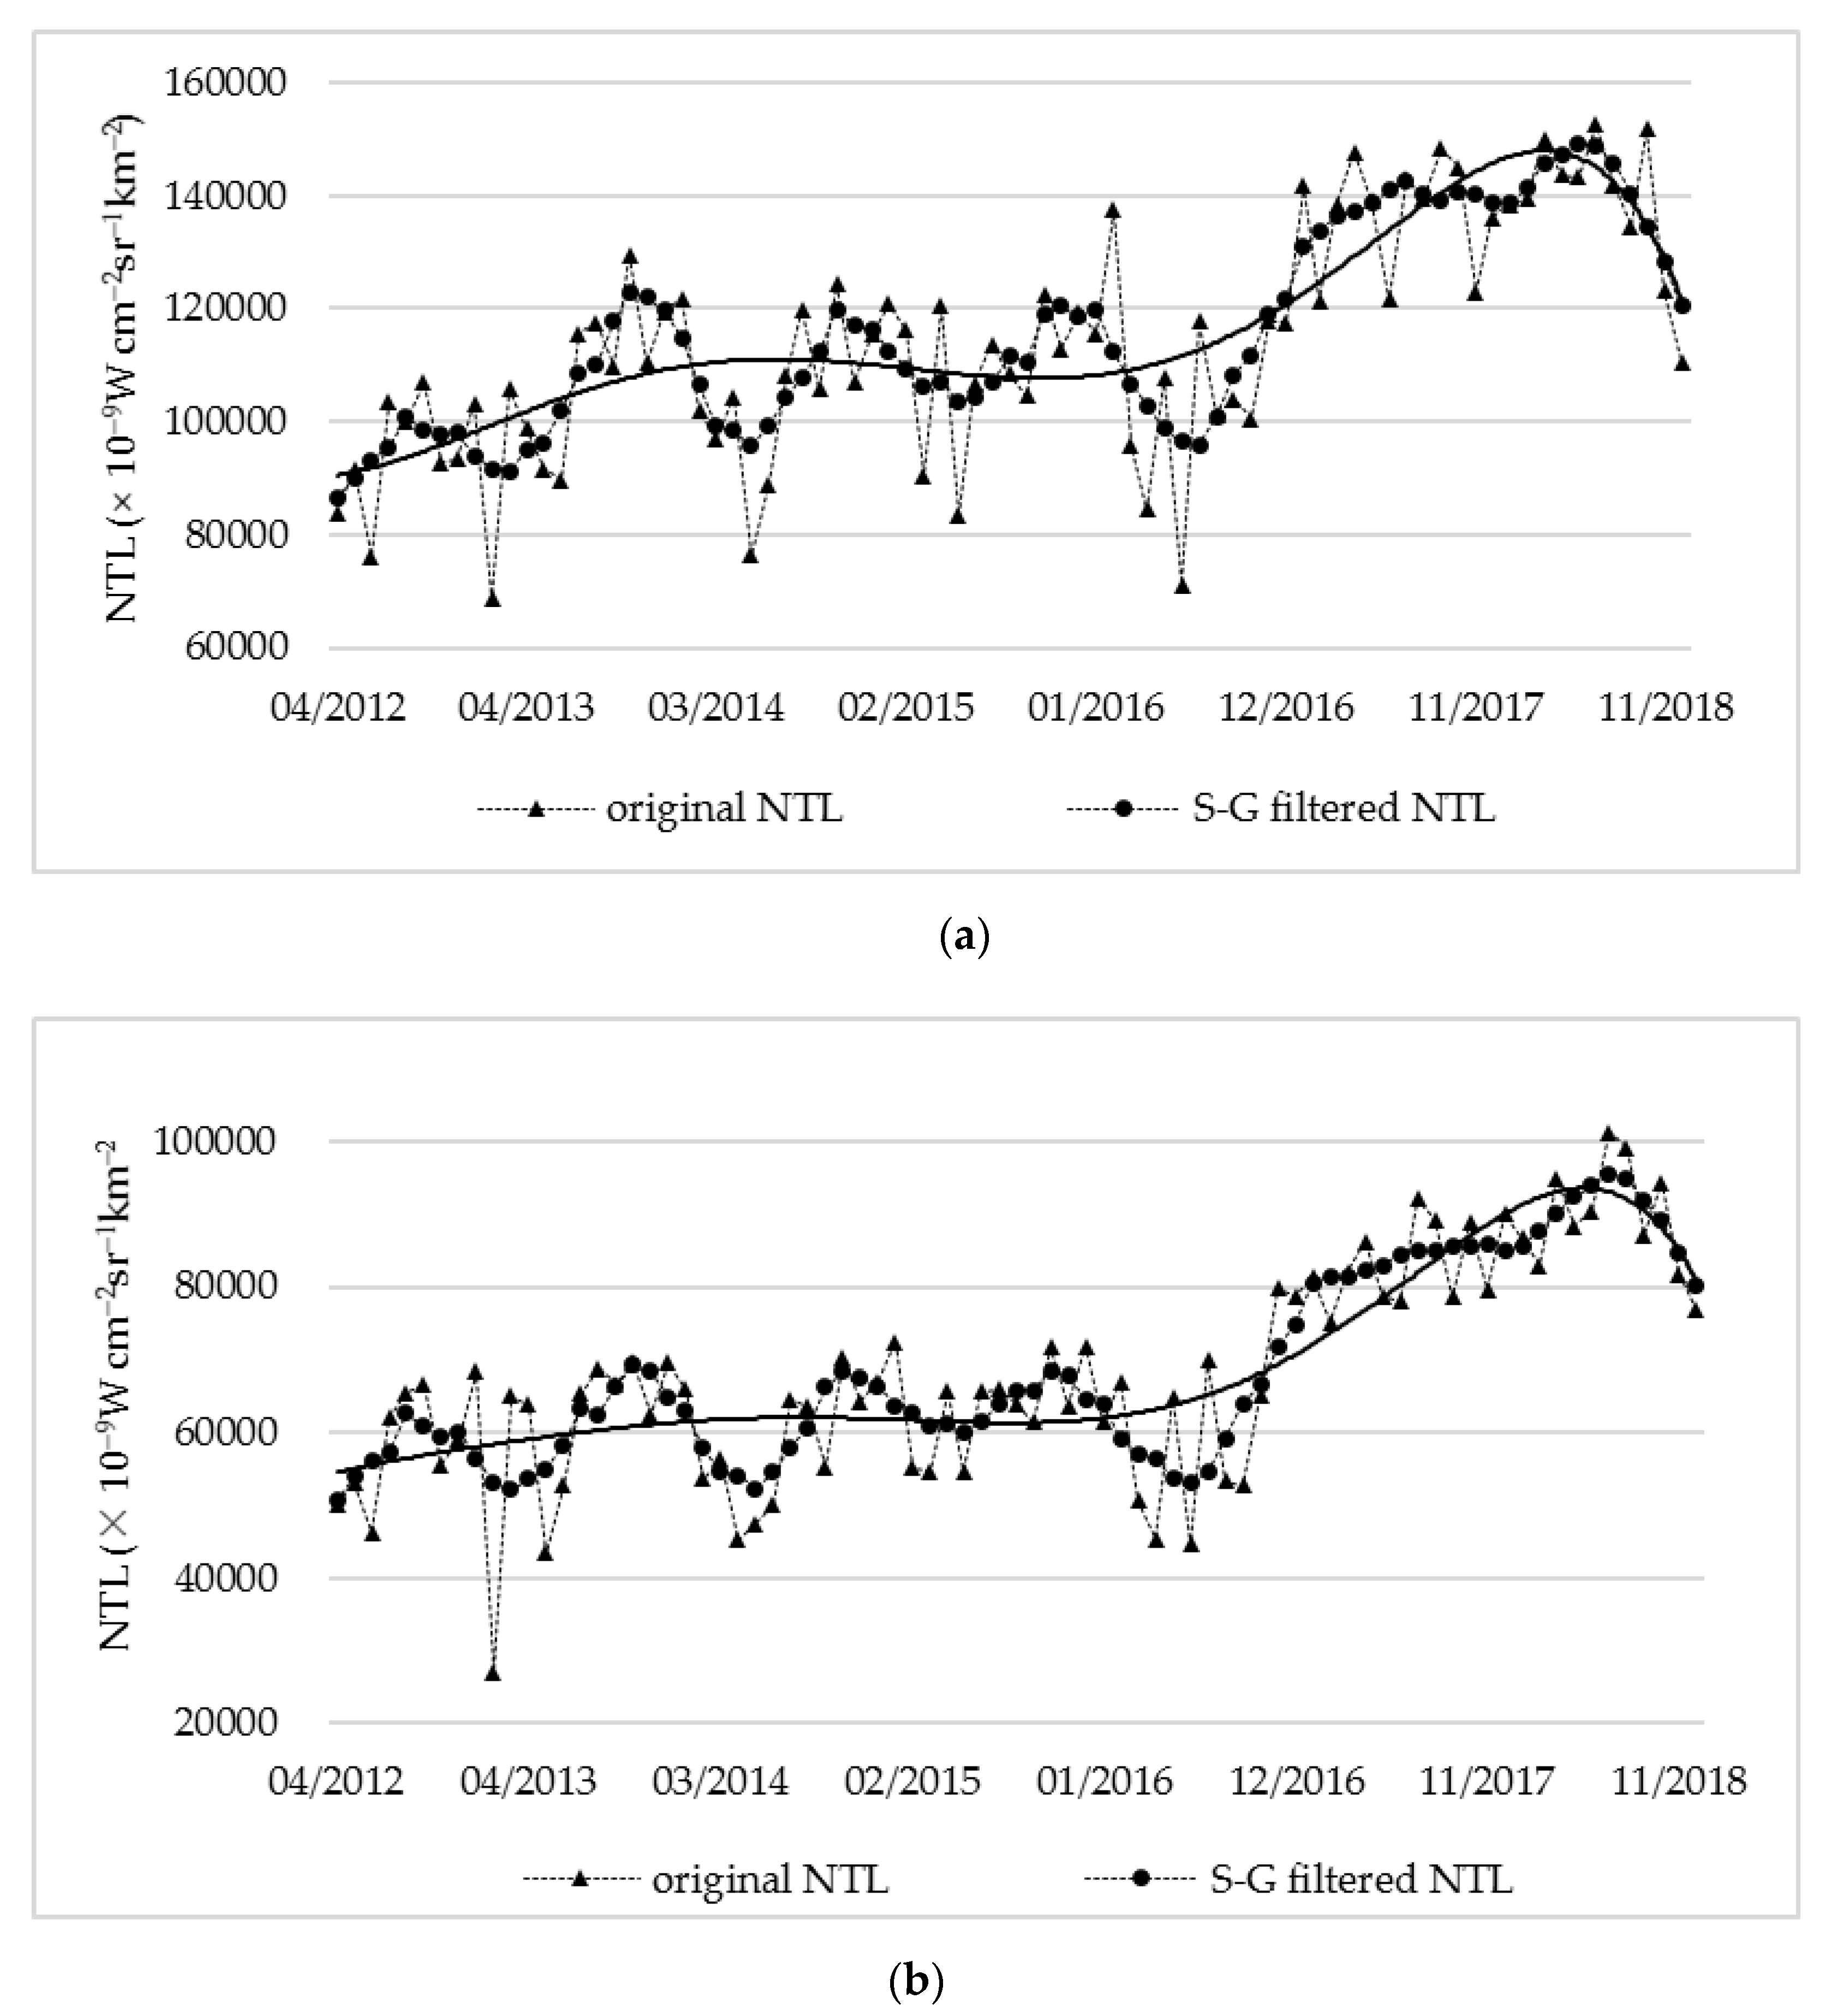
35]. Finally, in this study period, there were almost no annual composite materials (except 2015), and the NTL of the whole year in the study area was not affected by snow cover. Therefore, the average light intensity of monthly NTL in each year was used to represent the average light intensity of the whole year. The final corrected data are shown in
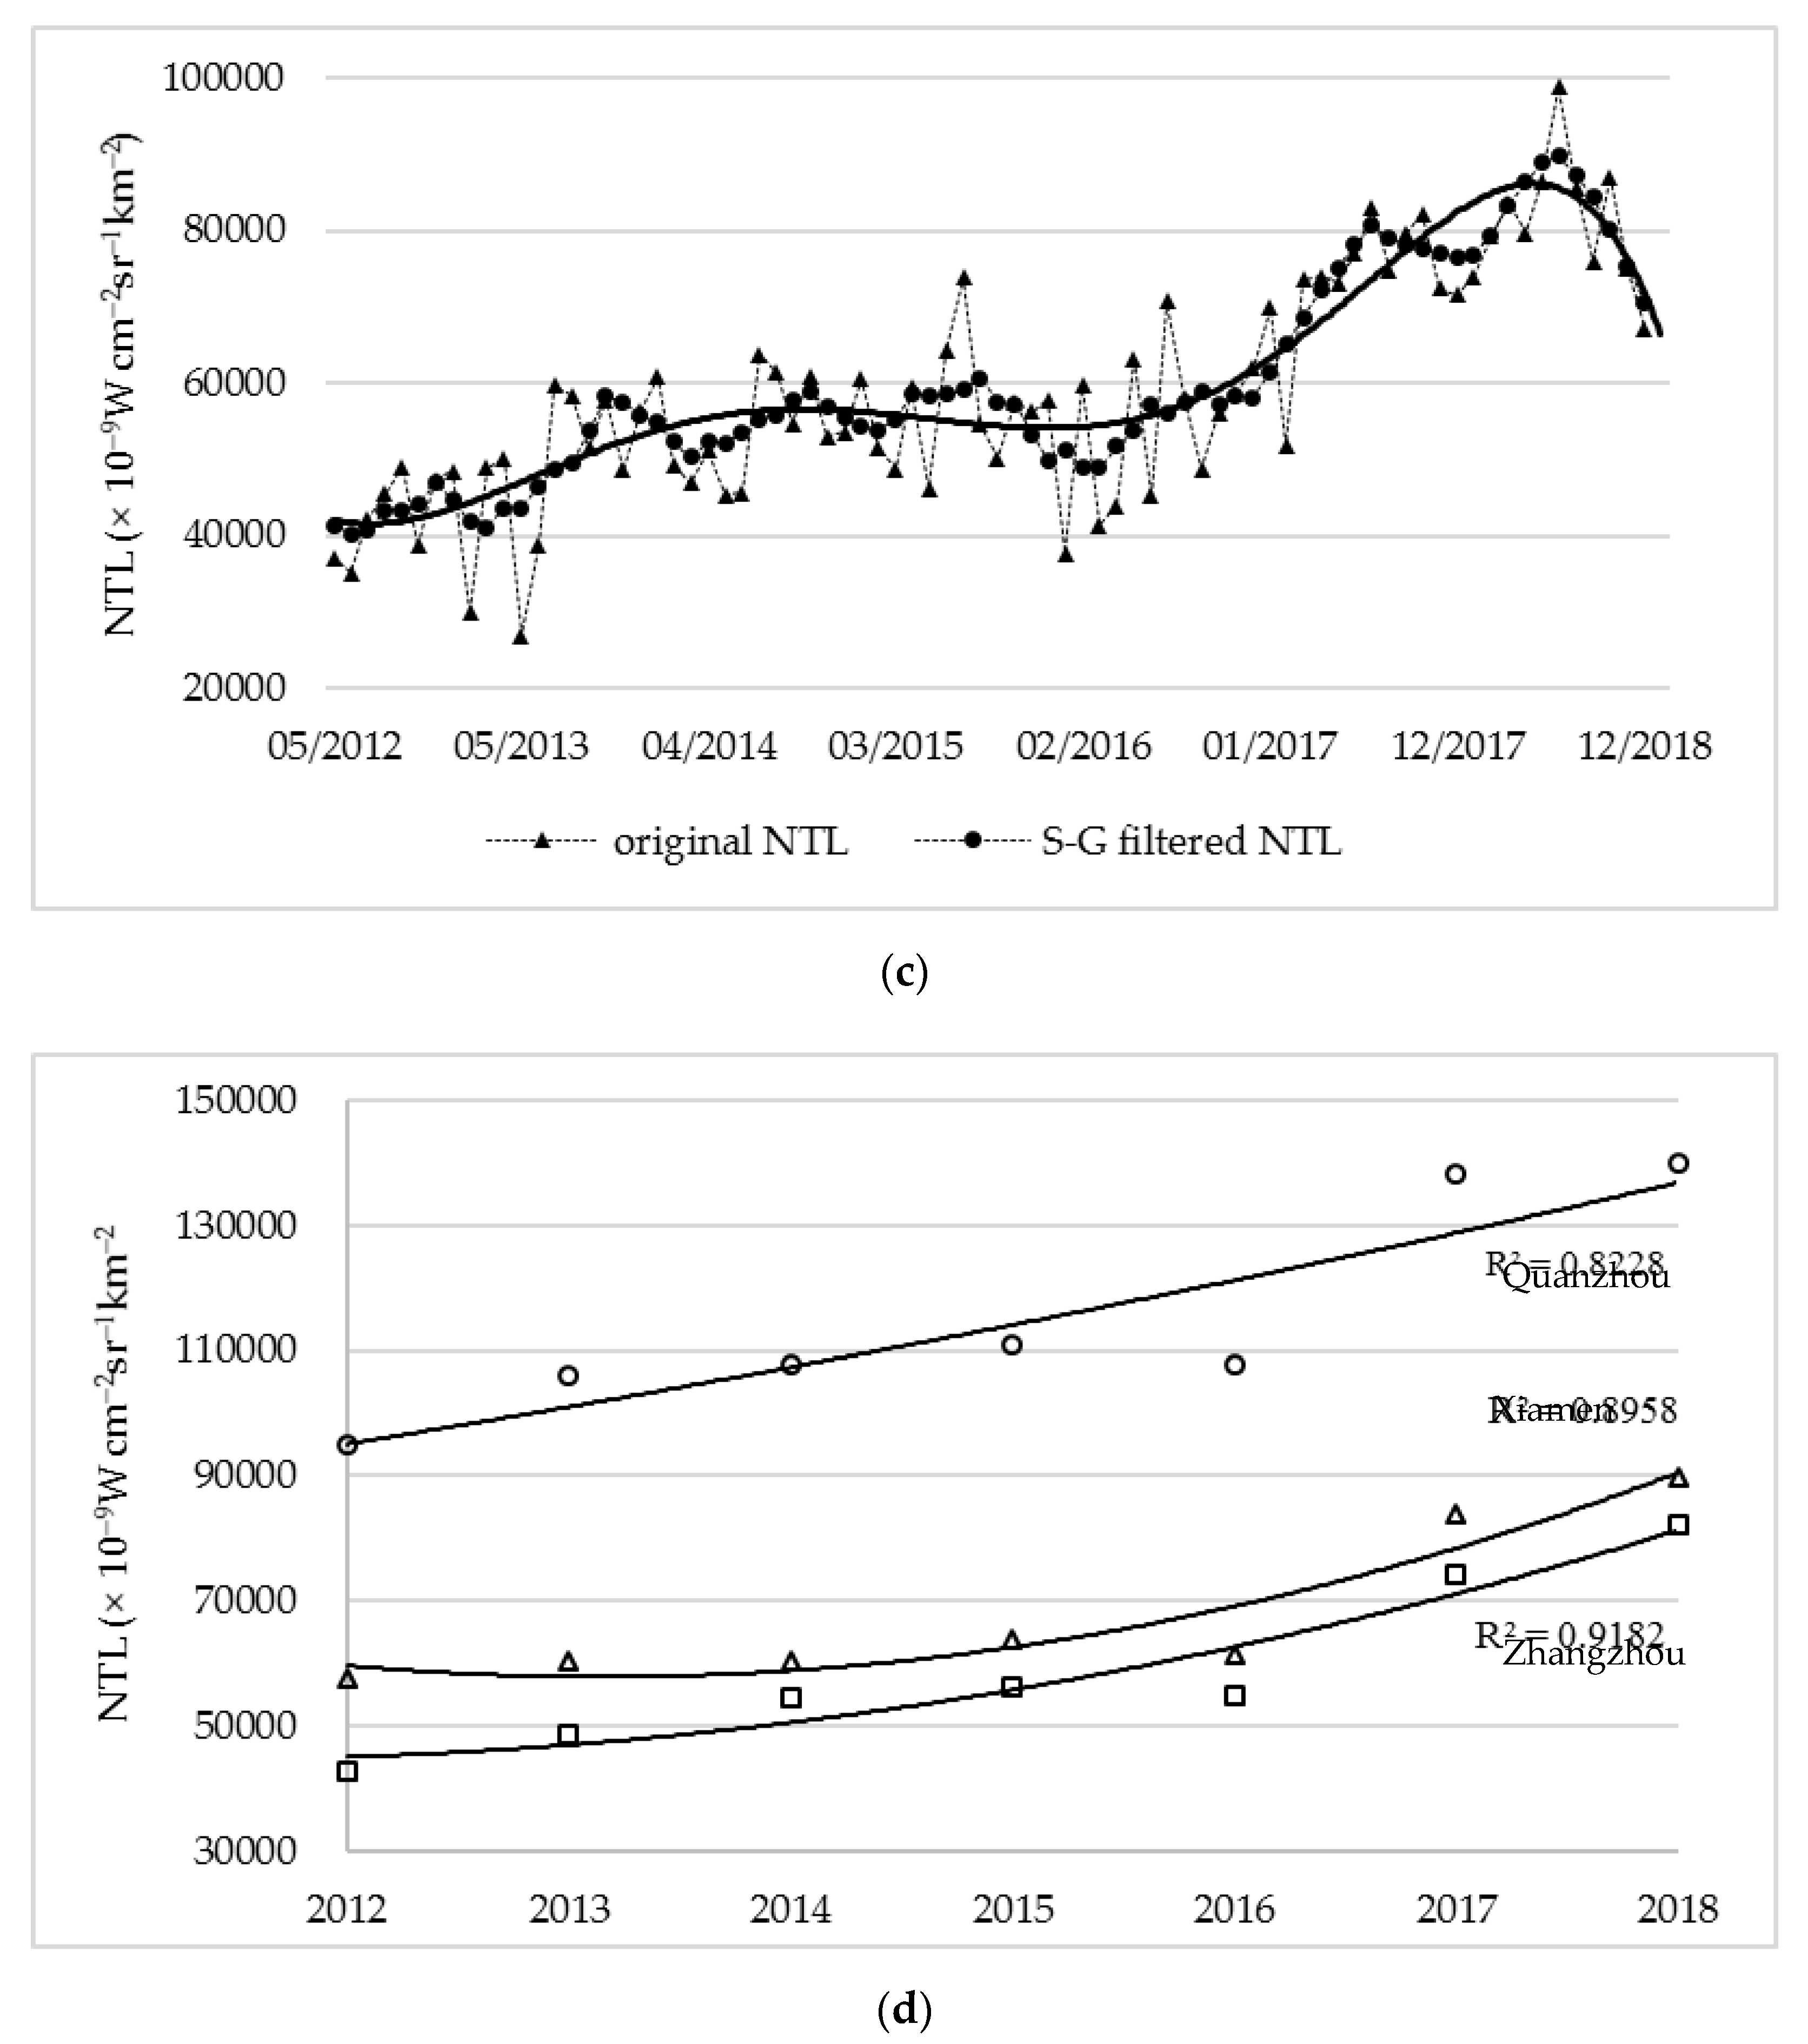
Figure 3a–c, over time, and the three regional models performed well with NTL increases, decreases, and relative stability. From July 2016 to July 2018, NTL in the three regions showed a sudden increase trend almost simultaneously, reaching its peak in July 2018, but the seasonal change trend was less obvious. The annual NTL synthesized by monthly NTL is shown in
Figure 3d, and the annual NTL data in the three cities all present a good fitting effect.
2.4. Establishment of NPP/VIIRS Night-Time Average Light Index (ALI)
The total brightness of night light can only directly reflect the social and economic activities in a certain area at night. Therefore, in order to better represent the average level of different regions, the Average Light Index (ALI) was adopted in this study, as shown in Equation (1):
where ALI is the average light index; n is the number of positive pixels.
2.5. Establishment of Integrated Poverty Index (IPI) Using Principal Component Analysis (PCA)
Poverty can be caused by many aspects of socioeconomic conditions. Considering the availability of district/county statistical data, we used the following 12 socioeconomic variables (6 aspects) to extract an Integrated Poverty Index (IPI) that can be used as a county scale poverty indicator: (1) national economy: per capita GDP; (2) population and labor force: urbanization rate; (3) investment in fixed assets: per capita urban fixed asset investment; (4) people’s lives: per capita disposable income of all residents, per capita living consumption expenditure of all residents, per capita disposable income of urban residents, per capita consumption expenditure of urban residents, per capita disposable income of rural residents, per capita consumption expenditure of rural residents; (5) finance: per capita fiscal expenditure, per capita public expenditure, per capita public revenue; (6) wholesale and retail: per capita retail sales of social consumer goods.
Kaiser-Meyer-Olkin (KMO) and Bartlett’s tests were performed on 12 variables from 2012 to 2018. As shown in
Table 1, the test results show that the p-value is always 0, indicating strong relationships amongst the variables. The KMO value is always greater than 0.6, showing that the PCA method is suitable for this study.
Table 2 demonstrates the PCA results of the 12 socioeconomic variables in 2018. The first two eigenvalues were 7.618 and 2.155, respectively, and the cumulative factor contribution rate of the two was 81.44%. Therefore, the two principal components were selected.
The component score coefficient matrix of the PCA results is given in
Table 3. The eigenvectors of the 12 variables in the matrix can be used to express each of the components. The first PC, Z
1, and the second PC, Z
2, can be expressed by the following (Equation (2)):
where x
i are the variables (
Table 3) used in this study, and the coefficients are the eigenvectors of the PCA results.
The coefficient of each component is obtained according to the weight of the component’s characteristic value. The 2 PCs are combined to create an Integrated Poverty Index (IPI) (Equation (3)).
where λ
1, λ
2 are eigenvectors for the first 2 PCs, and Z
1, Z
2 are the values calculated by Equation (2).
By introducing the λ
1 and λ
2 values from
Table 2 (λ
1 = 7.618, λ
2 = 2.155), the IPI for 2018 can then be simplified to the following (Equation (4)):
Similarly, the IPI for 2012–2017 can be expressed as follows (Equations (5)–(10)):
2.6. Theil Decomposition Method
The Gini coefficient is currently the most widely used inequality index. It can measure the overall income gap, but it cannot decompose regional differences. The outstanding advantage of the Theil index is that it can be decomposed into intra-region difference and inter-region difference, and measure their contribution to overall inequality. Therefore, this paper adopts the Theil index to measure the regional economic inequality of the Xiamen-Zhangzhou-Quanzhou city group [
36]. Taking NPP/VIIRS NTL data and GDP data of the Xiamen-Zhangzhou-Quanzhou city group as a proxy indicator for economic activities, and using the county as a basic regional unit, we calculated overall regional economic inequality and then decomposed the overall regional inequality into within-prefecture and between-prefecture components using the Thiel decomposition method.
where Y
ij is the income (or NTL) of county j in prefecture i, Y is the total income (or NTL) of all counties (=
), N
ij is the population of county j in prefecture i, and N is the total population of all counties (=
).
We defined T
ci as follows to measure between-county income (or NTL) inequality for prefecture i:
Then, the between-county inequality index T
ci in Equation (12) is substituted into the overall inequality index T in Equation (11) and finally can be decomposed into
where Y
i is the total income (or NTL) of prefecture i (=
), and N
i is the total population of prefecture i (=
).
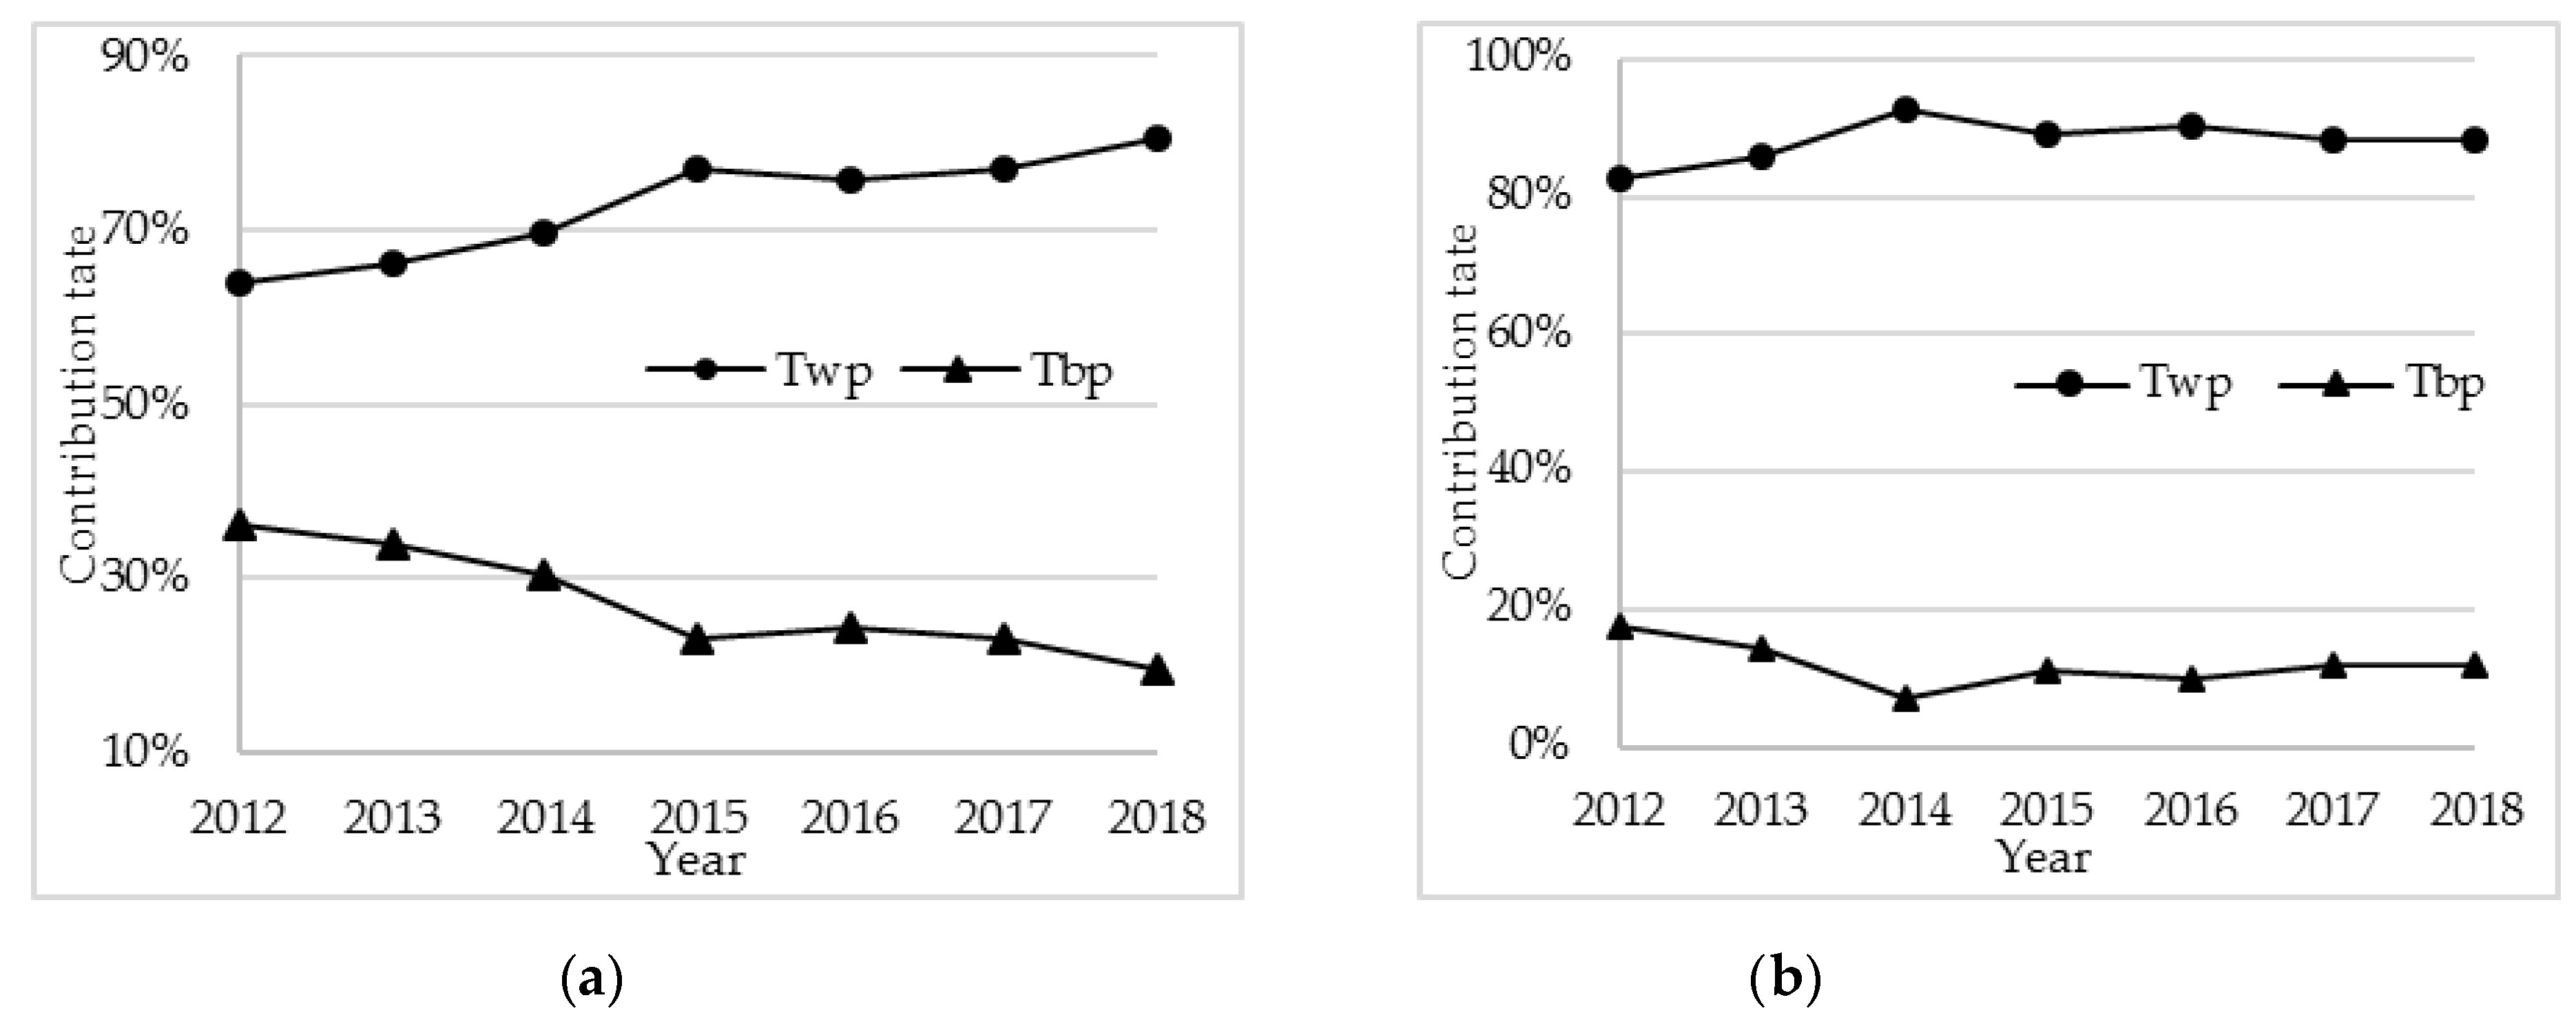
Equation (13) is the Theil inequality decomposition equation, in which the overall regional economic inequality is decomposed into the within-prefecture component (Twp) and between-prefecture component (Tbp). The within-prefecture component is a weighted average of between-county income inequalities (Tci).
4. Discussion
Are NPP/VIIRS NTL data applicable for research on poverty and inequality in city clusters, and what about poverty and inequality in city clusters? In order to solve this problem, revised NTL and socioeconomic statistics were used as data sources in this paper to analyze and compare regional poverty and inequality in the Xiamen-Zhangzhou-Quanzhou city cluster under different data sources.
A multidimensional index was used to establish a regional comprehensive poverty evaluation index. Due to the difficulty in obtaining statistical data for districts/counties, the municipal statistical yearbook was used in this study, which resulted in a lack of indicators for people’s welfare in education, culture, and medical treatment in districts/counties. There are several ways to measure regional inequality. Wu et al. studied regional inequality in China by using revised NPP/VIIRS NTL data as a proxy variable for economic development [
9]. This paper is slightly different from Wu et al. [
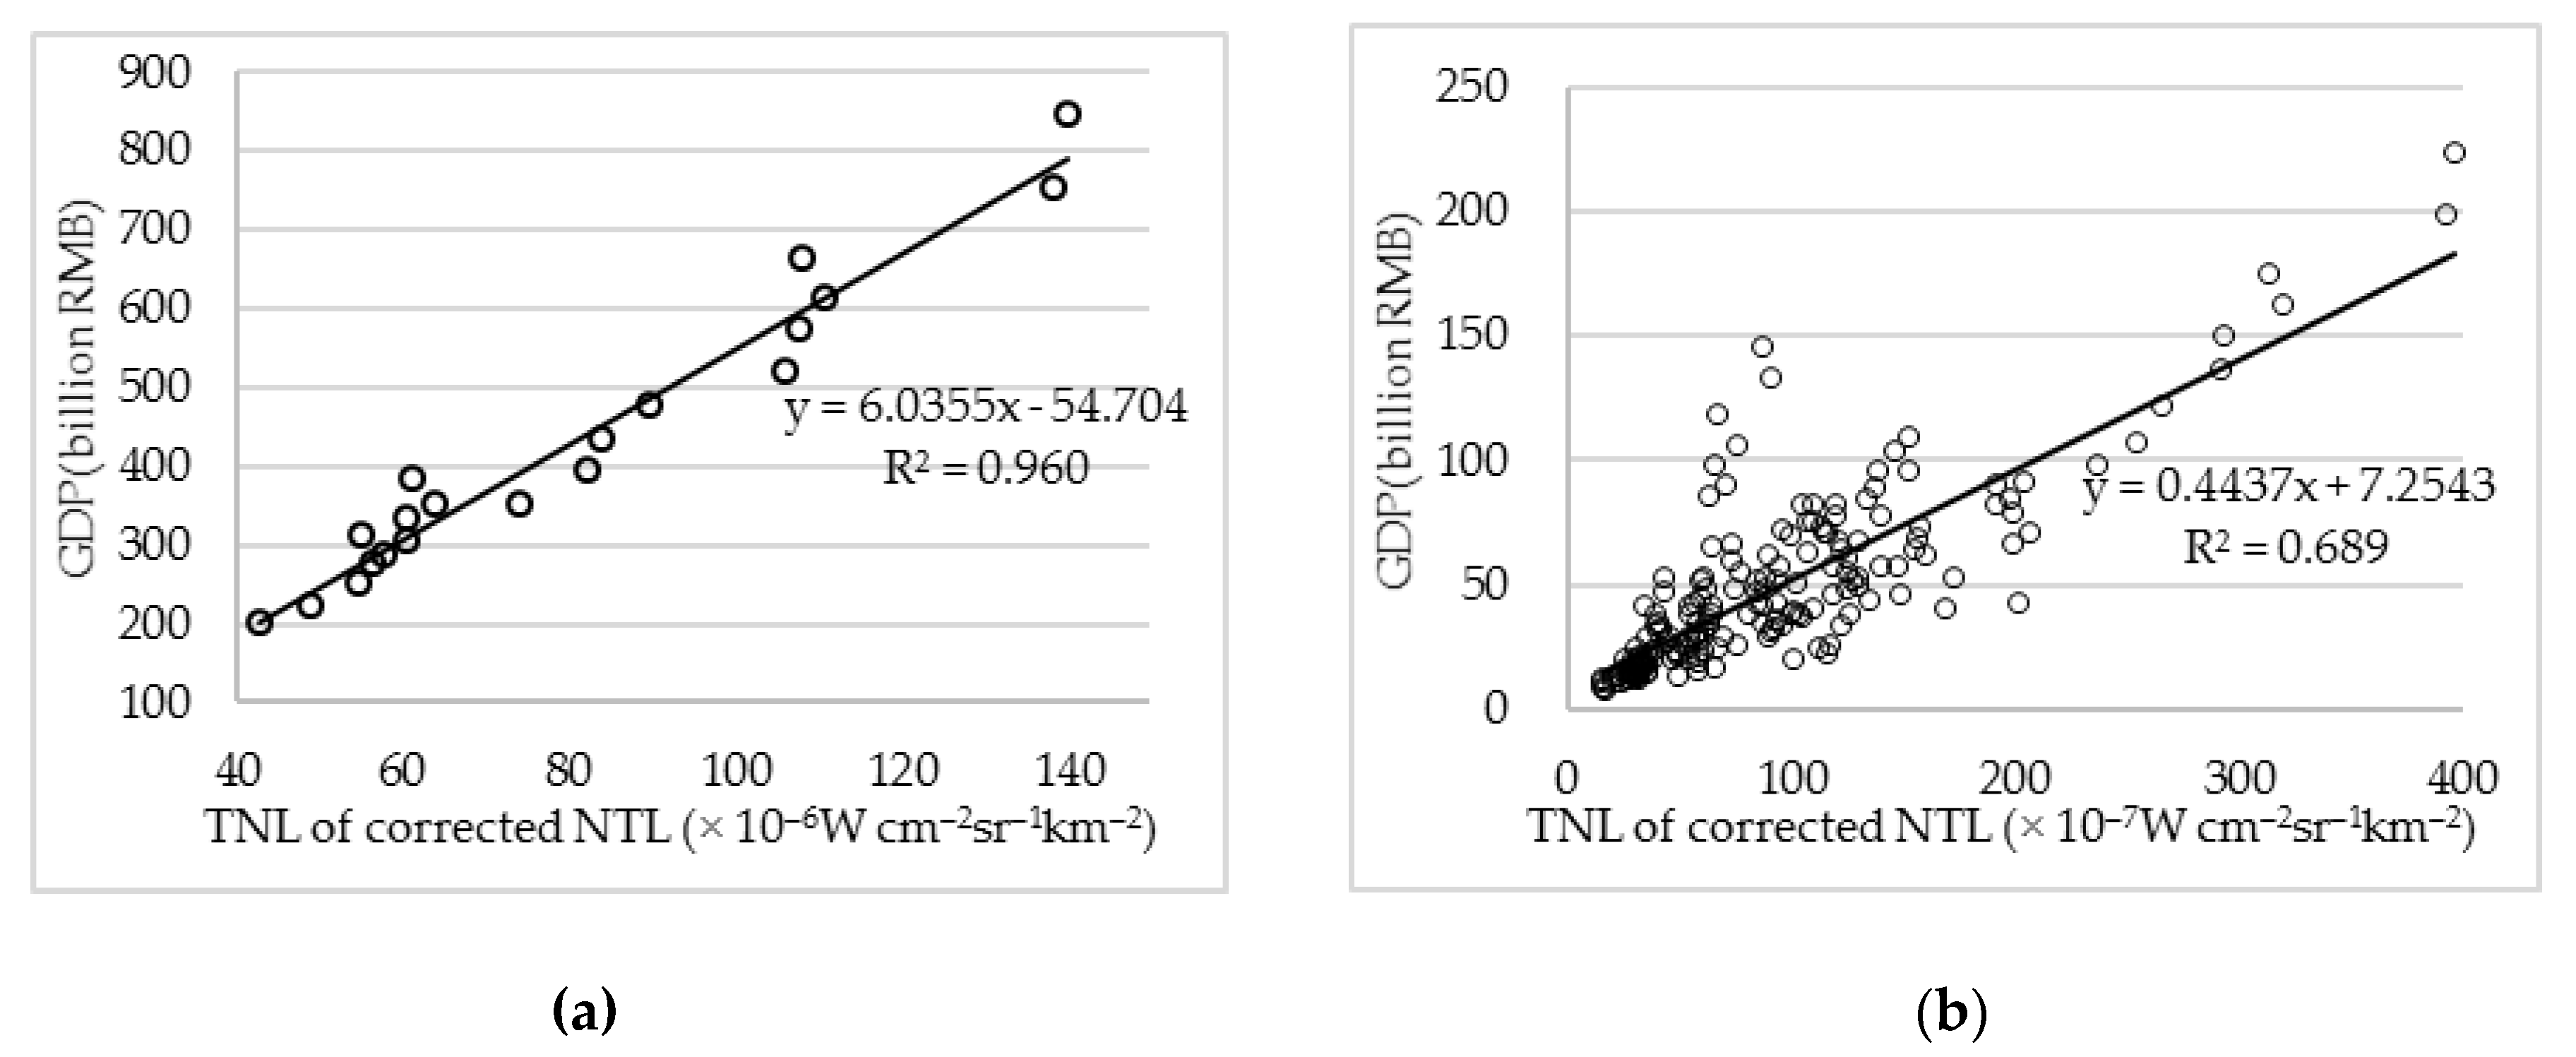
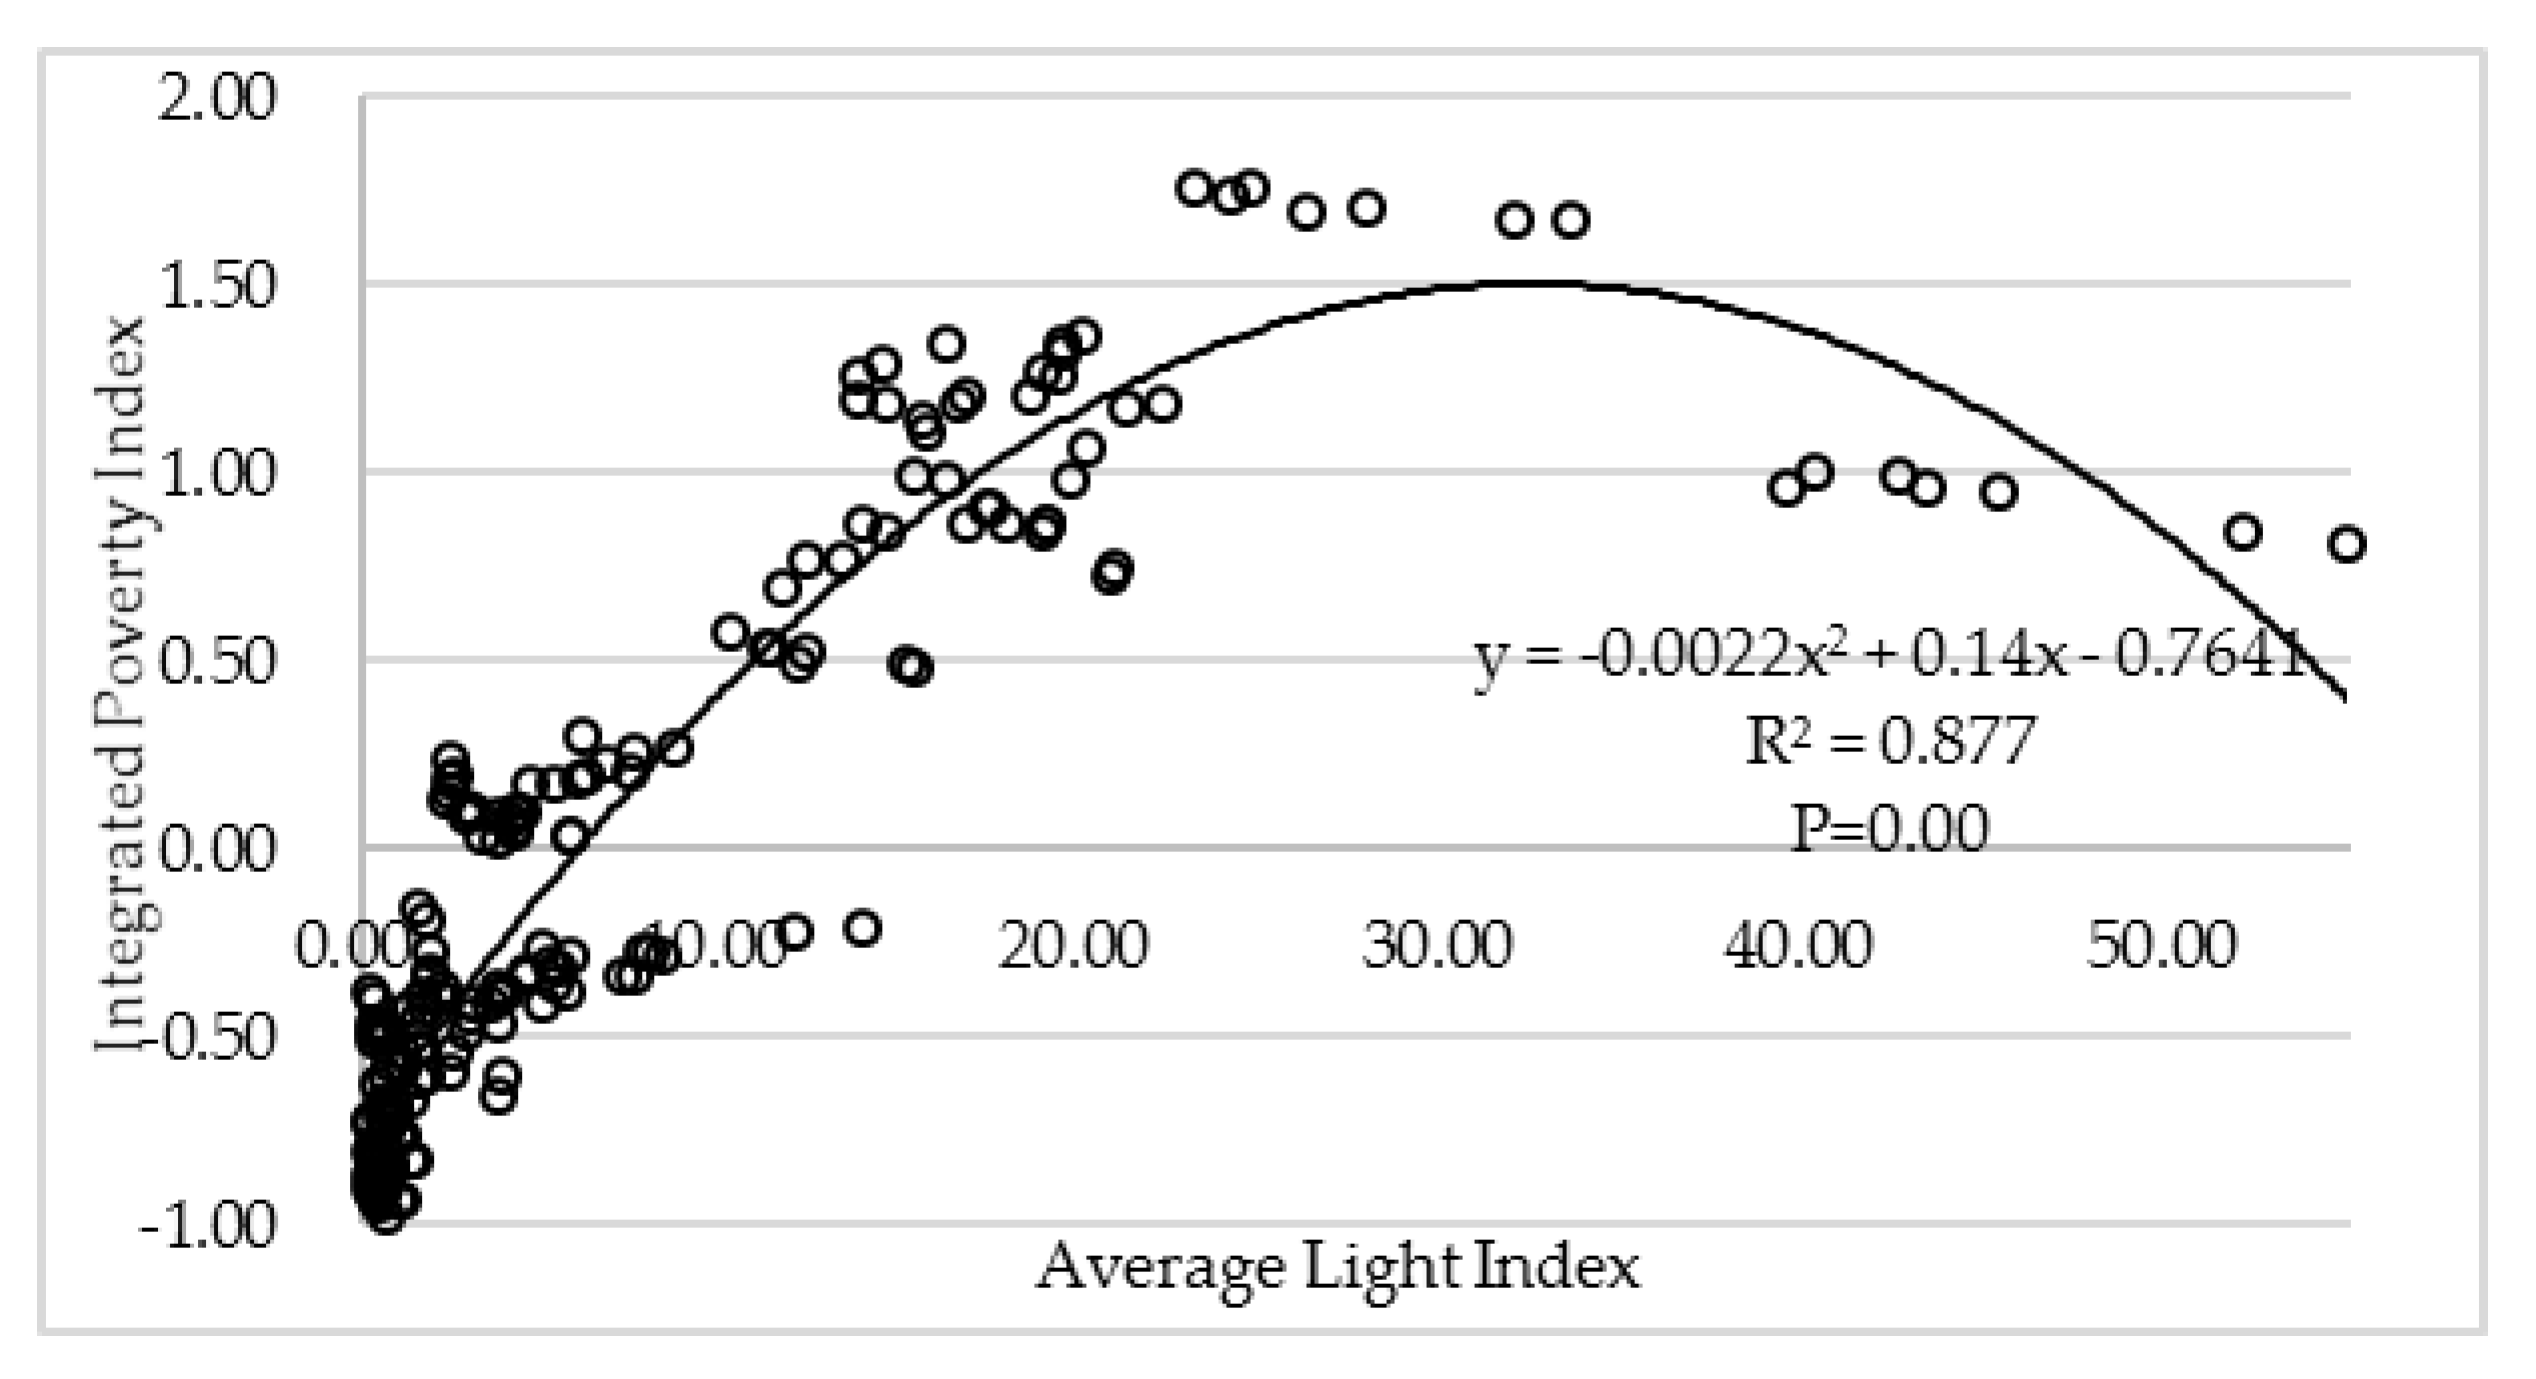
9] in that the Theil index is calculated based on GDP, population, and NPP/VIIRS NTL. Due to the advantages of a small amount of data and wide spatial coverage, NTL images are often used by many scholars to study poverty and inequality on a large scale. However, there may be some deviations between NPP/VIIRS NTL data and socioeconomic indicators on small and medium scales. If VIIRS NTL data are directly used to replace socioeconomic indicators, this may cause errors in the final results. Therefore, the present paper used two different data sources for analysis and comparison. Regression analysis shows that there is a significant quadratic functional relationship between IPI and ALI, which is different from the functional relationship obtained by Wang et al. [
10]. The quantitative response of NTL change to changes in population, GDP, electricity consumption, and other socioeconomic variables may vary from city to city. Ma et al. pointed out that researchers should not only rely on the linear function form, but should also consider the diversity of NTL’s response to socioeconomic dynamics according to the development level of a region [
37].
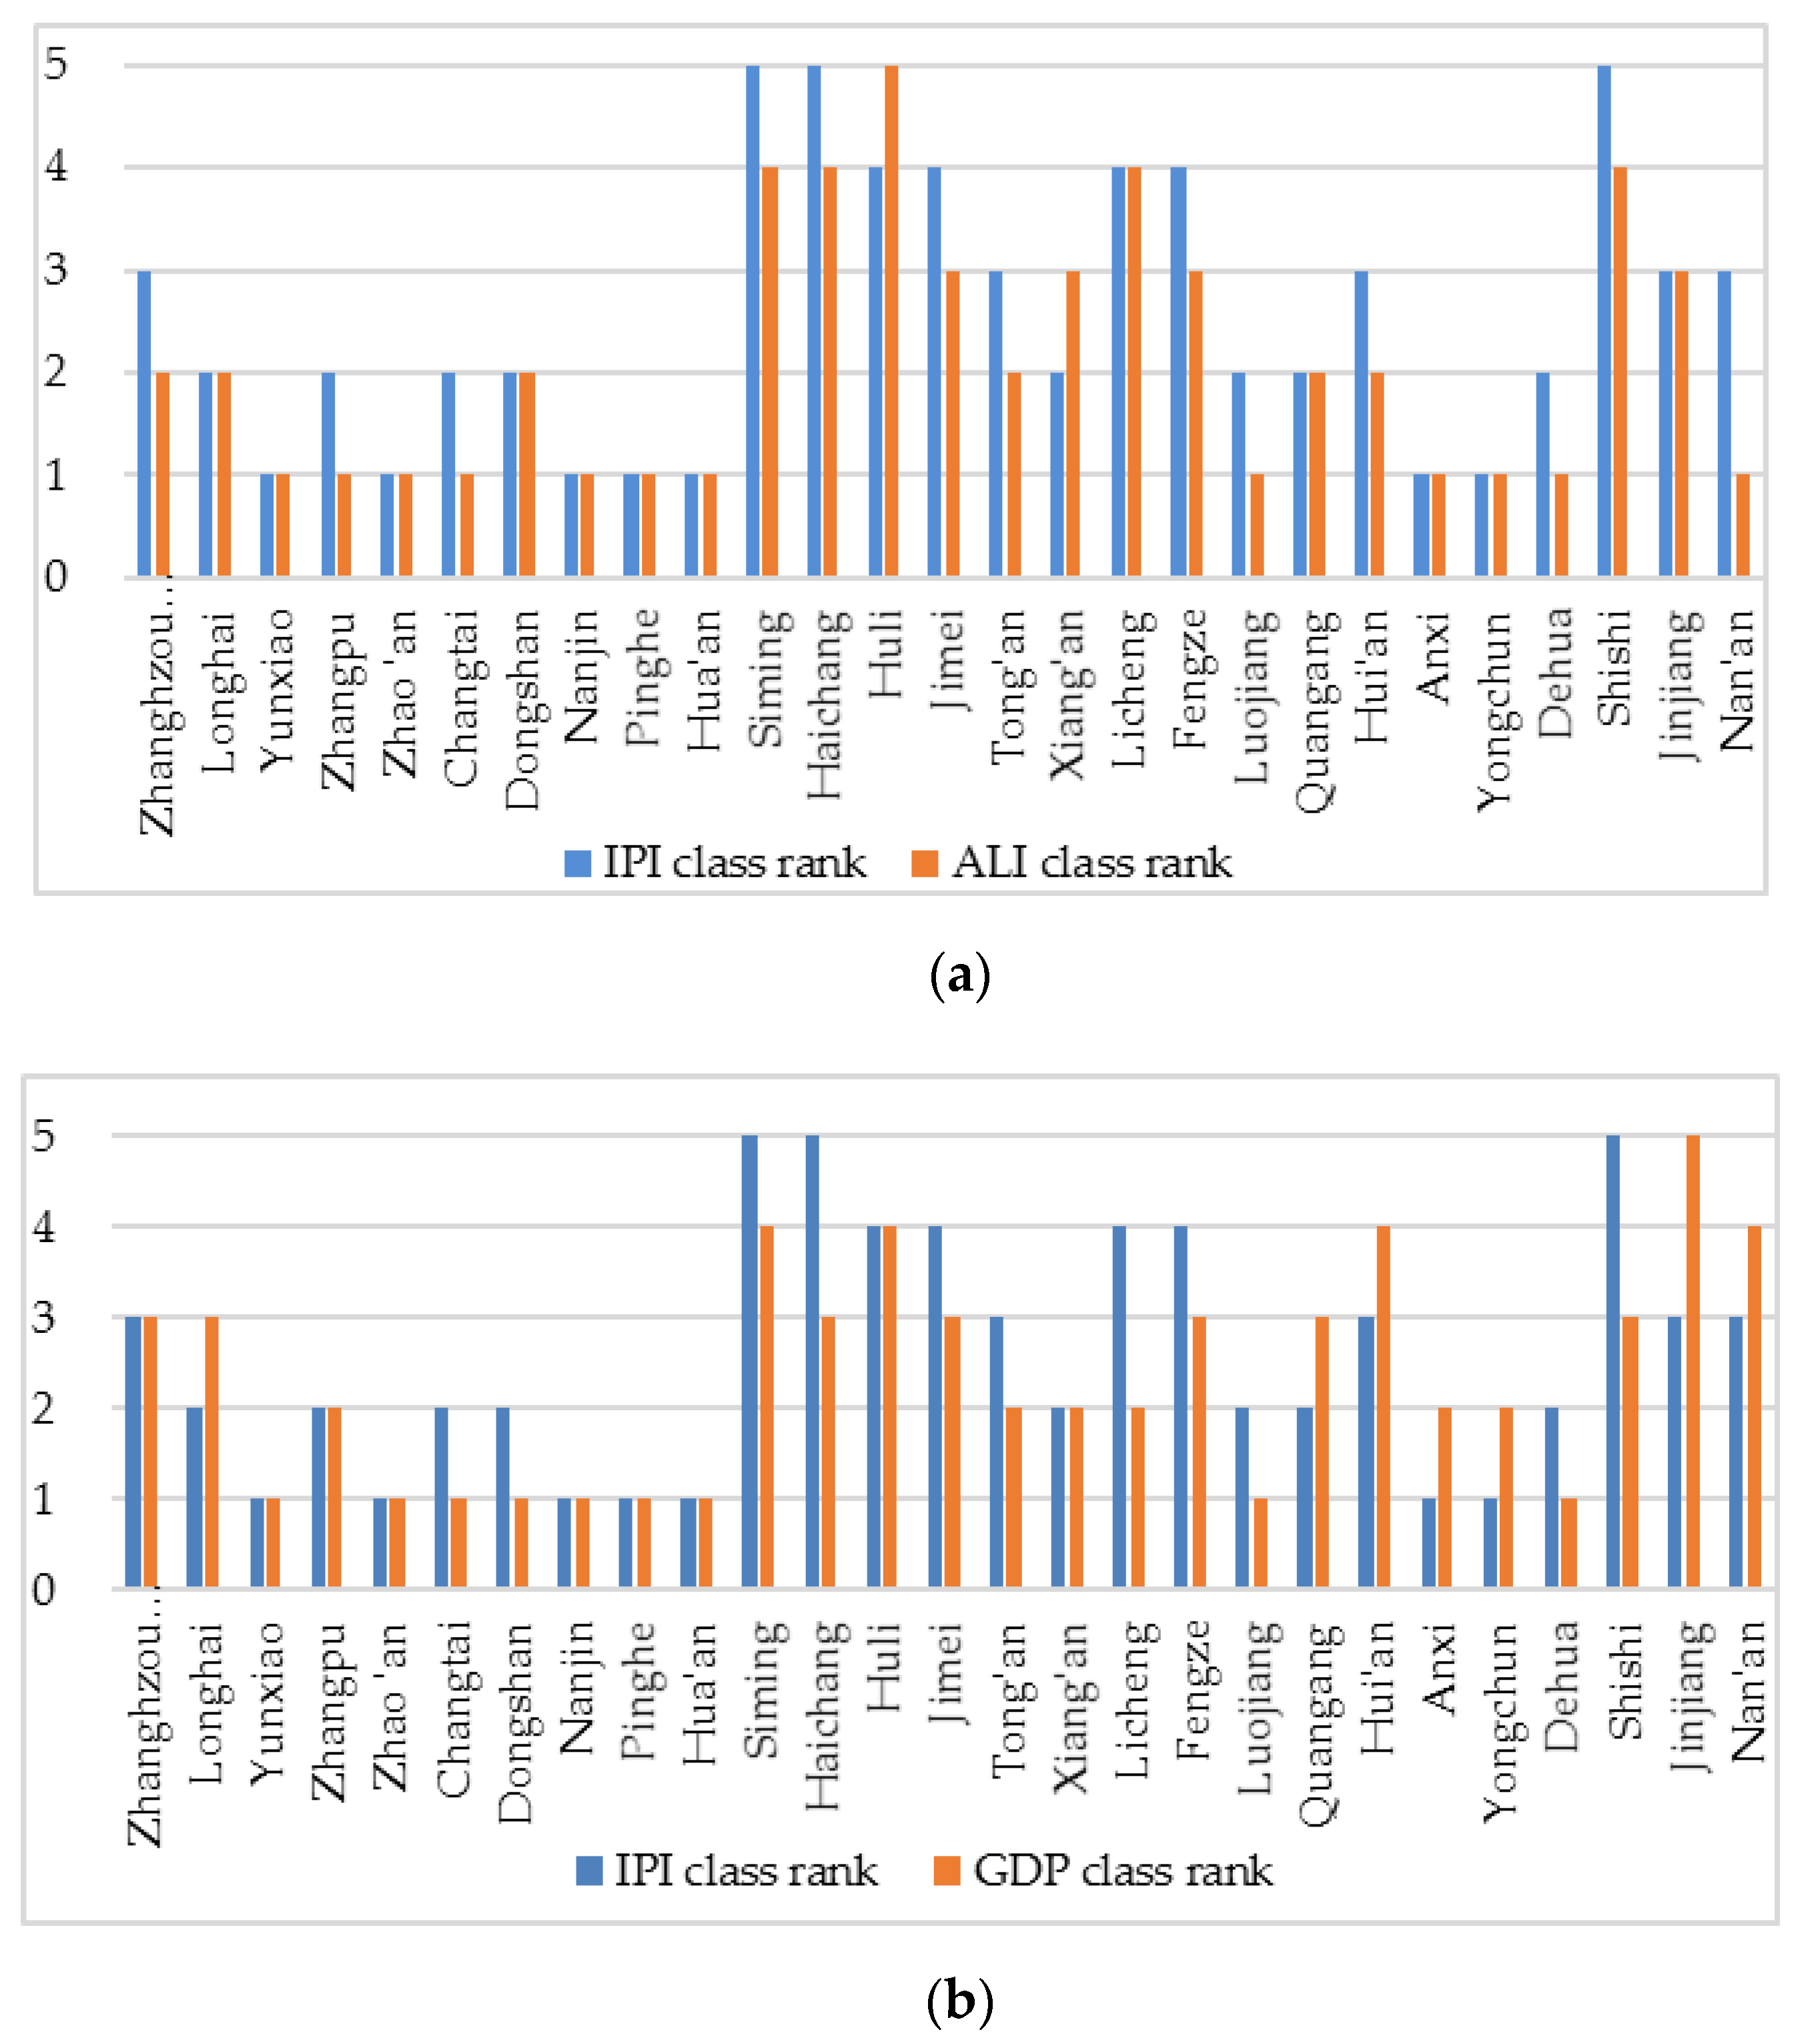
Taking 2018 as an example, Jenks’ optimal natural fracture method was used to draw the poverty classification map of the Xiamen-Zhangzhou-Quanzhou city cluster, and IPI, GDP, and NPP/VIIRS ALI were classified into five categories (grades 1 to 5, the lower the grade, the worse the economic situation) (see
Figure 10). This method can minimize the within-class difference and maximize the between-class difference. As shown in
Figure 10a, ALI and IPI rank similarly in most areas. In most regions (12 regions) the grade is the same, and in 14 regions the grade difference is smaller (1 or −1); only Nan’an has a grade difference greater than 1. From the different distributions of regional ALI and IPI grades, Xiamen and Quanzhou have the largest number of regional grade differences, and the IPI grade is higher than the ALI grade in the majority. Among them, IPI level and ALI level show differences in six districts of Xiamen (1 or −1). The establishment of IPI indicators takes into account multidimensional socioeconomic indicators. Xiamen’s producer service industry has gathered advantages and developed rapidly. The economy has achieved high-quality growth, social security has been improved, and the social and economic welfare has been improved much more than the NTL. In addition, Xiamen has a small administrative area, and it is difficult to distinguish the economic differences of various regions through NPP/VIIRS NTL. The regions with different IPI and ALI grades in Quanzhou are located in the eastern coastal areas. IPI grades in these regions are all higher than ALI grades. Based on the economic development level of these areas, it is found that these regions have a better economic development level and faster social and economic development than their NTL. In addition, the grade difference between Nan’an’s IPI and ALI is 2. Nan’an’s geographical area is located in third place in the city, and the vegetation coverage is relatively high. It is possible that ALI is lower than IPI. Finally, Zhangzhou has a good consistency between IPI and ALI grades, among which the IPI grades of Pinghe, Yunxiao, and Zhao’an (three provincial-level poverty-stricken counties) are highly consistent with ALI grades. However, as shown in
Figure 10b, there are significant differences between GDP and IPI rankings in most regions. Among them, only one third of the regional IPI grades are consistent with the GDP grades. Regions with large grade differences between GDP and IPI (greater than or less than 1) are located in Xiamen and Quanzhou, and mainly include Haichang, Licheng, Shishi, and Jinjiang. Although the total GDP results of Haichang, Licheng, and Shishi are not the highest in the city, their per capita economic level is relatively high. Jinjiang has the highest GDP, but also the largest population, which results in low per capita social and economic indicators.
In conclusion, in addition to industrial structure factors, regional factors affecting regional poverty include geographical factors such as location, resource endowment, ecological environment, public services, regional policies, and culture. [
38,
39,
40]. Even in developed countries such as the United States and Britain, where poverty is closely linked to location, the incidence of poverty increases with distance from metropolitan areas [
41].
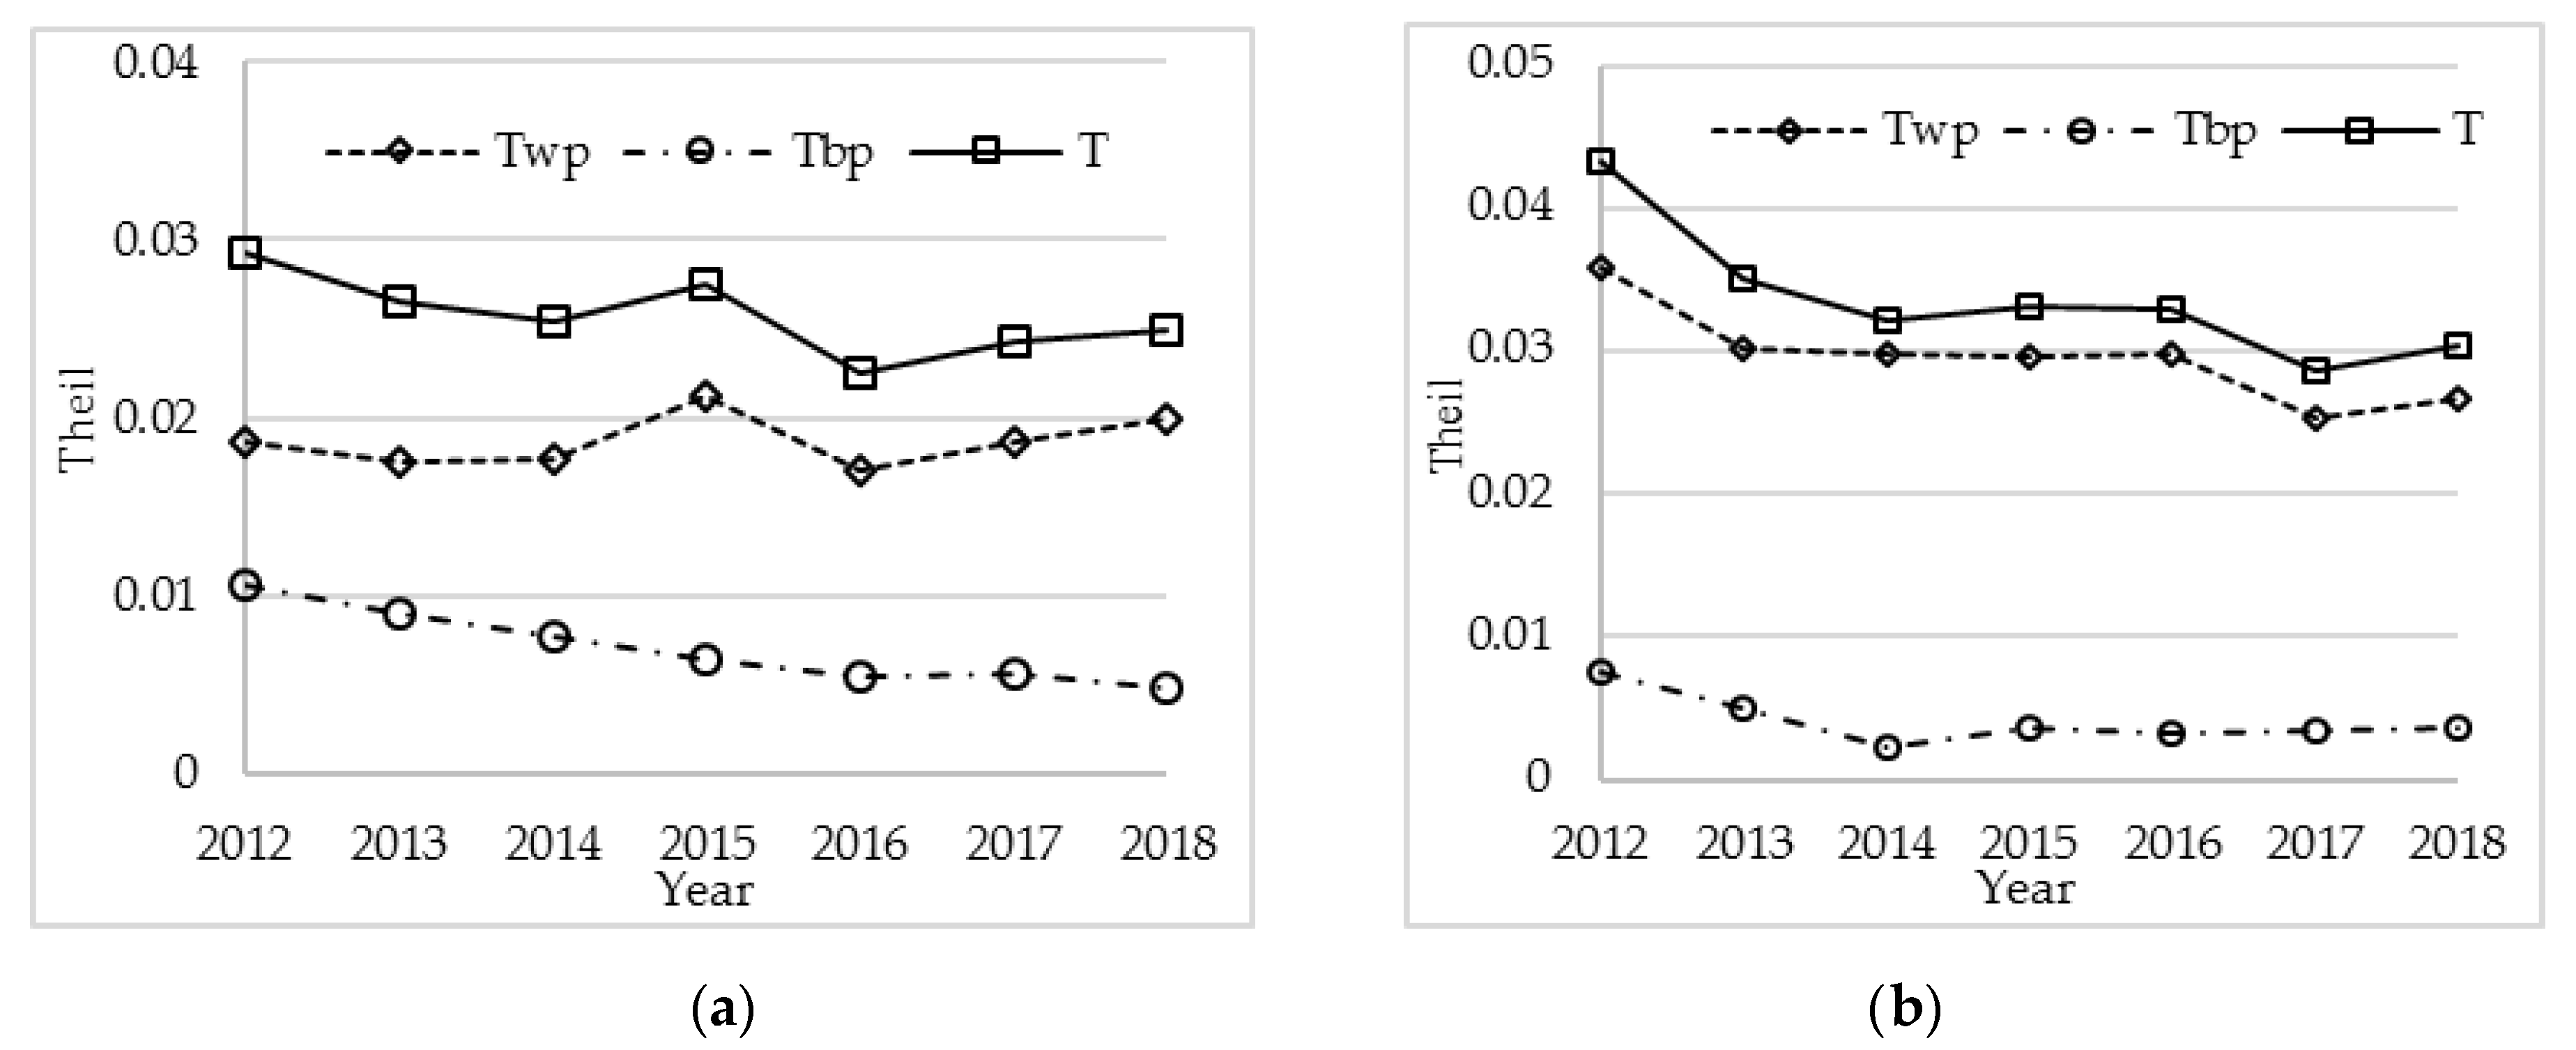
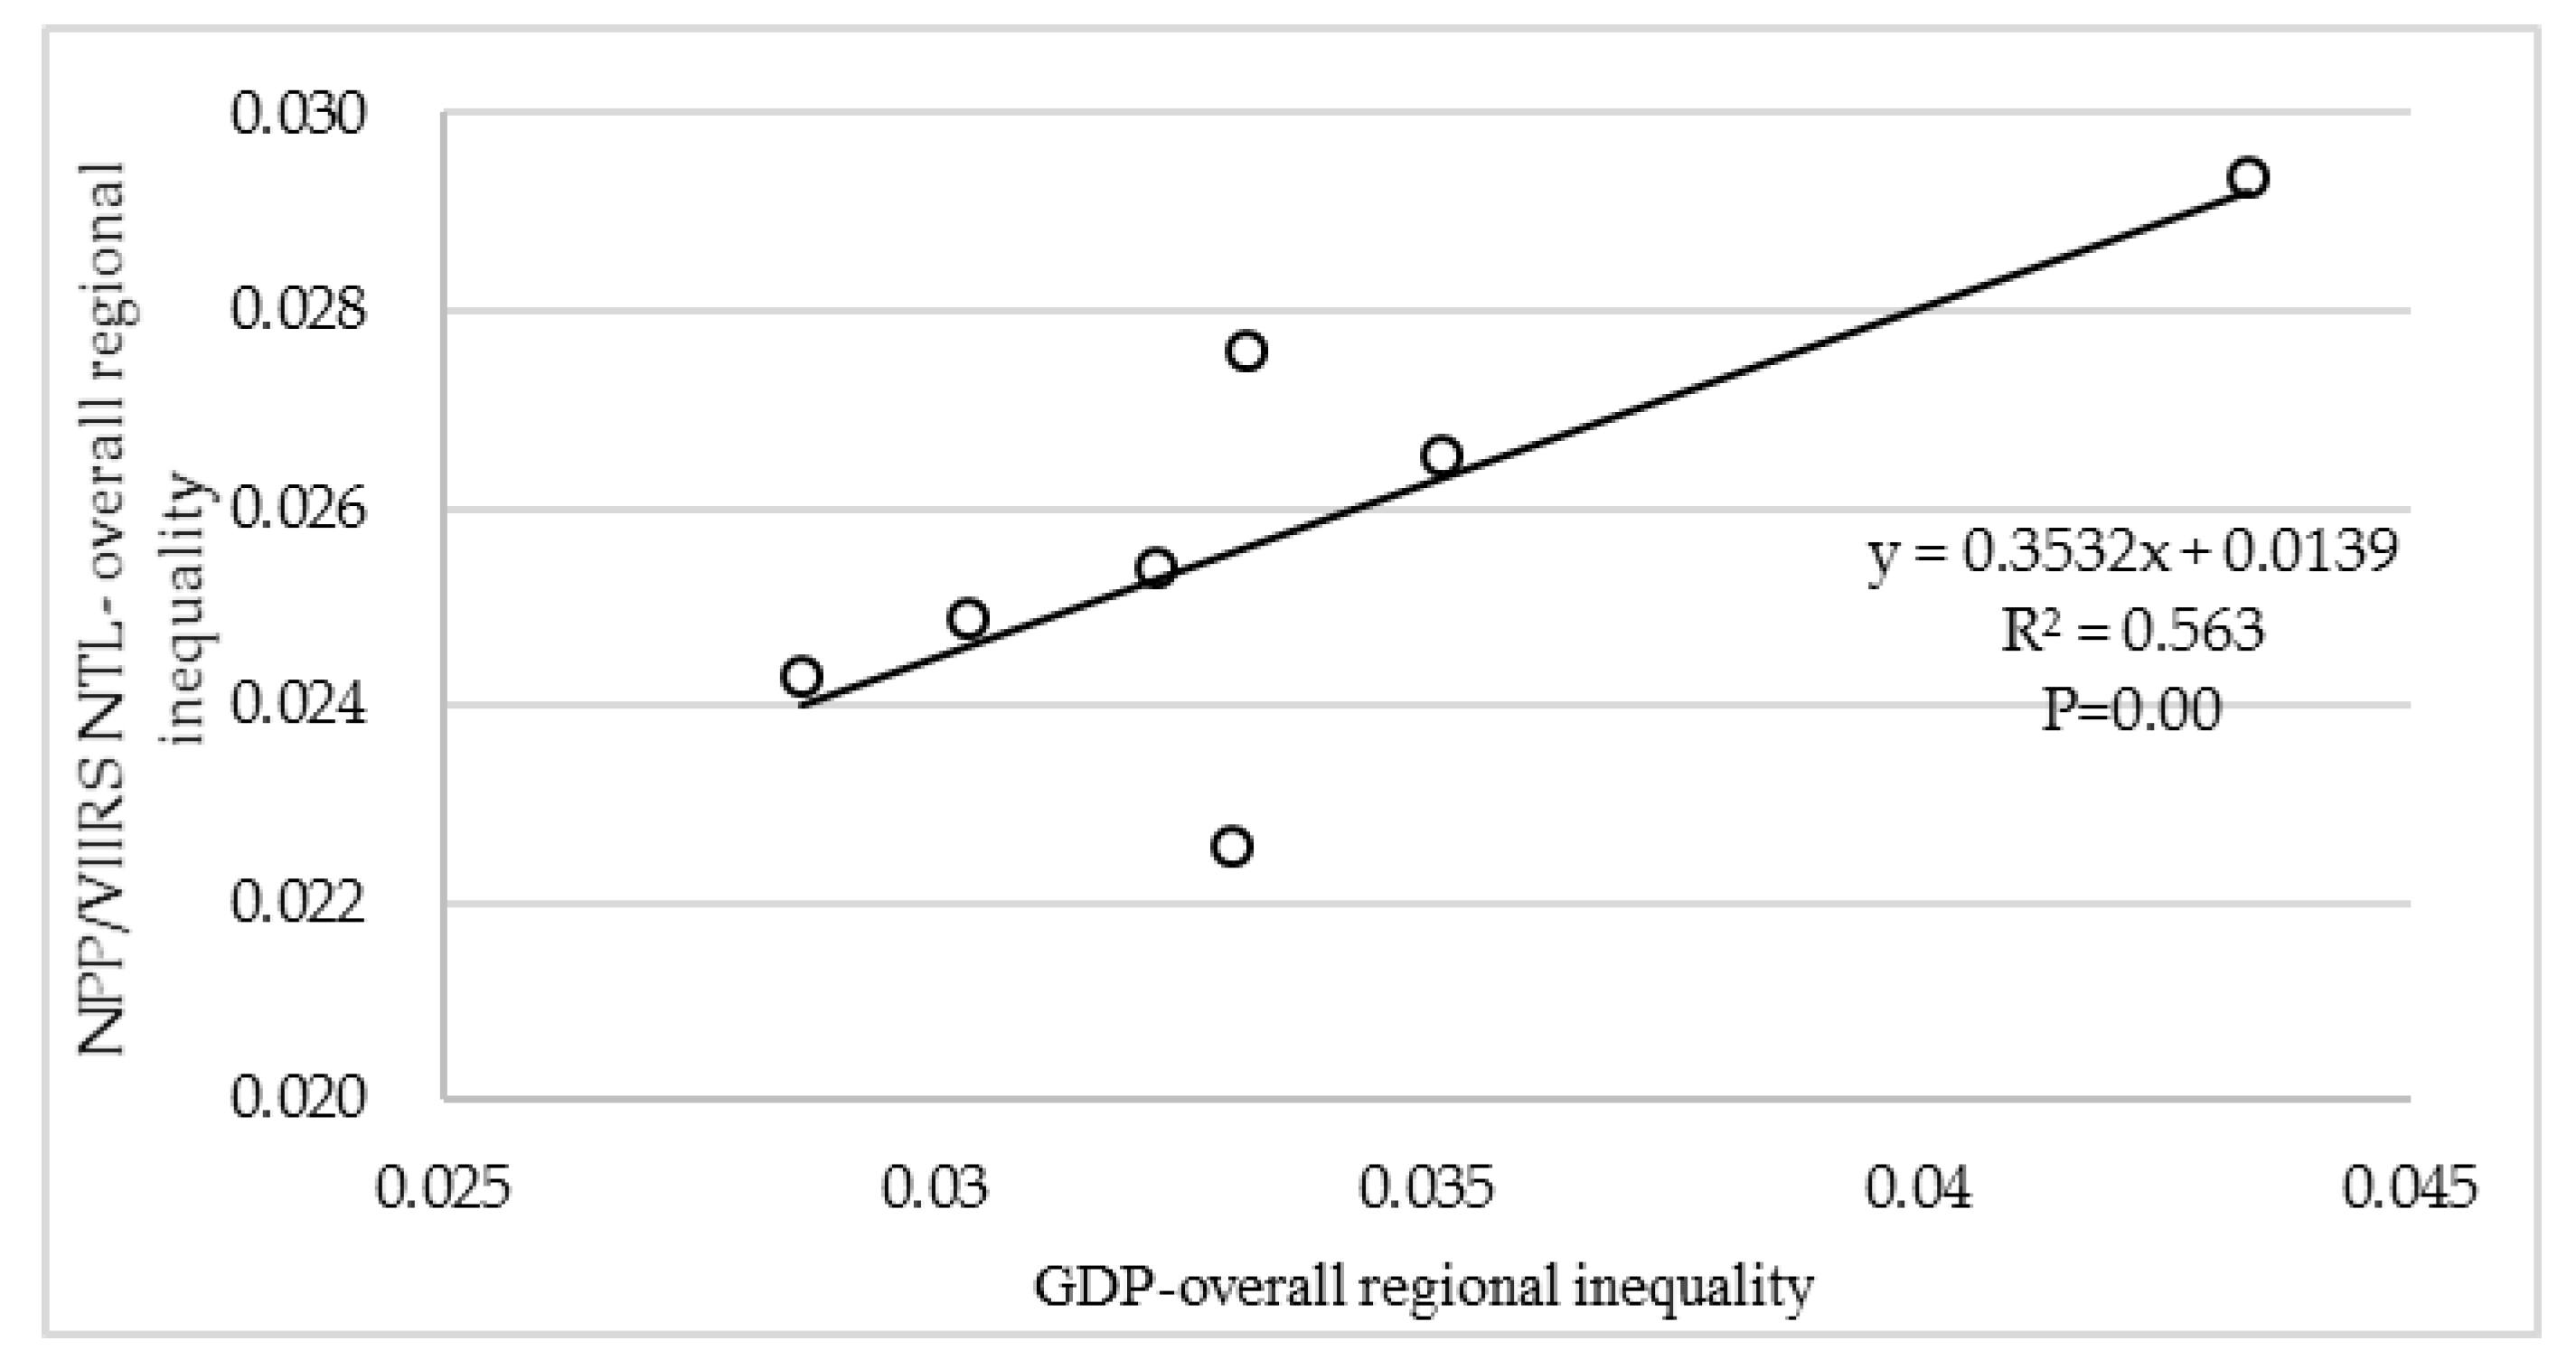
Many scholars have used the two-stage nested Theil coefficient decomposition method to study inequality in large-scale research areas. However, the present paper studies a city cluster on a smaller scale and uses the first-stage Theil decomposition method. The results show that the Theil index calculated by NPP/VIIRS NTL and GDP shows a downward trend from 2012 to 2018, indicating that the overall regional inequality gap in the urban agglomeration was narrowing. The regression analysis shows that the Theil index of the two is weakly correlated, and the measurement coefficient is R
2=0.563. After further decomposition, it is found that the inequality gap between two cities is decreasing, while the inequality gap within one city is increasing, which is consistent with the research results of Jiang et al. [
18]. Jiang et al. pointed out that with the improvement of the coordination and integration degree of regional infrastructure construction, the integration trend of Xiamen, Zhangzhou, and Quanzhou was more obvious from 2013 to 2018 [
18]. From the perspective of urban space, the three cities in the abovementioned study are distributed in a contiguous area, the urban cluster is densely populated with cities, the boundaries between cities are increasingly blurred, and the urban development presents a continuous trend. Xiamen City, as the central city of the Xiamen-Zhangzhou-Quanzhou city cluster, drives the coordinated development of the surrounding cities. At present, Longhai in Zhangzhou City has been connected with Haicang in Xiamen City and integrated into the development of Xiamen City. Some parts of Nan’an in Quanzhou City are also integrated with Tongan in Xiamen City.
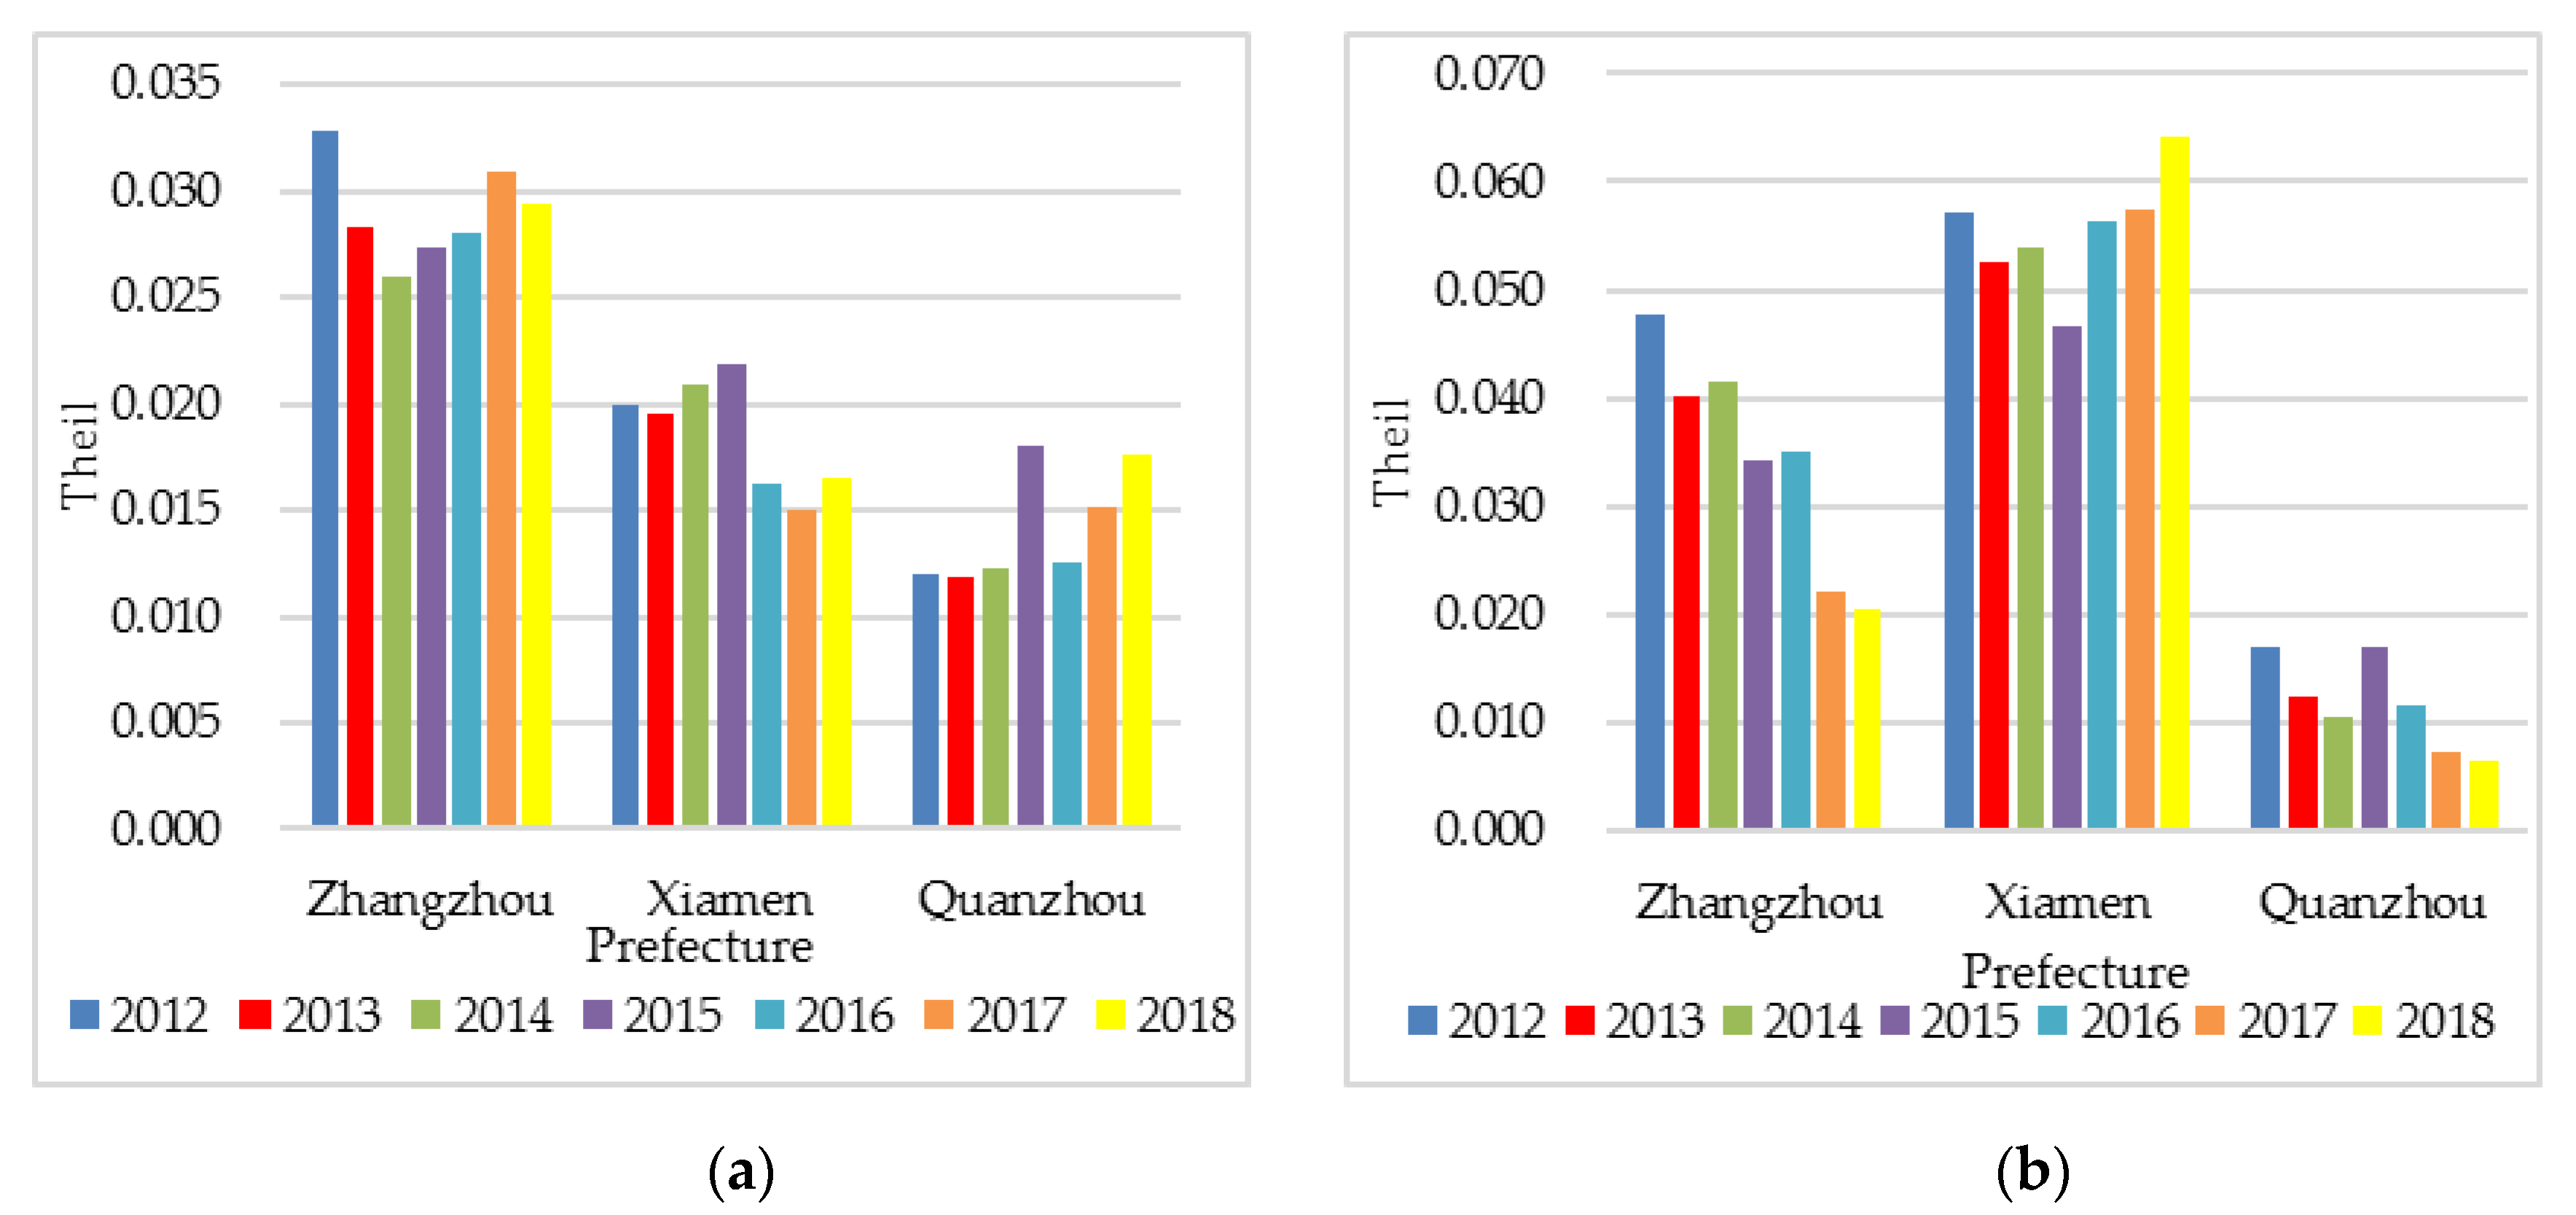
The regional economic inequality in the Xiamen-Zhangzhou-Quanzhou city cluster is caused by within-prefecture inequality. Because there are some differences in the results obtained using different data sources, the Theil index derived from GDP is used as the result. The within-prefecture inequality level of Zhangzhou and Xiamen is higher than that of Quanzhou. Zhangzhou, as the region with the largest within-prefecture inequality, has the largest plain in Fujian and is the most developed agricultural region in the Xiamen-Zhangzhou-Quanzhou city cluster. However, due to the industrial structure, Zhangzhou City lacks advantages in spatial expansion and social and economic vitality. In addition, Zhangzhou City’s planning and construction is late, economic development started late, and the distribution of cities is small and scattered. Quanzhou has developed a cluster economy, formed by number of representative manufacturing clusters, mainly manifested in: (1) a textile and clothing industry cluster, mainly distributed in urban areas and Jinjiang, Shishi, and Nan ’an; (2) a shoe industry cluster, mainly in Jinjiang; (3) a pottery and stone industry cluster, mainly distributed in Jinjiang, Nan’an, Hui’an, and other places; (4) a handicraft industry cluster, mainly distributed in Fengze, Jinjiang, Shishi, Hui’an, Anxi, Dehua, and other places; (5) a petrochemical industry cluster, mainly distributed in Quangang. However, the correlation between industries is not strong, and the development of producer services is relatively limited. The administrative area of Xiamen is small, the per capita land resources are limited, and the reserve land resources are insufficient, which restricts the urban space expansion. Xiamen’s economic development is dominated by Xiamen Island (Siming and Huli), and there is a large economic gap between Xiamen Island and the off-island areas (Haicang, Jimei, Tongan, and Xiang’an). Siming and Huli cover an area of only 0.37% of the total area of Xiamen City, but their population is 49.78% of the total population of Xiamen City, and their population density reaches 12,951 people/km2. The GDP created by Siming and Huli accounts for 51.88% of the total GDP of Xiamen City.
In conclusion, the accurate estimation of regional economic development and inequality is a complex problem. These estimates cannot be accurately carried out with only one or two simple indicators. In China, a country with unbalanced regional development, it is necessary to use satellite luminous data to estimate regional economic development and inequality. Although we used the latest NPP/VIIRS NTL data and preprocessed the data, there were some limitations.
Compared with the 22-year time series of DMSP/OLS data from 1992 to 2013, the time series of NPP/VIIRS data is shorter. NOAA/NGDC has only been publishing NPP-VIIRS NTL data for around eight years, since April 2012. Only with a longer period of time can a better understanding of the evolution of regional inequalities be reached.
As some cities began to switch from high-voltage sodium lamps to more energy-efficient white Light-Emitting Diode (LED) lighting, NPP/VIIRS detected a reduction in light pollution because it was insensitive to wavelengths below 500 nm (and LEDs emit a lot of bluish light in the spectrum) [
42]. However, DMSP/OLS has a wavelength range from 0.4 to 1.1 μm and may have a better chance of detecting LED lighting.
The NPP/VIIRS transit time occurred after approximately 1:30 am local time [
20]. At this time, the socioeconomic lighting activity on the ground is generally less than the transit time of 20:30-21:30 for DMSP/OLS.
The NTL of NPP/VIIRS in some years is lower than that in previous years, which has a great influence on small- and medium-scale research.


