Article

A Spatiotemporal Analysis of the Effects of Urbanization’s Socio-Economic Factors on Landscape Patterns Considering Operational Scales

1
School of Geographic and Biologic Information, Nanjing University of Posts and Telecommunications, Nanjing 210023, China
2
Smart Health Big Data Analysis and Location Services Engineering Lab of Jiangsu Province, Nanjing University of Posts and Telecommunications, Nanjing 210023, China
3
Urban Informatics & Spatial Computing Lab, Department of Informatics, New Jersey Institute of Technology, Newark, NJ 07102, USA
4
Shenzhen Urban Planning & Land Resource Research Center, Shenzhen 518040, China
5
Key Laboratory of Urban Land Resources Monitoring and Simulation, MNR, Shenzhen 518034, China
6
Shenzhen Municipal Planning & Land Real Estate Information Centre, Shenzhen 518034, China
*
Author to whom correspondence should be addressed.
Sustainability 2020, 12(6), 2543; https://doi.org/10.3390/su12062543
Submission received: 21 February 2020 / Revised: 20 March 2020 / Accepted: 20 March 2020 / Published: 24 March 2020

Abstract

:
Landscape patterns are significantly affected during the urbanization process. Identifying the spatiotemporal impacts of urbanization’s socio-economic factors on landscape patterns is very important and can provide scientific evidence to support urban ecological management and guide managers to establish appropriate sustainability policies. This article applies multiscale geographically weighted regression (MGWR) to reveal the relationships between landscape patterns and the socio-economic factors of urbanization in Shenzhen, China, from 2000 to 2015, in five-year intervals. MGWR is a powerful extension of geographically weighted regression (GWR) that can not only reveal spatial heterogeneity patterns but also measure the operational scale of covariates. The empirical results indicate that MGWR is superior to GWR. Furthermore, the changes in operational scale represented by the spatial bandwidth of MGWR in different years reflect temporal changes in the spatial relationships of given factors, which is significant information for urban studies. These multiscale relationships between landscape patterns and the socio-economic factors of urbanization, revealed via MGWR, are useful for strategic planning around urban dynamic development and land resource and ecological landscape management. The results can provide additional insight into landscape and urbanization studies from a multiscale perspective, which is important for local, regional, and global urban planning.

1. Introduction

The development of urbanization has always been an important issue in both ecological and socio-economic research [1,2,3,4,5,6]. The process of urbanization, which is intertwined with land cover transformation, has a direct and profound impact on changes in land use. The most obvious expression is the transformation from non-construction land to construction land. Meanwhile, with urbanization, there will be urban and rural migration, an urban population increase, economic development, and frequent human activity [7]. Urbanization can improve the quality of life for residents [8] and stimulate rapid economic development. However, irrational urbanization also wcauses environmental and ecological problems, including excessive carbon emissions, habitat loss, urban heat island effects, and heavy metal pollution of the soil [9,10,11,12,13,14,15], as well as the decreases in the quality of life for residents (e.g., slumification) [16]. In extreme circumstances, rapid urbanization can destroy the original landscape patterns and result in a fragile region and the loss of permanent cropland [17,18]. In this context, capturing the spatiotemporal characteristics of land use change and exploring determinants can provide crucial information to help city planners and managers design a sustainable urban growth policy, optimize landscape patterns, and conserve the ecological environment.
Landscape pattern mainly refers to the spatial pattern of landscape, including the type, number, spatial distribution, and configuration of landscape units [19]. Landscape patterns can be applied to represent land use changes. They also have strong spatial properties, with spatial heterogeneity being the most common spatial property of the relationships between urbanization factors and landscape patterns [20,21,22]. Geographically weighted regression (GWR) is a promising model for addressing spatial heterogeneity compared with the ordinary linear regression (OLR) model [23]. To date, GWR has been widely applied to explore landscape–urbanization relationships [24,25,26]. Additionally, from a spatial perspective, the heterogeneous relationships between urbanization and landscape patterns vary at the local, regional, and global scales [24,27,28], and many scholars have suggested that the scale-dependent characteristics of landscape research and multiscale information are important for understanding landscape patterns [29,30,31,32]. Notably, Su et al. [24] discussed scale effects considering three aspects: bandwidths, block scales, and window sizes. Similarly, Xiao et al. [33] concluded that scale is an important element that influences the relationships between land use type and water quality parameters. These previous studies have highlighted the importance of multiscale effects in studying landscape patterns [34,35].
The various urbanization processes within a city generally lead to heterogeneity in how and to what extent urbanization factors affect landscape patterns. Although existing studies have focused on spatial heterogeneity and spatial scale effects, the operational scale of the relationships between landscape and the drivers of urbanization have received insufficient attention. The operational scale, which reflects the spatial scope of the operating environment of geographical processes, has not been sufficiently considered in common methods such as OLR and GWR. In a regression model, the operational scale is generally reflected by various levels of heterogeneity in relationships. Specifically, the spatially varying processes associated with the modeled relationships between the landscape and various driving factors often occur at different spatial scales. The degree or level of spatial heterogeneity may vary given different relationships between the landscape and urbanization factors [36,37]. For example, an increase in landscape sensitivity might be a function of both global climate change and inappropriate local land reclamation [38]. Similarly, the impact of population density on landscape patterns may be influenced not only by national and provincial movement patterns but also by local population mobility [39]. Therefore, the operational scale of the factors that influence landscape patterns can be divided into global, regional, and local scales.
Although GWR can address spatial heterogeneity, it only uses a single kernel bandwidth for model calibration and cannot measure the various geographic processes at different operational scales. GWR finds the “best average” scale of a non-stationary relationship and thus may exaggerate or underestimate the actual operational relationship [40,41]. Recently, Yang [42] designed a GWR method with a flexible bandwidth, called FBGWR, to measure the various scales of operational processes. Subsequently, Lu et al. [43] proposed a GWR approach with parameter-specific distance metrics and bandwidths to increase the flexibility of FBGWR. Fotheringham et al. [40] further emphasized the multiscale concept, proposing the multiscale GWR (MGWR) model, which allows the relationship between the response and the corresponding covariate to vary locally or regionally or to be stationary. MGWR can be applied to investigate the various influential factors and the corresponding processes by considering spatial heterogeneity and the operational scale.
In this article, Shenzhen was selected as the study area, and two research questions were proposed. What are the spatiotemporal varying relationships between landscape patterns and socio-economic factors of urbanization? What are the operational scales of the diverse urbanization socio-economic factors that influence landscape patterns? Specifically, landscape metrics were adopted to quantify the landscape patterns and reflect the structure or spatial configuration of the landscape [44,45,46,47,48,49]. Variables of the gross domestic product (GDP), population distribution (POP), human activity intensity (HAI) represented by night-time light data, distance to downtown area (DDA), and road density (RD) were selected as the socio-economic factors of urbanization. The selected four socio-economic factors of urbanization can reflect the degree of ecological impacts from human activities and have been widely used to indicate the process and intensity of urbanization [24,26,50].
The MGWR model was used to explore the relationships between landscape patterns and urbanization by considering spatial heterogeneity and multiscale effects in the operational processes [36,40,42,43]. The results, especially for various bandwidths, provide guidance from a new perspective for reasonable city development and planning, sustainable development, and the establishment of urban growth policies.

2. Materials and Methods
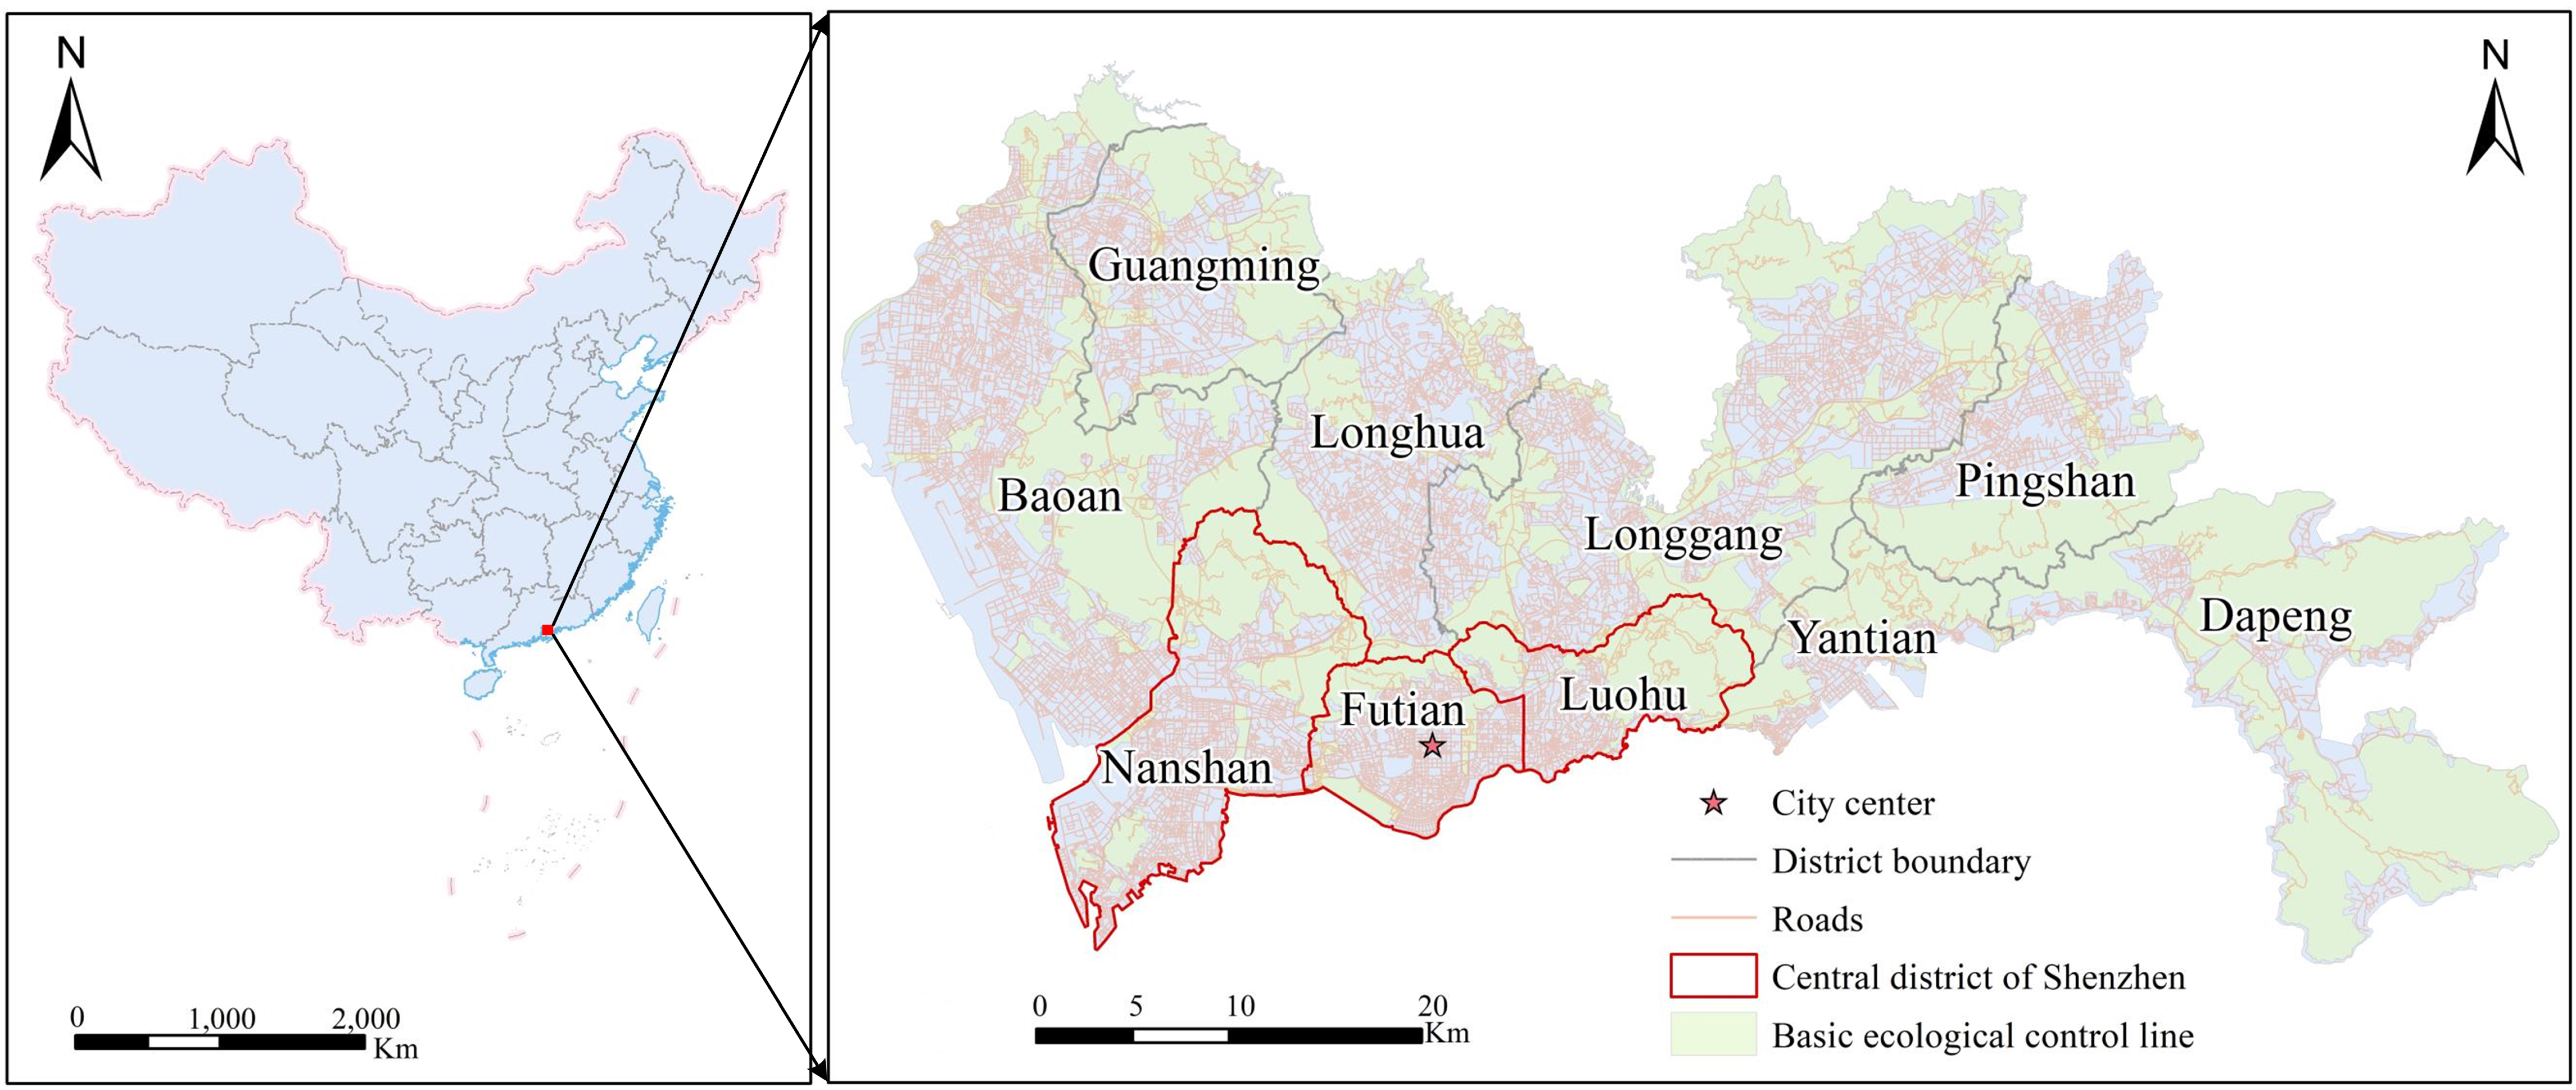
2.1. Study Area

Shenzhen (22°26′–22°51′ N and 113°45′–114°37′ E) is located in the southeastern coastal area of Guangdong Province, China (Figure 1). Due to its important position in China’s reform and opening up, the urbanization process of Shenzhen has attracted much attention. In recent decades, the land use patterns in Shenzhen have undergone rapid changes along with the expansion of construction land [51]. Correspondingly, the ecological environment has rapidly deteriorated. The prominent manifestations of this deterioration include the replacement of ecological areas by construction land and frequent land reclamation near the sea. Many studies have noted that Shenzhen has suffered from a series of increasingly serious environmental problems, including mangrove degradation, heavy metal pollution in the soil, and a marine environment destroyed by rapid urbanization [52,53,54]. In response, the government adopted a series of policies and measures from 2000 to 2015.

2.2. Data Collection and Pre-Processing

High-quality land use and land cover (LULC) data (overall accuracy >90%) were acquired from survey data on land use change provided by the Shenzhen Municipal Bureau of Planning and Natural Resources (http://pnr.sz.gov.cn/). Compared with the land use data interpreted by high-resolution remote sensing images, the survey change data used in this paper are much more accurate, adaptive, and flexible, although they are farther from being real-time data. The LULC data from 2000, 2005, 2010, and 2015 were classified based on different standards. To analyze the spatiotemporal changes in the landscape pattern, it is necessary to unify the land use classification standards. Based on the Chinese “Current Land Utilization Classification” (Standardization Administration of the People’s Republic of China, 2007), the land use datasets were classified into eight types: farmland, garden land, forest land, grassland, residential and industrial land, roads, water, and “other”.
Variables of GDP, POP, HAI, DDA, and RD were selected as the socio-economic factors of urbanization. Specifically, GDP is used to represent the local economic development; POP is the population distribution indicated by population density; HAI measured by night-time light data is the proxy of human activity intensity; DDA is the distance to downtown area; and RD is the road density in a given scale (i.e., 1 km). Considering that Shenzhen follows a polycentric model, the Futian Central Business District (Futian CBD)—the downtown center of Shenzhen—was selected for detailed analysis. The road network data was obtained from the Shenzhen Municipal Bureau of Planning and Natural Resources. The other socio-economic factors of urbanization data, including GDP, POP, and night-time light data from 2015, were downloaded for free from the Data Center for Resources and Environmental Sciences, Chinese Academy of Sciences, at a resolution of 1 km (http://www.resdc.cn). Night-time light data from 2000, 2005, and 2010 were acquired from the National Centers for Environmental Information (https://ngdc.noaa.gov/eog/dmsp.html). To compare each of the bandwidths obtained from the MGWR models, all the dependent and independent variables were standardized to the same range of variation. This article used a 1 km × 1 km grid as the basic analysis unit to measure the landscape metrics and driving factors, as this scale can reflect the distinctive spatial signatures of landscape patterns without information redundancy or loss [28]. To maintain the continuity of data, this study did not include island areas.

2.3. Measurements of Landscape Patterns
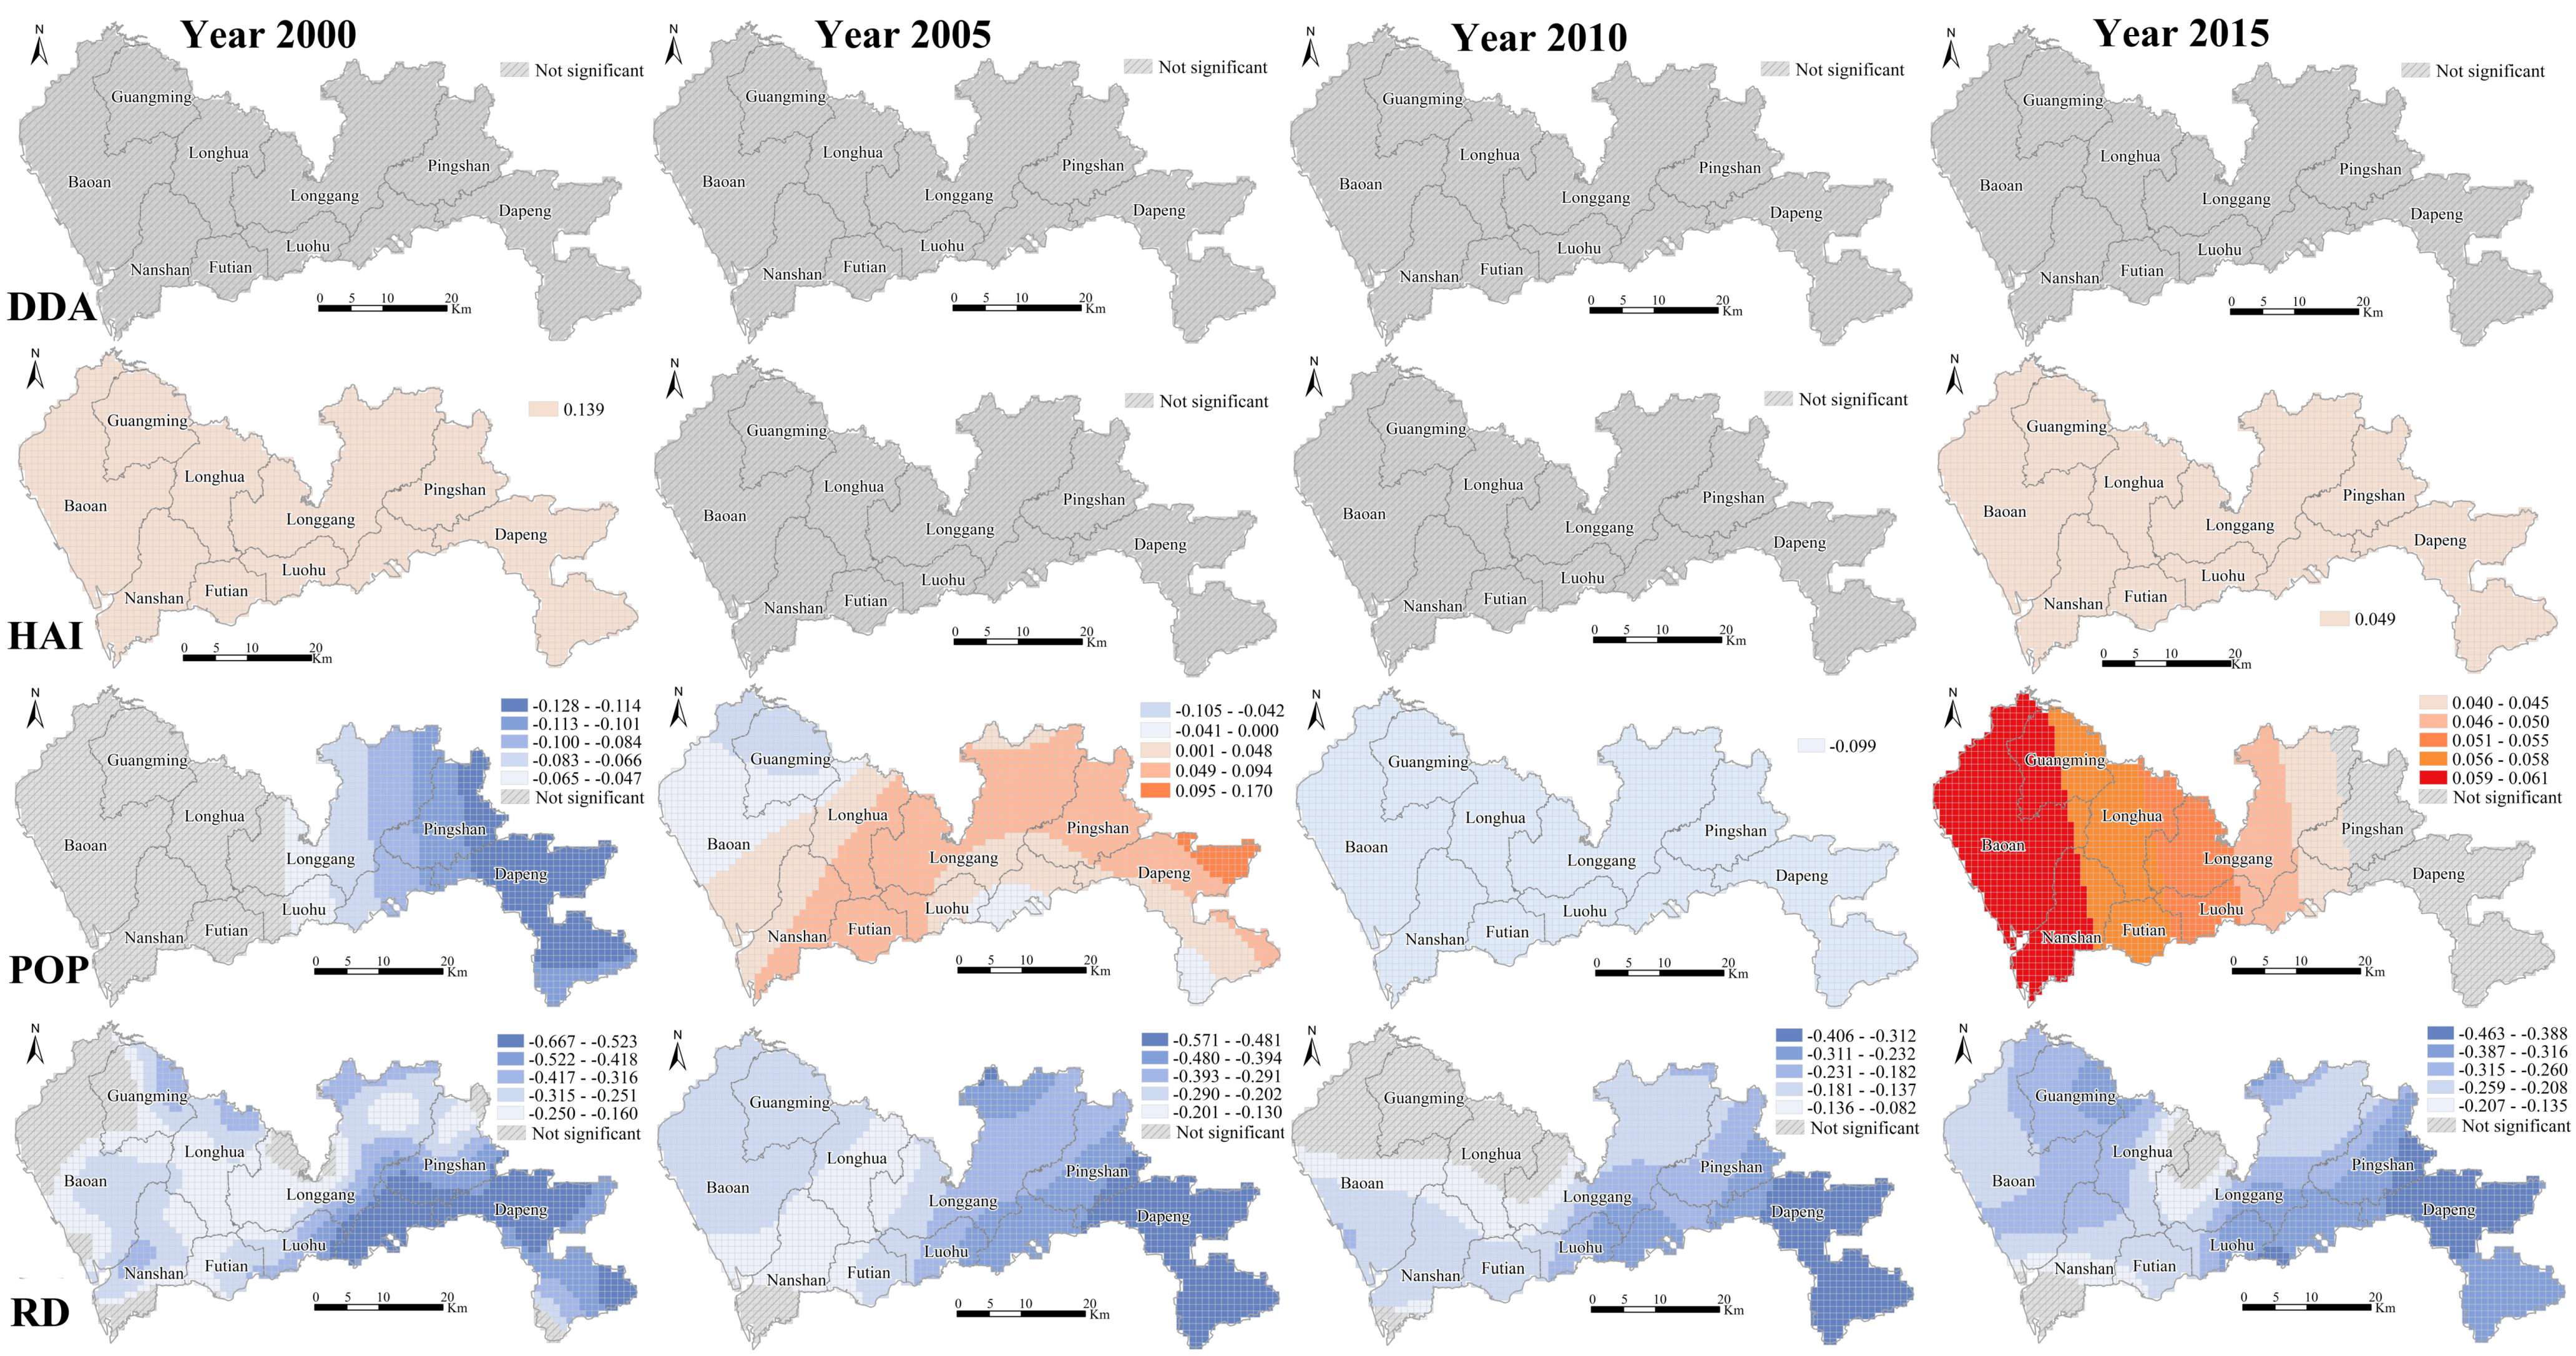
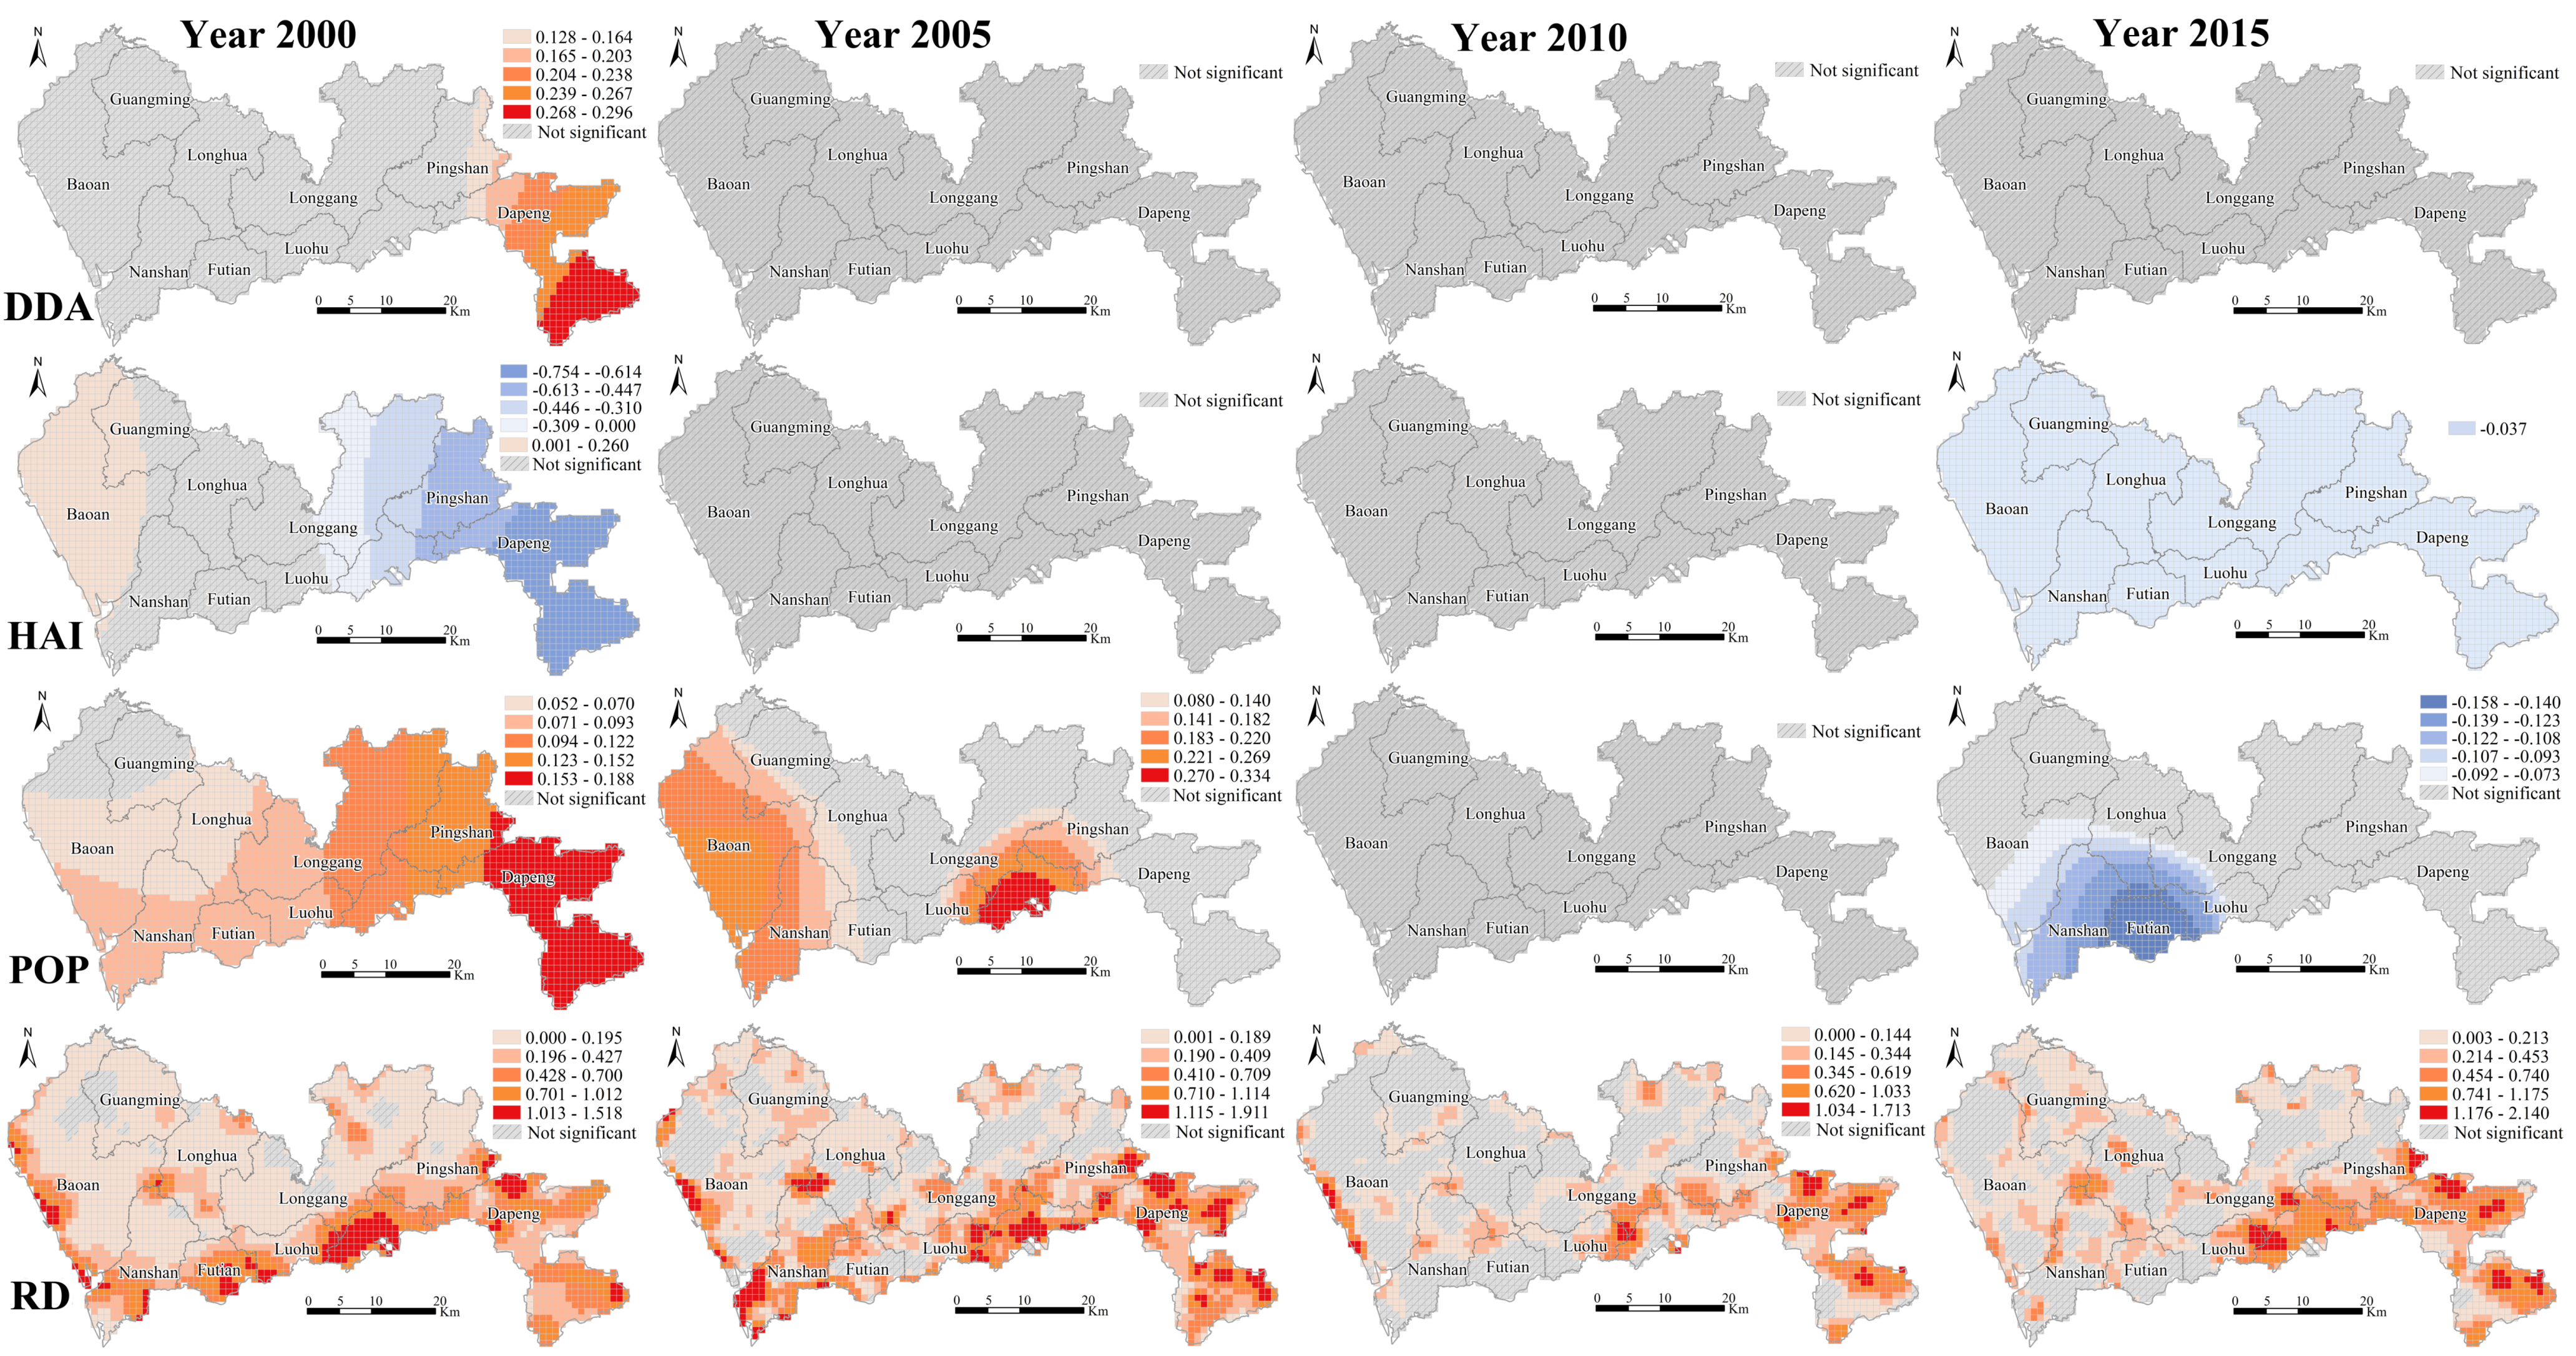
Based on the selection criteria used in existing studies [4,24,26], we chose four landscape metrics to describe the landscape patterns—the aggregation index (AI), edge density (ED), patch density (PD) and Shannon diversity index (SHDI)—as these capture the perspectives of aggregation, fragmentation, and diversity, which can be associated with the sustainability of land use. The redundancy among the selected indexes is low; they are complementary and together can encompass sufficient information [3,26]. The four metrics also support comparison with existing studies and are able to reflect the characteristics of landscape patterns for Shenzhen. All landscape metrics at the landscape level were measured using Fragstats 4.2 [55,56].
The AI refers to the aggregation degree of the landscape, which is important in landscape ecological studies as a step in relating patterns to ecological processes [57].
A I = [ g i m a x g i ] × 100
where g i represents the number of like adjacencies (joins) among pixels of patch type (class)   i based on the single count method.
The ED denotes the stability and complexity of the landscape. The larger the value of the ED, the more easily the land use type changes.
E D = E / A
where E is the total length of the patch boundary, and A is the total area of the landscape.
The PD is used to represent the density of the land use type and the fragmentation degree.
P D = N / A
where N is the total number of patches, and A is the total area of the landscape.
The SHDI is applied to reflect the heterogeneity and uncertainty of the landscape.
SHDI = i = 1 s [ p i × ln ( p i ) ] ln ( s )
where s is the total number of landscape classes and p i is the areal proportion of the i th landscape class. If p i = 0 , p i × ln ( p i ) = 0 .

2.4. Multiscale GWR

GWR is a type of local regression technique that can effectively address and explain spatial heterogeneity [23,58]. GWR is implemented as follows in this study:
log ( y i ) = β 0 ( u i , v i ) + k = 1 p β k ( u i , v i ) log ( x i k ) + ε i , i = 1 , 2 , , n
where ( u i , v i ) are the spatial coordinates of the i th sample; p is the number of urbanization driving factors; x k represents the independent variables, including the GDP, POP, HAI, DDA, and RD ;   β k ( u i , v i ) is the estimated coefficient of the i th sample for the k th variable ;   β 0 ( u i , v i ) is the intercept term; ε i is the error term; and y is the dependent variable, representing the landscape metrics.
Some scholars have noted that the bandwidth directly influences the scale variations of the estimated parameters [36,37,58,59]. GWR uses a uniform bandwidth for all independent variables to control the effects of the distance decay rate, but as a result, it is difficult to capture the different levels of spatial heterogeneity. MGWR is an extension of GWR that specifies an exclusive bandwidth for each variable to measure multiscale effects in the process of model calibration. The multiscale effects measured by MGWR mean that the effects of independent variables on dependent variables have differences in spatial variation [40]. The logarithmic form of MGWR is fitted based on the following structure:
log ( y i ) = β b w 0 ( u i , v i ) + k = 1 p β b w k ( u i , v i ) log ( x i k ) + ε i
where β b w k ( u i , v i ) is a new conceptual function denoting that each independent variable has a specific bandwidth; that is, considering the relationships between independent variables and the dependent variable, different spatial bandwidths are used for local parameter estimation. GWR is a special case of MGWR in which the parameters of all independent variables vary at the same spatial scale.
The distinct difference between GWR and MGWR is that MGWR assumes that all the modeled relationships have a specific bandwidth representing the operational scale. Referencing the methods of Yang [42], Lu et al. [43], and Fotheringham et al. [40], a backfitting algorithm is suitable and applicable for MGWR calibration. The process of calibrating MGWR based on the backfitting algorithm is given as follows.
Step 1. All the adaptive terms on the right side of Equation (6) are denoted as as f ^ 0 ( 0 ) , f ^ 1 ( 0 ) , f ^ 2 ( 0 ) ,…and f ^ p ( 0 ) . Initial guess values are assigned for f ^ 0 ( 0 ) , f ^ 1 ( 0 ) , f ^ 2 ( 0 ) ,…and f ^ p ( 0 ) . Therefore, the initial error is ε ( 0 ) = y f ^ 0 ( 0 ) f ^ 1 ( 0 ) f ^ 2 ( 0 ) f ^ p ( 0 ) . The initial guesses for the estimated coefficients can be determined according to the results of OLR or GWR.
Step 2. The criteria for terminating the backfitting algorithm are specified based on the maximum number of iterations Φ and the convergence threshold δ .   q is the index of the current iteration, and the initial q value is set to zero. The change of score ( COS ) is calculated after each iteration based on the residual sum of squares ( RSS ) as follows.
COS RSS ( q + 1 ) = | RSS ( q + 1 ) RSS ( q ) | RSS ( q + 1 )
Step 3. Each additive term f ^ k ( q ) is updated using the error term and then regressed with the corresponding independent variable x k . When q > Φ or COS < δ , the backfitting procedure is terminated. Otherwise, the backfitting algorithm continues to iterate. The estimation coefficients in the final iteration are the final estimated coefficients. Therefore, the final fitting values for y are as follows.
y ^ ( q + 1 ) = f ^ 0 ( q + 1 ) + f ^ 1 ( q + 1 ) + f ^ 2 ( q + 1 ) + + f ^ p ( q + 1 )
In this article, all calibrations of the MGWR models were undertaken by MGWR2.0 software (https://sgsup.asu.edu/sparc/mgwr) [60].

3. Results

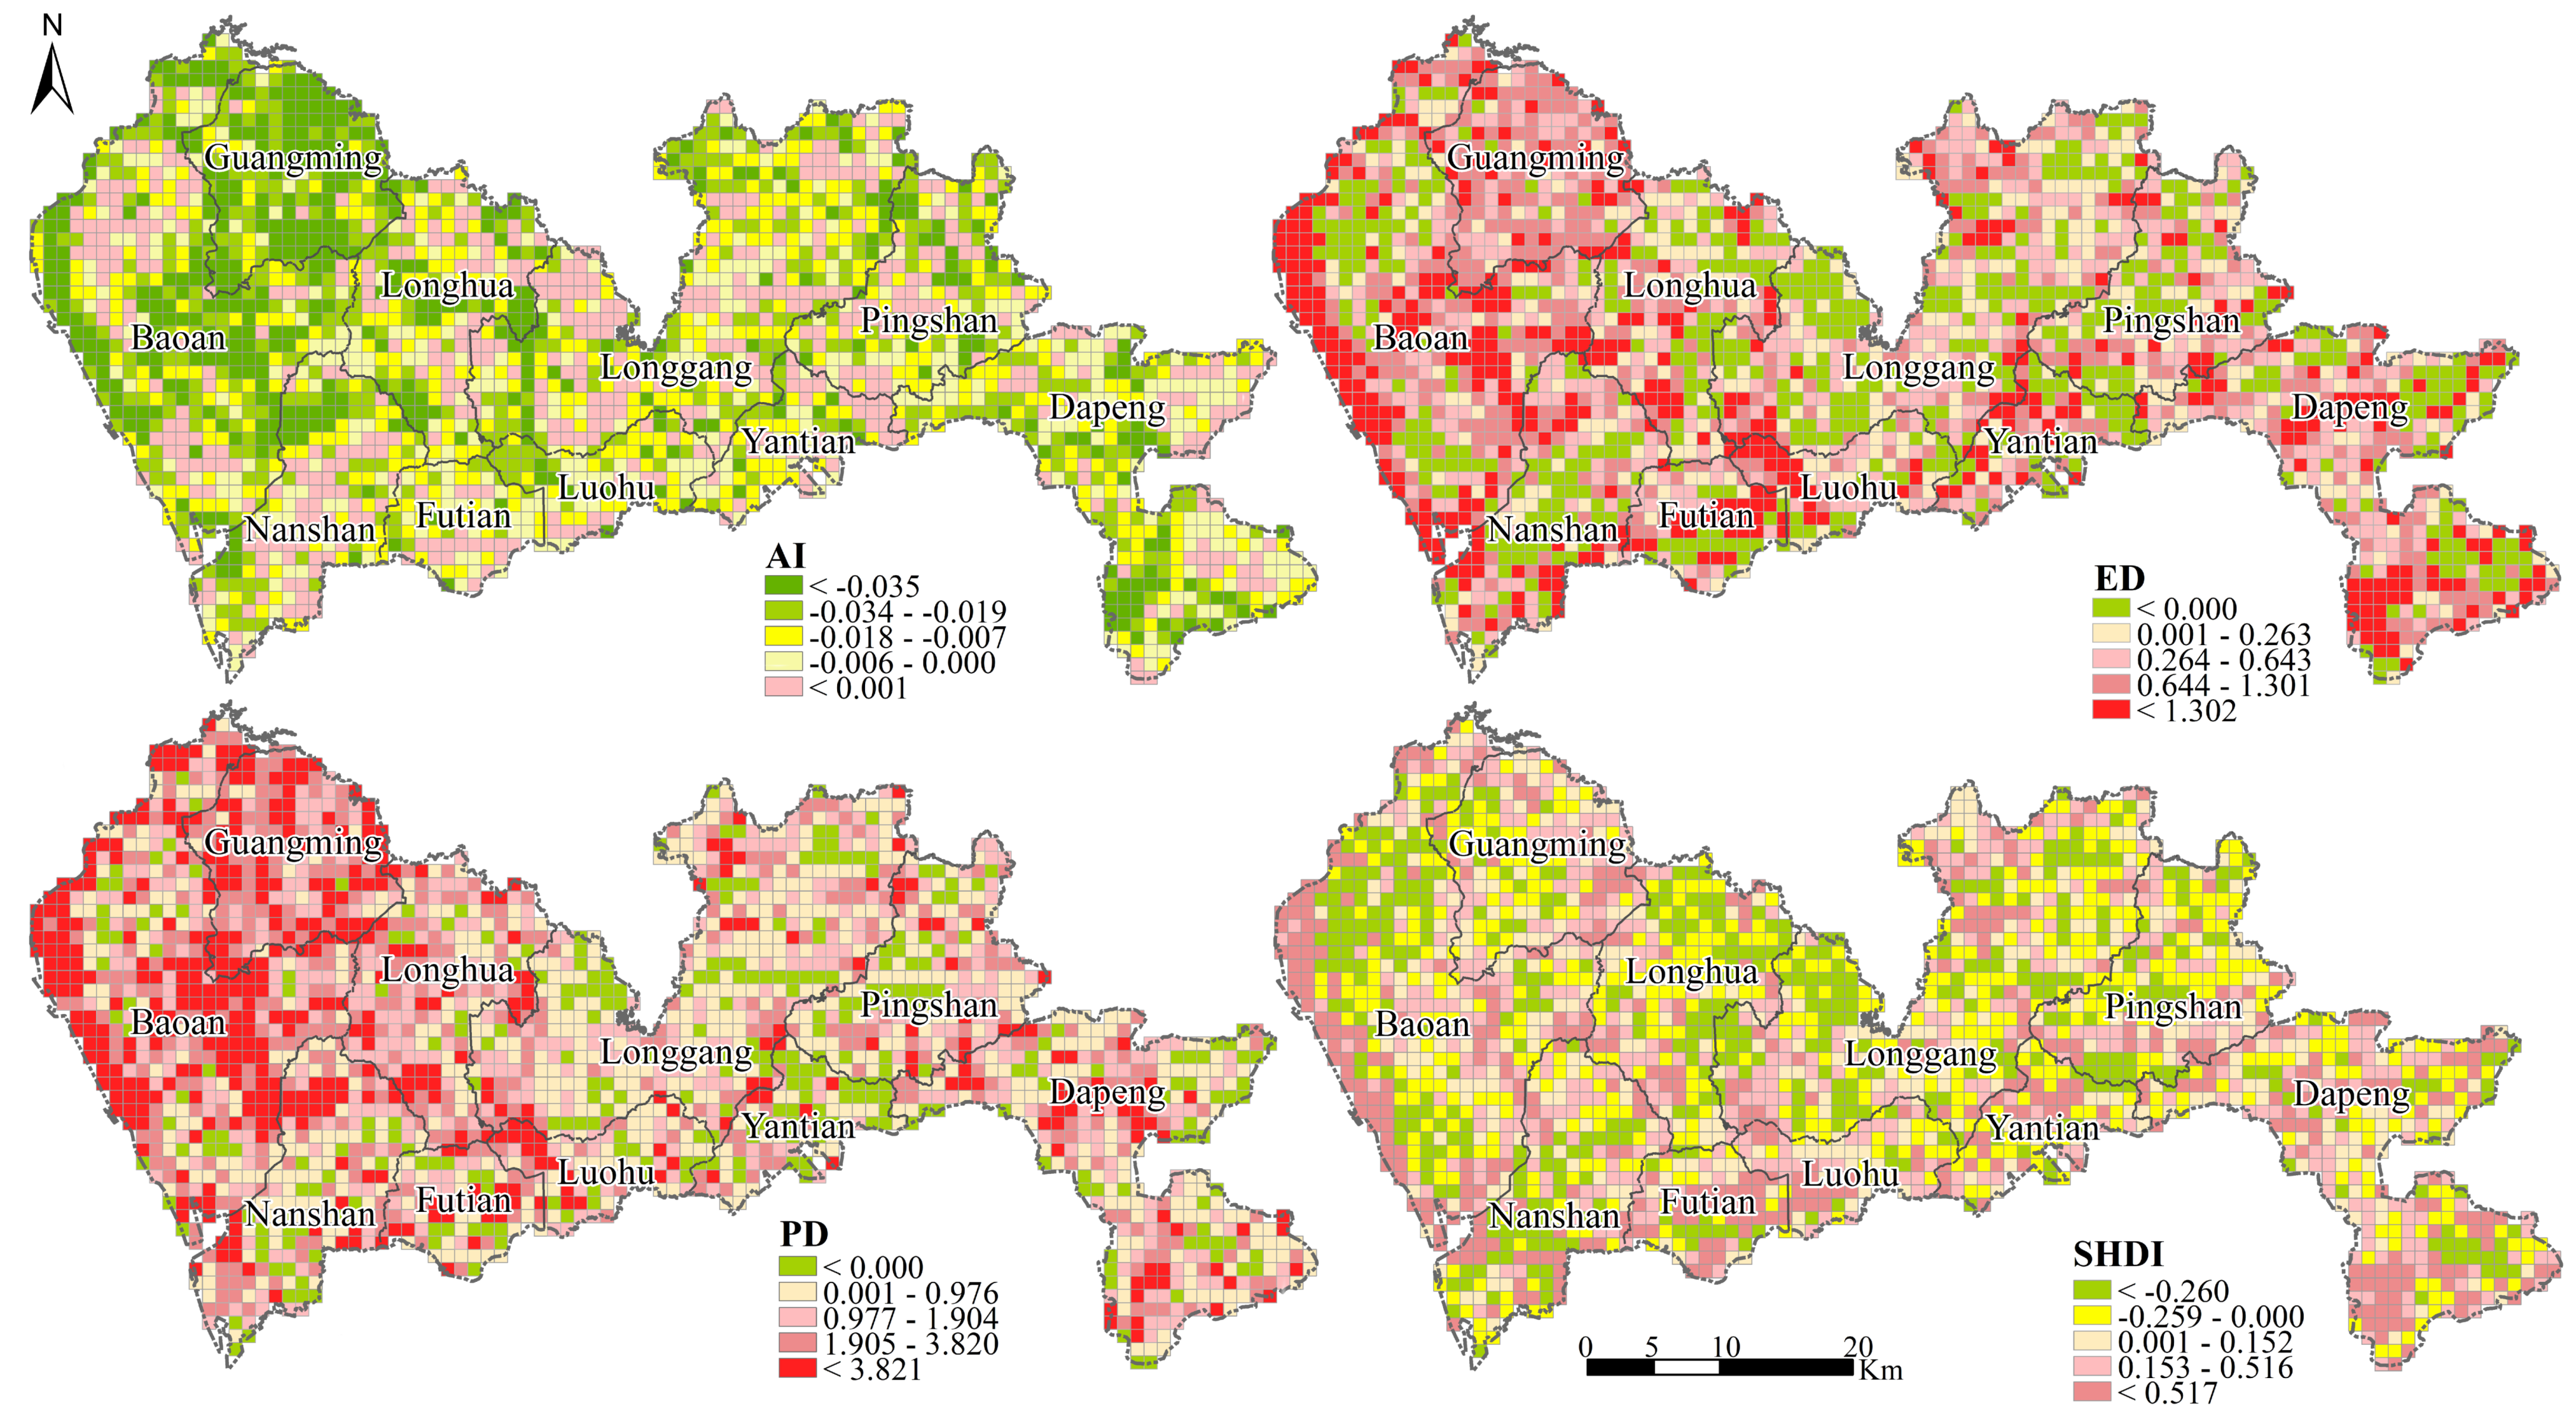
3.1. Dynamics of Land Use and Landscape Patterns

To obtain a better understanding of the quantitative results, we mapped the changes in metrics between 2000 and 2015 based on Equation (9), as proposed by Su et al. (2012).
C = R 2015 R 2000 R 2000
According to Figure 2, the major trends in landscape patterns can be summarized as less isolated with a decline in the AI; more unstable, fragmented, and broken with increases in the ED and PD; and more homogeneous with an increasing SHDI. Obviously, all landscape metrics represent characteristics of spatial heterogeneity in that the changes in different landscape indicators are non-stationary in space. In brief, Shenzhen experienced rapid urbanization and development from 2000 to 2015, and given notable increases in construction land area, urban landscape patterns changed considerably. The most significant changes occurred in the west of Shenzhen, indicating that the western region of Shenzhen has a higher urbanization rate than the eastern region.
Specifically:
  • The AI decreased in most parts of Shenzhen, indicating that the landscape became increasingly fragmented and the influence of human activity on the landscape increased. The AI in highly urbanized areas displayed positive growth, indicating a concentrated landscape pattern, and construction land largely replaced the original cultivated land and grassland areas.
  • The ED increased near the coastline of Shenzhen, indicating that the landscape use types changed, mainly due to land reclamation in Shenzhen. Most areas experienced ED increases, and the distribution of these changes was consistent with that of the AI.
  • The PD significantly increased in most areas, especially in the center and sub-centers of Shenzhen. In the Futian, Luohu, and Longgang districts, increases in PD resulted from increases in green space. Additionally, growth in the number of urban roads disrupted the original single residential and industrial land patterns and divided the landscape into smaller patches. In other areas with an increasing PD, many of the cultivated land, forest, garden, and water areas were transformed into residential and transportation land areas, thereby dividing the natural landscape, resulting in an increase in PD.
  • There was an increase in the SHDI near the coastline and in some ecologically controlled areas. Considering the rational allocation of urban resources, other landscape types, such as grasslands and woodlands, should be appropriately added in these areas to optimize and balance the urban environment. Some areas had reduced SHDI values that resulted from gardens and woodlands being replaced by residential land and transportation land. When multiple landscape types are reduced to a small number of single types of land, the diversity of the landscape is reduced.

3.2. Performance of Models

We first implemented an inspection method for identifying collinearity between the five driving factors to avoid mutual influence among variables. The variance inflation factor values of GDP were found to be greater than 10, indicating that GDP had apparent collinearity with the other four factors. Therefore, this study selected the DDA, HAI, POP, and RD as the driving factors to model the relationships between landscape patterns and the socio-economic factors of urbanization. Although the fitting degree of OLR models is relatively low, both the models and the selected variables were all statistically significant at the 1% level, as in previous studies, which showed that the selected variables could explain the changes in landscape patterns. In the GWR and MGWR methods, a Gaussian kernel function and a fixed bandwidth were chosen without loss of generality. Table 1 lists the results of GWR and MGWR, and they suggest that MGWR achieves the best performance.

4. Discussion

4.1. Changes in the Spatial Relationships and Operational Scales

MGWR was applied to assess the operational scales of the process and to capture the differences in the spatial heterogeneity levels of various driving factors. Table 2 lists the bandwidths of GWR and MGWR and indicates that the GWR models all have a single bandwidth and can be explained as a weighted average of multiscale effects [40]. The MGWR with diverse bandwidths allowed the relationships between independent and dependent variables to vary at different scales [42]. The bandwidths could be distinguished for relationships varying at the local, regional and global scales. A small bandwidth means that the relationship varies at a relatively local scale, while a higher bandwidth indicates a larger scale.
Some bandwidths of MGWR were approximately 97 km, and this value is close to the maximum distance between any two samples. This finding indicated that these relationships between landscape patterns and urbanization factors tended to be global. Other bandwidths were limited to the range of 1.013–37.615 km, reflecting low, medium, and high levels of spatial heterogeneity in relationships. The distinctions among the optimal bandwidths of different covariates may have arisen from differences in the statistical and measurement units and operational functions. The time-varying bandwidths of individual variables were important for capturing the effects of the corresponding variables, which are significant for urban planning from the perspective of global or local planning. In almost all years, POP and RD had local effects on the four types of landscape metrics. The bandwidths of RD were smaller and more stable than those of POP, which suggested that the relationships between landscape patterns and RD had a higher level of spatial heterogeneity. The effects of the DDA and HAI on the AI exhibit global characteristics. For ED, PD, and the SHDI, the effects of the DDA and HAI yielded significant transformations. These results showed that Shenzhen is developing towards a polycentric urban pattern and that the role of the downtown area is diminishing. Human activity no longer depends solely on the downtown center of the city. Therefore, the effects of the DDA tend to be global. Many districts have distinct sub-centers with improved infrastructure, and the Futian CBD is not the only center in Shenzhen.

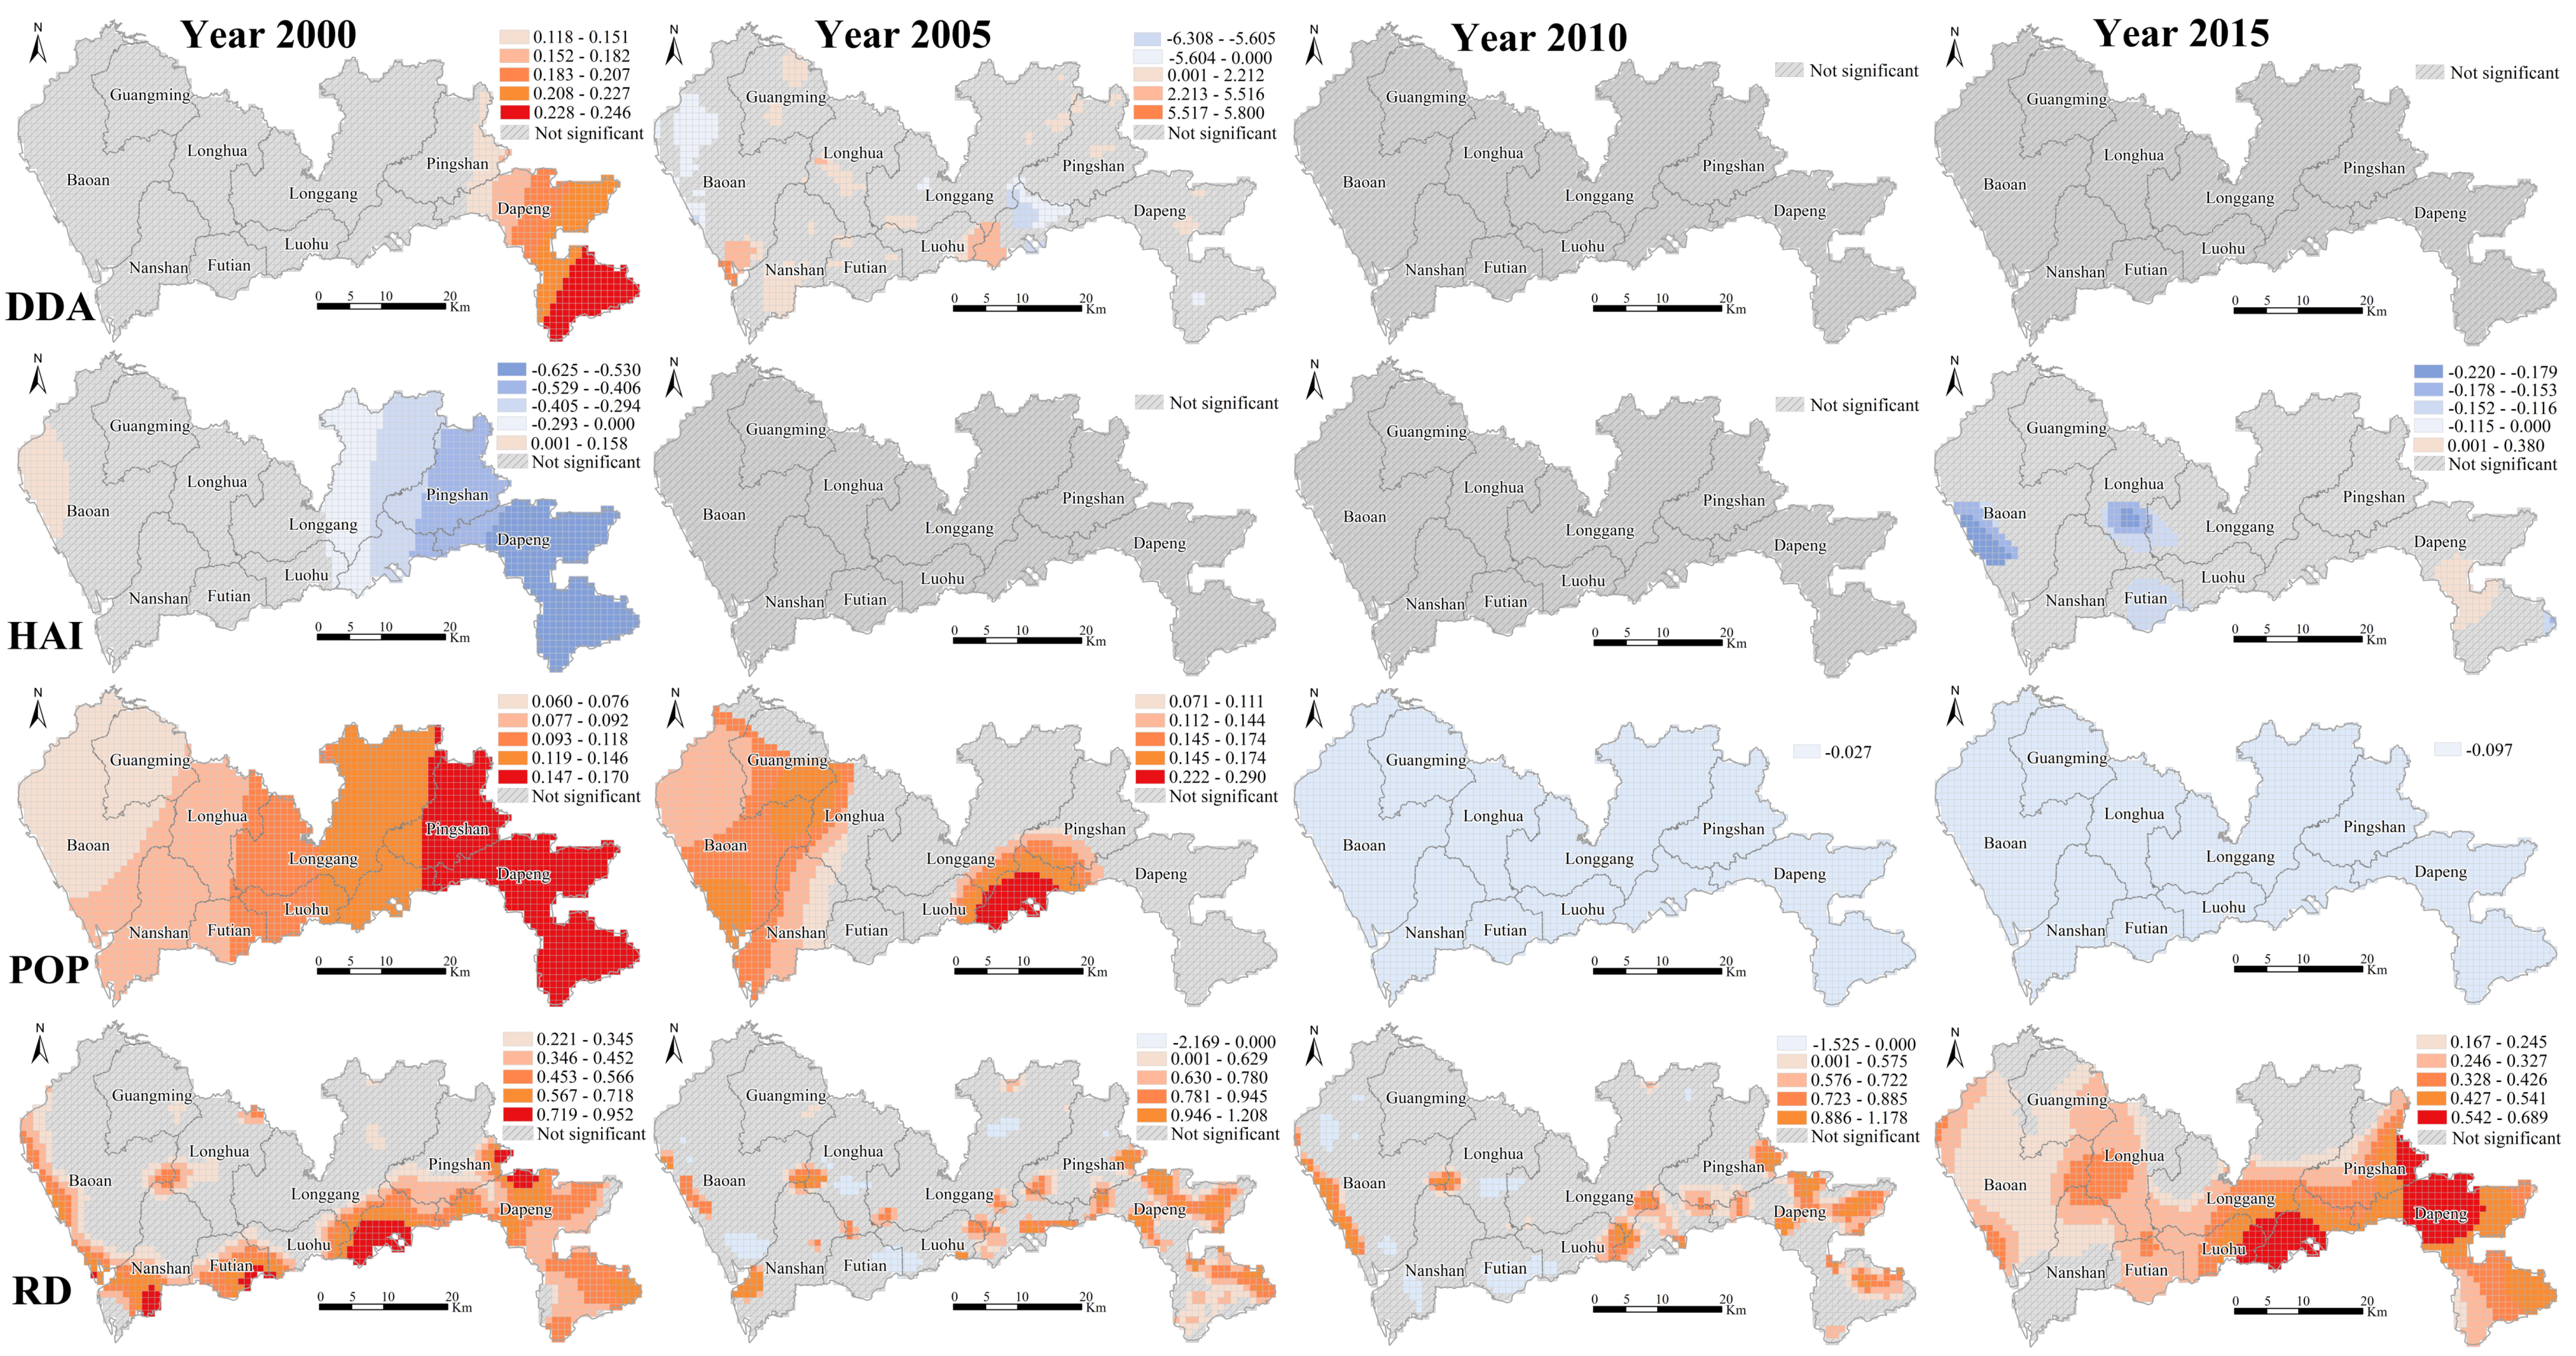
4.2. Impact of Socio-Economic Factors on Landscape Patterns

The AI refers to the aggregation degree of the landscape, and Figure 3 shows the effects of driving factors on the AI represented by the estimated coefficients with statistical significance. Although the effects of the DDA on the AI were global, the estimated coefficients were not significant, which illustrated that the DDA factor is negligible for AI changes in Shenzhen. In 2000 and 2015, the HAI had a positive global effect on changes in Shenzhen. Some studies have shown that there is a strong correlation between the HAI and GDP [61], suggesting that the AI changes in Shenzhen were affected by the economic level in 2000 and 2015. Temporal variations in the effects of POP are apparent. In 2000, those effects of POP on the AI with statistical significance were negative. This result can be explained by a low POP resulting in a high AI. In 2015, the relationship between POP and the AI was statistically positive, and the effects increased from east to west. Although the eastern region of Shenzhen is not part of the core area of the city, the population density is low (Figure 1). With the recent increased urbanization, construction in areas surrounding the nature reserve accelerated, corresponding to a decrease in the AI. Finally, RD was observed to have negative effects on the AI. Specifically, the coefficients indicated that the closer to the main road an area is, the lower the AI. A previous study indicated that roads can separate adjacent lands on both sides and result in a decline in agglomeration [62].
ED and PD can effectively indicate the degree of landscape fragmentation. Figure 4 and Figure 5 show the estimated coefficients for ED and PD, respectively. ED denotes the stability of the landscape. The rate of change in ED in Shenzhen indicated that the degree of landscape fragmentation increased, and the shape of the landscape became more complex [63]. According to the Figure 4, the effects of the DDA on ED are relatively stable over time, only in 2000 did the DDA have a positive effect on ED in eastern Shenzhen. The closer to the downtown center an area is, the lower the ED, which reflected an unstable landscape. The effects of the HAI on ED were complicated, especially in 2000, which showed significant east–west differences. In 2015, the overall relationship between the HAI and ED was negative, which suggested that the index of ED in developed regions is affected in a manner similar to that in undeveloped regions. The temporally varying effects of HAI on ED were clearly changing from local to global, which can illustrate that the level of urbanization changes the landscape pattern in time and space. In 2015, the relationships between POP and ED became negative in Nanshan and Futian, which indicated that urbanization mainly occurred in suburban areas and sparsely populated areas. RD had distinct effects on ED that vary in time and space. From 2000 to 2015, the effects of RD on ED were clearly positive. In the eastern mountainous areas, in particular, ED was positively impacted by RD because the influence of roads was restricted by terrain factors [24,64]. The changes in coefficients are consistent with the planning and development of roads in Shenzhen.
PD is used to represent fragmentation, and the estimated coefficients of urbanization factors on PD can be seen in Figure 5. Similar to ED, the effects of the DDA on PD experienced a great transformation. In 2000, the positive effects were concentrated in eastern areas far from the downtown center, but since 2005, the effects of the DDA were positive in most significant areas. The reason for this change is that Shenzhen has multiple sub-centers with group developments, and the uniqueness and specificity of the original downtown area diminished. Moreover, the urbanization processes spread to some undeveloped suburbs. The effects of POP on PD also underwent a notable change in which local positive effects transformed into local negative effects. The positive effects of POP on PD indicated that a high intensity of human activity can result in a high degree of landscape fragmentation. The effects of RD on PD showed local variation in all years, and a positive effect was the main characteristic. This result suggested that roads are an important factor related to urbanization and that when choosing potential construction areas, the convenience of transportation should be considered. The construction of roads has gradually occupied urban green space resources, resulting in significant landscape heterogeneity and a high segmentation degree of various types of patches [65].
In Figure 6, in the early urbanization processes, the downtown center had different degrees of influence on the landscape diversity in different areas. Similar to PD, the effects of the DDA on the SHDI were significant in 2000 and 2005. The variations in changes in the HAI represented different changes in the eastern and western areas and were only significant in 2000 and 2015. This pattern was directly related to the planning policy and urban development model in Shenzhen. The relationship between POP and the SHDI shifted from positive to negative: the denser the population was, the greater the impact of human activities. Urbanization led to the expansion of construction land, increasing the complexity of the landscape. The effects of RD on the SHDI were positive. Notably, the influence of RD on the SHDI varied widely, particularly for areas in different stages of urbanization.

4.3. Implications for Urban Planning

Achieving a win–win relationship between socio-economic development and the sustainable development of land use should harmonize land use and economic development policies [10]. Important implications for urban planning and management and the mitigation of excessive urban expansion were provided by two perspectives: the variations in the bandwidths of the time dimension for each socio-economic factor of urbanization and the variations in the local estimated coefficients in the spatial dimension. First, MGWR is a promising model that can quantify and reflect the levels of urbanization and ecological protection considering both the operational scale and spatial variations, which have rarely been studied before. The results obtained from MGWR not only identified the various impacts of urbanization but also reflected the global and local relationships between socio-economic factors and different landscape metrics. Although some spatial and temporal variations in estimated coefficients and operational scales could not be explained well, most of the results could reflect the relationships between landscape metrics and urbanization’s socio-economic factors.
Second, MGWR can produce specific bandwidths for each driving factor, from which the operational effects of urbanization variables can be evaluated over time, thereby reflecting the local urbanization processes. The results regarding bandwidth could help managers to formulate overall planning policies or provide local guidance that is targeted and practical. The traffic network plays an important guiding role in the dynamic development of urban land in Shenzhen. The effects of other urbanization factors also led to land transformations. The main reason for these changes was that in 2009, Shenzhen transitioned into a period of intense urbanization, mainly through the secondary development of land to re-create urban areas, optimize the urban land structure, and improve urban function.
Finally, MGWR yields a set of spatial variation coefficients from which we could determine the different effects of various urbanization factors on the landscape. The local effects of urbanization factors on landscape patterns reflected obvious differences between the eastern and western regions, which indicated that one of the prominent patterns of urban development in Shenzhen is an east–west pattern. In addition, the effects of POP on landscape patterns manifested as radial ring structures. The rapid development of these regions is expected to form new urban centers as the integration process and eastward strategy continue to advance. “Implementation of the strategic action plan for Shenzhen’s eastward movement (2016-2020)” (http://www.sz.gov.cn/cn/) noted that the unbalanced patterns in the east and west and in the south and north will be a target of change to break the bottleneck of urban development and realize the expansion of high-value land.

5. Conclusions

The impacts of rapid urbanization on landscapes are a major concern for local ecological planners and city managers. This study is the first trial applying MGWR to examining the spatial and temporal relationships between landscape patterns and the socio-economic factors of urbanization. The results of this article highlighted that the socio-economic factors of urbanization have profound and significant effects on the changes of landscape patterns. Therefore, the balance between the urbanization processes (e.g., economic development, population expansion, and road planning) and rational land use is particularly important. The results can improve understanding of the spatiotemporal variation in landscape patterns for managers and urban planners. Compared with previous studies, this article did only reveal the spatial heterogeneity in relationships but also measured the operational scales of the spatially varying relationships. The findings highlighted the importance of considering the operational scale in urbanization and landscape studies; specifically, each urbanization factor has a unique operational scale that may vary over time. These results can improve our understanding of urbanization processes and provide guidance for urban management and policymaking in developing cities. More importantly, the findings also suggested that artificial urbanization factors have significant effects on landscape patterns. To protect the local ecological environment, the government should significantly increase efforts towards the supervision and assessment of urbanization processes. In different periods of urban development, corresponding measures should be taken to prioritize various social and economic factors that could greatly aggravate the destruction of the landscape patterns.
However, this study still had some limitations. First, limited by data availability, we only set the study period from 2000 to 2015. It is important to study the relationships between landscape patterns and urbanization starting with the reform and expansion policies. Second, the urbanization factors were limited, and some were neglected, including the city sub-centers and the distribution of facilities. Finally, for the reclassification of land use data, due to the limited socio-economic factors of urbanization and landscape metrics, some bias and unexplained phenomena remain in the results. Therefore, in future work, we will try to collect more data, including the socio-economic factors of urbanization and more comprehensive land use time series data with more detailed classification information, to conduct more complete analyses of the landscape patterns and urbanization processes in Shenzhen.

Author Contributions

Data curation, Y.P. and M.C.; Funding acquisition, C.W.; Investigation, P.L. and M.C.; Methodology, P.L. and C.W.; Project administration, C.W.; Resources, S.L.; Software, P.L.; Visualization, C.W.; Writing—original draft, C.W. and P.L.; Writing—review and editing, X.Y. All authors have read and agreed to the published version of the manuscript.

Funding

This research was funded by the National Natural Science Foundation of China (Grant number 41901326), the Natural Science Foundation of Jiangsu Province (Grant number BK20190742), the Natural Science Research of Jiangsu Higher Education Institutions of China (Grant number 19KJB170009), the Open Fund of Key Laboratory of Urban Land Resources Monitoring and Simulation, MNR (Grant number KF-2019-04-078) and the Open Research Fund Program of Key Laboratory of Digital Mapping and Land Information Application Engineering (Grant number NASGZRZYBWD201906), NJIT FSG FY20 Faculty Seed Grant Award, NSF OAC(Grant number 1739491) and NSF OIA(Grant number 1937908).

Conflicts of Interest

The authors declare no conflicts of interest.

References

  1. Bennett, A.B.; Gratton, C. Local and landscape scale variables impact parasitoid assemblages across an urbanization gradient. Landsc. Urban Plan. 2012, 104, 26–33. [Google Scholar] [CrossRef]
  2. Buyantuyev, A.; Wu, J. Urban heat islands and landscape heterogeneity: Linking spatiotemporal variations in surface temperatures to land-cover and socioeconomic patterns. Landsc. Ecol. 2010, 25, 17–33. [Google Scholar] [CrossRef]
  3. Su, S.; Ma, X.; Xiao, R. Agricultural landscape pattern changes in response to urbanization at ecoregional scale. Ecol. Indic. 2014, 40, 10–18. [Google Scholar] [CrossRef]
  4. Yeh, C.; Huang, S. Investigating spatiotemporal patterns of landscape diversity in response to urbanization. Landsc. Urban Plan. 2009, 93, 151–162. [Google Scholar] [CrossRef]
  5. Zeng, C.; Zhang, A.; Xu, S. Urbanization and administrative restructuring: A case study on the Wuhan urban agglomeration. Habitat Int. 2016, 55, 46–57. [Google Scholar] [CrossRef]
  6. Feng, Y.; Liu, Y.; Tong, X. Spatiotemporal variation of landscape patterns and their spatial determinants in Shanghai, China. Ecol. Indic. 2018, 87, 22–32. [Google Scholar] [CrossRef]
  7. Chen, M.; Liu, W.; Tao, X. Evolution and assessment on China’s urbanization 1960–2010: Under-urbanization or over-urbanization? Habitat Int. 2013, 38, 25–33. [Google Scholar] [CrossRef]
  8. Kabisch, N. Ecosystem service implementation and governance challenges in urban green space planning—The case of Berlin, Germany. Land Use Policy 2015, 42, 557–567. [Google Scholar] [CrossRef]
  9. Debbage, N.; Shepherd, J.M. The urban heat island effect and city contiguity. Comput. Environ. Urban Syst. 2015, 54, 181–194. [Google Scholar] [CrossRef]
  10. Du, X.; Huang, Z. Ecological and environmental effects of land use change in rapid urbanization: The case of hangzhou, China. Ecol. Indic. 2017, 81, 243–251. [Google Scholar] [CrossRef]
  11. Grimm, N.B.; Faeth, S.H.; Golubiewski, N.E.; Redman, C.L.; Wu, J.; Bai, X.; Briggs, J.M. Global change and the ecology of cities. Science 2008, 319, 756–760. [Google Scholar] [CrossRef] [PubMed] [Green Version]
  12. He, C.; Liu, Z.; Tian, J.; Ma, Q. Urban expansion dynamics and natural habitat loss in China: A multiscale landscape perspective. Glob. Chang. Biol. 2014, 20, 2886–2902. [Google Scholar] [CrossRef] [PubMed]
  13. Li, Z.; Ma, Z.; van der Kuijp, T.J.; Yuan, Z.; Huang, L. A review of soil heavy metal pollution from mines in China: Pollution and health risk assessment. Sci. Total Environ. 2014, 468, 843–853. [Google Scholar] [CrossRef] [PubMed]
  14. Xu, Q.; Yang, R.; Dong, Y.-X.; Liu, Y.-X.; Qiu, L.-R. The influence of rapid urbanization and land use changes on terrestrial carbon sources/sinks in Guangzhou, China. Ecol. Indic. 2016, 70, 304–316. [Google Scholar] [CrossRef]
  15. Li, W.; Bai, Y.; Chen, Q.; He, K.; Ji, X.; Han, C. Discrepant impacts of land use and land cover on urban heat islands: A case study of Shanghai, China. Ecol. Indic. 2014, 47, 171–178. [Google Scholar] [CrossRef]
  16. González-Pérez, J.M.; Remond-Roa, R.; Rullan-Salamanca, O.; Vives-Miró, S. Urban growth and dual tourist city in the Caribbean. Urbanization in the hinterlands of the tourist destinations of Varadero (Cuba) and Bávaro-Punta Cana (Dominican Republic). Habitat Int. 2016, 58, 59–74. [Google Scholar]
  17. Deng, J.S.; Wang, K.; Hong, Y.; Qi, J.G. Spatio-temporal dynamics and evolution of land use change and landscape pattern in response to rapid urbanization. Landsc. Urban Plan. 2009, 92, 187–198. [Google Scholar] [CrossRef]
  18. Jiao, M.; Hu, M.; Xia, B. Spatiotemporal dynamic simulation of land-use and landscape-pattern in the Pearl River Delta, China. Sustain. Cities Soc. 2019, 49, 101581. [Google Scholar] [CrossRef]
  19. Gustafson, E.J. Quantifying landscape spatial pattern: What is the state of the art? Ecosystems 1998, 1, 143–156. [Google Scholar] [CrossRef]
  20. Pickett, S.T.; Cadenasso, M.L. Landscape ecology: Spatial heterogeneity in ecological systems. Science 1995, 269, 331–334. [Google Scholar] [CrossRef]
  21. Vranken, I.; Baudry, J.; Aubinet, M.; Visser, M.; Bogaert, J. A review on the use of entropy in landscape ecology: Heterogeneity, unpredictability, scale dependence and their links with thermodynamics. Landsc. Ecol. 2015, 30, 51–65. [Google Scholar] [CrossRef] [Green Version]
  22. Zhou, W.; Cadenasso, M.; Schwarz, K.; Pickett, S. Quantifying spatial heterogeneity in urban landscapes: Integrating visual interpretation and object-based classification. Remote Sens. 2014, 6, 3369–3386. [Google Scholar] [CrossRef] [Green Version]
  23. Brunsdon, C.; Fotheringham, A.S.; Charlton, M.E. Geographically weighted regression: A method for exploring spatial nonstationarity. Geogr. Anal. 1996, 28, 281–298. [Google Scholar] [CrossRef]
  24. Su, S.; Xiao, R.; Zhang, Y. Multi-scale analysis of spatially varying relationships between agricultural landscape patterns and urbanization using geographically weighted regression. Appl. Geogr. 2012, 32, 360–375. [Google Scholar] [CrossRef]
  25. Pribadi, D.O.; Pauleit, S. Peri-urban agriculture in Jabodetabek Metropolitan Area and its relationship with the urban socioeconomic system. Land Use Policy 2016, 55, 265–274. [Google Scholar] [CrossRef]
  26. Li, H.; Peng, J.; Yanxu, L.; Yi’na, H. Urbanization impact on landscape patterns in Beijing City, China: A spatial heterogeneity perspective. Ecol. Indic. 2017, 82, 50–60. [Google Scholar] [CrossRef]
  27. Lustig, A.; Stouffer, D.B.; Roigé, M.; Worner, S.P. Towards more predictable and consistent landscape metrics across spatial scales. Ecol. Indic. 2015, 57, 11–21. [Google Scholar] [CrossRef]
  28. Feng, Y.; Liu, Y. Fractal dimension as an indicator for quantifying the effects of changing spatial scales on landscape metrics. Ecol. Indic. 2015, 53, 18–27. [Google Scholar] [CrossRef]
  29. Tamme, R.; Hiiesalu, I.; Laanisto, L.; Szava-Kovats, R.; Pärtel, M. Environmental heterogeneity, species diversity and co-existence at different spatial scales. J. Veg. Sci. 2010, 21, 796–801. [Google Scholar] [CrossRef]
  30. Wu, J.; Hobbs, R. Key issues and research priorities in landscape ecology: An idiosyncratic synthesis. Landsc. Ecol. 2002, 17, 355–365. [Google Scholar] [CrossRef]
  31. Szilassi, P.; Bata, T.; Szabó, S.; Czúcz, B.; Molnár, Z.; Mezősi, G. The link between landscape pattern and vegetation naturalness on a regional scale. Ecol. Indic. 2017, 81, 252–259. [Google Scholar] [CrossRef] [Green Version]
  32. Rabe, S.-E.; Koellner, T.; Marzelli, S.; Schumacher, P.; Grêt-Regamey, A. National ecosystem services mapping at multiple scales The German exemplar. Ecol. Indic. 2016, 70, 357–372. [Google Scholar] [CrossRef]
  33. Xiao, R.; Wang, G.; Zhang, Q.; Zhang, Z. Multi-scale analysis of relationship between landscape pattern and urban river water quality in different seasons. Sci. Rep. 2016, 6, 25250. [Google Scholar] [CrossRef] [PubMed] [Green Version]
  34. Burnett, C.; Blaschke, T. A multi-scale segmentation/object relationship modelling methodology for landscape analysis. Ecol. Model. 2003, 168, 233–249. [Google Scholar] [CrossRef]
  35. Jelinski, D.E.; Wu, J. The modifiable areal unit problem and implications for landscape ecology. Landsc. Ecol. 1996, 11, 129–140. [Google Scholar] [CrossRef]
  36. Murakami, D.; Lu, B.; Harris, P.; Brunsdon, C.; Charlton, M.; Nakaya, T.; Griffith, D.A. The importance of scale in spatially varying coefficient modeling. Ann. Am. Assoc. Geogr. 2019, 109, 50–70. [Google Scholar] [CrossRef]
  37. Wu, C.; Ren, F.; Hu, W.; Du, Q. Multiscale geographically and temporally weighted regression: Exploring the spatiotemporal determinants of housing prices. Int. J. Geogr. Inf. Sci. 2019, 33, 489–511. [Google Scholar] [CrossRef]
  38. Erwin, K.L. Wetlands and global climate change: The role of wetland restoration in a changing world. Wetl. Ecol. Manag. 2009, 17, 71. [Google Scholar] [CrossRef]
  39. Pfister, C.A.; Peacor, S.D. Variable performance of individuals: The role of population density and endogenously formed landscape heterogeneity. J. Anim. Ecol. 2003, 72, 725–735. [Google Scholar] [CrossRef]
  40. Fotheringham, A.S.; Yang, W.; Kang, W. Multiscale geographically weighted regression (mgwr). Ann. Am. Assoc. Geogr. 2017, 107, 1247–1265. [Google Scholar] [CrossRef]
  41. Yu, H.; Fotheringham, A.S.; Li, Z.; Oshan, T.; Kang, W.; Wolf, L.J. Inference in multiscale geographically weighted regression. Geogr. Anal. 2019, 52, 87–106. [Google Scholar] [CrossRef]
  42. Yang, W. An Extension of Geographically Weighted Regression with Flexible Bandwidths. Ph.D. Thesis, University of St Andrews, St Andrews, UK, 2014. [Google Scholar]
  43. Lu, B.; Brunsdon, C.; Charlton, M.; Harris, P. Geographically weighted regression with parameter-specific distance metrics. Int. J. Geogr. Inf. Sci. 2017, 31, 982–998. [Google Scholar] [CrossRef] [Green Version]
  44. Fan, C.; Myint, S. A comparison of spatial autocorrelation indices and landscape metrics in measuring urban landscape fragmentation. Landsc. Urban Plan. 2014, 121, 117–128. [Google Scholar] [CrossRef]
  45. Li, H.; Wu, J. Use and misuse of landscape indices. Landsc. Ecol. 2004, 19, 389–399. [Google Scholar] [CrossRef] [Green Version]
  46. Liu, T.; Yang, X. Monitoring land changes in an urban area using satellite imagery, GIS and landscape metrics. Appl. Geogr. 2015, 56, 42–54. [Google Scholar] [CrossRef]
  47. Plexida, S.G.; Sfougaris, A.I.; Ispikoudis, I.P.; Papanastasis, V.P. Selecting landscape metrics as indicators of spatial heterogeneity—A comparison among Greek landscapes. Int. J. Appl. Earth Obs. Geoinf. 2014, 26, 26–35. [Google Scholar] [CrossRef]
  48. Seto, K.C.; Fragkias, M. Quantifying spatiotemporal patterns of urban land-use change in four cities of China with time series landscape metrics. Landsc. Ecol. 2005, 20, 871–888. [Google Scholar] [CrossRef]
  49. Yue, W.; Ye, X.; Xu, J.; Xu, L.; Lee, J. A brightness–darkness–greenness model for monitoring urban landscape evolution in a developing country–A case study of Shanghai. Landsc. Urban Plan. 2014, 127, 13–17. [Google Scholar] [CrossRef]
  50. Tan, R.; Liu, Y.; Liu, Y.; He, Q.; Ming, L.; Tang, S. Urban growth and its determinants across the Wuhan urban agglomeration, central China. Habitat Int. 2014, 44, 268–281. [Google Scholar] [CrossRef]
  51. Peng, J.; Zhao, M.; Guo, X.; Pan, Y.; Liu, Y. Spatial-temporal dynamics and associated driving forces of urban ecological land: A case study in Shenzhen City, China. Habitat Int. 2017, 60, 81–90. [Google Scholar] [CrossRef]
  52. Chai, M.; Li, R.; Ding, H.; Zan, Q. Occurrence and contamination of heavy metals in urban mangroves: A case study in Shenzhen, China. Chemosphere 2019, 219, 165–173. [Google Scholar] [CrossRef] [PubMed]
  53. Huang, F.; Xu, Y.; Tan, Z.; Wu, Z.; Xu, H.; Shen, L.; Xu, X.; Han, Q.; Guo, H.; Hu, Z. Assessment of pollutions and identification of sources of heavy metals in sediments from west coast of Shenzhen, China. Environ. Sci. Pollut. Res. 2018, 25, 3647–3656. [Google Scholar] [CrossRef] [PubMed]
  54. Shi, T.; Hu, Z.; Shi, Z.; Guo, L.; Chen, Y.; Li, Q.; Wu, G. Geo-detection of factors controlling spatial patterns of heavy metals in urban topsoil using multi-source data. Sci. Total Environ. 2018, 643, 451–459. [Google Scholar] [CrossRef] [PubMed]
  55. McGarigal, K.; Cushman, S.A.; Ene, E. FRAGSTATS v4: Spatial Pattern Analysis Program for Categorical and Continuous Maps. Computer Software Program Produced by the Authors at the University of Massachusetts, Amherst. 2012. Available online: http://www.umass.edu/landeco/research/fragstats/fragstats.html (accessed on 16 January 2020).
  56. McGarigal, K. FRAGSTATS Help; University of Massachusetts: Amherst, MA, USA, 2015. [Google Scholar]
  57. He, H.S.; DeZonia, B.E.; Mladenoff, D.J. An aggregation index (AI) to quantify spatial patterns of landscapes. Landsc. Ecol. 2000, 15, 591–601. [Google Scholar] [CrossRef]
  58. Fotheringham, A.S.; Brunsdon, C.; Charlton, M. Geographically weighted regression: The analysis of spatially varying relationships; John Wiley & Sons: Hoboken, NJ, USA, 2003. [Google Scholar]
  59. Brunsdon, C.; Fotheringham, A.S.; Charlton, M. Some notes on parametric significance tests for geographically weighted regression. J. Reg. Sci. 1999, 39, 497–524. [Google Scholar] [CrossRef]
  60. Oshan, T.M.; Li, Z.; Kang, W.; Wolf, L.J.; Fotheringham, A.S. mgwr: A Python implementation of multiscale geographically weighted regression for investigating process spatial heterogeneity and scale. ISPRS Int. J. Geo-Inf. 2019, 8, 269. [Google Scholar] [CrossRef] [Green Version]
  61. Chen, X.; Nordhaus, W.D. Using luminosity data as a proxy for economic statistics. Proc. Natl. Acad. Sci. USA 2011, 108, 8589–8594. [Google Scholar] [CrossRef] [Green Version]
  62. Yue, W.; Liu, Y.; Fan, P. Polycentric urban development: The case of Hangzhou. Environ. Plan. A 2010, 42, 563–577. [Google Scholar] [CrossRef]
  63. Clément, F.; Ruiz, J.; Rodríguez, M.A.; Blais, D.; Campeau, S. Landscape diversity and forest edge density regulate stream water quality in agricultural catchments. Ecol. Indic. 2017, 72, 627–639. [Google Scholar] [CrossRef]
  64. Luo, J.; Wei, Y.D. Modeling spatial variations of urban growth patterns in Chinese cities: The case of Nanjing. Landsc. Urban Plan. 2009, 91, 51–64. [Google Scholar] [CrossRef]
  65. Breuste, J.; Niemelä, J.; Snep, R.P. Applying landscape ecological principles in urban environments. Landsc. Ecol. 2008, 23, 1139–1142. [Google Scholar] [CrossRef]
Figure 1. Study area: Shenzhen city.
Sustainability 12 02543 g001
Figure 2. The changes in landscape metrics from 2000 to 2015 in Shenzhen. AI—aggregation index, ED—edge density, PD—patch density, and SHDI—Shannon diversity index.
Sustainability 12 02543 g002
Figure 3. Spatiotemporal distribution of the coefficients obtained by MGWR representing the relationships between the AI and the socio-economic factors of urbanization.
Sustainability 12 02543 g003
Figure 4. Spatiotemporal distribution of the coefficients obtained by MGWR representing the relationships between the ED and the socio-economic factors of urbanization.
Sustainability 12 02543 g004
Figure 5. Spatiotemporal distribution of the coefficients obtained by MGWR representing the relationships between the PD and the socio-economic factors of urbanization.
Sustainability 12 02543 g005
Figure 6. Spatiotemporal distribution of the coefficients obtained by MGWR representing the relationships between the SHDI and the socio-economic factors of urbanization.
Sustainability 12 02543 g006
Table 1. Diagnostic information of the ordinary linear regression (OLR), geographically weighted regression (GWR), and multiscale geographically weighted regression (MGWR) models.
METRICMODEL2000200520102015
Aggregation index
(AI)
R O L R 2 0.2050.1400.1160.110
R G W R 2 0.6740.5360.6390.641
R M G W R 2 0.7100.6280.6980.698
Edge density
(ED)
R O L R 2 0.2210.2000.1510.175
R G W R 2 0.6950.5890.6150.630
R M G W R 2 0.7750.7220.7340.708
Patch density
(PD)
R O L R 2 0.2810.1940.1440.146
R G W R 2 0.7820.6570.7000.717
R M G W R 2 0.8340.7720.7710.778
Shannon diversity index
(SHDI)
R O L R 2 0.2520.1810.1690.156
R G W R 2 0.7190.6370.6370.654
R M G W R 2 0.7840.7490.7470.729
Table 2. The spatial bandwidths of the GWR and MGWR models (unit: km).
MetricModelVariable2000200520102015
AIGWR\1.6822.0091.6801.642
DDA97.01597.01597.01597.015
HAI97.01597.01597.01597.015
POP17.5088.60997.01534.234
RD3.2546.2216.6385.377
EDGWR\1.7151.9601.6951.766
DDA14.18097.01597.01597.015
HAI9.08697.01514.44197.015
POP14.3456.7181.0528.156
RD1.2731.0581.0211.028
PDGWR\1.4981.8011.6201.611
DDA14.3081.01397.01597.015
HAI17.93097.01597.01597.015
POP15.7117.4465.52816.684
RD1.3941.3216.5282.295
SHDIGWR\1.6301.7921.7241.639
DDA14.5831.04797.01597.015
HAI10.59137.61597.01597.015
POP17.9766.59320.23716.684
RD1.9381.0141.1372.295
Note: The bandwidths in bold indicate that the estimated coefficients of the corresponding variables are significant.

