Article

Changes in Vegetation Growth Dynamics and Relations with Climate in Inner Mongolia under More Strict Multiple Pre-Processing (2000–2018)

1
International Institute for Earth System Science, Nanjing University, Nanjing 210023, China
2
Jiangsu Provincial Key Laboratory of Geographic Information Science and Technology, Nanjing University, Nanjing 210023, China
3
College of Earth Science, Chengdu University of Technology, Chengdu 610059, China
*
Author to whom correspondence should be addressed.
Sustainability 2020, 12(6), 2534; https://doi.org/10.3390/su12062534
Submission received: 21 February 2020 / Revised: 10 March 2020 / Accepted: 20 March 2020 / Published: 24 March 2020
(This article belongs to the Section Environmental Sustainability and Applications)

Abstract

:
Inner Mongolia Autonomous Region (IMAR) is related to China’s ecological security and the improvement of ecological environment; thus, the vegetation’s response to climate changes in IMAR has become an important part of current global change research. As existing achievements have certain deficiencies in data preprocessing, technical methods and research scales, we correct the incomplete data pre-processing and low verification accuracy; use grey relational analysis (GRA) to study the response of Enhanced Vegetation Index (EVI) in the growing season to climate factors on the pixel scale; explore the factors that affect the response speed and response degree from multiple perspectives, including vegetation type, longitude, latitude, elevation and local climate type; and solve the problems of excessive ignorance of details and severe distortion of response results due to using average values of the wide area or statistical data. The results show the following. 1. The vegetation status of IMAR in 2000-2018 was mainly improved. The change rates were 0.23/10° N and 0.25/10° E, respectively. 2. The response speed and response degree of forests to climatic factors are higher than that of grasslands. 3. The lag time of response for vegetation growth to precipitation, air temperature and relative humidity in IMAR is mainly within 2 months. The speed of vegetation‘s response to climate change in IMAR is mainly affected by four major factors: vegetation type, altitude gradient, local climate type and latitude. 4. Vegetation types and altitude gradients are the two most important factors affecting the degree of vegetation’s response to climate factors. It is worth noting that when the altitude rises to 2500 m, the dominant factor for the vegetation growth changes from precipitation to air temperature in terms of hydrothermal combination in the environment. Vegetation growth in areas with relatively high altitudes is more dependent on air temperature.

1. Introduction

The response of Global Climate Change and Terrestrial Ecosystem (GCTE) is the core content of the International Geosphere and Biosphere Programme (IGBP) [1,2], which has long received great attention from the international scientific community and the international community. Today, Future Earth (FE) takes over IGBP and continues to carry out in-depth research on global change. As an important aspect of global change, climate change has an important impact on vegetation growth, while factors such as precipitation, air temperature and relative humidity can affect the effective accumulated temperature and available moisture to regulate plant photosynthesis, respiration and soil organic carbon decomposition, which will further affect vegetation growth and distribution [3,4,5]. The interrelationship between vegetation growth, climate change, and human activities, as well as the response mode and response degree of large-scale vegetation activities to impact factors, has become one of the main contents of current global change research, which is of great practical value for determining reasonable vegetation protection management methods. The Enhanced Vegetation Index (EVI) is an important indicator reflecting the growth status of surface vegetation, serving as an effective method for the dynamic monitoring of vegetation at different scales and its response to climate factors [6,7]; meanwhile, it is very sensitive to changes in physical characteristics of vegetation. Changes of EVI play an important role in indicating changes in regional ecosystems and the environment [8]. Located in the north border area of China, Inner Mongolia Autonomous Region (IMAR) is an important ecological barrier in northern China, and it belongs to the transitional zone from arid and semi-arid climate to humid and semi-humid monsoon climate of the southeast coast, where vegetation types are abundant with higher possibility of spatial and temporal changes in vegetation coverage. The ecological environment there is characterized by distinct regional differences, fragile ecological conditions and complex ecological types, so IMAR is also one of the regions that are most sensitive to global changes [9,10]. Therefore, in the context of global climate change, grasping the inter-annual fluctuation rules of terrestrial vegetation coverage in IMAR and exploring the driving effect of climatic factors are of great theoretical and practical significance in evaluating its environmental quality of the terrestrial ecosystem and regulating its ecological processes.
A large number of studies at home and abroad show that the response of vegetation index to climate factors has significant spatial and temporal differences [11,12]. The response degree of vegetation growth to climatic conditions refers to the degree of dependence on the hydrothermal combination in the climatic environment: the lag time of response of vegetation growth to climatic conditions can be understood as the time needed for vegetation transpiration and water transport under the action of internal forces, the change process of leaf chlorophyll, remote sensing to detect significant changes in vegetation, etc. [13]. Cui et al. [14] and Liu et al. [15] analyzed the trend of vegetation change and its response to climate change in eastern and western China by using the vegetation index and pointed out that the response degree of vegetation to air temperature and precipitation from north to south in eastern China gradually decreased, with the highest correlation in the sub-arid region of the middle temperate zone and the smallest in the humid region of the sub-tropical zone in South Asia. The grassland responded faster to air temperature and precipitation than the forest, while the vegetation cover in western Tibetan Plateau showed a positive correlation and obvious regional differences with precipitation and air temperature over the same period. Tropical Africa [16], the Great Plains of the United States [17], Eurasia [18] and other regions are closely related to vegetation change and precipitation, and air temperature is the main factor that affects the growth and change of terrestrial vegetation in northern Fennoscandi [19], the Arctic [20] and North America [21]. These research results indicate that the impact of different climate factors often have different degrees of response and response speed on vegetation.
However, almost all existing research on vegetation and climate change uses regional lag analysis to determine the lag time and response degree of vegetation growth to different climatic factors in the study area and discusses the lag time of vegetation growth to different climatic factors by comparing the correlation between the vegetation index of the growing season and different climatic factors in each period [22,23]. Although the method makes it easy to get statistics and can obtain the response speed and response degree of vegetation to climatic factors on a macro-scale within the area, it brings problems such as excessive ignorance of details and severe distortion of response results when the lag time is determined by the mean value of vegetation index and response degree of climatic factors. The previous studies also adopt the method of zoning to discuss the study area in terms of vegetation types, landforms, climatic zones, etc., to a certain extent, and the study area becomes more specified. Zhang et al. [24] divide the study area into typical steppe zone, meadow steppe zone and desert steppe zone according to the lag time of Normalized Difference Vegetation Index (NDVI) in the growing season to climatic factors in the grasslands of IMAR. However, this method not only brings a higher workload but also leads to overgeneralization because different zoning methods may cause significant differences in vegetation’s response to climate. Therefore, it is impossible to accurately and comprehensively explore the response and impact factors of vegetation growth to climate change. In addition, the correlation analysis method and regression analysis method are widely used to study the relationship between vegetation’s quantitative factors of remote sensing and the response of climate change [25,26]. These methods require that each variable meets the normal distribution, and in the analysis process, the extreme value of each factor may have a great impact on the analysis results [27]. Some researchers use the grey relational analysis (GRA) to study the relationship between vegetation index and climate factors [28]. GRA has the advantage of low demand for samples, high accuracy, wide application range, etc. and is not limited by sample types and probability distribution, but most of the relevant studies are based on the overall statistical value or limited sample points in the study area, causing the results to lack detailed description of vegetation’s response to different climatic factors in the study area.
In this paper, all data sources are subjected to strict multiple pre-processing, which further corrects the defects of incomplete data pre-processing and low verification accuracy in the existing studies, and a pixel-based lag analysis method is adopted to obtain the degree of response and lag time of vegetation growth to climate change, settling the problems of excessive ignorance of details, severe distortion of lag response results and overgeneralization, which are caused by using average values of the wide area or statistical data. Under the premise of pixel-scale analysis, the GRA is used to study the response of EVI in the growing season to climatic factors. The distribution characteristics and change rules of vegetation are discussed separately from the response speed and degree of response to climate change. Multiple perspectives such as types, longitudes, latitudes, elevations and local climate types are taken to explore the factors that affect their response speed and degree of response in order to more accurately and comprehensively display and evaluate the spatial and temporal differences in the response of EVI to different climate factors in IMAR.

2. Data and Methods

2.1. Study Area

IMAR is located in the northern part of China, stretching over the northwestern, northern, and northeastern parts of China. The landforms are inlaid from plains, mountains and plateaus from east to west, with an average elevation of about 1000m (Figure 1a). The total area of IMAR is 1.183 million square kilometers, accounting for 12.3% of the country’s total area [10]. The area of grasslands, forests and per capita arable land in IMAR ranks first in China. The area of grasslands accounts for 74.4% of the whole region, and the grasslands are composed of Hulunbuir grassland, Horqin grassland, Xilinguole grassland, Ulanqab grassland, Ordos semi-desert grassland and Alxa desert grassland from east to west. In the eastern and northern part lies the Greater Khingan Mountains, where there are abundant meadows, swamps, aquatic plants, virgin forests and 11 secondary forest areas. In the central Yinshan Mountains and the western Helan Mountains, there are meadows, grassland plants, large-scale plantations and natural secondary forests. Owing to differences in natural factors such as hydrothermal conditions and landforms, the distribution of vegetation in IMAR is characterized by regions (Figure 1b). The land coverage mainly includes coniferous forest, broad-leaved forest, grassland, desert steppe, desert and so on [29,30].

2.2. Data Sources

The EVI data come from the MODIS C6 MOD13Q1 dataset published by National Aeronautics and Space Administration (NASA) of the United States. Compared with C5 data, C6 data further solves the problem of data attenuation and distortion due to the aging of satellite sensors, corrects the surface reflectance to increase the sensitivity to high biomass areas and improves the accuracy of vegetation monitoring through the coupling of leaf crown background signals and reduction of atmospheric effects [31]. IMAR involves seven scenes of h27v04, h26v05, h26v04, h26v03, h25v05, h25v04 and h25v03, with a spatial resolution of 250m and a time resolution of 16d.
The meteorological data is selected from the monthly mean air temperature, monthly mean relative humidity and monthly cumulative precipitation data from 110 meteorological stations in IMAR and its neighboring areas from February to September, which is provided by China Meteorological Science Data Sharing Service Website (http://data.cma.gov.cn).
The data of meteorological verification include China’s monthly surface precipitation 0.5 × 0.5 grid dataset (V2.0) and the monthly surface air temperature 0.5 × 0.5 grid dataset (V2.0) provided by China Meteorological Science Data Sharing Service Network (http://data.cma.gov.cn), as well as China’s regional atmosphere driving dataset on the basis of information from geostationary satellites and reanalysis, which is provided by the Cold and Arid Regions Scientific Data Center (http://westdc.westgis.ac.cn). These datasets are not suitable for direct use in this study due to their low resolution, so they are only used for verification.
The data of vegetation type is taken from the 1:1,000,000 national vegetation type dataset published by the Data Center of Chinese Academy of Resources and Environmental Sciences (http://www.resdc.cn).
The data of Digital Elevation Model (DEM) comes from the ASTER GDEM V2 digital elevation data of the geospatial data cloud platform (http://www.gscloud.cn), with a spatial resolution of 30m.
The data of climatic type zoning comes from the Institute of Geographical Sciences and Resources, Chinese Academy of Sciences (http://www.igsnrr.cas.cn).

2.3. Data Processing

2.3.1. EVI Data Processing

EVI data can reflect the dynamic growth process of surface vegetation, but due to various factors in the process of data collection and processing, the quality of the data is seriously affected, making the seasonal change of the EVI curve not obvious [32]. In the existing research [7,12], the method of harmonic analysis of time series (HANTS) is usually used for filtering, which makes use of the Fourier transformation to obtain the amplitude and phase of non-zero frequency and then fits all points with the method of least squares. By comparing the observed data with the fitted curve, points that are significantly lower than the fitted curve are used as cloud pollution points and their weights are assigned to zero so as not to participate in curve fitting. This iterative process is repeated to achieve image reconstruction [33]. HANTS has a good effect on the removal of low outliers, but not for high outliers. These high outliers are not removed but directly participate in the curve fitting, which pulls up the smoothed EVI curve to a certain extent, but existing studies have ignored the impact of high outliers on HANTS results in specific situations [34].
Therefore, before HANTS processing, both high and low outliers are identified and replaced according to the pauta criterion (Figure 2a). The basis for replacement is that if the absolute value of residual error of EVI (a)   | v a | ( | v a | = | EVI a EVI ¯ | ,   a = 1 , 2 , 3 23 ) is greater than the triple standard deviation (3σ) of EVI t ( t = 1 , 2 , 3 23 ) , it is considered to be an outlier. Then, the point should be removed, and the outlier is replaced by the mean EVI value of the previous and following points in time (Figure 2b).
The EVI data replaced according to the pauta criterion are then smoothed with HANTS. During the processing, the effective value range is −3000–10000, the period is 23 and the frequency is 2 (11, 23). The EVI data processed by the pauta criterion and HANTS can more accurately reflect the periodic change rules of the growth curve.
After being processed by HANTS, the monthly EVI is calculated with the Maximum Value Composite (MVC) method. Subsequently, the effects of bare soil and sparse vegetation areas are removed based on the following rules: (i) The annual mean value of EVI in the growing season is greater than 0.07; (ii) the annual maximum value of EVI is greater than 0.10; (iii) the annual maximum value of EVI appears from May to September. Finally, for pixels that meet the conditions listed above, their mean value of EVI from May to September is chosen as the annual mean value of EVI in the growing season.

2.3.2. Meteorological Data Processing

The meteorological data mainly come from the direct observations of meteorological stations, which are partial and dispersed [35]. Changes in meteorological stations, instruments or methods for observing lead to non-uniformity in data collection, so it is necessary to perform a homogeneity test on the data collected from meteorological stations to eliminate unavailable data. Since the data all meet the normal distribution, the normality can be fully utilized and the homogeneity test of variance can be used to achieve the effect of homogeneity test [7].
Different spatial interpolation methods have different characteristics and applicable objects, so it is extremely important to select the optimal spatial interpolation method for different meteorological factors in the regional studies of various disciplines [36]. In the existing research, Co-kriging and Inverse Distance Weighted (IDW) are commonly used for precipitation, Kriging and IDW for relative humidity, and Kriging as well as Thin plate splines (TPS) of ANUSPLIN software for air temperature [37,38].
Our research conducts strict data screening on meteorological data according to the following rules, compares the accuracy of various interpolation methods that are commonly used and then selects the appropriate interpolation method for IMAR:
(a)
Perform homogeneity test on meteorological data to eliminate unavailable data.
(b)
In order to avoid uncertain factors caused by excessive differences in altitude of meteorological stations, stratified randomization is used to randomly group, interpolate and verify meteorological stations as follows: according to the altitude of the meteorological stations, they are divided into three groups—below 1000 m, 1000–2000 m and over 2000 m. Each group randomly selects 90% of the stations as the experimental group and the remaining 10% as the control group, and then combines all the experimental groups and the control groups. All the meteorological station data of the experimental group are used in the interpolation of Co-kriging, Kriging, IDW and TPS. The cross-validation is performed with the remaining 10% of station data of the control group. In this way, the stratified random verification can be performed 10,000 times, and the interpolation results are compared with the mean value of relative error in the control group so that we can find the most accurate interpolation method.
(c)
All the data from the 110 stations are interpolated with the determined interpolation method, and the results of the interpolation are resampled to perform a relative error test (annual mean value of relative error ≤ 10%) with verification dataset from the surface meteorological grid.
After the operation described above and the relative error test, Co-kriging is finally selected to interpolate for precipitation with elevation as the main cooperative attribute, and IDW for relative humidity; with the TPS method of ANUSPLIN software, we use DEM as a covariate for spatial interpolation of air temperature.

2.4. Methods

2.4.1. Trend Analytical Method

The univariate linear regression method is used to analyze the changing trend of EVI in the growing season from 2000 to 2018 in IMAR. The calculation formula is:
θ slope = n × i = 1 n ( i × EVI i ) i = 1 n i i = 1 n EVI i n × i = 1 n i 2 ( i = 1 n i ) 2
In Formula (1), n stands for the time series, n = 19; EVI i stands for the EVI value of the year i ; θ slope stands for the inter-annual change slope of certain EVI pixels. When the value of Slope is positive, it indicates that EVI shows an increasing trend as time goes by, and vice versa [39].

2.4.2. Standard Deviation Analysis

Standard deviation is a measure of the degree of data dispersion and can reflect the stability or fluctuation of variables.
  S i = 1 n i = 1 n ( EVI i EVI ¯ ) 2
In Formula (2),   S i stands for the standard deviation value of EVI, which indicates the degree of fluctuation of vegetation changes. The larger the value is, the greater the difference between the EVI value of each pixel and its average value is, and the larger the fluctuation range is; the lower the value is, the closer the EVI value of each pixel is to the average value, and the smaller the fluctuation range is.

2.4.3. Grey Relational Analysis

The grey correlation is an uncertain correlation between the degree of factors or the contribution degree of factors to the main behavior, based on the geometrical proximity of the main behavior sequence and the behavior sequence on micro or macro level. It has the advantage of small sample demand (at least 3), high accuracy, wide application and no need for a regular distribution form of the data; at the same time, the data is not subject to the sample type and probability distribution, and the quantitative analysis results are consistent with the qualitative analysis results. Therefore, the GRA is a new method to study the uncertainty of little data and poor information [40,41].
The reference factor sequence can be expressed as:
Z 0 = [ Z 0 ( 1 ) , Z 0 ( 2 ) , , Z 0 ( n ) ]
The comparative factor sequence can be expressed as:
Z i = [ Z i ( 1 ) , Z i ( 2 ) , , Z i ( n ) ] ,   i = 1 , 2 , , m .  
Considering the relevant factor sequence, the point relational coefficient r ( z 0 ( k ) , z i ( k ) ) is defined as:
r ( z 0 ( k ) , z i ( k ) ) = z ( min ) + ξ z ( max ) Δ 0 i ( k ) + ξ z ( max )
But
Δ 0 i ( k ) = | z 0 ( k ) z i ( k ) |  
z ( min ) = min i   min k Δ 0 i ( k )
z ( max ) = max i   max k Δ 0 i ( k )  
the Grey Relational Grade (GRG) φ ( Z 0 , Z i )   between   Z i ( i = 1 , 2 , , m ) and Z 0
φ ( Z 0 , Z i ) = 1 n k = 1 n r ( z 0 ( k ) , z i ( k ) ) ,   φ ( Z 0 , Z i ) [ 0 , 1 ]
φ ( x 0 ( k ) , x i ( k ) ) is the GRG between z i and z 0 when it meets the condition of comparative factor k and the grey resolution coefficient ξ . The GRG is a measurement of the impact degree of the comparative factor sequence on the reference factor sequence. When the value is closer to 1, the effect of the comparative factor sequence on the reference factor sequence becomes more significant. The value of the GRG can be used as an indicator that reflects the influence of comparative factor sequence on reference factor sequence [41].
In this study, the EVI values in the growing season from 2000 to 2018 are used as the reference factor sequence ( Z 0 ) , and the comparative factor sequence ( Z i ) is composed of three climate factors: precipitation, relative humidity and air temperature from 2000 to 2018.

2.4.4. Lag Analysis on the Pixel Scale

The definition of the lag time is calculated on a pixel-by-pixel basis, rather than a rough zoning. Taking the EVI sequence (May–September) and monthly accumulated precipitation sequence (May-September) of the growing season in the study area from 2000 to 2018 as the two sets of variables, we calculate the GRG between EVI (May-–September) and monthly accumulated precipitation (May–September). In the same way, the GRGs between EVI sequence of the growing season and the monthly accumulated precipitation (April–August, March–July and February–June), the monthly mean air temperature (May–September, April–August, March–July and February-June) and the monthly mean relative humidity (May–September, April–August, March–July and February–June) are calculated, and the lag node corresponding to the maximum GRG is regarded as the lag time of EVI response to the climatic factors. Finally, the lag time corresponding to each pixel unit is calculated on a pixel-by-pixel basis. The lag time of EVI in the growing season responding to the climatic factors in May–September, April–August, March–July and February–June is 0–1 month, about 1 month, 1–2 months and over 2 months respectively.

3. Results

3.1. Inter-annual Change and Spatial Distribution Pattern of EVI in the Growing Season

3.1.1. Inter-annual Change of EVI in the Growing Season

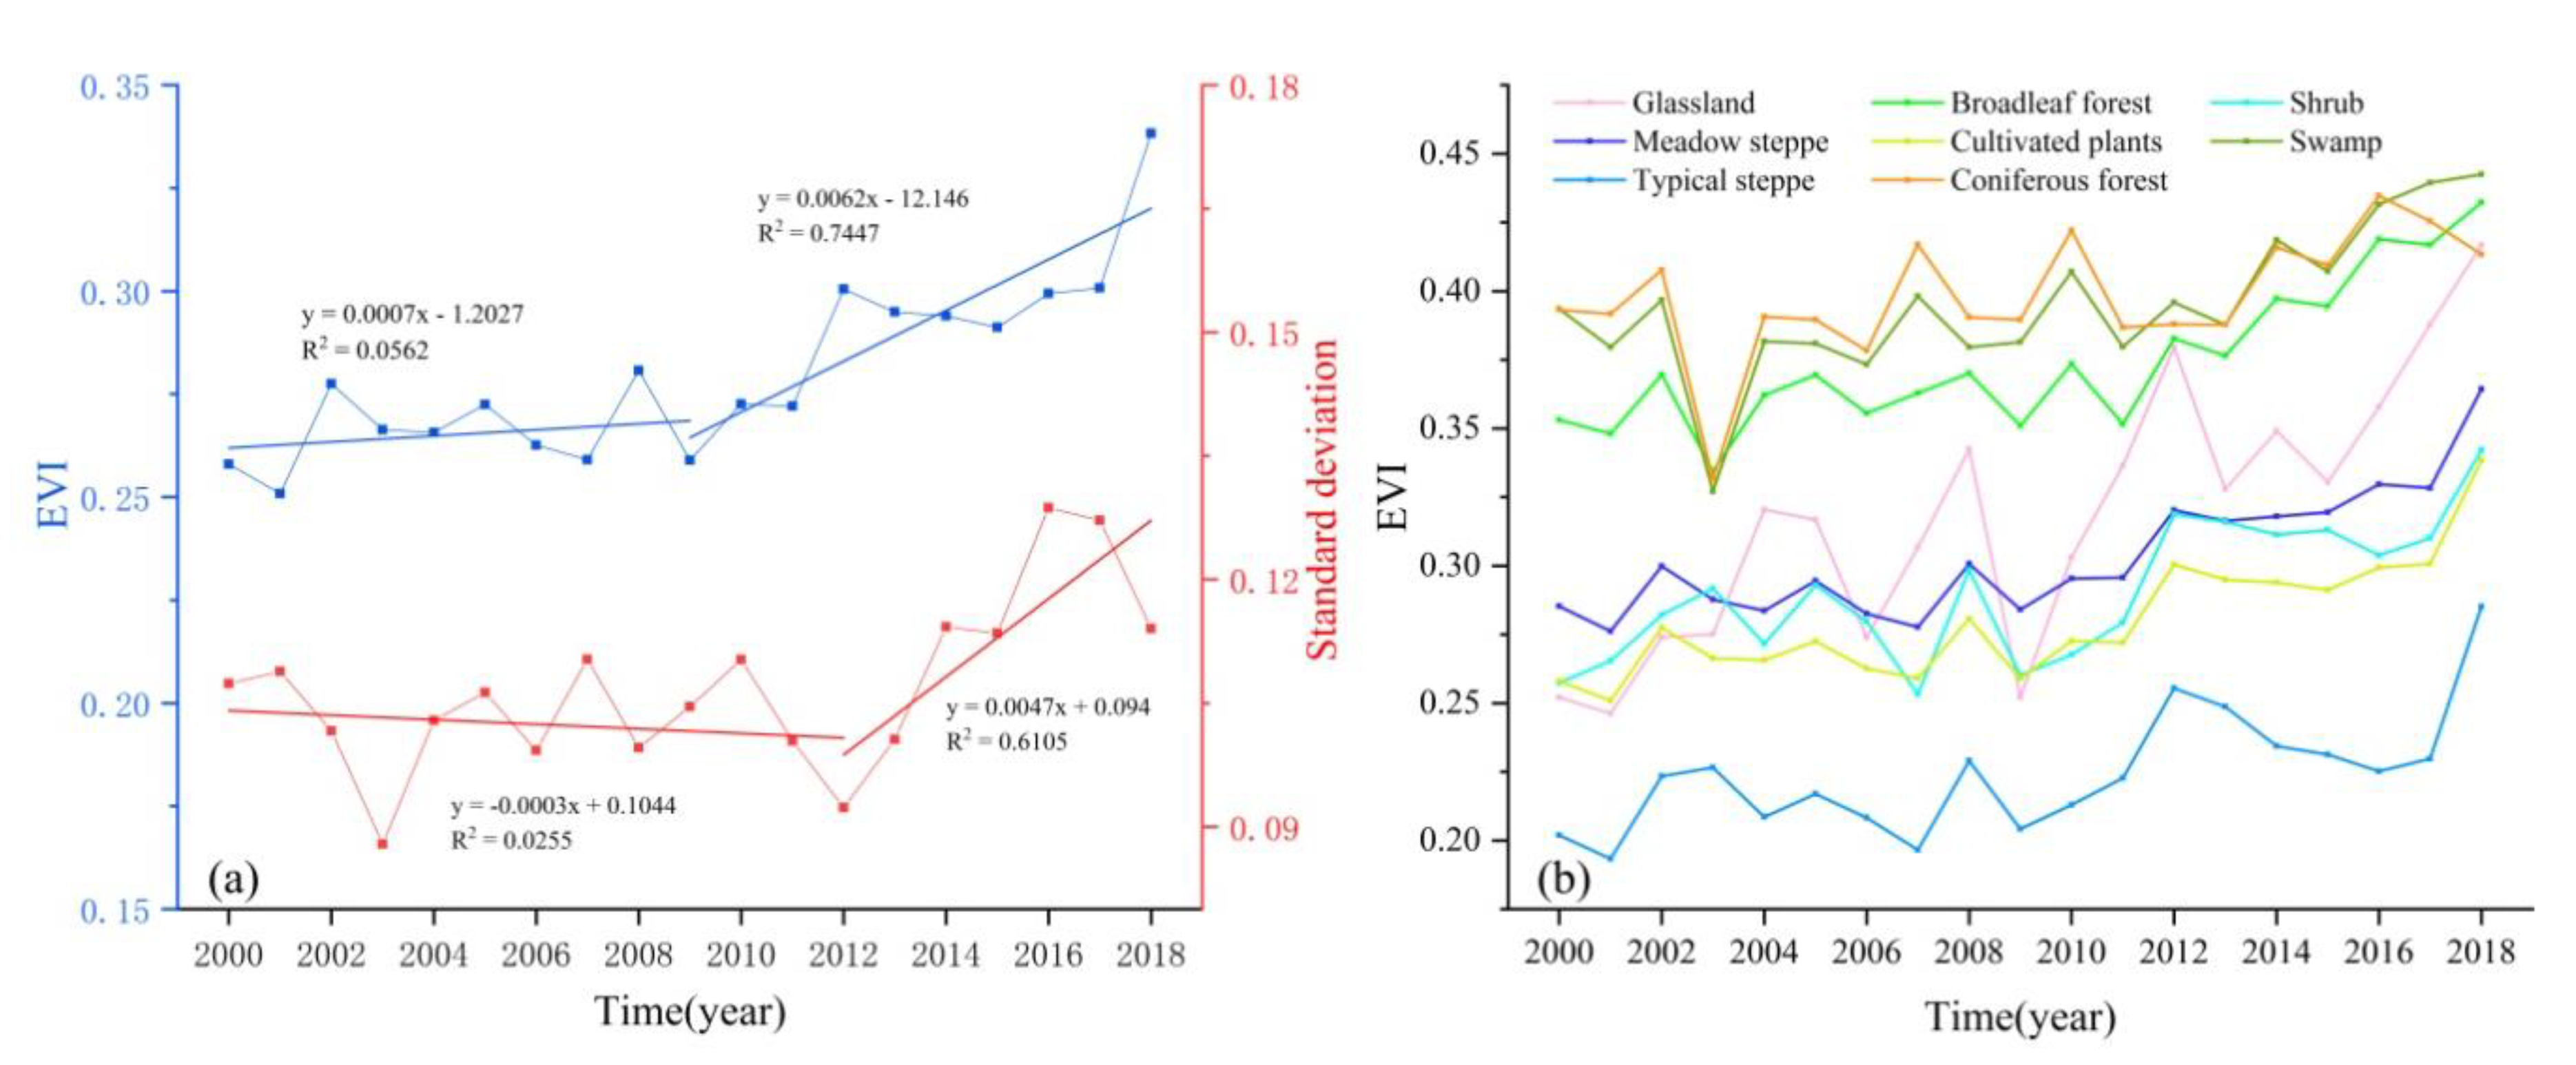
In general, the mean EVI value of IMAR shows an increasing trend with a growth rate of 0.031/10a (Figure 3a). Among them, from 2000 to 2009, it shows a slowly rising trend on the whole, with a growth rate of 0.007/10a and a minimum of 0.251 in 2001; from 2009 to 2018 it showed an overall accelerating trend with a growth rate of 0.062/10a, reaching a maximum of 0.338 in 2018. From the trend of the standard deviation of the mean EVI value in IMAR, we can see that the standard deviation of the mean EVI value in the study area did not change significantly between 2000 and 2012. In addition, from 2012, the regional differences in the EVI of IMAR are increasing, with a growth rate of 0.047/10a in the standard deviation. The mean EVI of swamp, broadleaf forest, grassland, meadow steppe, shrub, cultivated plants and typical steppe show a significant increase trend between years. However, the change trend of coniferous forest is relatively flat compared with other types of vegetation (Figure 3b).

3.1.2. Characteristics of Spatial Distribution of Multi-year Mean EVI

From 2000 to 2018, the mean EVI value of IMAR was 0.280. The EVI of the growing season showed a distribution pattern that decreased from north to south with a change rate of 0.25/10° E and from east to west with a change rate of 0.23/10° N.
The statistical results (Figure 4) show that the high-value areas of EVI in the growing season are mainly distributed in Hulunbuir, Xing’an League, Tongliao and Chifeng, where the elevation is below 1250m, the latitude is between 44°−50° N and the longitude is between 115°−125° E. The vegetation types are mainly coniferous forest, broad-leaved forest, shrub, grassland and cultivated plants. Low-value areas are mainly concentrated in cities such as Xilingol League, Ulanqab League, Baotou, Bayannur League, and Ordos, where the altitude is between 900–2300 m, the latitude is between 38°−44° N and the longitude is between 105°−115° E. The main vegetation types are typical grassland and desert grassland. In the areas above 2300 m, there are mainly meadow grasslands or desert grasslands, with sparse vegetation and relatively low EVI values on the whole.

3.2. Temporal and Spatial Change Rules of EVI in the Growing Season

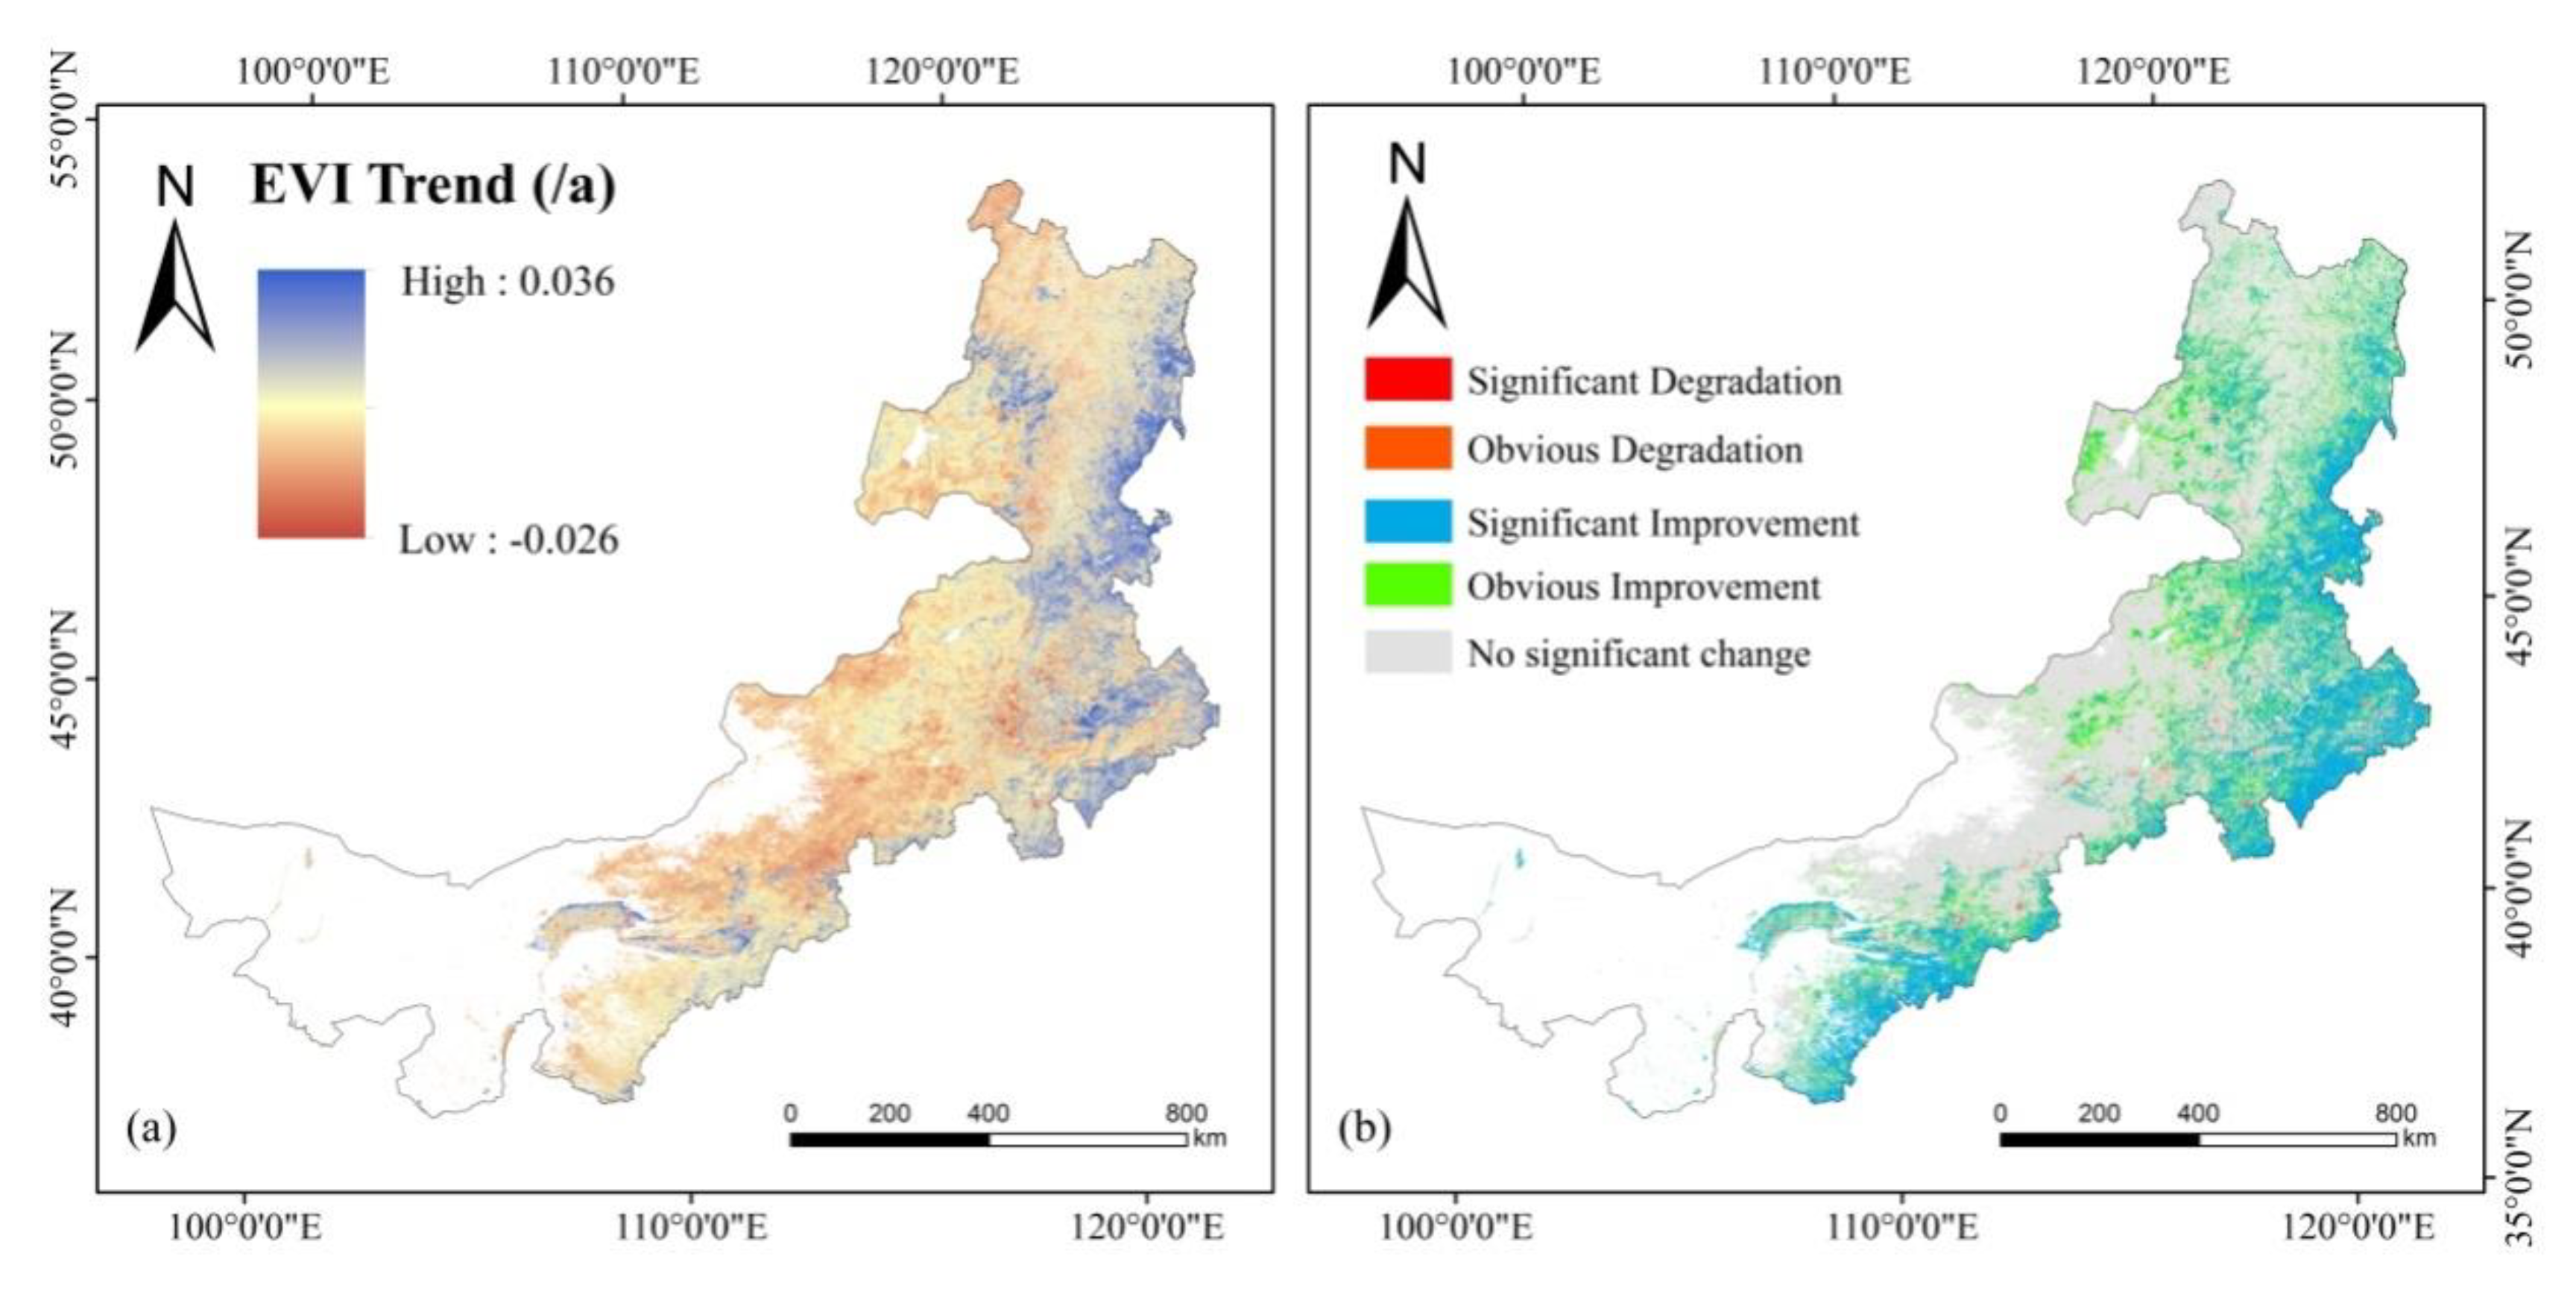
The trend of EVI change in the growing season of the study area from 2000 to 2018 is obtained with the method of trend analysis (Figure 5a). The significance test is used to divide the change of trend into five categories (Figure 5b): significant improvement (p < 0.001, Slop > 0), obvious improvement (0.01 < p < 0.05, Slop > 0), no significant change (p > 0.05), obvious degradation (0.01 < p < 0.05, Slop < 0) and significant degradation (p < 0.001, Slop < 0). On the whole, the EVI of the growing season in the study area covers mainly three categories: no significant change, obvious improvement and significant improvement. The area with no significant change accounts for 58.6% of the study area, concentrated in areas below 2600 m, including coniferous forests, broad-leaved forests, grasslands and meadows in northern Hulunbuir, western Xilingol League and northern Ulanqab League. The area with significant improvement is mainly in the middle of the study area, accounting for 14.7% of the study area, and in the eastern and southern parts of the study area, it belongs to the category of significant improvement, accounting for 25.9% of the study area, where the vegetation types are mainly broad-leaved forest, swamp, cultivated plants, shrub, grassland and meadow areas with obvious degradation and significant degradation account for 0.38% and 0.39% of the study area, respectively, scattered in the central and southern parts of the study area, and they are mainly covered by grasslands, meadows and shrubs.

3.3. Inter-annual Change Trends of Climatic Factors in Each Period

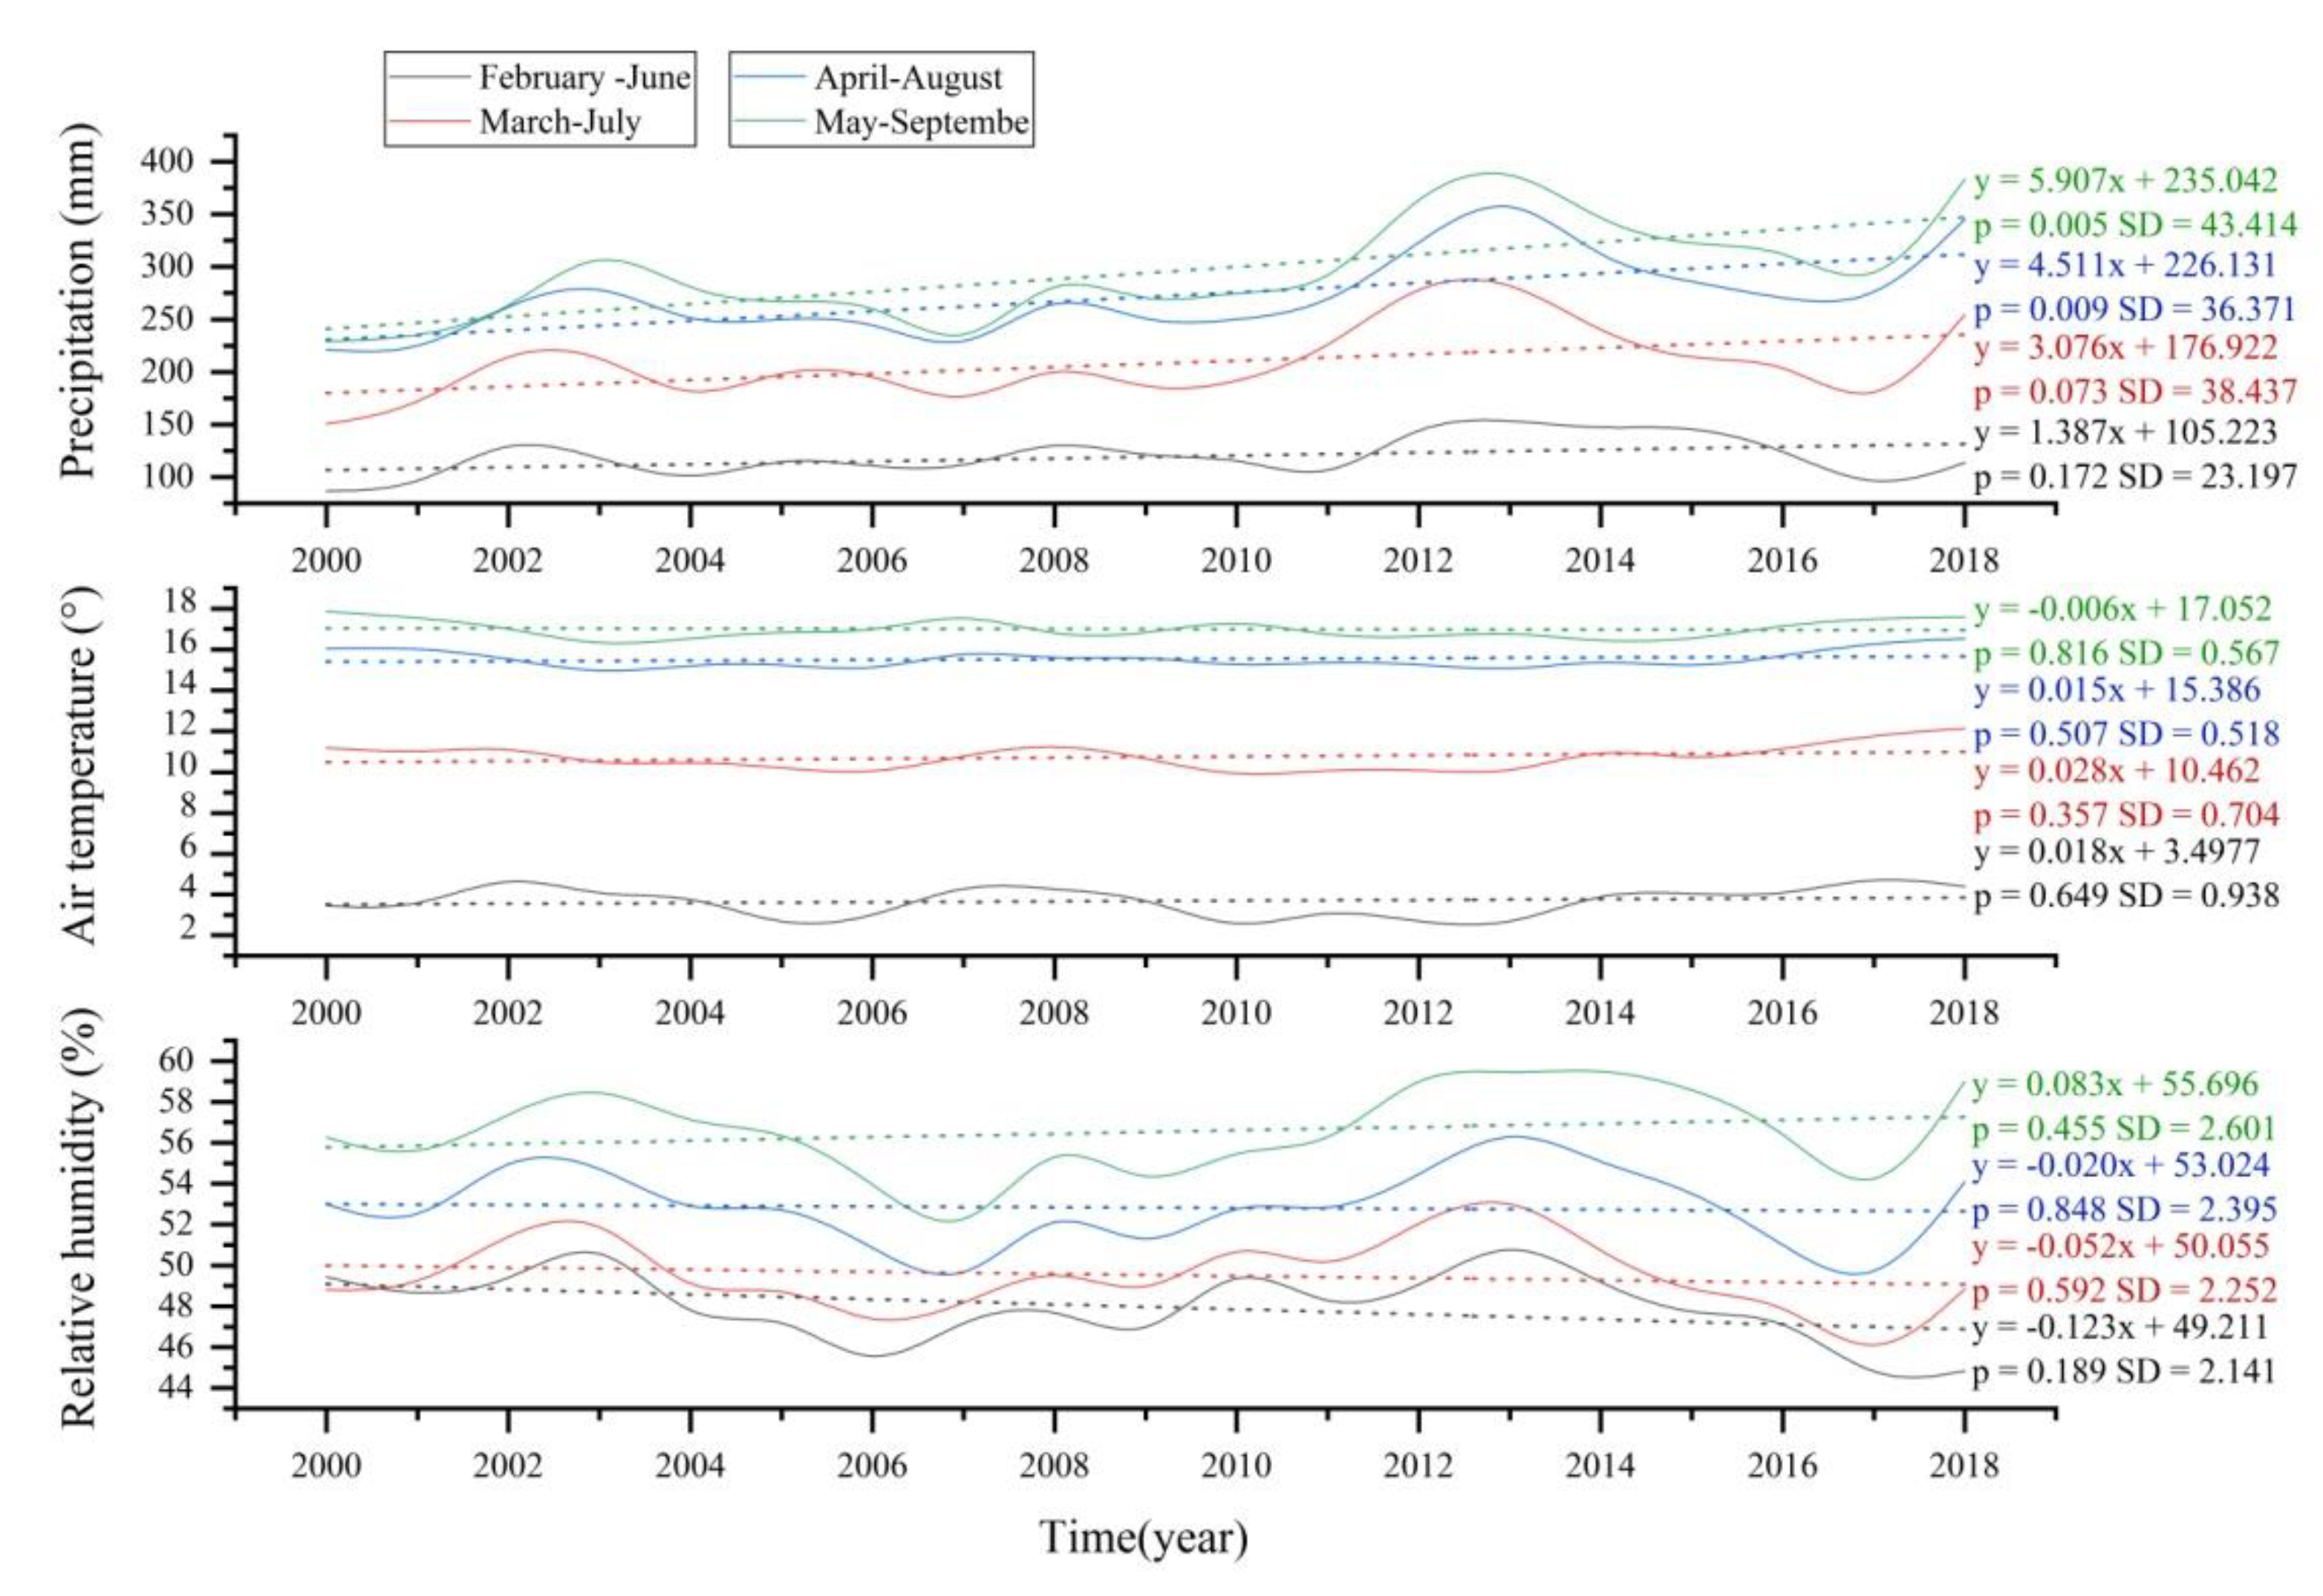
Based on the inter-annual change trends (Figure 6) of accumulated precipitation, mean air temperature, and mean relative humidity in the study area from February to June, March to July, April to August and May to September in 2000–2018, we find that the accumulated precipitation in each period shows significant growth with different degrees and the average annual growth rates are 1.387 mm (p = 0.172), 3.076 mm (p = 0.073), 4.511 mm (p = 0.009) and 5.907 mm (p < 0.005). The inter-annual fluctuations of the mean air temperature in the four periods are relatively flat, and most of the periods have positive growth, while the interannual changes are 0.018 ℃ (p = 0.649), 0.028 ℃ (p = 0.357), 0.015 ℃ (p = 0.507) and −0.006 ℃ (p = 0.816). Most of the inter-annual changes of the mean relative humidity in the four periods show negative growth, and the fluctuations are relatively flat, with annual changes of −0.123% (p = 0.189), −0.052% (p = 0.592), −0.020% (p = 0.848) and 0.083% (p = 0.455).

3.4. Lag Analysis of EVI in the Growing Season to Climatic Factors

3.4.1. Analysis of EVI’s Lag Time of Response to Climatic Factors on the Pixel Scale

On the pixel scale, EVI’s lag response to precipitation in the growing season is obtained (Figure 7a). Overall, the vegetation in the study area responds faster to precipitation, with the fastest appearing in the northern part, followed by the central and southern parts. The area where vegetation responds to precipitation changes with a lag time of less than 2 months accounts for 68.3% of the study area, while the area with a lag time of more than 2 months accounts for 31.7%. In the areas with a lag time of not more than 2 months, the vegetation is mainly located in low and middle altitude areas, mainly including coniferous forests and broad-leaved forests, as well as mixed coniferous and broad-leaved forests. A few grasslands and cultivated plants also show high sensitivity to changes in precipitation; most of the vegetation with a lag time of more than 2 months is located in relatively high-altitude areas (above 2000 m), and the vegetation types are mainly meadow, grassland, shrub and cultivated plants.
According to the results (Figure 7b) of EVI’s lag response to air temperature in the growing season, the vegetation in the study area has a slow respond speed to air temperature, with a lag time of 1–2 months in the northern part and more than 2 months in most of the central and southern regions.
The area where the lag time of vegetation’s response to air temperature change is less than 2 months makes up 55.3% of the study area; for those more than 2 months, 44.7%. The types of vegetation with a lag time of not more than 2 months are mainly coniferous forest, broad-leaved forest, swamp and meadow in the central region, and the elevation is below 2000 m. The vegetation with a lag time of more than 2 months is mainly distributed in the central and southern part of the study area, and the elevation is below 1000 m or above 2500 m, where the vegetation types include grassland, meadow, cultivated plants and shrub.
The lag response of EVI to relative humidity in the growing season (Figure 7c) shows that the vegetation in the study area responds faster to relative humidity, with a lag time of 0–1 month in the north, 1-2 months in the central part, and over 2 months in most of the southern regions. The area where the lag time of vegetation’s response to changes of relative humidity is less than 2 months accounts for 71.7% of the total area, and for those more than 2 months, 28.3%. The vegetation types with a lag time of not more than 2 months are mainly coniferous forest, broad-leaved forest, meadow, grassland and cultivated plants with an elevation below 2000m. Among them, forests respond more quickly than grasslands, while the lag time of forests is around 0–1 month and 1–2 months for grasslands. The vegetation with a lag time of over 2 months is mainly meadows in the southern part of the study area with an elevation of more than 2000 m.

3.4.2. Analysis of EVI’s Response Degree to Climatic Factors on the Pixel Scale

If plants are grown at different longitudes, latitudes and elevations, they will display in different states, even if they are of the same species. The study area has a north–south span of 15°59′ and an east–west span of 28°52′. As the span is large and the vegetation is unevenly distributed, it is necessary to further analyze the rules and characteristics of the interaction between vegetation and climate from the perspective of longitude, latitude and elevation.
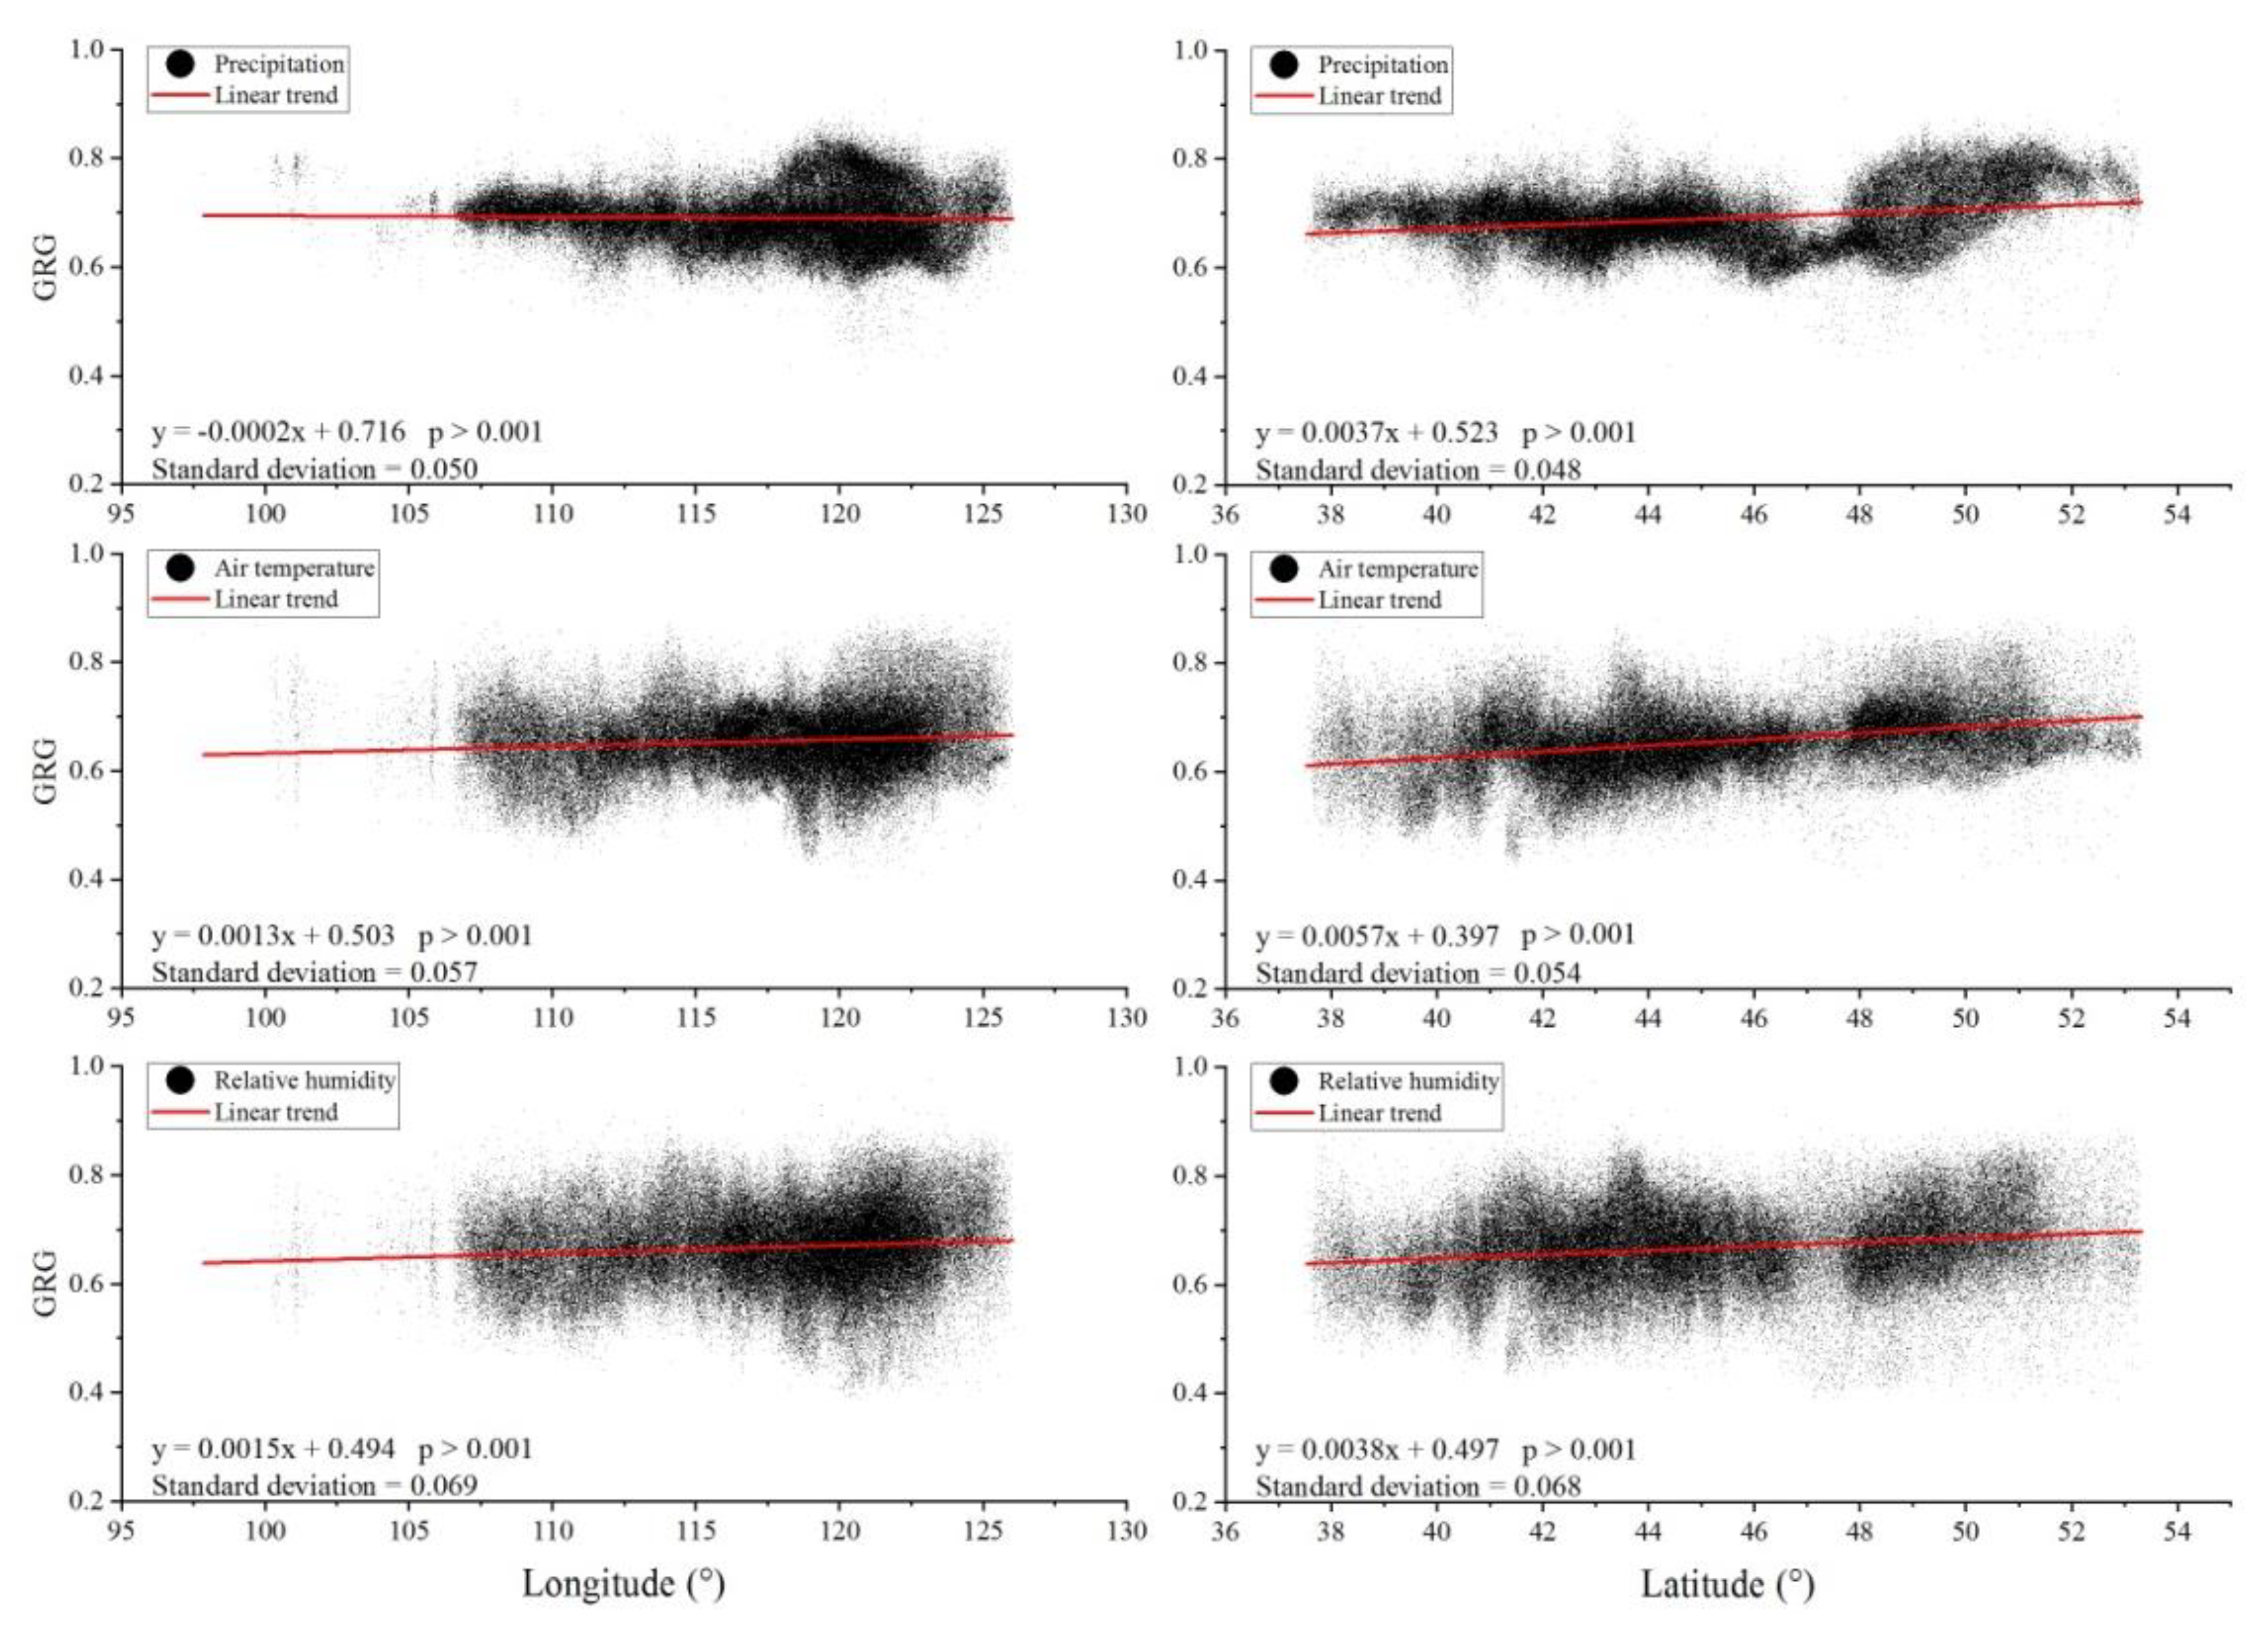
As shown in Figure 8, on the whole, the change of GRG between EVI and climatic factors shows a flatter trend in longitude than that in latitude, and the change trend is more dramatic in latitude. The change rates of GRG between EVI and precipitation, air temperature and relative humidity in terms of longitude are −0.002/10° E, 0.013/10° E, and 0.015/10° E, with standard deviations of 0.050, 0.057 and 0.069, respectively, which indicates that the GRG between EVI and precipitation gradually decreases from west to east, while the GRG between EVI and air temperature, relative humidity gradually increases from west to east. The change rates of GRG between EVI and precipitation, air temperature and relative humidity in terms of latitude are 0.037/10° N, 0.057/10° N, and 0.038/10° N, with standard deviations of 0.048, 0.054 and 0.068, respectively, which shows that the GRG between EVI and precipitation, air temperature, and relative humidity gradually increases from south to north. The standard deviation of longitude is greater than that of latitude, which means that the GRGs between EVI and precipitation, air temperature, and relative humidity fluctuate more dramatically at the same longitude than that at the same latitude.
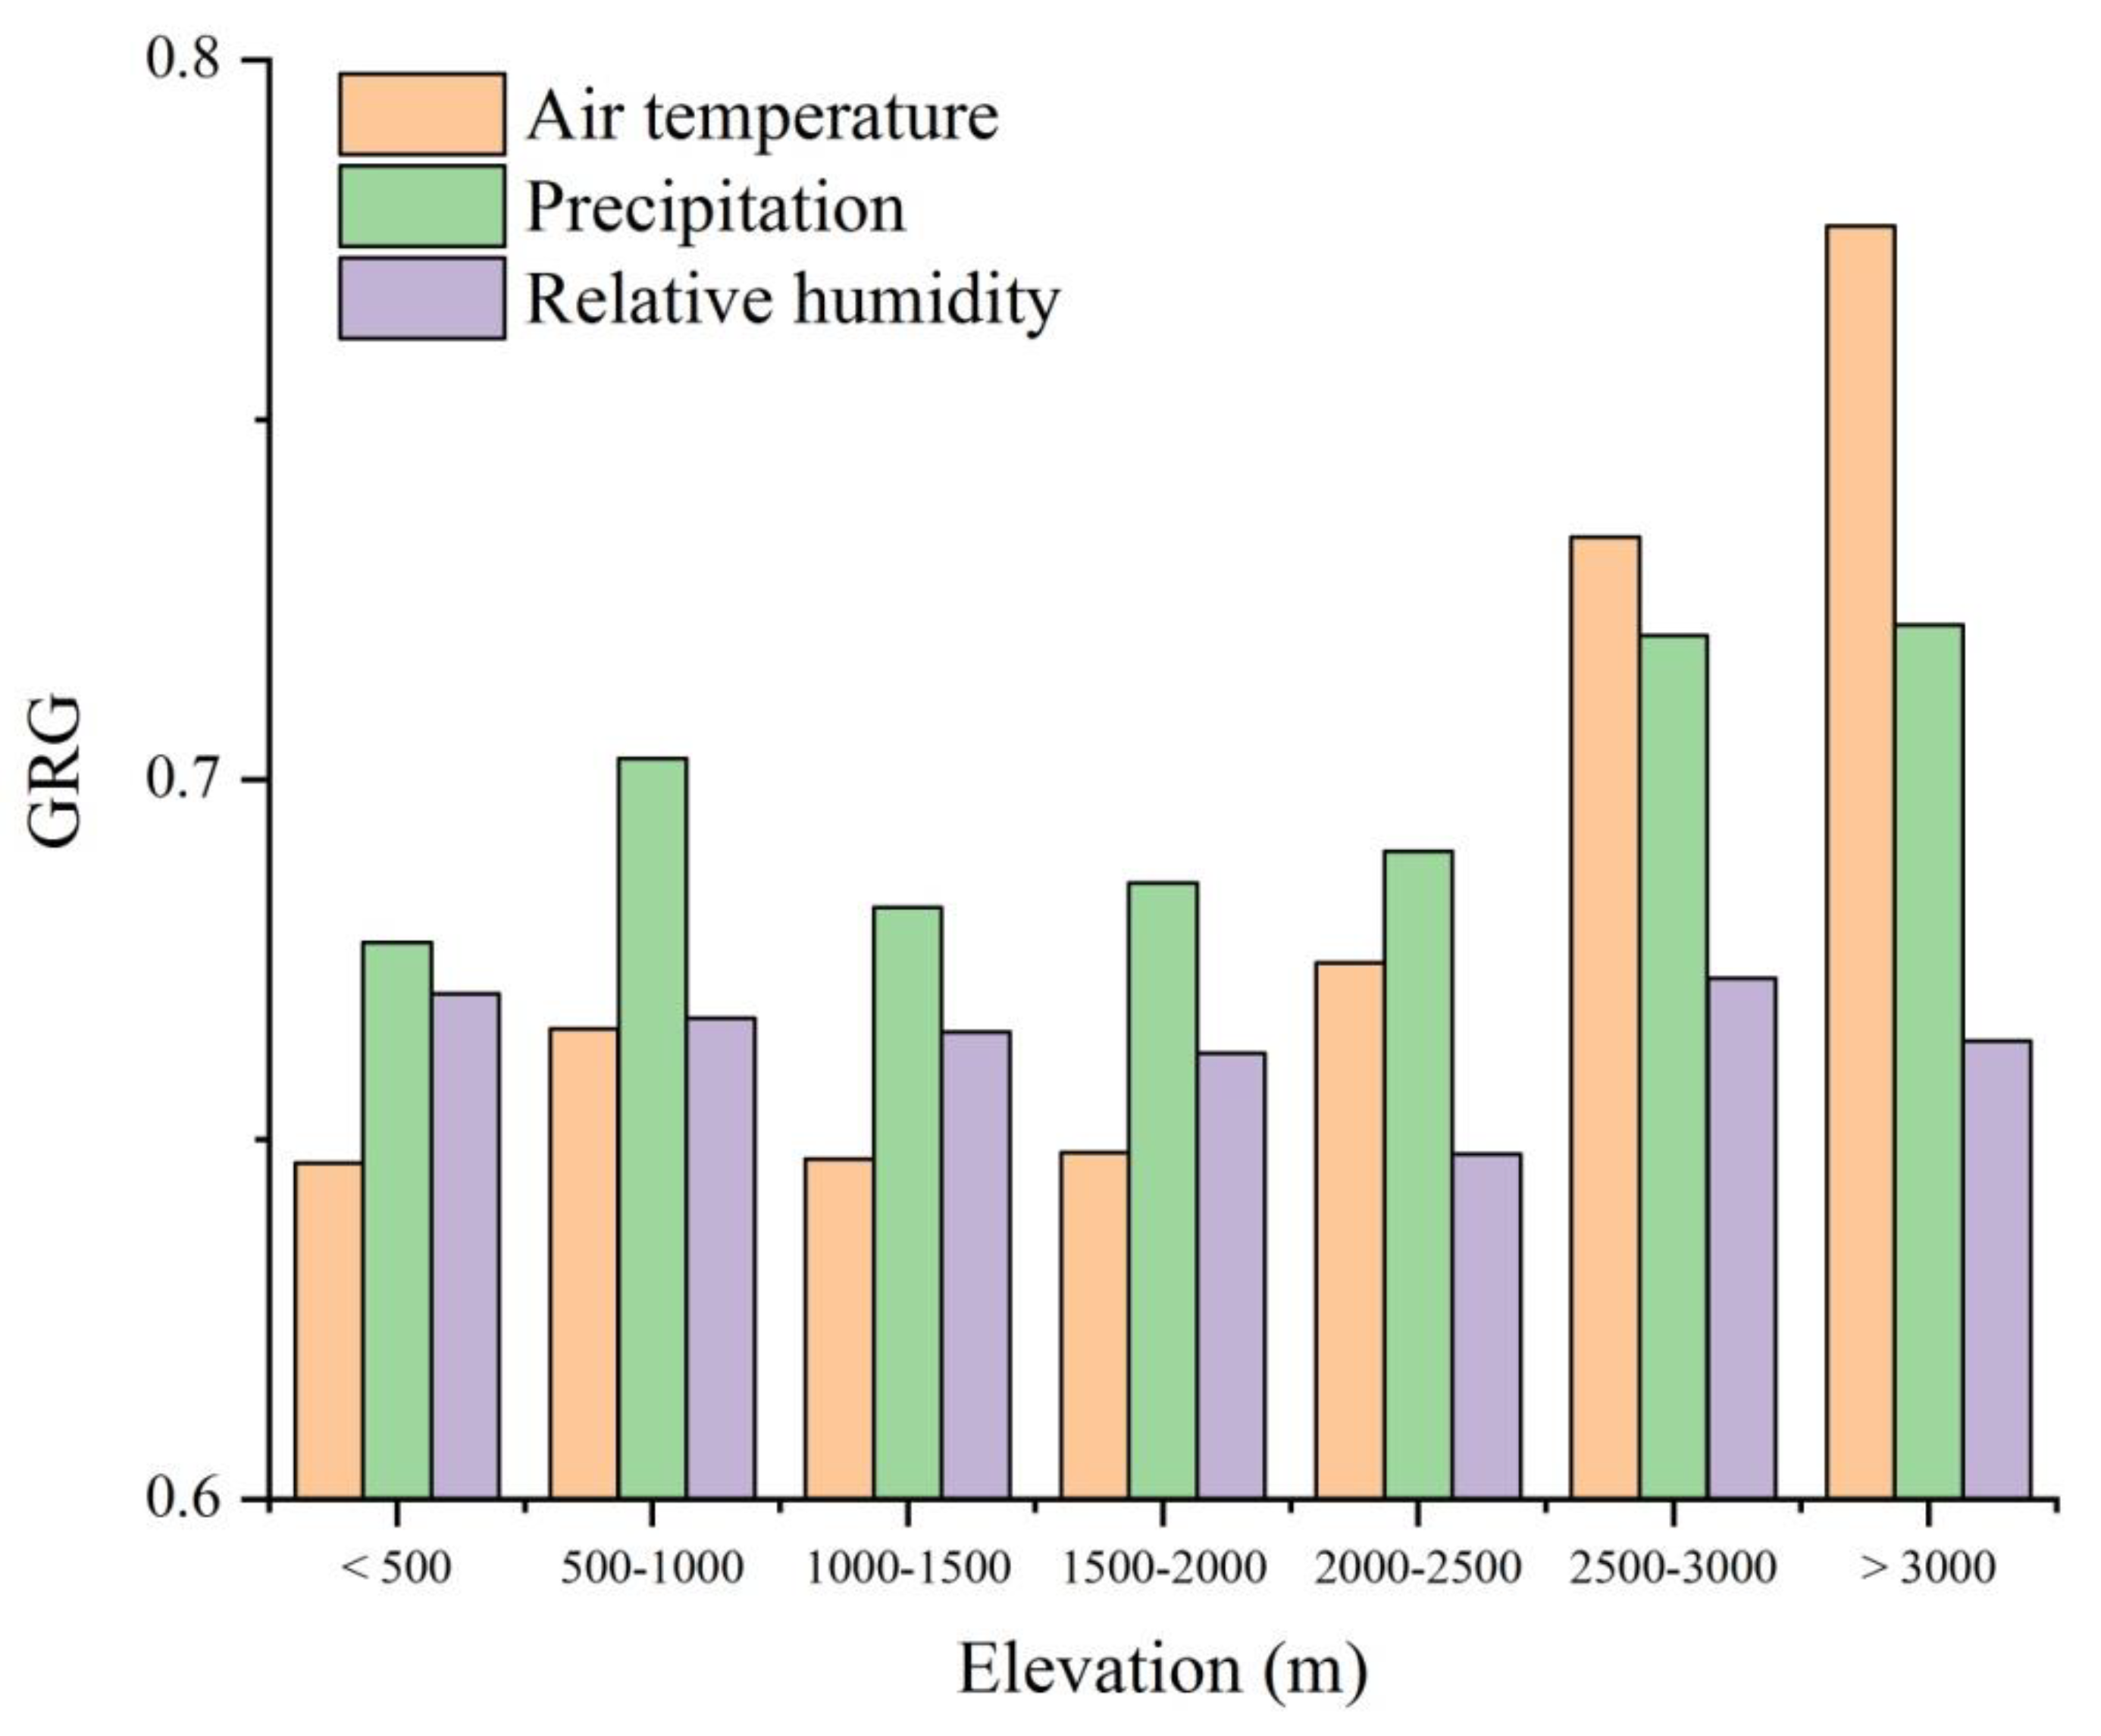
The study area is divided into seven elevation gradients: below 500 m, 500–1000 m, 1000–1500 m, 1500–2000 m, 2000–2500 m, 2500–3000 m and above 3000 m, so as to discuss the distribution and change rules of EVI’s correlation degree to climatic factors on different elevation intervals.
From the change of GRG between the EVI and climatic factors in terms of elevation gradient (Figure 9), it can be seen that the change in precipitation has a higher impact on the vegetation in each elevation gradient. As the elevation increases, the GRG between precipitation and EVI is generally showing a slowly rising trend. The GRG between air temperature and EVI declines first and then rises as the elevation increases. In the area above 2000 m, the GRG between EVI and air temperature displays a dramatically increasing trend. The GRG between relative humidity and EVI does not fluctuate greatly at various elevation gradients. As the elevation increases, the GRG is showing a slowly decreasing trend. In the area below 2500 m, the GRG between EVI and precipitation is the highest, followed by relative humidity and then air temperature. Above 2500 m, the GRG between EVI and air temperature reaches the highest, followed by precipitation and then relative humidity.

3.4.3. Zoning for EVI Changes Based on the Dominant Driving Climatic Factors

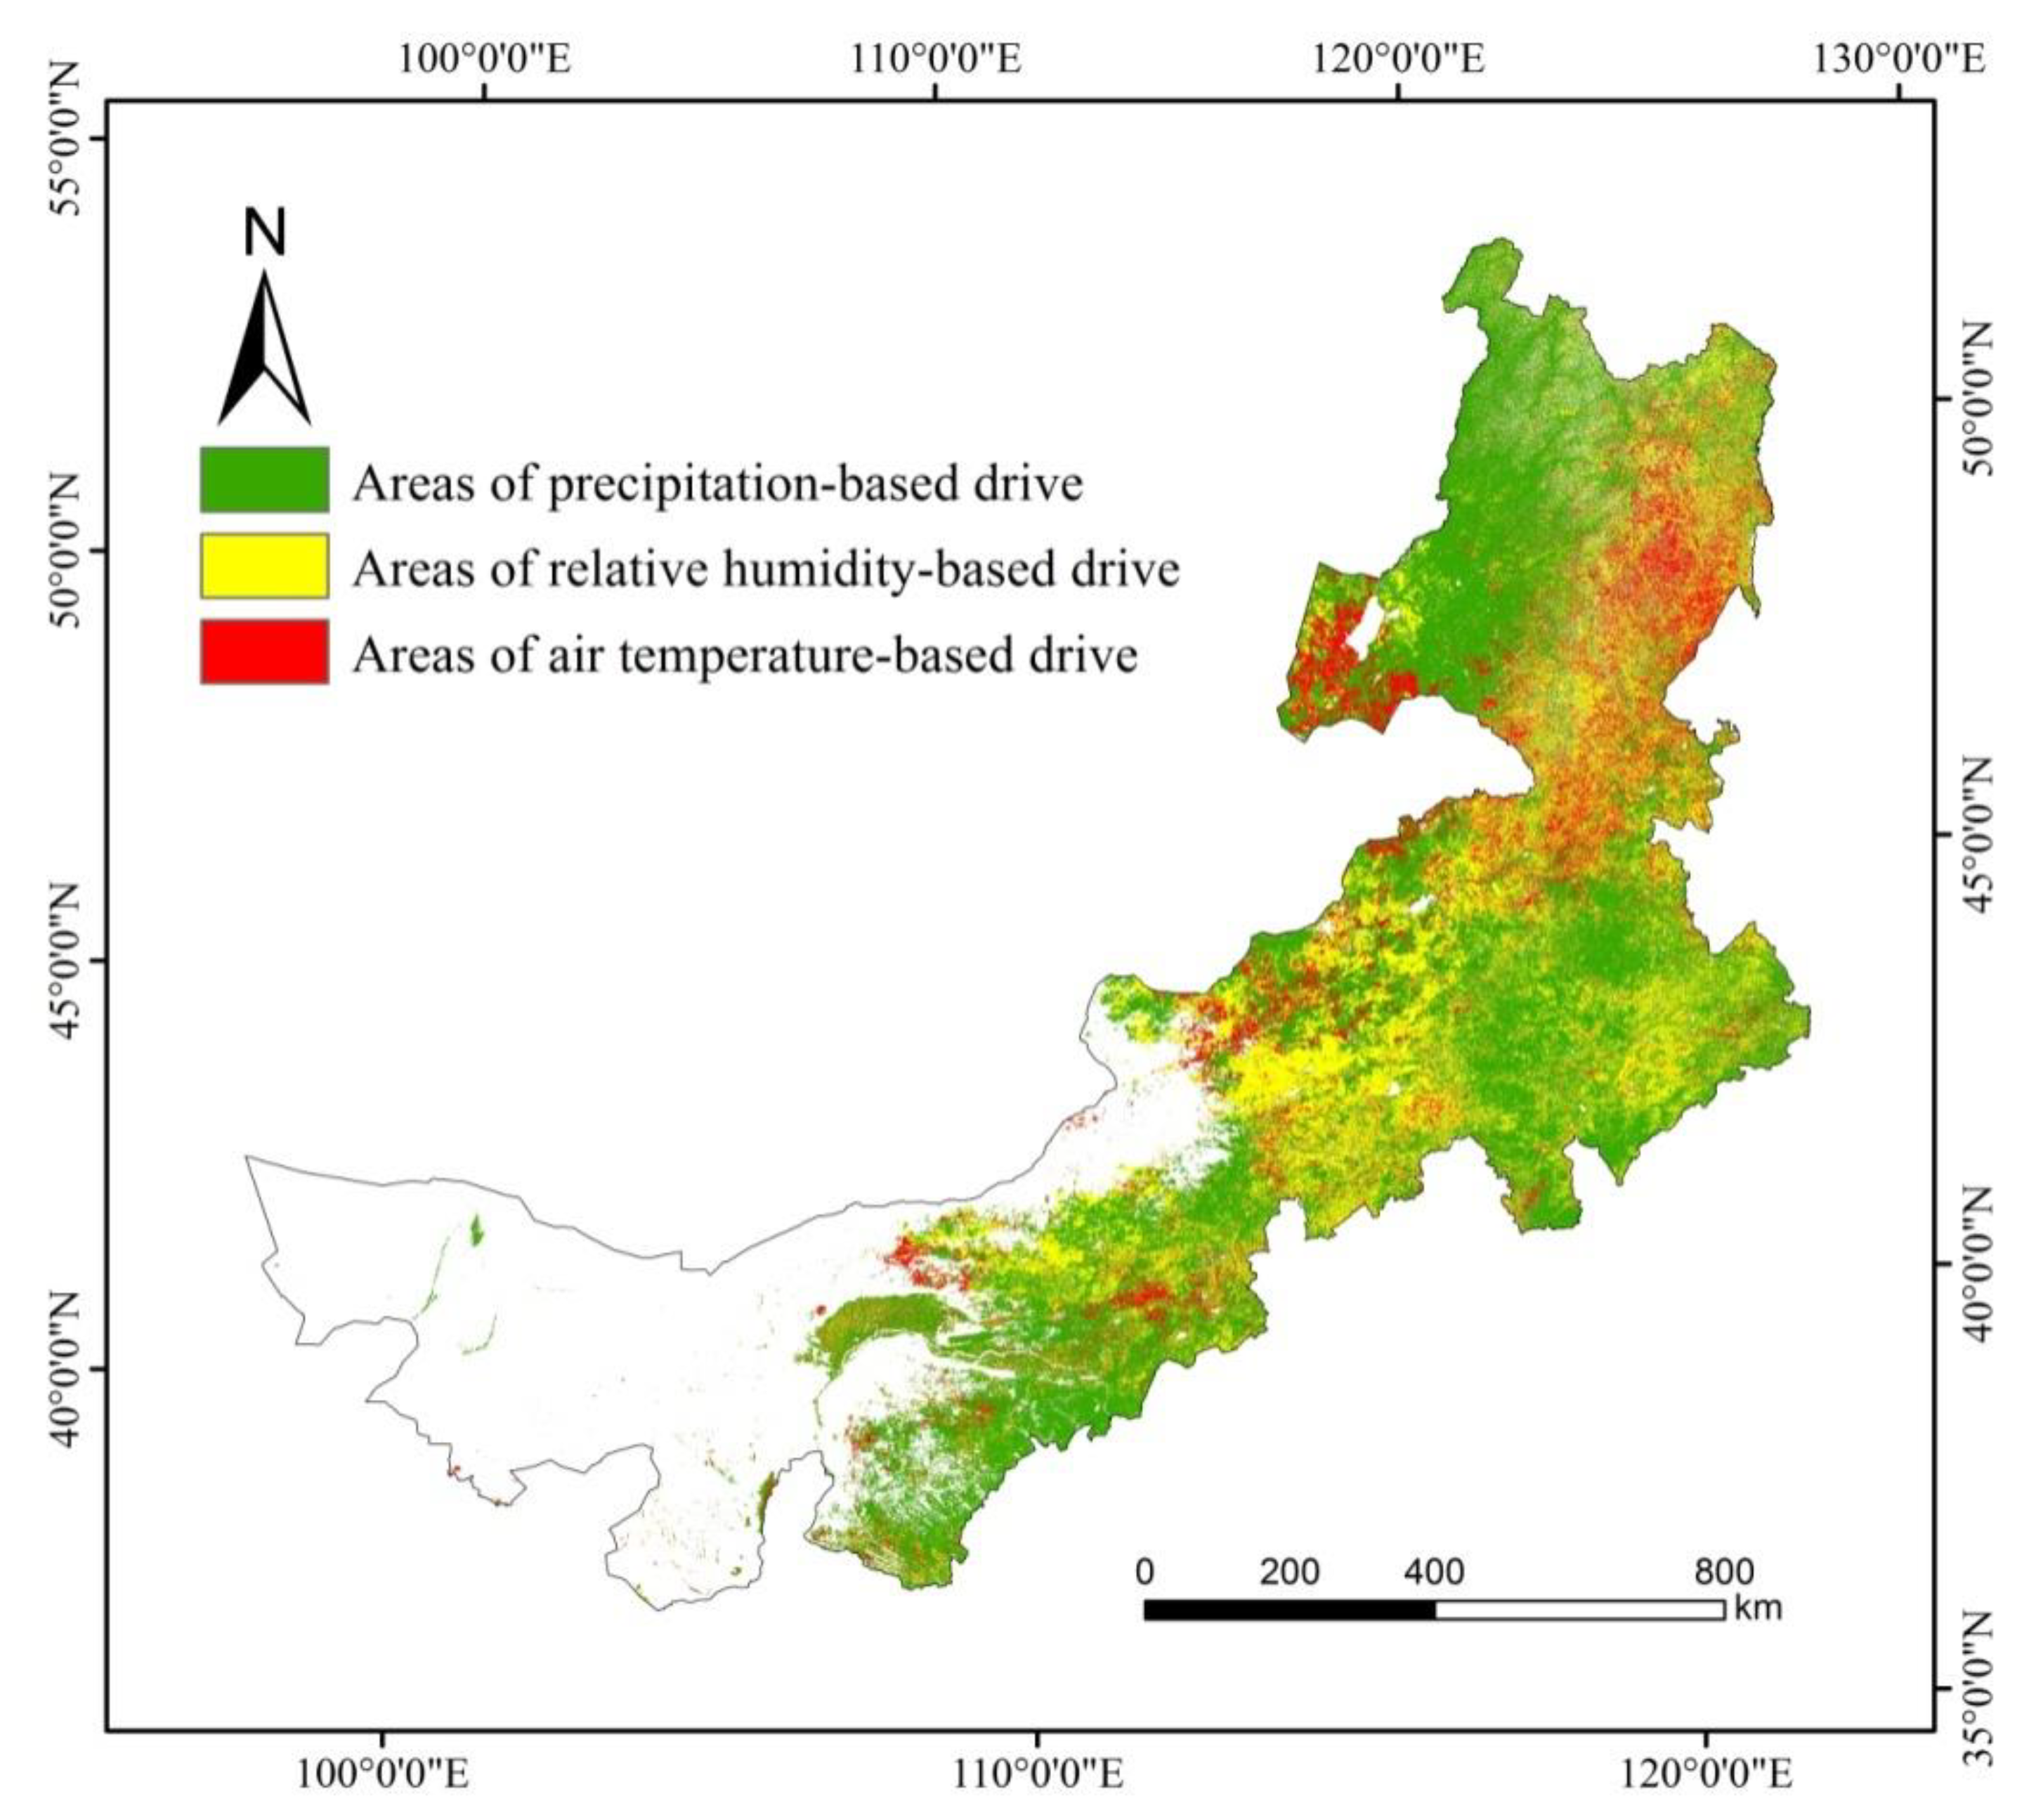
Figure 10 shows the area occupied by the climatic factors with the highest GRG with EVI. Owing to differences in regions, elevations and vegetation types within the study area, the correlation degree between vegetation growth, water and heat varies. The area with the highest GRG between EVI and precipitation accounts for 53.7% of the study area, where coniferous forests, grasslands, meadows, shrubs and cultivated plants grow. The area with the highest GRG between EVI and air temperature accounts for 15.4% of the study area, where the vegetation types are mainly broad-leaved forest, swamp and meadow. The area with the highest GRG between EVI and relative humidity accounts for 30.9% of the study area, where there are mainly broad-leaved forests, swamps, meadows and grasslands.

4. Analysis and Discussion

The above results show that the response speed and response degree of different vegetation types to hydrothermal combinations vary greatly in different ecological environments, and their response speeds and degrees of response have independent dominant factors and spatio-temporal distribution rules. For example, the coniferous forests in the northern part of the study area respond fastest to changes in relative humidity (Figure 7), but as for climatic factor, precipitation has the highest response degree (Figure 10). On the whole, the response speed and response degree of forests to climatic factors are higher than of grasslands.
In terms of response speed, the impact speed of climate change on vegetation is closely related to vegetation types, and different vegetation types have different response speeds to climate factors. However, in addition to vegetation types, the complex and diverse environment of IMAR makes the vegetation’s sensitivity to climate change different in each region. Therefore, the factors that affect the response speed of vegetation growth to climate change may also include elevation, local climate type, longitude and latitude. With further analysis, we find that the response time of vegetation to precipitation shows a significantly positive correlation with elevation (Figure 1, Figure 7), and the response speed of vegetation to air temperature has a high degree of agreement with the local climate type zone (Figure 1, Figure 7). The impact speed of relative humidity on vegetation has a close relationship with latitude (Figure 7). Based on the moisture conditions, hydrothermal changes and vegetation growth habits in different regions, we find that as the elevation gradient increases, the mean air temperature in the environment decreases, the amount of evapotranspiration on the plant surface decreases and the soil’s ability to hold water increases; thus, the vegetation reduces the demand for precipitation, and the lag time of vegetation’s response to precipitation gets longer. When there is sufficient water in the environment for vegetation growth, changes in air temperature will directly affect the transpiration of plants, chlorophyll synthesis and other aspects. While in a humid environment, the impact of changes in air temperature will be magnified, and the response of vegetation to air temperature in the semi-humid sub-zone is significantly faster than that in the arid and semi-arid areas in the central and southern parts of the study area. The more humid the climate is, the more sensitive the vegetation growth becomes to air temperature fluctuations. As the latitude increases, the humidity in the air also increases. Under the combined effects of air temperature and precipitation, vegetation grows in a long-term humid or arid environment, forming a dependence on high or low humidity environments. Because high and low latitudes are affected by sunlight and topography, an obvious arid and humid partition environment is formed. The change of relative humidity will greatly affect the growth habits of vegetation. The higher the latitude is, the shorter the lag time of vegetation’s response to relative humidity gets. As the latitude increases, the humidity in the air also increases. Under the combined effects of air temperature and precipitation, vegetation grows in a long-term humid or arid environment, forming a dependence on high or low humidity environments. Because high and low latitudes are affected by sunlight and topography, an obvious arid and humid partition environment is formed. The change of relative humidity will greatly affect the growth habits of vegetation. The higher the latitude is, the shorter the lag time of vegetation’s response to relative humidity gets.
With regard to response degree, vegetation growth in the study area as a whole relies most heavily on precipitation, followed by relative humidity and then air temperature. The standard deviation of the GRG between vegetation and climate factors is greater at the same latitude than that at the same longitude (Figure 8), indicating that the response degree of vegetation growth to climate change may have more significant regional heterogeneity and regularity in the north–south span than that in the east–west span. In addition, the trend of latitude is more significant than that of longitude, and the trend of air temperature is particularly significant (Figure 8), which shows that the impact degree of air temperature on vegetation growth has a significant north–south increasing rule, and precipitation and relative humidity also show the same characteristics of change, which may be caused by latitude or elevation. We find that the increasing trend of the impact degree of climatic factors on vegetation from south to north fits weakly with latitude (Figure 8). It is worth noting that at the elevation of 2500m, the dominant factor in vegetation growth is changed by hydrothermal combination in the environment (Figure 9). Below 2500 m, the correlation between EVI, precipitation and relative humidity is the highest in the entire study area, where moisture is the dominant factor affecting vegetation growth in the region, while in areas above 2500 m, the correlation between EVI and air temperature in the study area exceeds that between EVI, precipitation and relative humidity. In areas with relatively high elevation, vegetation growth is more dependent on air temperature. Therefore, we can know that vegetation types and elevation gradients in IMAR are the two major factors that affect the response degree of vegetation growth to climate factors.
The zoning results (Figure 10) of dominant climatic factor show that 53.7% of the study area is dominated by precipitation, while air temperature and relative humidity account for 15.4% and 30.9%, respectively. Overall, the vegetation growth in IMAR has the highest correlation with precipitation, followed by relative humidity and then air temperature, which is basically consistent with the views of Mu et al. [42]. However, in the typical steppe area where precipitation is the dominant driving force, there is also a strong combination of air temperature and precipitation for driving, which indicates that the growth of typical steppe depends more on the interaction of water and heat. In the central and western part as well as southeastern part in the north of the study area, where there are swamps, broad-leaf forests and desert grasslands, temperature and relative humidity are the dominant driving forces, indicating that these regions are more dependent on air temperature and humidity than on water. In the coniferous and broad-leaved mixed forest zone in the northeastern part of the study area, there is a strong drive of air temperature, relative humidity and precipitation, indicating that the vegetation growth here requires higher air temperature, humidity and moisture. Therefore, the growth and change of vegetation do not depend on the change of a single climatic factor but are affected by multiple climatic factors.
In this paper, we have discussed the relationship of vegetation’s response to precipitation, air temperature, and relative humidity in IMAR and the factors that affect the response. In addition, there is also a significant correlation between vegetation growth and extreme weather. Other climatic factors such as the duration of sunshine will also have an important impact on local biomass. Vegetation change is not only closely related to climate change but also closely related to human activities and other factors. Before the 21st century, the overall growth of vegetation in IMAR was declining under the combined effects of climate change, socioeconomics and local policy changes. Since the beginning of the 21st century, China has implemented a series of ecological restoration projects such as the control of wind and sand sources in Beijing and Tianjin, returning farmland to forests, returning grazing land to grassland, enclosing grazing land and ecological migration. IMAR is one of the key implementation areas of these projects, making forests and grasslands effectively protected. The improvement of forests is particularly obvious. Most of the coniferous and broad-leaved forests in the northern part of the study area belong to artificial forests. Especially in arid and semi-arid areas, the management of vegetation ecological areas has become the main driving force for vegetation change. Similar to the results of many studies (Sun et al. 2010; Shi et al. 2011), we find that from 2000 to 2018, the vegetation in desert grasslands of central IMAR and sand and dust land in the south (such as Sonid Left Banner and Otog Banner) is in a continuously good state, and the extensive implementation of ecological restoration measures for planting trees, planting grass, forbidding grazing and preventing and controlling desertification has played an important role in this process. According to the Statistical Yearbook of IMAR, from 2000 to 2018, the total population of IMAR increased by 6.6%, and the total number of livestock decreased by 0.4%, the area of artificial afforestation and mountain closure increased by 44.5%, and the positive and negative effects of human disturbance on the growth of vegetation increased. The inter-annual ecological complexity changes the response sensitivity and dependence of vegetation growth to climate factors and ultimately results in differences in the response speed and response degree of vegetation growth to climate factors.

5. Conclusions

Our paper starts with data sources, technical methods and research scales, further corrects the existing data research problems such as incomplete data preprocessing and low verification accuracy, and overcomes excessive ignorance of details, severe distortion of lag response and overgeneralization due to means such as using average values of the wide area or statistical data. We discuss the response speed and response degree of vegetation to climate change in a separate way and explore the factors that impact the response speed and degree from multiple perspectives such as vegetation type, longitude, latitude, elevation and local climate types. The main conclusions are as follows:
  • From 2000 to 2018, the mean EVI of the vegetation in the growing season of IMAR is 0.280, which is significantly different in space, showing a distribution pattern that decreases from north to south and east to west. The change rate from east to west is 0.25/10° E and 0.23/10° N from north to south. The mean value of EVI in IMAR shows a rising trend during the 19 years, with a growth rate of 0.031/10a. Areas with significant improvement and obvious improvement account for 14.7% and 25.9%, respectively, of the study area, while areas with significant degradation and obvious degradation account for 0.38% and 0.39%, respectively, of the study area.
  • Different vegetation types in different ecological environments have independent dominant factors and temporal and spatial distribution rules of response speed and response degree to water and heat. On the whole, the response speed and response degree to climate factors are higher in forests than in grasslands.
  • The lag time of vegetation’s response to precipitation, air temperature and relative humidity in IMAR is mostly within 2 months, and the percentage of area is 68.3%, 55.3% and 71.7%, respectively. The response time of vegetation to precipitation shows a significant positive correlation with the altitude. The more humid the climate is, the faster the vegetation responds to air temperature changes; the higher the latitude is, the shorter the lag time of vegetation’s response to changes in relative humidity.
  • Vegetation types and altitude gradients are the two most important factors that affect the degree of vegetation’s response to climate factors. It is worth noting that at an elevation of 2500 m, the dominant factor in vegetation growth is changed by the hydrothermal combination in the environment. Below 2500 m, the correlation between vegetation EVI and precipitation and relative humidity is the highest in the study area. The moisture-dominated factor affects vegetation growth in the region, while in areas above 2500 m, the correlation between EVI and air temperature in the study area exceeds precipitation and relative humidity. In areas with relatively high elevation, vegetation growth is more dependent on air temperature.
  • The area where EVI changes are mainly driven by precipitation accounts for 53.7% of the study area, far greater than that by air temperature (15.4%) and relative humidity (30.9%). The EVI has the closest relationship with precipitation, followed by relative humidity and then air temperature. However, the growth and change of vegetation are not limited to the change of a single climatic factor, but affected by multiple climatic factors.

Author Contributions

D.H., X.H. and Q.T. jointly designed the study and wrote the thesis. X.H., Q.T. and Z.Z. all participated in the process of discussion, editing and revision. All authors have read and agreed to the published version of the manuscript.

Funding

This study was supported by the National Science and Technology Major Project of China (30-Y20A07-9003-17/18 & 03-Y20A04-9001-17/18), the Natural Science Foundation of China (41771370), the National Key Research and Development Program of China (2017YFD0600903) and the 13th Five-Year Plan of Civil Aerospace Technology Advanced Research Projects.

Acknowledgments

The author thanks anonymous reviewers for providing invaluable comments on the original manuscript.

Conflicts of Interest

The authors declare no conflicts of interest.

References

  1. Walker, B.; Steffen, W. IGBP Science No.1: A synthesis of GCTE and related research. Stockholm IGBP 1997, 1–24. [Google Scholar]
  2. Parmesan, C.; Yohe, G. A globally coherent fingerprint of climate change impacts across natural systems. Nature 2003, 421, 37–42. [Google Scholar] [CrossRef] [PubMed]
  3. Xin, Z.B.; Xu, J.X.; Zheng, W. Spatiotemporal variations of vegetation cover on the Chinese Loess Plateau (1981-2006): Impacts of climate changes and human activities. Sci. China Ser. D 2008, 51, 67–78. [Google Scholar] [CrossRef]
  4. Liu, J.H.; Gao, J.X. Effects of climate and land use change on the change of vegetation coverage in farming-pastoral ecotone of northern China. Chin. J. Appl. Ecol. 2008, 19, 2016–2022. [Google Scholar]
  5. Gan, C.Y.; Wang, X.Z.; Li, B.S.; Liang, Z.X.; Li, Z.W.; Wen, X.H. Changes of vegetation coverage during recent 18 years in Lianjiang river watershed. Sci. Geogr. Sin. 2011, 31, 1019–1024. [Google Scholar]
  6. Tucker, C.J. Red and photographic infrared linear combination for monitoring vegetation. Remote Sens. Environ. 1979, 8, 127–150. [Google Scholar] [CrossRef] [Green Version]
  7. He, D.; Yi, G.H.; Zhang, T.B.; Miao, J.Q.; Li, J.J.; Bie, X.J. Temporal and spatial characteristics of EVI and its response to climatic factors in recent 16 years based on grey relational analysis in Inner Mongolia Autonomous Region, China. Remote Sens. 2018, 10, 961. [Google Scholar] [CrossRef] [Green Version]
  8. Pettorelli, N.; Vik, J.O.; Mysterud, A.; Gaillard, J.M.; Tucker, C.J.; Stenseth, N.C. Using the satellite-derived NDVI to assess ecological responses to environmental change. Trends Ecol. Evol. 2005, 20, 503–510. [Google Scholar] [CrossRef]
  9. Sun, Y.L.; Guo, P.; Yan, X.D.; Zhao, T.B. Dynamics of vegetation cover and its relationship with climate change and human activities in Inner Mongolia. J. Nat. Res. 2010, 25, 407–414. [Google Scholar]
  10. Shi, Z.J.; Gao, J.X.; Xu, L.H.; Feng, C.Y.; Lv, S.H.; Shang, J.X. Effect of vegetation on changes of temperature and precipitation in Inner Mongolia, China. Ecol. Envirn. Sci. 2011, 20, 1594–1601. [Google Scholar]
  11. Ji, L.; Peters, A.J. Assessing vegetation response to drought in the northern great plains using vegetation and drought indices. Remote Sens. Environ. 2003, 87, 85–98. [Google Scholar] [CrossRef]
  12. Huang, X.; Zhang, T.B.; Yi, G.H.; He, D.; Zhou, X.B.; Li, J.J.; Bie, X.J.; Miao, J.Q. Dynamic changes of NDVI in the growing season of the Tibetan Plateau during the past 17 years and its response to climate change. Int. J. Environ. Res. Public Health 2019, 16, 3452. [Google Scholar] [CrossRef] [PubMed] [Green Version]
  13. Chen, Y.L.; Luo, Y.M.; Mo, W.H.; Mo, J.F.; Huang, Y.L.; Ding, M.H. Differences between MODIS NDVI and MODIS EVI in response to climatic factors. J. Nat. Res. 2014, 29, 1802–1812. [Google Scholar]
  14. Cui, L.L.; Shi, J.; Xiao, F.J.; Fan, W.Y. Variation trends in vegetation NDVI and its correlation with climatic factors in Eastern China. Res. Sci. 2010, 32, 124–131. [Google Scholar]
  15. Liu, J.H.; Gao, J.X.; Wang, W.J. Variations of vegetation coverage and its relations to global climate changes on the Tibetan Plateau during 1981–2005. J. Mt. Sci.-Engl. 2013, 31, 234–242. [Google Scholar]
  16. Camberlin, P.; Martiny, N.; Philippon, N.; Richard, Y. Determinants of the interannual relationships between remote sensed photosynthetic activity and rainfall in tropical Africa. Remote Sens. Environ. 2007, 106, 199–216. [Google Scholar] [CrossRef] [Green Version]
  17. Wardlow, B.D.; Egbert, S.L. Large-area crop mapping using time-series MODIS 250m NDVI data: An assessment for the U.S. central great plains. Remote Sens. Environ. 2008, 112, 1096–1116. [Google Scholar] [CrossRef]
  18. Piao, S.L.; Wang, X.H.; Ciais, P.; Zhu, B. Changes in satellite-derived vegetation growth trend in temperate and boreal Eurasia from 1982 to 2006. Glob. Chang. Biol. 2011, 17, 3228–3239. [Google Scholar] [CrossRef]
  19. Karlsen, S.R.; Tolvanen, A.; Kubin, E.; Poikolainen, J. MODIS-NDVI-based mapping of the length of the growing season in northern Fennoscandia. Int. J. Appl. Earth Obs. 2008, 10, 253–266. [Google Scholar] [CrossRef]
  20. Raynolds, M.K.; Comiso, J.C.; Balser, A.; Verbyla, D. Relationship between satellite-derived land surface temperatures, arctic vegetation types, and NDVI. Remote Sens. Environ. 2008, 112, 1884–1894. [Google Scholar] [CrossRef]
  21. Wang, X.H.; Piao, S.L.; Ciais, P.; Li, J.S.; Friedlingstein, P.; Koven, C.D.; Chen, A. Spring temperature change and its implication in the change of vegetation growth in North America from 1982 to 2006. Proc. Natl. Acad. Sci. USA. 2011, 108, 1240–1245. [Google Scholar] [CrossRef] [PubMed] [Green Version]
  22. Li, J.; Zhang, C.Q.; Zhang, J. The lag response of the growth dynamics of dominant grasses to meteorological factors in typical steppe of Inner Mongolia. Acta Agrestia Sin. 2017, 25, 267–272. [Google Scholar]
  23. Klinge, M.; Dulamsuren, C.; Erasmi, S.; Karger, D.N.; Hauck, M. Climate effects on vegetation vitality at the treeline of boreal forests of Mongolia. Biogeosciences 2018, 15, 1–25. [Google Scholar] [CrossRef] [Green Version]
  24. Zhang, Q.Y.; Zhao, D.S.; Wu, S.H.; Dai, E.D. Research on vegetation changes and influence factors based on eco-geographical regions of Inner Mongolia. Sci. Geogr. Sin. 2013, 33, 594–601. [Google Scholar]
  25. Zhang, G.L.; Ou, Y.H.; Zhang, X.Z.; Zhou, C.P.; Xu, X.L. Vegetation change and its responses to climatic variation based on eco-geographical regions of Tibetan Plateau. Geogr. Res. 2010, 29, 2004–2016. [Google Scholar]
  26. Kong, D.D.; Zhang, Q.; Huang, W.L.; Gu, X.H. Vegetation phenology change in Tibetan Plateau from 1982 to 2013 and its related meteorological factors. Acta Geogr. Sci. 2017, 72, 39–52. [Google Scholar]
  27. Ballantyne, M.; Treby, D.L.; Quarmby, J.; Pickering, C.M. Comparing the impacts of different types of recreational trails on grey box grassy-woodland vegetation: Lessons for conservation and management. Aust. J. Bot. 2016, 64, 246–259. [Google Scholar] [CrossRef]
  28. Li, H.D.; Shen, W.S.; Cai, B.F.; Ji, D.; Zhang, X.Y. The coupling relationship between variations of NDVI and change of aeolian sandy land in the Yarlung Zangbo River Basin of Tibet, China. Acta Ecol. Sin. 2013, 33, 7729–7738. [Google Scholar]
  29. Zhu, W.Q.; Pan, Y.Z.; Long, Z.H.; Chen, Y.H.; Li, J.; Hu, H.B. Estimating net primary productivity of terrestrial vegetation based on GIS and RS: A case study in Inner Mongolia, China. J. Remote Sens. 2005, 9, 300–307. [Google Scholar]
  30. Sun, G.N.; Wang, M.H. Study on relation and distribution between vegetative coverage and land degradation in Inner Mongolia. J. Arid Land Res. Environ. 2008, 22, 140–144. [Google Scholar]
  31. Wang, Q.; Zhang, T.B.; Yi, G.H.; Chen, T.T.; Bie, X.J.; He, Y.X. Tempo-spatial variations and driving factors analysis of net primary productivity in the Hengduan mountain area from 2004 to 2014. Acta Ecol. Sin. 2017, 37, 1–13. [Google Scholar]
  32. Ding, M.J.; Zhang, Y.L.; Sun, X.M.; Liu, L.S.; Wang, Z.F. Spatiotemporal variation in alpine grassland phenology in the Qinghai-Tibetan Plateau from 1999 to 2009. Chin. Sci. Bull. 2012, 57, 3185–3194. [Google Scholar] [CrossRef] [Green Version]
  33. Roerink, G.J.; Menenti, M.; Verhoef, W. Reconstructing cloud free NDVI composites using Fourier analysis of time series. Int. J. Remote Sens. 2000, 21, 1911–1917. [Google Scholar] [CrossRef]
  34. Ren, S.; Yi, S.; Peichl, M.; Wang, X. Diverse responses of vegetation phenology to climate change in different grasslands in Inner Mongolia during 2000–2016. Remote Sens. 2018, 10, 17. [Google Scholar] [CrossRef] [Green Version]
  35. Zhang, W.; Ren, Z.; Yao, L.; Zhou, C.; Zhu, Y. Numerical modeling and prediction of future response of permafrost to different climate change scenarios on the Qinghai–Tibet Plateau. Int. J. Digit. Earth. 2016, 9, 442–456. [Google Scholar] [CrossRef]
  36. Wang, Z.Y.; Xu, R.Y.; Yang, H.; Ding, X.; Li, D.J. Impacts of climate change and human activities on vegetation dynamics in Inner Mongolia, 1981-2010. Prog. Geogr. 2017, 36, 1025–1032. [Google Scholar]
  37. Ugbaje, S.U.; Inakwu, O.A.; Thomas, F.A.B.; Li, J. Assessing the spatio-temporal variability of vegetation productivity in Africa: Quantifying the relative roles of climate variability and human activities. Int. J. Digit. Earth 2016, 10, 879–900. [Google Scholar]
  38. Borrelli, P.; Diodato, N.; Panagos, P. Rainfall erosivity in Italy: A national scale spatio-temporal assessment. Int. J. Digit. Earth 2016, 9, 835–850. [Google Scholar] [CrossRef] [Green Version]
  39. Meng, D.; Li, X.J.; Gong, H.L.; Qu, Y.T. Analysis of spatial-temporal change of NDVI and its climatic driving factors in Beijing-Tianjin-Hebei metropolis circle from 2001 to 2013. J. Geo-Inform. Sci. 2015, 17, 1001–1007. [Google Scholar]
  40. Wong, H.; Hu, B.Q.; Ip, W.C.; Xia, J. Change-point analysis of hydrological time series using grey relational method. J. Hydrol. 2006, 324, 323–338. [Google Scholar] [CrossRef]
  41. Yi, G.H.; Zhang, T.B. Delayed response of lake area change to climate change in siling co lake, Tibetan Plateau, from 2003 to 2013. Int. J. Environ. Res. Public Health 2015, 12, 886–900. [Google Scholar] [CrossRef] [PubMed] [Green Version]
  42. Mu, S.J.; Zhou, K.X.; Qi, Y.; Chen, Y.Z.; Fang, Y.; Zhu, C. Spatio-temporal patterns of precipitation-use efficiency of vegetation and their controlling factors in Inner Mongolia. Chin. J. Plant Ecol. 2014, 38, 1–16. [Google Scholar]
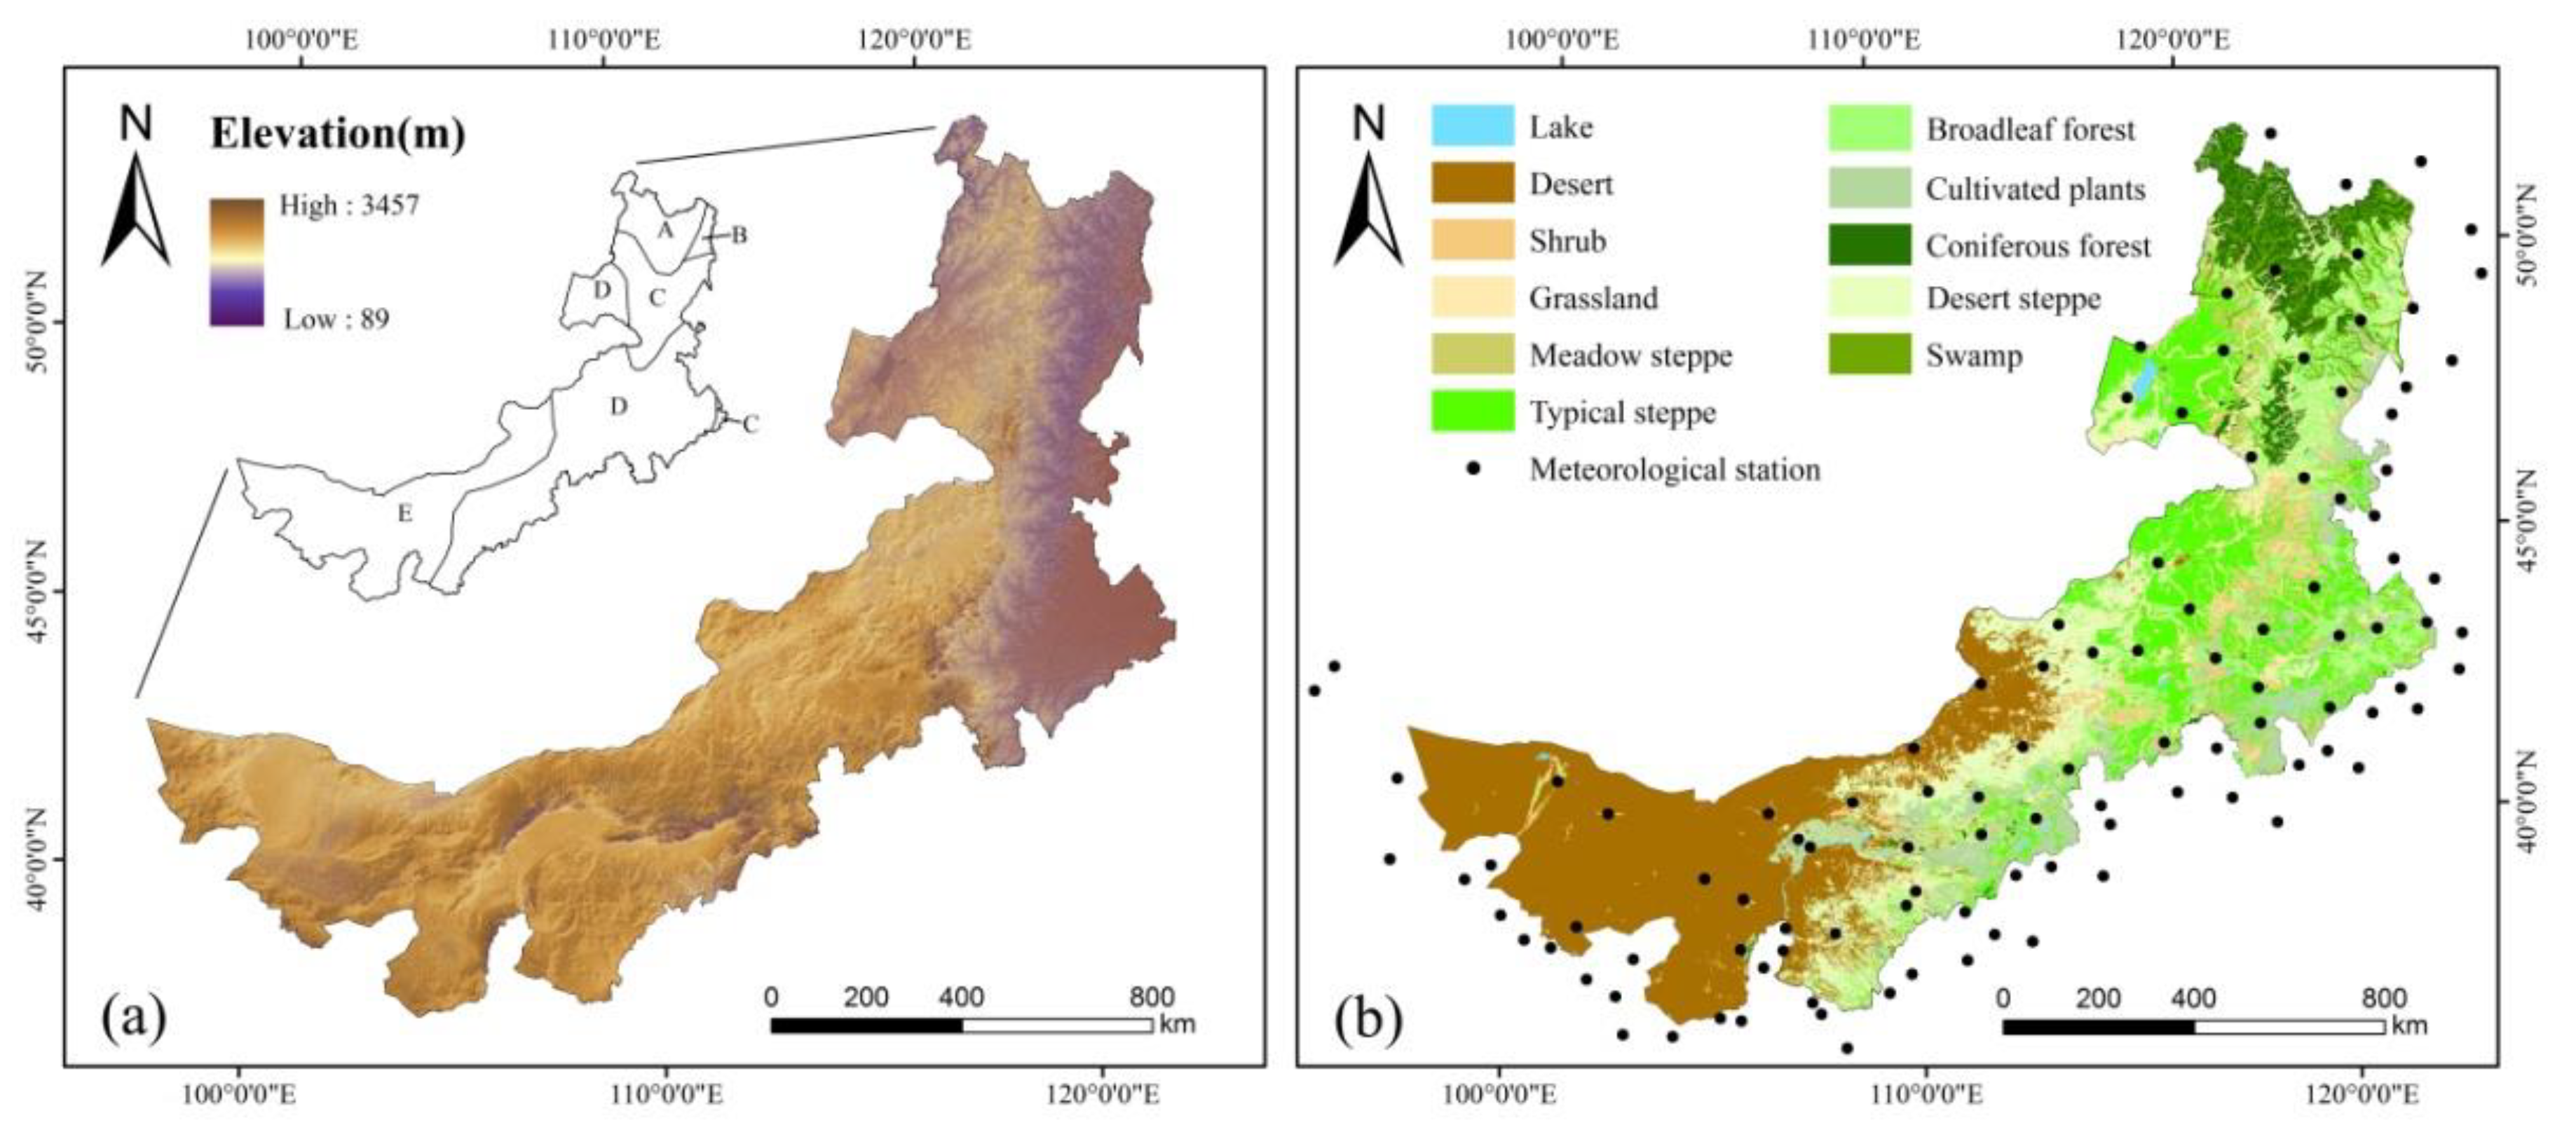
Figure 1. The Digital Elevation Model (DEM) and zoning of climate types (a) and distribution of vegetation types and meteorological stations (b) in the study area. (A—North temperate humid zone; B—middle temperate humid zone; C—middle temperate sub-humid zone; D—middle temperate sub-arid zone; E—middle temperate arid zone).
Sustainability 12 02534 g001
Figure 2. Outlier removal and replacement (a) and comparison of removing high outliers before and after harmonic analysis of time series (HANTS) processing (b).
Sustainability 12 02534 g002
Figure 3. Inter-annual changes of Enhanced Vegetation Index (EVI) in the study area (a) and variation curves of different vegetation groups (b) from 2000 to 2018.
Sustainability 12 02534 g003
Figure 4. Spatial distribution of multi-year mean value of EVI in the growing season of the study area from 2000 to 2018. (a—Distribution of EVI in longitude and latitude; b—distribution of EVI in longitude and elevation; c—distribution of EVI in latitude and elevation).
Sustainability 12 02534 g004
Figure 5. Vegetation growth trend (a) and vegetation improvement (b) in the study area from 2000 to 2018.
Sustainability 12 02534 g005
Figure 6. Inter-annual changes of precipitation, air temperature and relative humidity in the four periods from 2000 to 2018. (SD—standard deviation).
Sustainability 12 02534 g006
Figure 7. Response time of EVI to precipitation (a), air temperature (b) and relative humidity (c) on the pixel scale.
Sustainability 12 02534 g007
Figure 8. Changes in longitude and latitude of Grey Relational Grade (GRG) between EVI and precipitation, air temperature and relative humidity.
Sustainability 12 02534 g008
Figure 9. Changes in elevation gradients of GRG between EVI and precipitation, air temperature and relative humidity.
Sustainability 12 02534 g009
Figure 10. Zoning of dominant climate factor in EVI changes.
Sustainability 12 02534 g010