Article

Research on Mobile Marketing Recommendation Method Incorporating Layout Aesthetic Preference for Sustainable m-Commerce

1
School of Management and E-Business, Zhejiang Gongshang University, Hangzhou 310018, China
2
Modern Business Research Center, Zhejiang Gongshang University, Hangzhou 310018, China
*
Author to whom correspondence should be addressed.
Sustainability 2020, 12(6), 2496; https://doi.org/10.3390/su12062496
Submission received: 21 February 2020 / Revised: 12 March 2020 / Accepted: 15 March 2020 / Published: 23 March 2020
(This article belongs to the Section Economic and Business Aspects of Sustainability)

Abstract

:
The strong interactivity and size limitation of the mobile interface calls for the utilization of users’ aesthetic preferences to provide better mobile marketing recommendations in order to promote the sustainable development of m-commerce. Existing studies mostly focus on matching user interests by analyzing marketing content properties. The studies for utilizing the layout information and user aesthetic preferences for the layout of the mobile marketing interface from an aesthetic perspective are insufficient. This paper proposes a mobile marketing recommendation method (LAPR) that incorporates layout aesthetic preferences. Based on the traditional content-based and collaborative filtering recommendation methods, this method introduces users’ aesthetic preferences for interface layout into a mobile marketing recommender. From an aesthetic perspective, a new interface layout design quantification method, a user aesthetic preference similarity measurement model, and a recommendation result ranking method are designed. Experiments show that compared to traditional methods, LAPR is significantly higher in recommendation precision in the task for recommending the same content and outperforms traditional methods in recall, precision, and F-metrics in the common recommendation task. We conclude that incorporating aesthetic preference for layout can improve mobile marketing recommendation quality and promote the sustainable development of m-commerce.

1. Introduction

Mobile commerce (m-commerce) has experienced rapid growth and has promoted the rapid development of mobile marketing throughout recent years. To deliver mobile marketing contents to specific users accurately by recommending systems attracts attention from academia both at home and abroad [1]. Mobile devices are capable of accessing user data, such as geological locations, privacy preferences, and interaction contexts, which are of great value in the m-commerce environment [2,3,4]. To promote the sustainable development of m-commxerce, driven by the promise of mining these valuable data, recommendation methods serving traditional PC-based e-commerce have been improved and applied to mobile marketing fields. These methods mainly include content-based methods [5], collaborative filtering methods [6], and hybrid methods [7]. These methods come with legacy problems of data sparsity and cold start [8,9], which are under active research focused mainly on optimizing recommendation efficiency and accuracy based on user interests and preferences [10,11]. However, to deliver mobile marketing contents to specific users accurately by recommendation systems, there are still huge challenges: different from traditional online marketing, mobile marketing introduces stronger interactivity on smaller user interfaces [12,13]. The characteristics of the user interfaces of mobile devices determine that the user interface containing the content of mobile marketing needs to be elaborately designed [14,15]. The organization of marketing contents on small-sized interfaces with strong interaction, i.e., the layout of the user interface of mobile marketing, is one of the key design perspectives for the sustainability of mobile marketing. Research by SAHAMI SHIRAZI A et al. pointed out that the interface of a mobile APP can be refined by optimizing the interface layout elements to improve usability [16]. Young Eun Lee et al. proposed a framework for researching mobile marketing interface design [17], taking layout as important research content, pointing out that layout determines the structure of the interface, the way of navigation, and is related to the aesthetic experience of the user.
The aesthetic experience of a user plays an important part in user experience, which makes aesthetic preference a valuable factor for recommendation mechanisms in the context of m-commerce [18]. Mobile devices have made it possible for marketing campaigns to capture and utilize more user data, including more detailed demographic information and personal information traditionally unavailable due to technical and privacy concerns [19,20]. By investigating these data and the layout characteristics of the mobile marketing recommender interfaces, we can design mechanisms for mobile marketing recommenders to address and make use of users’ aesthetic preferences. As existing mobile marketing recommendation methods are lacking the ability to further investigate user data and the layout characteristics of the mobile marketing recommender interfaces, they are unable to utilize user aesthetic preference information to improve the quality of mobile market recommendations. In this paper, we propose a novel mobile marketing recommendation method that incorporates user aesthetic preference for layout. The method is based on traditional collaborative filtering and content-based marketing recommendation methods. We introduce user preference for interface layout from an aesthetic perspective into mobile marketing recommendations. We build a new quantification method for mobile marketing interface layout design, a similarity measurement model for user aesthetic preference for interface layout, and a method for rearranging recommendation results from an aesthetic perspective. The proposed mobile marketing recommendation method that incorporates the aesthetic preferences for interface layout, which is capable of making use of the layout characteristics of the design of the mobile marketing recommender interface and the aesthetic preferences of the user for the interface layout, provides new ideas for improving the quality of mobile marketing recommendations, thus, promoting the sustainable development of m-commerce.

2. Literature Review

The literature review focuses on the following aspects: mobile marketing recommendation methods, layout design and quantification, aesthetic preference and its affecting factors.

2.1. Mobile Marketing Recommendation Methods

The traditional mobile marketing recommendation methods mainly use the properties of user-profiles and recommend contents by using various similarity matching methods that match contents and users [21,22,23]. TOP-N and rating are two main recommendation tasks to present recommendation results [24,25]. According to the different ways of utilizing data, these methods can be classified into four categories: content-based methods, collaborative filtering methods, context-based methods, and knowledge-based methods [1,26]. Content-based methods make recommendations by exploiting user interest data for products and content (such as rating, comments, and other descriptive information) [27]. For this type of method, the items recommended to a user are highly compatible with the user’s interests. User interest data is easy to obtain, especially in a mobile social network environment where users issue a large number of ratings, tags, comments, etc. Variants of these methods emerge depending on the way of exploiting user interest data [28,29]. Aside from the convenience of obtaining user interest data, the core technology to produce high-quality recommendations by the content-based method is similarity calculation, which makes modeling data to describe item similarities of key importance. Collaborative filtering methods, which can benefit from collective wisdom, make use of interest data of users with similar interests to perform recommendations, they can be classified into three categories: user-based, project-based, and hybrid collaborative filtering [30,31]. They are widely used, but if there is a shortage of historical records of users and their interests, these methods will suffer from severe data sparsity and cold start problems [32]. Furthermore, similarity calculation is also an important factor affecting the effectiveness of the methods [33,34]. Context-based methods provide contextual information for recommendations [35,36]. For example, the method proposed by Dao et al. uses geographic location information to make recommendations in the mobile marketing environment [37]. Contextual information includes but is not limited to geographic location [38], social information [39], time information [40], behavioral data [41], emotional state [42], etc., and can cause complex measurement problems, which seriously degrade the effectiveness of the recommendation system. Knowledge-based methods have a narrow application area and are mainly used in recommendation scenarios that require professional domain knowledge. The method proposed by Carrer et al., can only be applied to movie recommendations [43]. Some knowledge-based recommendation methods are only capable of working in the area of online teaching [44,45]. Of all the methods mentioned above, collaborative filtering methods are the most widely used [32,46]. User similarity calculation is an important technique for collaborative filtering methods. Traditional techniques, including the Cosine similarity model [47], Jaccard similarity model [48], and HP (Hub Promoted) model [49], are widely used. Another widely used technique is the number of common neighbors between users, which considers the more common neighbor friends between users, the higher the similarity between them [50]. The recent development of user similarity calculation studies turns to social network analysis techniques for help. In the study of Krishnamurthy et al., they classified Twitter users into three categories by focusing on the relationships within which they were inter-followed and built a network topology based on the relationships to calculate user similarity [51].

2.2. Layout Design and Quantification

In the practice of mobile marketing recommendation, the interface serves as a median for users to interact with the system. Interface design is optimized for information communication [52], and different designs result in a different optimization of the information communication process, which certainly influences the evaluation of the quality of mobile marketing recommendations. Much has been done to optimize the functionality and usability of interface designs of mobile marketing recommenders from a user experience perspective [53]. As a result, many design principles have been proposed [54]. However, researches in the field of marketing and management have found that the two factors of affection [55] and feeling [56] of consumers are strongly connected to the functionality and usability of the design of a user interface. Users cannot directly perceive the hidden elements in interface design without interpreting them through the perception of explicit elements. User interpretation of the hidden elements in interface design is subjective [57,58]. As for the layout of a user interface, it is an explicit element of interface design, and the interaction hints and information structures it brings are the hidden elements. To deliver a better user experience, the layout design of the interface should match the user’s preference [59]. The researches of users’ aesthetic preferences and interface layout design mainly adopts two methods of behavioral experiments and modeling. Research using behavioral experimental methods, such as eye-tracking experiments [60,61], can provide suggestions for improving the visual design of the interface and clues for the visual aesthetic preference of users. However, the interpretation of the experimental results can be hard to apply to the recommendation process. The modeling method, on the other hand, regards interface design as an electronic art [62] and builds models [63] from an aesthetic perspective to provide quantitative approaches to measure the layout design of interfaces. As a result, many studies have shown that visual aesthetic design plays an important role in shaping the overall user experience of interactive systems [62,64]. The aesthetic design of the interface layout can be depicted by the attributes of the layout [65,66]. The main layout attributes used in existing researches are balance, equilibrium, symmetry, density, and simplicity [65,67]. Balance refers to the difference between the total amount of all elements on both sides of the horizontal and vertical symmetry axes. Equilibrium degree is the difference between the center of the visual element displayed on the interface and the physical center of the interface; symmetry denotes the degree of symmetry of elements in the three directions of vertical, horizontal, and diagonal. Density refers to the tightness of the elements contained in the interface. Simplicity refers to the alignment of elements and the degree of element combination.

2.3. Aesthetic Preference and Its Affecting Factors

User aesthetic preference suggests that user appreciation of a user interface is significantly influenced by the visual design characteristics of the interface, which in turn affects the effectiveness and quality of marketing recommendations. Studies concerning the factors that affect human aesthetic preferences focus mainly on human aesthetic sensitivity [68]. The Visual Aesthetic Sensitivity Test Toolbox (VAST) was developed to aid the studies of aesthetic sensitivity and aesthetic preferences [69]. The study of Frois, J. P. et al., taken from the perspective of visual aesthetic sensitivity, showed that aesthetic preference is correlated to age, gender, personality level, intelligence, and education. The study by Myszkowski and others suggested that the user’s visual aesthetic preference for the interface is affected by three factors: intelligence, aesthetic personality, and creative thinking [70]. Intelligence depends on the promotion of cognition [71,72], and cognition often develops with education [73]; thus, education is the main factor affecting intelligence. Aesthetic personality and aesthetic openness are intertwined [74,75], and the factors that influence aesthetic openness are gender, age, and region [76]. The most important factor that influences creative thinking is the ability of divergent thinking [77]. Quantitative research shows that the richness of knowledge is an important factor of divergent thinking [78], which is affected by discipline backgrounds and personal interests.

3. Modeling

Traditional mobile marketing recommendation methods are not able to make use of aesthetic preference data, which is valuable in providing users with more effective recommendations that match user interests and are delivered in interfaces with layout designs the user likes. In this paper, we propose a mobile marketing content recommendation method that incorporates layout aesthetic preferences. The method is mainly divided into three phases, phase I and phase II should run simultaneously:
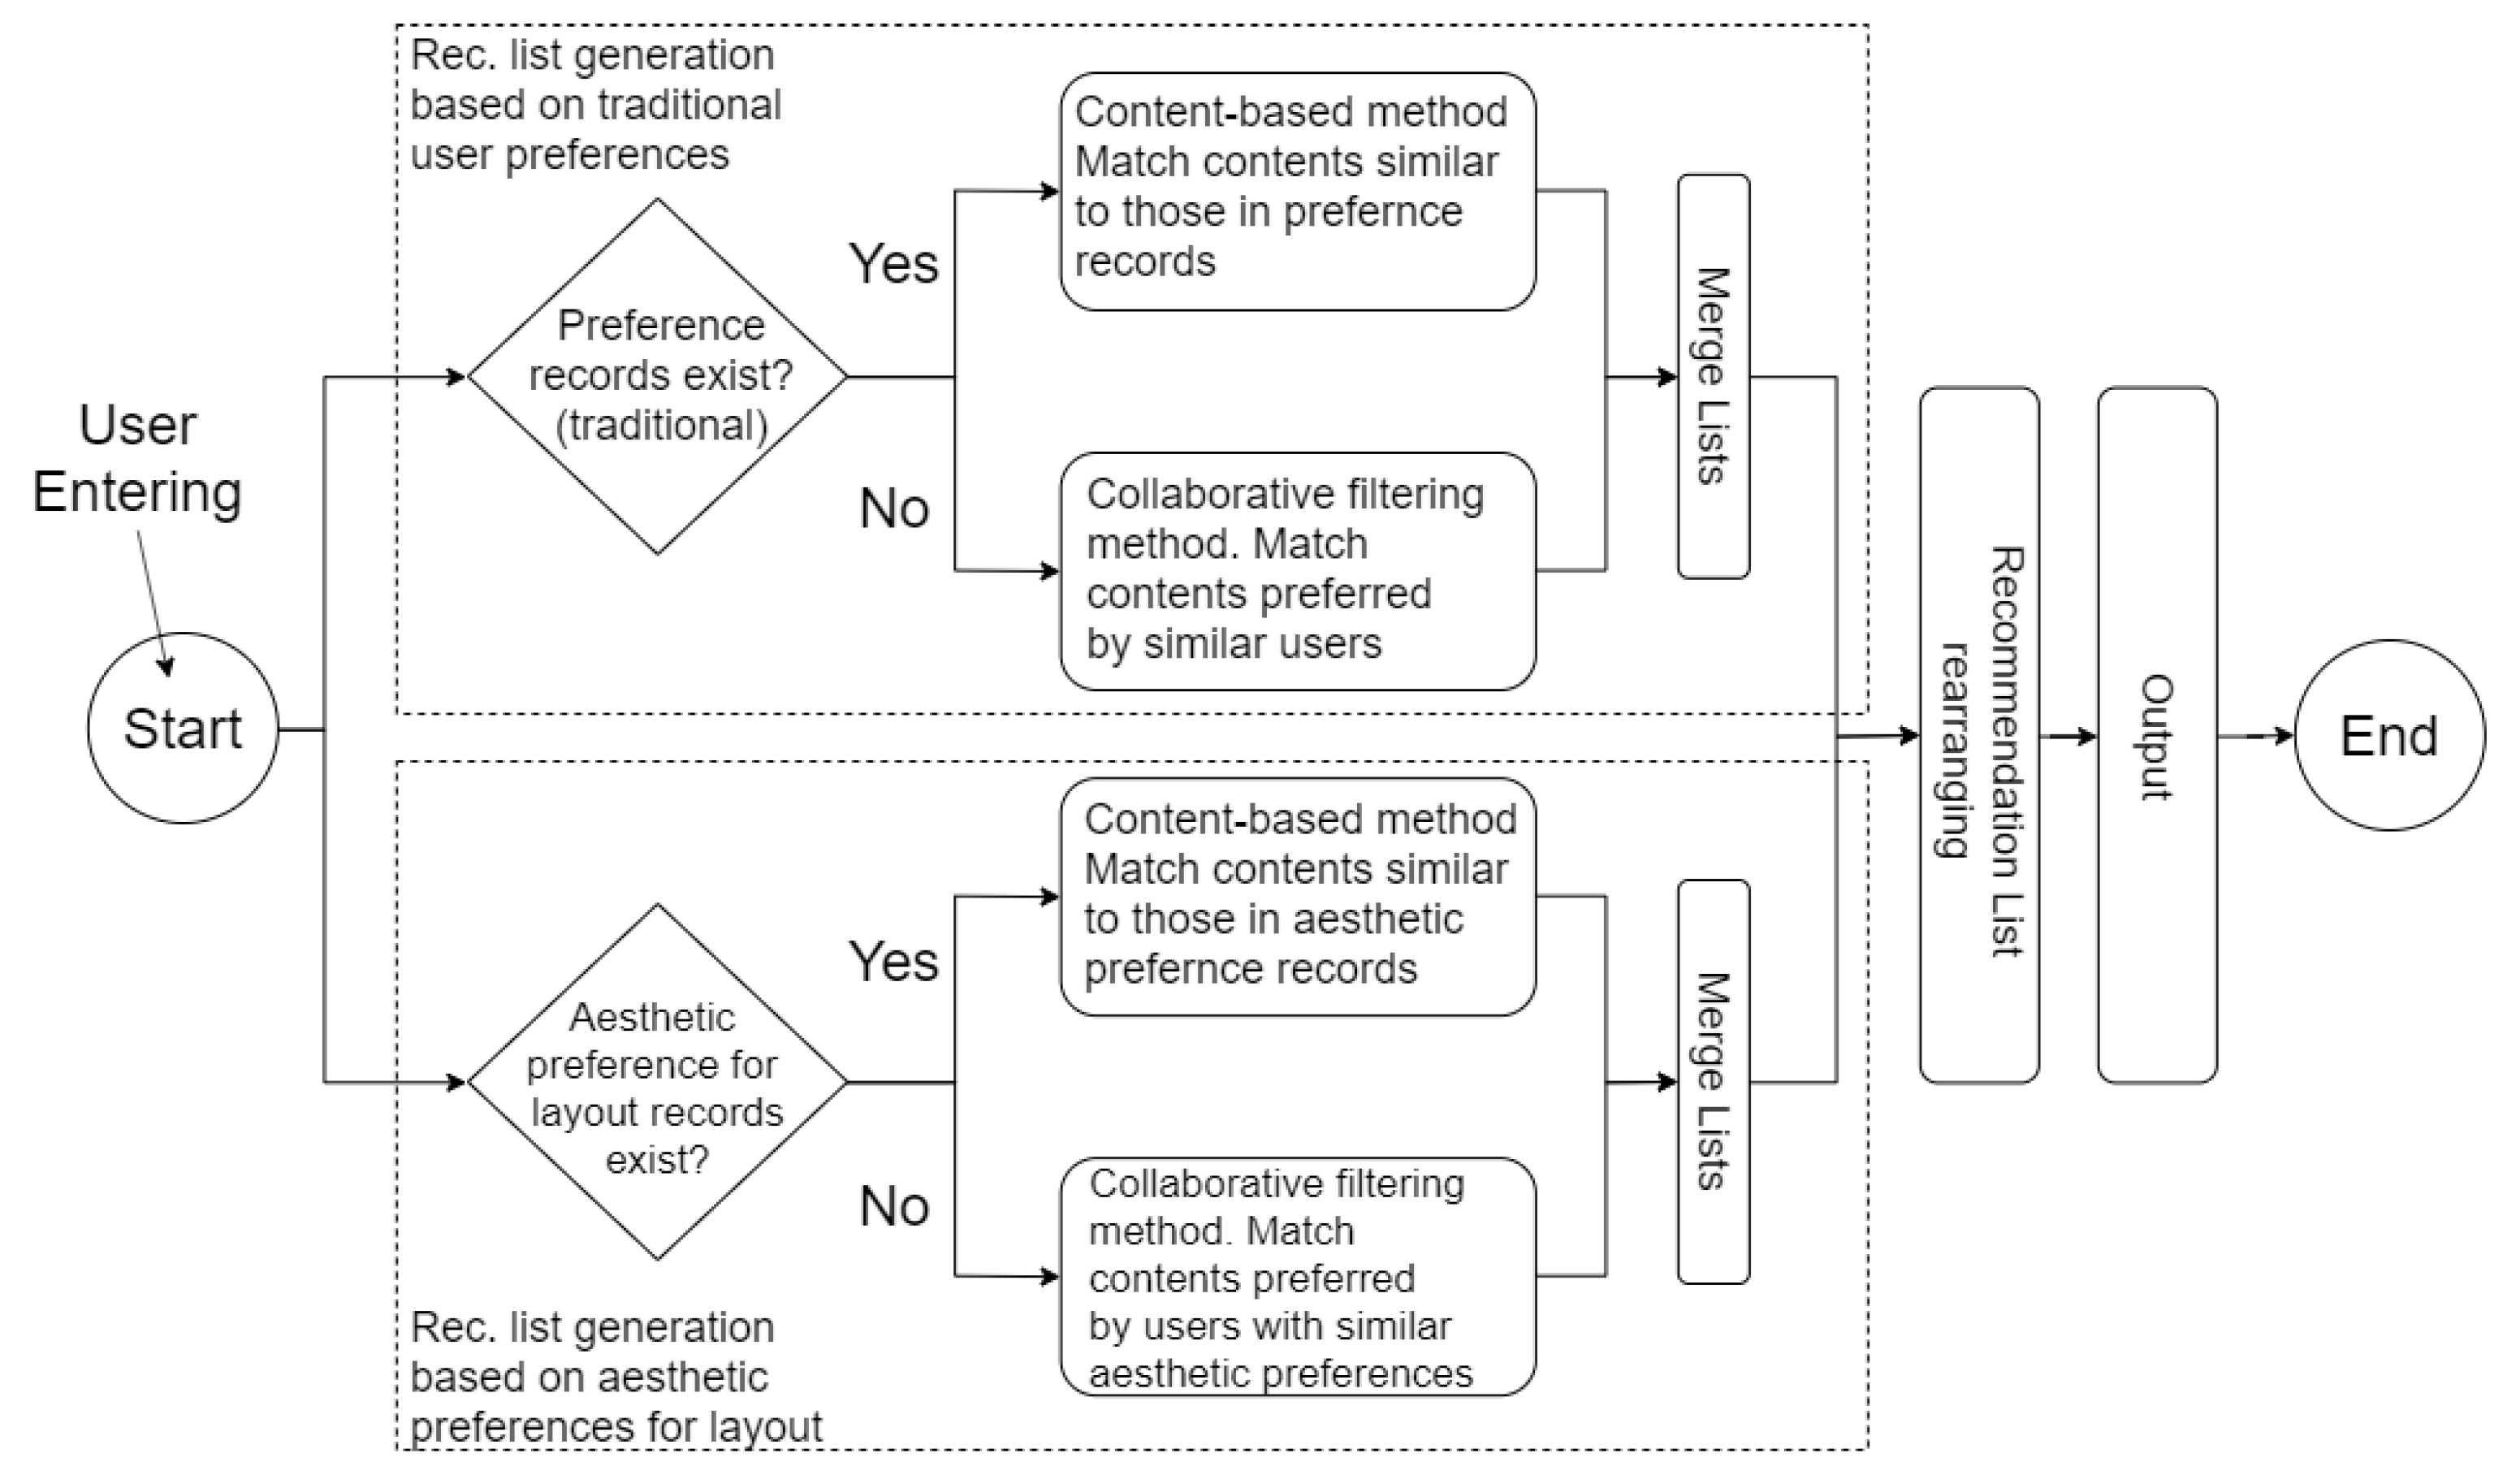
  • Phase I, Recommendation list generation based on traditional user interests. Use existing content-based and collaborative-filtering methods, to generate a recommendation list. The process requires information about traditional user preferences. Traditional user preferences do not contain the information of user aesthetic preferences for interface layouts. Therefore, in this phase, the same data used by existing recommendation methods are used to generate a recommendation list.
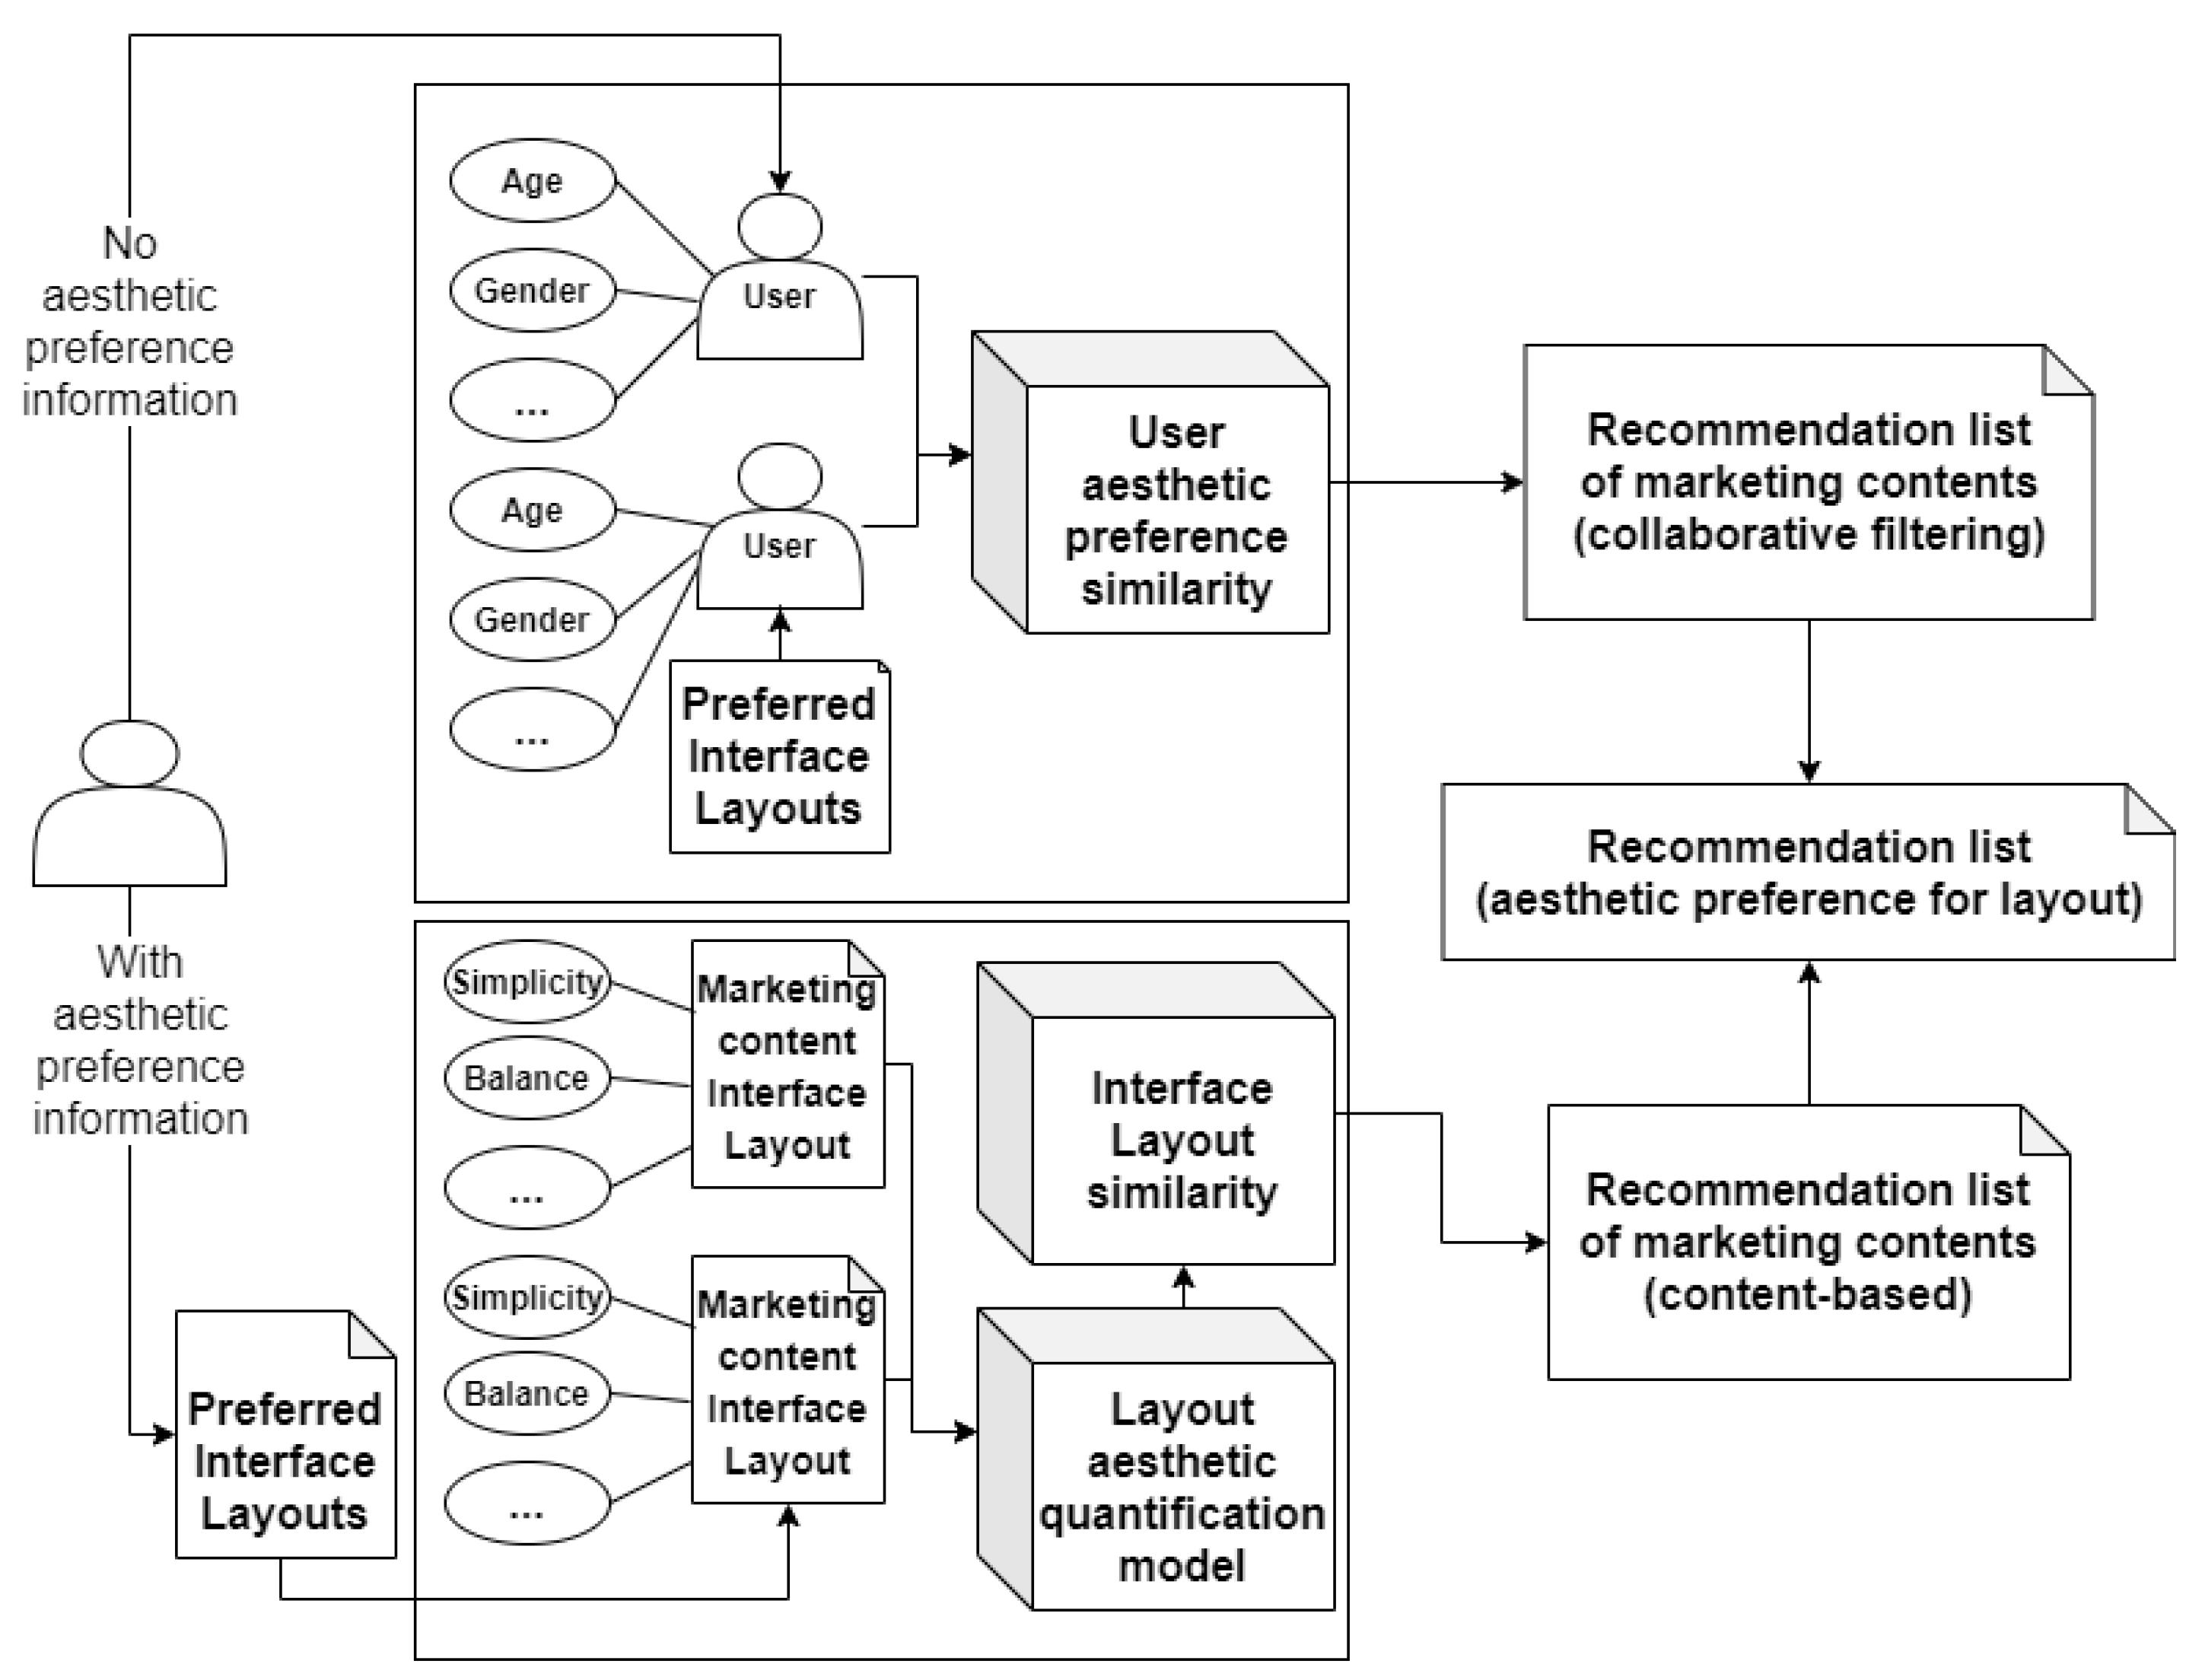
  • Phase II, Recommendation list generation based on aesthetic preference for layout. User aesthetic preferences for layout are used to generate a list of marketing recommendations. By using the layout aesthetic quantification method and aesthetic preference similarity method, we calculate similarities between layout designs and the layout aesthetic preferences between users, respectively. Modified content-based and collaborative-filtering methods are combined to generate a recommendation list based on layout aesthetic preference.
  • Phase III, Recommendation list rearranging. The recommendation lists generated in the previous two stages are merged and sorted. The sorted recommendation list is output as the recommendation result. The recommended model framework of the method is shown in Figure 1.

3.1. Recommendation List Generation Based on Traditional User Interests

Existing marketing recommendation methods are designed for personalized marketing content recommendation; they usually take different attribute sets from both the users and marketing contents to model users and marketing contents separately. Let u i denote a user, o u j i denote the jth attribute of the profile of u i , O U i = { o u 1 i , o u 2 i , , o u m i } then represent the m dimensional attribute vector of the profile of u i . Let c k denote the kth marketing content, the n dimensional attribute vector of c k is represented by O C k = { o c 1 k , o c 2 k , , o c n k } . The recommendation list L i s t u i c , which is generated based on traditional user interests of u i is as follows:
L i s t u i c = c t | S i m g c ( c t , c l ) T H g c c u | c u O C u j , S i m g u ( u i , u j ) T H g u
In the equation above, O C u i holds the preference records of u i , C is the set of all marketing contents, U is the set of all users in the recommendation system, the conditions c t , c l , c u C , c l O C u j , u i , u j U , O C u i , O C u j C are satisfied. We describe the recommendation list generation process as follows:
  • Initialize the recommendation list with contents to satisfy traditional user interests L i s t u i c and set it to ∅.
  • If a preference records exist for u i , a content-based method is adopted. Let O C u i hold the preference records of u i , as c l O C u i , O C l is the attribute vector of c l , for a marketing content c t , O C t is the attribute vector of c t . If S i m g c ( O C t , O C l ) T H g c , then put c t into L i s t u i c , S i m g c ( O C t , O C l ) is the similarity of c t and c l , T H g c is the threshold marketing content similarity.
  • If there are no existing preference records for u i , a collaborative-filtering method is adopted. Pick a user u j from U, whose preference records exist in the system. For users u i and u j , O U i and O U j are the profile attribute vectors of u i and u j , respectively, S i m g u ( O U i , O U j ) represents the similarity of u i and u j . If S i m g u ( O U i , O U j ) T H g u , then put the items in u j ’s preferred list to L i s t u i c , T H g u is the user similarity threshold.
  • Returns L i s t u i c
The main focus of this paper is to exploit the way of incorporating layout aesthetic preference to the recommendation process and verify the effectiveness, the similarity calculation S i m g c ( O C t , O C l ) , S i m g u ( O U i , O U j ) in the content-based and collaborative-filtering method adopted in this article have been extensively studied [47,48,50,79,80,81,82] and will not be discussed further in detail in this article.

3.2. Recommendation List Generation Based on Aesthetic Preference For Layout

Aesthetic preference for different interface layout designs varies from user to user. To quantitatively represent the differences in interface layout design from an aesthetic perspective, and make layout information of marketing content computable in the recommendation method, we learn from the layout attribute quantification methods proposed by former researchers from an aesthetic perspective [65,66,67] to build our quantification method. The method we propose can be used to measure the aesthetic similarity of the layout of marketing contents interfaces. The aesthetic preference for layout reflects the differentiated preference for layout design of interfaces. It is affected by many factors. In this paper, we identify and select 8 of these factors and design a method for calculating the similarity of user aesthetic preference. The two methods are crucial at this phase of generating recommendation lists based on layout aesthetic preferences. In the phase of recommendation list generation based aesthetic preference for layout, we build a model for quantifying interface layout from an aesthetic perspective and a model, which helps distinguish the aesthetic preferences of users. Similarity measurement methods are developed to perform collaborative-filtering and content-based filtering methods according to existing preference information differences of a user. The structure and procedure of this phase is depicted in Figure 2.

3.2.1. The Quantitative Method for Layout Design of Mobile Marketing Content Interface

We selected 5 of the layout attributes to design the quantitative method for the layout design of a mobile marketing content interface. According to researches [65,66,67], the 5 attributes we picked are: balance, equilibrium, symmetry, density, and simplicity. For an interface of mobile marketing content, let n denote the number of total elements in the interface, let ( D b a l ) , ( D e q u ) , ( D s y m ) , ( D d e n ) , and ( D s i m ) denote the quantified values of the 5 attributes, respectively, we have:
D b a l = 1 z l z r m a x ( | z l | , | z r | ) + z s z x m a x ( | z s | , | z x | ) / 2 D e q u = 1 2 i n a i ( x i x c ) w f i n a i + 2 i n a i ( y i y c ) m a x ( h f i n a i ) / 2 D s y m = 1 | S v | + | S h | + | S r | 3 D i n t = 1 2 0 . 5 i n a i a f D s i m = 1 ( n v + n h ) / 4 n
In the equations above, z l , z r , z u , z b are calculated as follows, where l , r , u , b correspond to the left, right, up, and bottom part of the interface divided by the horizontal and vertical center line of the interface:
z j = i n j a i j d i j , j = l , r , u , b
a i j is the area of the ith element in part j, d i j is the distance between the center line of the ith element to the center line (vertical for left and right parts, horizontal for up and bottom parts) of the interface, n j is the number of elements in part j.
We made a coordinate system for the quantification of the layout design. It uses the upper left vertex of the interface as the origin. The x and y axes extend to the right and bottom, respectively. ( x i , y i ) and ( x c , y c ) denote the position of the center of the ith element and the position of the center of the interface in the coordinate system, respectively.
n v and n h denote the number of alignment points in the vertical and horizontal directions, respectively. a i and a f denote the areas of element i and the interface. w f is the width while h f is the height of the interface. S v , S h , S r are the vertical, horizontal, and radical symmetry of the interface, the formula of these variables can be seen from the study of NGO D C L et al. [83]; they are too complicated to be listed here.
We selected the above five attributes of layout design from the perspective of aesthetics and established an aesthetically-oriented quantitative vector of interface layout attributes V E , and it is expressed as: V E = [ D b a l , D e q u , D s y m , D d e n , D s i m ] .
Layout similarity measurement is processed by calculating distances or similarities of V E s. Since V E is a vector represented by a numerical value, which is the same as the case where the text similarity is described by the text feature vector in NLP [84], cosine similarity calculation can be used to do the job [47].

3.2.2. User Similarity Measurement Based on Influencing Factors of Layout Aesthetic Preference

We established the attribute vector of aesthetic preference for layout by identifying and selecting factors that influence a user’s aesthetic preference. First, 5 coarse factors of gender, age, region, education, and discipline are chosen, according to the literature [70,71,72,73,74,75,76,77,78]. To facilitate the acquisition of user data from social networks, and use discrete values to enrich the description of relevant factors, we make use of social networks and mobile marketing environment, added age tags (such as the 80s and 90s), interest tags (e.g., basketball, video games). As the region is a relatively vague factor, according to the research of Wu [85], we divided the region into two parts, the administrative region, and the social-cultural region. The social-cultural region in the context of the Chinese territory can be divided into 2 social-cultural main districts, 8 social-cultural districts, and 16 social-cultural sub-districts. Therefore, the similarity of the user’s aesthetic preferences for the interface layout can be expressed as the similarity of the user in the attribute vector consists of by gender, age, administrative region, social-cultural region, education, discipline, age tags, and interest tags.
However, due to the different characteristics of each attribute, they are different in dimensions and values. Take gender as an example, as a factor it has only two levels, but it is a very important factor in user preference [86]. The influence of age on preferences is also very large, and we cannot simply do a minus operation on two numbers to compare the similarity of users in ages [84]. Age tags and interest tags reveal preference information of a user from a social network perspective, and they are different from traditional numerical or categorical data. People from different regions have different living environments, humanities, and customs. The region a user works and lives in and the region a user was born and raised from both have profound influences on the user’s preferences. According to the above discussion, the similarity of user aesthetic preference should be calculated by factors in the attribute vector separately, and the calculation method of each attribute should be designed separately.
For u i , O F i = { o f j i , j = 1 . . . 8 } is the attribute vector of factors influencing user aesthetic preference. f e 1 , f e 2 , . . . , f e 8 are the values of gender, age, administrative region, social-cultural region, education, discipline, age tags, and interest tags of u i , respectively. We define the similarity of gender for u a and u b as follows, while o f 1 i has two levels: 0 for female, 1 for male:
S i m s 1 ( u a , u b ) = 0 , o f 1 a o f 1 b 1 , o f 1 a = o f 1 b
The similarity of age is defined as follows, while | o f 2 a o f 2 b | denotes the difference of ages between u a and u b , m a x ( o f 2 a o f 2 b ) is the larger one in o f 2 a and o f 2 b :
S i m s 2 ( u a , u b ) = 1 | o f 2 a o f 2 b | m a x ( o f 2 a o f 2 b )
For u a and u b , o f 3 a = { t a g 1 , t a g 2 , , t a g j } and o f 3 b = { t a g 1 , t a g 2 , , t a g k } denotes the collection of age tags of u a and u b , respectively. S T a g a , b a g e is the number of common tags between o f 3 a and o f 3 b , n is the number of total tags, the similarity of age tag is defined as follows:
S i m s 3 ( u a , u b ) = S T a g a , b a g e n
The administrative region can be represented by different levels, for example, an administrative region can be represented as country, state, city, street, building, etc. In China, the administrative region can be described with a 5-level vector, let o f 4 a = { l o i a | i = 1 , 2 , , 5 } denote the vector of administrative region of u a , l ( i ) is a function of i, the similarity of administrative region is defined as follows:
S i m s 4 ( u a , u b ) = 2 l ( i ) 1 31 , l ( i ) = i , l o i a = l o i b l ( i 1 ) , l o i a l o i b 0 , l o 1 a l o 1 b , i = 5 , 4 , 3 , 2 , 1
Let o f 5 a = { c u l i a | i = 1 , 2 , 3 } denote the set of values (social-cultural main region, region, and sub-region) for u a ’s social-cultural region attribute, c ( i ) is a function of i, and the similarity of the social-cultural region is defined as follows:
S i m s 5 ( u a , u b ) = 2 c ( i ) 1 7 , t ( i ) = i , l o i a = l o i b c ( i 1 ) , l o i a l o i b 0 , l o 1 a l o 1 b , i = 3 , 2 , 1
In the context of the Chinese education system, education can be divided into 6 levels from compulsory education through PhD, and there are 13 different disciplines. Let o f 6 a = i , i { 1 , 2 , , m } denote the education of u a , o f 7 a = e b a denote the discipline of u a , e b a { e b i | i = 1 , 2 , , n } , m = 6 , and n = 13 . The similarity of education and discipline are defined as follows:
S i m s 6 ( u a , u b ) = 1 | o f 6 a o f 6 b | 6
S i m s 7 ( u a , u b ) = 0 , o f 7 a o f 7 b 1 , o f 7 a = o f 7 b
Let o f 8 a = { i t a g 1 , i t a g 2 , , i t a g j } and o f 8 b = { i t a g 1 , i t a g 2 , , i t a g k } denote the collection of interest tag of u a and u b , respectively, S T a g a , b i n t is the number of common tags of o f 8 a and o f 8 b , n is the number of total interest tags, the similarity of interest tag is defined as follows:
S i m s 8 ( u a , u b ) = S T a g a , b i n t n

3.2.3. Comprehensive Similarity Model of Attributes Based on Independence Weight

The overall similarity of user aesthetic preference for interface layout is composed of all the attribute similarities ( S i m s i , i = 1 , 2 , , 8 ) in the attribute vector of factors influencing user aesthetic preference. Let ω i , i = 1 , 2 , , 8 denote the weight of the 8 attribute similarities, respectively, the overall similarity of user aesthetic preference for interface layout is then:
S i m s ( u a , u b ) = i = 1 8 S i m s i ( u a , u b ) × ω i
There are 8 user attributes in the vector, each with a different impact on the overall similarity of user aesthetic preferences for layout. It is unreasonable to simply treat all attributes as equally important. In this paper, we use the independence weight method to identify the weights for the similarities of attributes. The weight for the similarity of an attribute is determined based on the collinearity between the similarity of one attribute and the similarity of other attributes between users. The greater the complex correlation coefficient R k of the similarity of one attribute S i m s k to the similarity of other attributes, the smaller the weight of the similarity of the attribute.
R k = ( S i m s k S i m s ¯ ) ( S i m s ^ S i m s ¯ ) ( S i m s k S i m s ¯ ) 2 ( S i m s ^ S i m s ¯ ) 2
In the above equation, S i m s ¯ = i = 1 m S i m s i m and X ^ s = β 0 ^ + β 1 ^ S i m s 1 + β 2 ^ S i m s 2 + . . . + β m ^ S i m s m . The independence weight method is very mature, and the process of calculating the weights is relatively complicated and is not a main concern of our work in this paper; thus, we will not discuss it further. The adjusted weights will be presented directly in the experiment section with the values of the thresholds, which are determined by model training.

3.2.4. The Process of Recommendation List Generation Based Aesthetic Preference for Layout

Let u i denote a user, p u j i denote the jth attribute of the vector of factors influencing user aesthetic preference of u i , P U i = { p u 1 i , p u 2 i , , p u m i } then represents the m dimensional attribute vector of the vector of factors influencing user aesthetic preference of u i . Let c k denote the kth marketing content, the n dimensional layout quantification attributes vector of c k is represented by P C k = { p c 1 k , p c 2 k , , p c n k } . The recommendation list L i s t u i l , which is generated based on aesthetic preference for the layout of u i , is as follows:
L i s t u i l = c q | S i m l c ( c q , c r ) T H l c c s | c s P C u j , S i m l u ( u i , u j ) T H l u
In the equation above, P C u i holds the aesthetic preference for the layout records of u i , C is the set of all marketing contents, U is the set of all users in the recommendation system, the conditions c q , c r , c s C , c r P C u i , u i , u j U , P C u i , P C u j C are satisfied. We describe the recommendation list generation process as follows:
  • Initialize the recommendation list with contents that satisfy aesthetic preference for the layout of u i ( L i s t u i l ) and set it to ∅.
  • If the aesthetic preference for layout records exist for u i , a content-based method is adopted. Let P C u i hold the preference records of u i , as c r P C u i , P C r is the layout quantification attributes vector of c l , for a marketing content c s , P C s is the layout quantification attributes vector of c s . If S i m l c ( P C r , P C s ) T H g l , then put c s into L i s t u i l , S i m l c ( P C r , P C s ) is the layout similarity of c r and c s , T H l c is the threshold of marketing content layout similarity.
  • If there are no existing aesthetic preferences for layout records for u i , a collaborative-filtering method is adopted. Pick a user u j from U whose aesthetic preference for layout records exist in the system. For users u i and u j , P U i and P U j are the attribute vectors of factors influencing aesthetic preference of u i and u j respectively, S i m l u ( P U i , P U j ) represents the aesthetic preference similarity of u i and u j . If S i m l u ( P U i , P U j ) T H l u , then put the items in u j ’s preferred list to L i s t u i l , T H l u is the user similarity threshold.
  • Returns L i s t u i l .
The similarity calculation S i m l c ( P C t , P C l ) , S i m l u ( P U i , P U j ) in the content-based and collaborative-filtering methods are described in previous sections; they are V S i m and S i m s , respectively.

3.3. Recommendation List Rearranging

In the previous section, two recommendation lists L i s t u i c and L i s t u i l were generated using traditional user interests and aesthetic preference for layout, respectively. The final recommendation result should satisfy both users’ needs for traditional interests and aesthetics preferences for layout. The rearrangement involves merging of the two recommendation lists, assigning main and auxiliary orders for items in a merged list, and sorting of the list, a typical process of the rearrangement is illustrated in Figure 3.
A detailed description is presented as follows. We denote the recommendation result of u s e r i as S e t ( L i s t u i ) , where S e t is the operator of making a list of unordered elements without duplication.
S e t ( L i s t u i ) = { c f | c f S e t ( L i s t u i c ) S e t ( L i s t u i l ) , f = 1 , 2 , , g }
The conditions of L e n ( S e t ( L i s t u i ) ) L e n ( S e t ( L i s t u i c ) ) and L e n ( S e t ( L i s t u i ) ) L e n ( S e t ( L i s t u i l ) ) are satisfied. The L e n operator gets the number of elements in a collection. The S e t ( L i s t u i ) should be sorted to form an ordered list to facilitate the TOP-N recommendation task. We believe that the aesthetic preference for layout is an auxiliary factor that assists decision-making when users are exposed to mobile marketing content recommendations. Therefore, item orders in the recommendation list generated with traditional user interests should be primary.
Main order: let the order of element c f from S e t ( L i s t u i ) be o c f m in the list generated based on traditional user interests, O m = A S C ( [ o c f m = i | c f = c i , c i L i s t u i c ] ) is the main order of the elements in S e t ( L i s t u i ) , A S C ( X ) is the operator to sort elements in ascending order.
Auxiliary order: let the order of element c f from S e t ( L i s t u i ) be o c f a in the list generated based on aesthetic preference for layout, O a = A S C ( [ o c f a = i | c f = c i , c i L i s t u i c ] ) is the auxiliary order of the elements in S e t ( L i s t u i ) .
Sorting: let D O ( X , Y ) be the distance of orders X and Y, D O ( X , Y ) = | X Y | , S O is the max distance between two adjacent elements in an order list. Set L i s t u i s to ∅, let S o r t ( S e t ( L i s t u i ) ) be the operator for sorting the recommendation list, the process is described as follows:
For elements in S e t ( L i s t u i ) , do the follow steps as h goes from the head of O m to the tail:
  • If D O ( O m [ h ] , O m [ h + 1 ] ) < S O , go to step (2), otherwise go to step (3);
  • Append the element with the order of O m [ h ] to L i s t u i s , set h = h + 1 , if h < L e n ( O m ) , go to step (1), otherwise return L i s t u i s and stop;
  • Get the auxiliary order of the elements with the orders of O m [ h ] and O m [ h + 1 ] , append the element with a smaller auxiliary order to L i s t u i s , the main order of the remaining element is set to O m [ h + 1 ] , set h = h + 1 , if h < L e n ( O m ) , go to step (1), else return L i s t u i s and stop.
The rearranged recommendation list is S o r t ( S e t ( L i s t u i ) ) L i s t u i s .

4. Experiment

From different perspectives, a variety of different methods to optimize the recommendation quality of mobile marketing content and mobile online advertising recommendations have been proposed. Among the various algorithms, the typical representatives are: User-Based Collaboration Filtering method (UB-CF) [87], Tag-Based method (TAGB) [88], Item-Tag Relationship-Based method (TAGIB) [89], and Collaboration Filtering based on Tag method (ADR-CFT) [90]. In this paper, we design experiments to compare our method with these typical representatives to verify whether incorporating aesthetic preferences for layout can improve the quality of recommendation results. Our method needs to combine attributes that affect user aesthetic preference for layouts, but none of the existing public data sets contain these contents, so we need to collect these data ourselves.

4.1. Experiment Design

The experiment will contain two phases to answer two questions: (1) whether the layout aesthetic preference information can influence users in adopting recommendation contents; (2) whether the recommendation method incorporating layout aesthetic preference information can improve the quality of recommendation results. For phase 1, we compare LAPR and other classic algorithms to see if there is a difference in accuracy in a typical TOP-10 recommendation task. The task is designed to have only one marketing content loaded in different layout interfaces, and we call it the single content task. For phase 2, we compare the accuracy, recall, and F-Measure between LAPR and other classic algorithms in conventional marketing recommendation tasks [91,92]. The data needed for the experiment is collected through a self-host form system (a tailored and modified version of an opensource system called Formtools) that provides basic web-based GUI for our data collection task. The system is also modified to host our recommendation results and connect user feedback to us. The process of the experiment is described as follows:
  • Subject preparation. We decide the number of our subjects to be 500, according to the size of subjects in Horowitz’s research on an event-related recommendation system (no public data set support). The subjects differ in gender, age, and location.
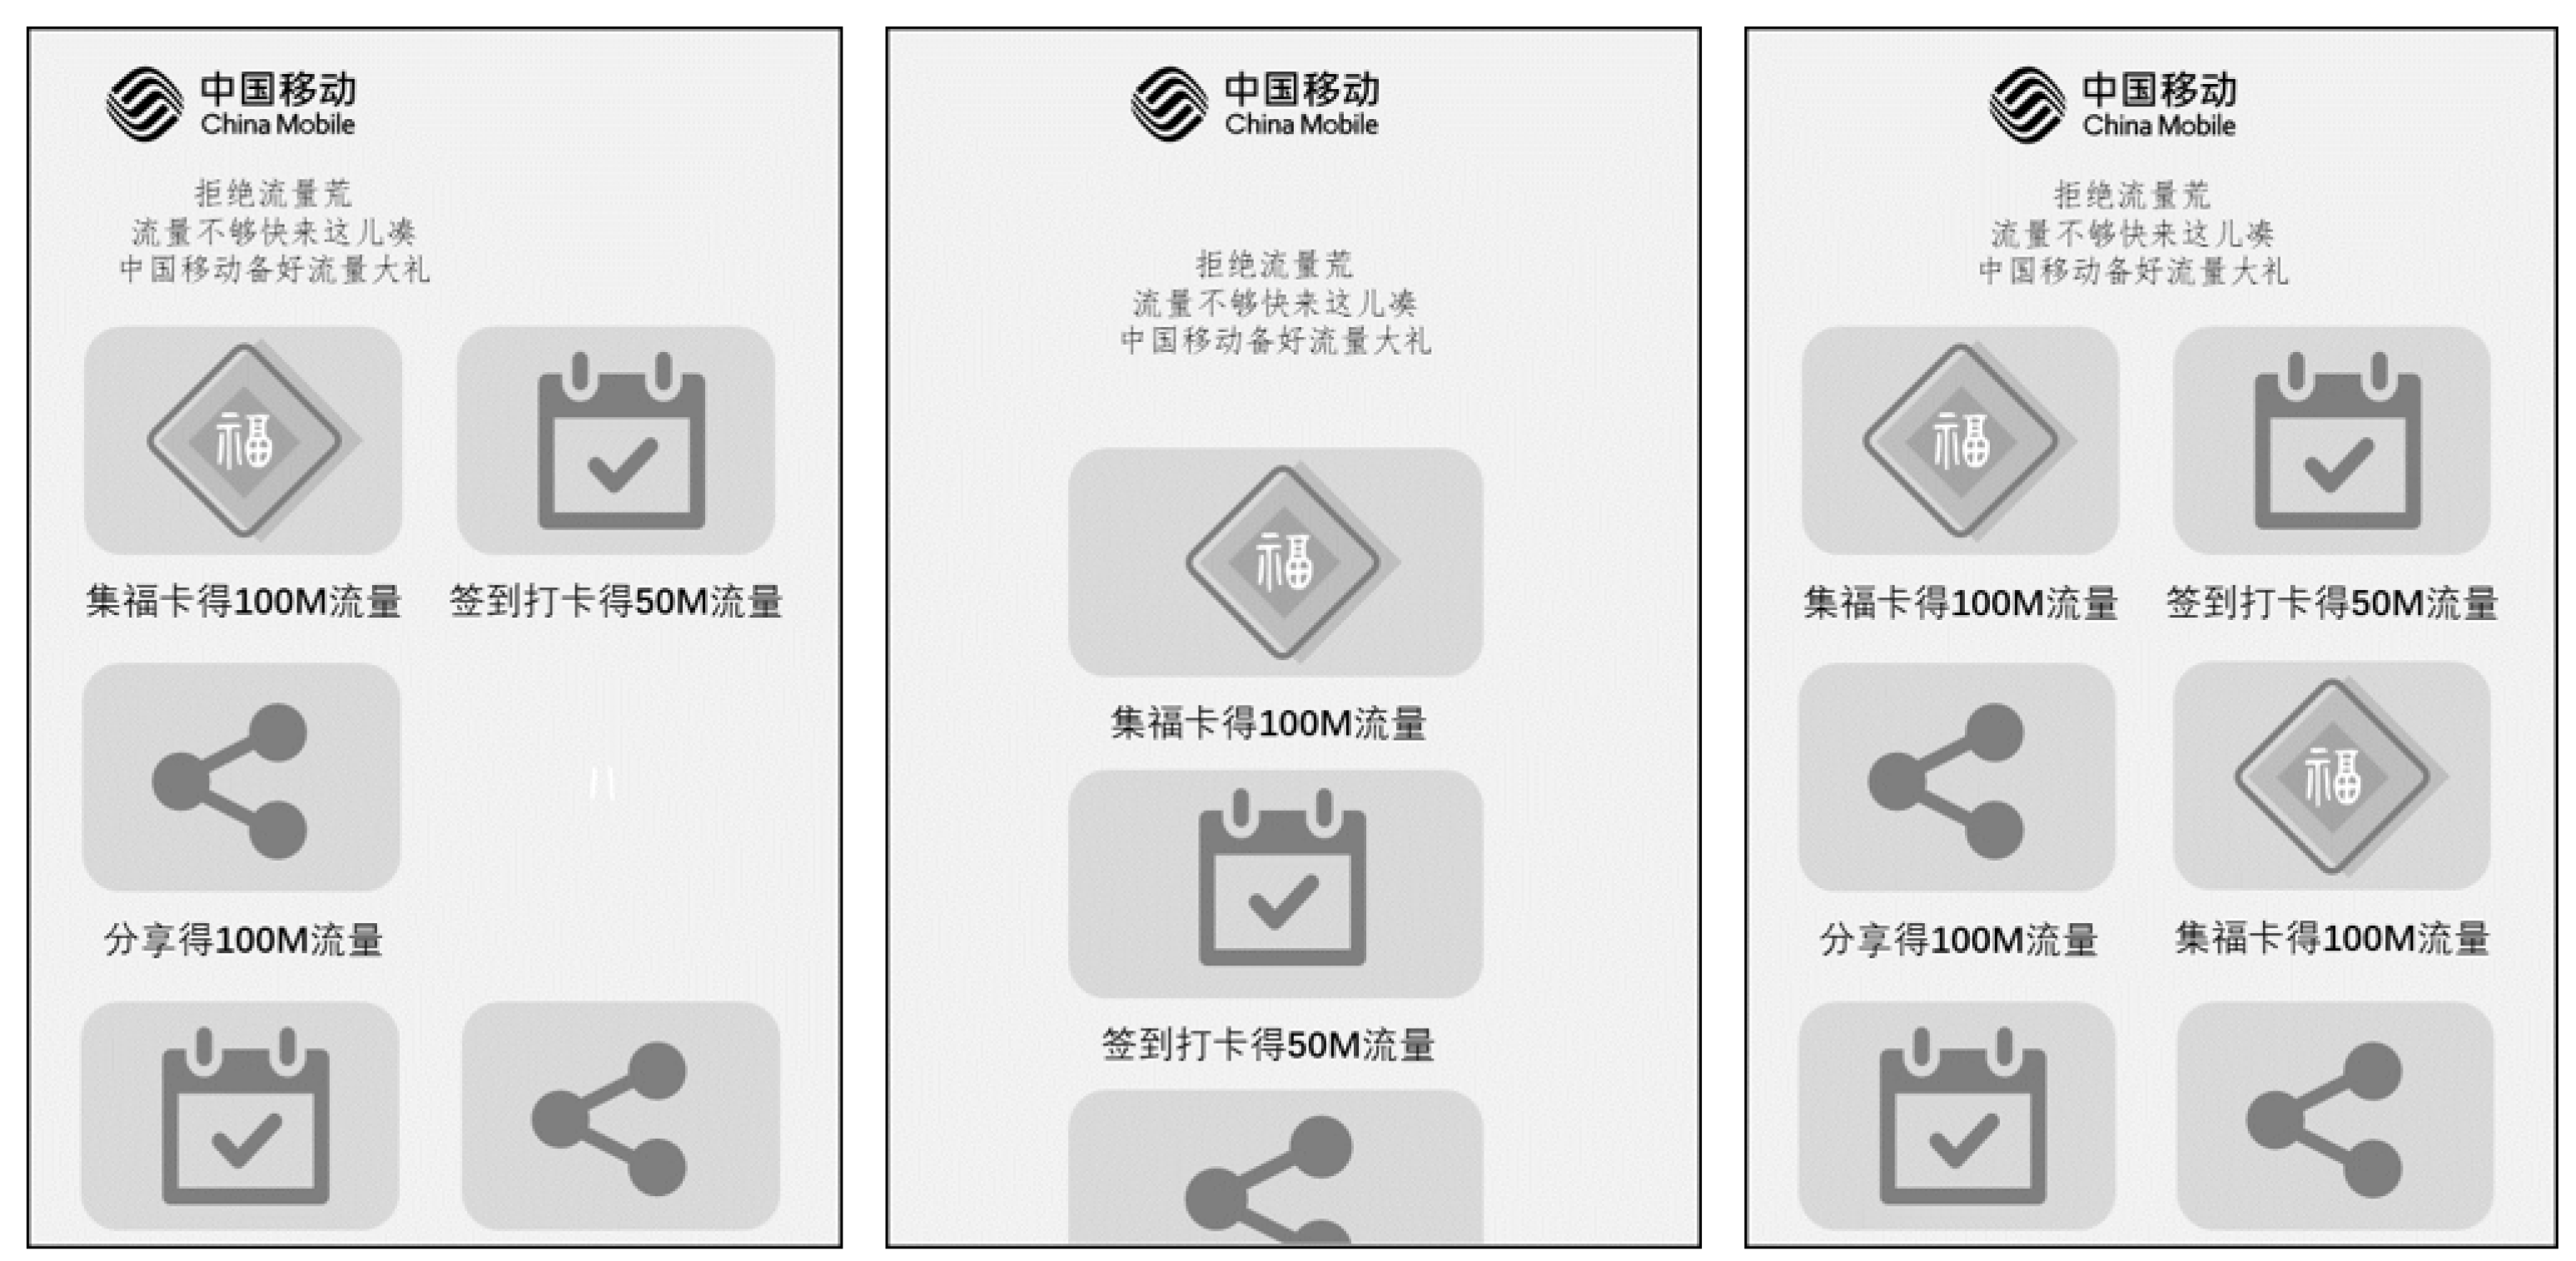
  • Experimental materials preparation. For a single content task, 30 images of interfaces of the same content with different layouts (differ in layout attributes) are designed, the images are grayed out to eliminate the impact of colors. A sample of the materials is shown in Figure 4. For conventional tasks, we collect data for both LAPR and the four classical methods. The data for different attributes used in these methods are collected from the subjects. Existing mobile marketing contents (together with their metadata extracted from the text content of the mobile marketing content) [93,94] are collected from the mobile Internet and store with their interfaces (as images) by the means of a web crawler. The images of the collected marketing contents are grayed out, and an image object detection algorithm is run to extract data used for layout quantification [95,96].
  • Training. A total of 200 subjects are selected to conduct several rounds of feedback operations. Use the prepared materials for the conventional task, feedback data (including users’ selections, clicks, and interactions to the materials) are collected. The data are then used in the training process to obtain the values of parameters.
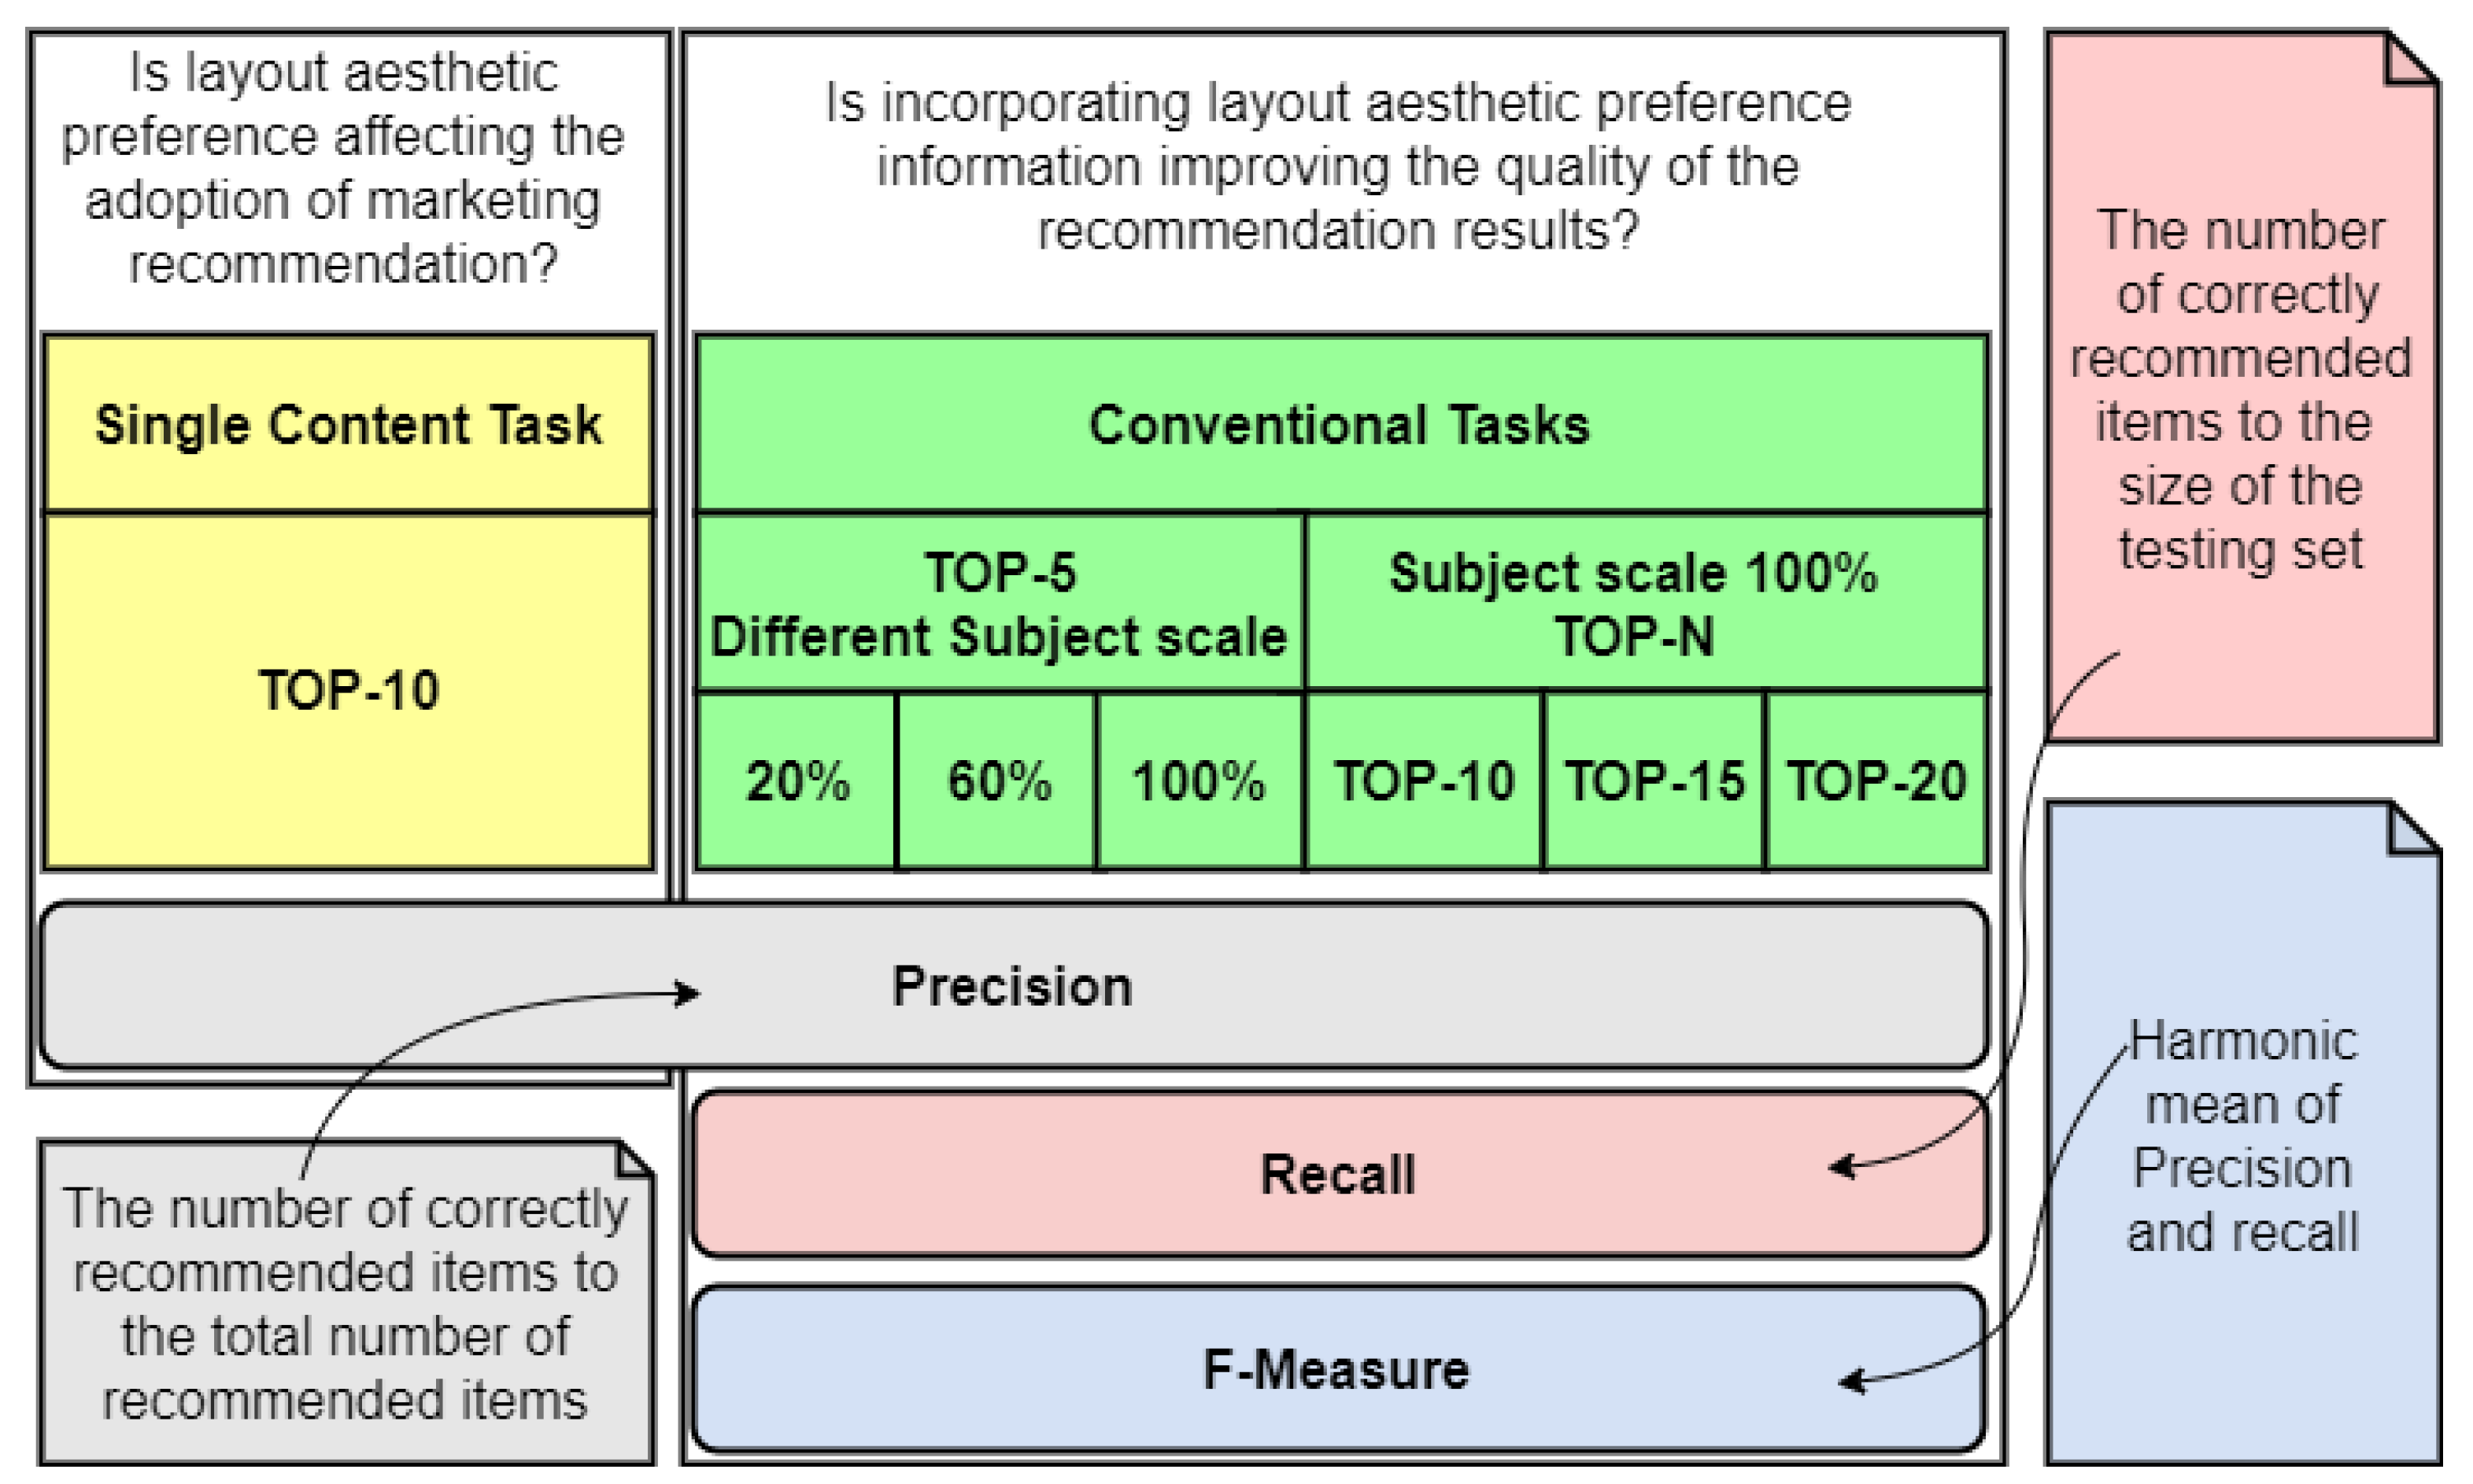
  • Phase 1. The marketing content of the single content task is an activity in which users can get a data traffic coupon from the ISP. A total of 200 subjects from the remaining 300 subjects attended this phase of our experiment. We chose them because they are the users of the same ISP (China Mobile) and have all been familiar with these kinds of activities recommended by the ISP’s marketing department. This ensures that the contents of the experimental materials have a neutral impact on user preferences. Feedback data of the subjects on the TOP-10 recommendation list generated by each method are collected.
  • Phase 2. We perform TOP-5 recommendation tasks for each algorithm on the subject scale of 20%, 60%, and 100% of the remaining 300 subjects, using conventional task materials. Another set of tasks run TOP-10, TOP-15, and TOP-20 recommendation tasks on the subject scale of 100% of the remaining 300 subjects. Feedback data of the subjects are collected for each of the methods under all the tasks in this phase.

4.2. Data Preprocessing

Most of the mobile marketing recommended content interfaces are brightly colored, while colors are rendered differently through devices. To avoid the impact brought by the differences in color rendering, we use an image batch processing tool called ImageMagick to gray out all the interface images we collected with our web crawler. A sample of the comparison of interfaces with colors and grayed out is shown in Figure 5. A total of 6000 images of mobile marketing content interfaces are collected. The data covers 18 product categories, shopping festivals, and marketing activities. Of them, 1042 are removed due to the loss of layout information in graying out the image, and 2387 of them are removed due to image object detection algorithm failure. The remaining 2571 samples are used in our experiment.
Some of the user-profile data of the subjects are collected with our modified system, others are collected with our web crawler. A manual data review of the data sets is conducted to ensure data integrity. The data used by the layout quantification method is extracted from the grayed images by running a trained model of image object detection algorithm. We will not discuss image processing algorithms in this paper, refer to studies like [95,96] for a detailed explanation.
To facilitate the training process of the four classical methods and the process of recommendation lists generation based on traditional user preferences in LAPR, we obtained the records of purchases, searches, favorites, and other activity data of the past year through the social network and e-commerce platforms of the subjects. A total of 7653 pieces of data related to the interaction on mobile social networks of our subjects to marketing contents (including reposts 3951, likes 2649, and comments 1053) were added to our data sets. Another 2747 search and browsing records and 3386 favorite records from m-commerce platforms were added to our data sets. And 149,639,105 data records related to Tencent search ads from KDDCUP were used to readjust the training process. Before the training stage, we made 60 recommendations to 200 subjects and collected 12,000 feedback data to train LAPR. In the formal experiment stage, recommendations on different subject scales were made 10 times, and 5400 pieces of data were collected. The ratio of the size of training to test sets was 7:3.
No training optimization trick is used in training the models in the methods used in our experiment. After training, the value of the parameters in LAPR are set as follows: T H g c takes 0.73, T H g u takes 0.68 T H l c takes 0.71, T H l u takes 0.65, and S O takes 2, ω 1 through ω 8 take 0.246, 0.205, 0.074, 0.041, 0.167, 0.136, 0.048, 0.083, respectively.

5. Results and Discussion

Because rating is not involved in any of the logics and experiment design processes of LAPR, TOP-N, the recommendation task, is a reasonable choice under this circumstance. We chose Recall, Precision, and F-Measure [91,92,97] to evaluate the quality of recommendation results generated by each recommendation method. The definitions of the three metrics and the different goals for which they are testing across different experiment tasks are listed in Figure 6.

5.1. Results and Discussion for the Single Content Task

Because of the design of the single content task, the recommendation process is equivalent to delivering a list of items with identical contents and different layouts to users, with the contents matching the traditional interests of the users. The result will reflect the qualities of recommendations with or without the utilization of information of aesthetic preference for layouts made by LAPR and the classic recommendation methods, respectively. Recommendation precision is measured to verify the quality difference. The results are as follows:
Table 1 shows the precisions of LAPR and four classical methods in a single content task (TOP-10). The comparison of these precisions is further illustrated in Figure 7.
The precision of LAPR (0.389) is much higher than other methods (mean 0.183, SD = 0.005) according to Table 1. It is a piece of strong evidence that the layout aesthetic preference information does pose influences to users in adopting recommendation contents, and the influence is positive. Comparison of precisions shown in Figure 7 indicates that the four classical methods almost share a similar precision. In addition, the precisions of the recommendation methods are much higher than those in other studies. One possible explanation for this situation is the design of the single content task filters information for all the recommendation methods, leaving little room for these methods to decide between items of different contents that satisfy different user interests from a traditional perspective. The selected content of the materials fits the subjects’ preferences in terms of traditional interests, which makes some of the subjects think that they should choose at least one item in the recommendation lists generated in the single content. Furthermore, the selected content of the materials of the single content task also contributes to this situation by making the content to be recommended neutral in emotional valence [98] and low in emotional arousal [99]. Therefore, the subjects did not show any excessive interest in the content in terms of traditional interests, which is a possible reason for the insignificance of the difference in precisions of the four classical methods. The slight difference in precisions may be caused by the default order of the data processing logic of the methods.
The higher precision of LAPR suggests the ability to utilize aesthetic preference for layout information contributes to a higher quality of recommendation result. LAPR adjusts the order of the recommendation list to satisfy the subjects’ aesthetic preferences for layout so that the subjects pick more items from the TOP-10 list generated by LAPR.

5.2. Results and Discussion for Conventional Tasks

To verify whether the recommendation method incorporating layout aesthetic preference information can improve the quality of recommendation results, we compared LAPR and the other four methods in the conventional marketing recommendation tasks, including (1) the qualities of the TOP-5 recommendation for each method on different subject scales (20%, 60%, and 100% of the total objects), (2) the qualities of the TOP-10, TOP-15, and TOP-20 recommendation for each method on the subject scale of 100%. These tasks also test whether the user number and the length of the recommendation list make any difference in the performance of LAPR.

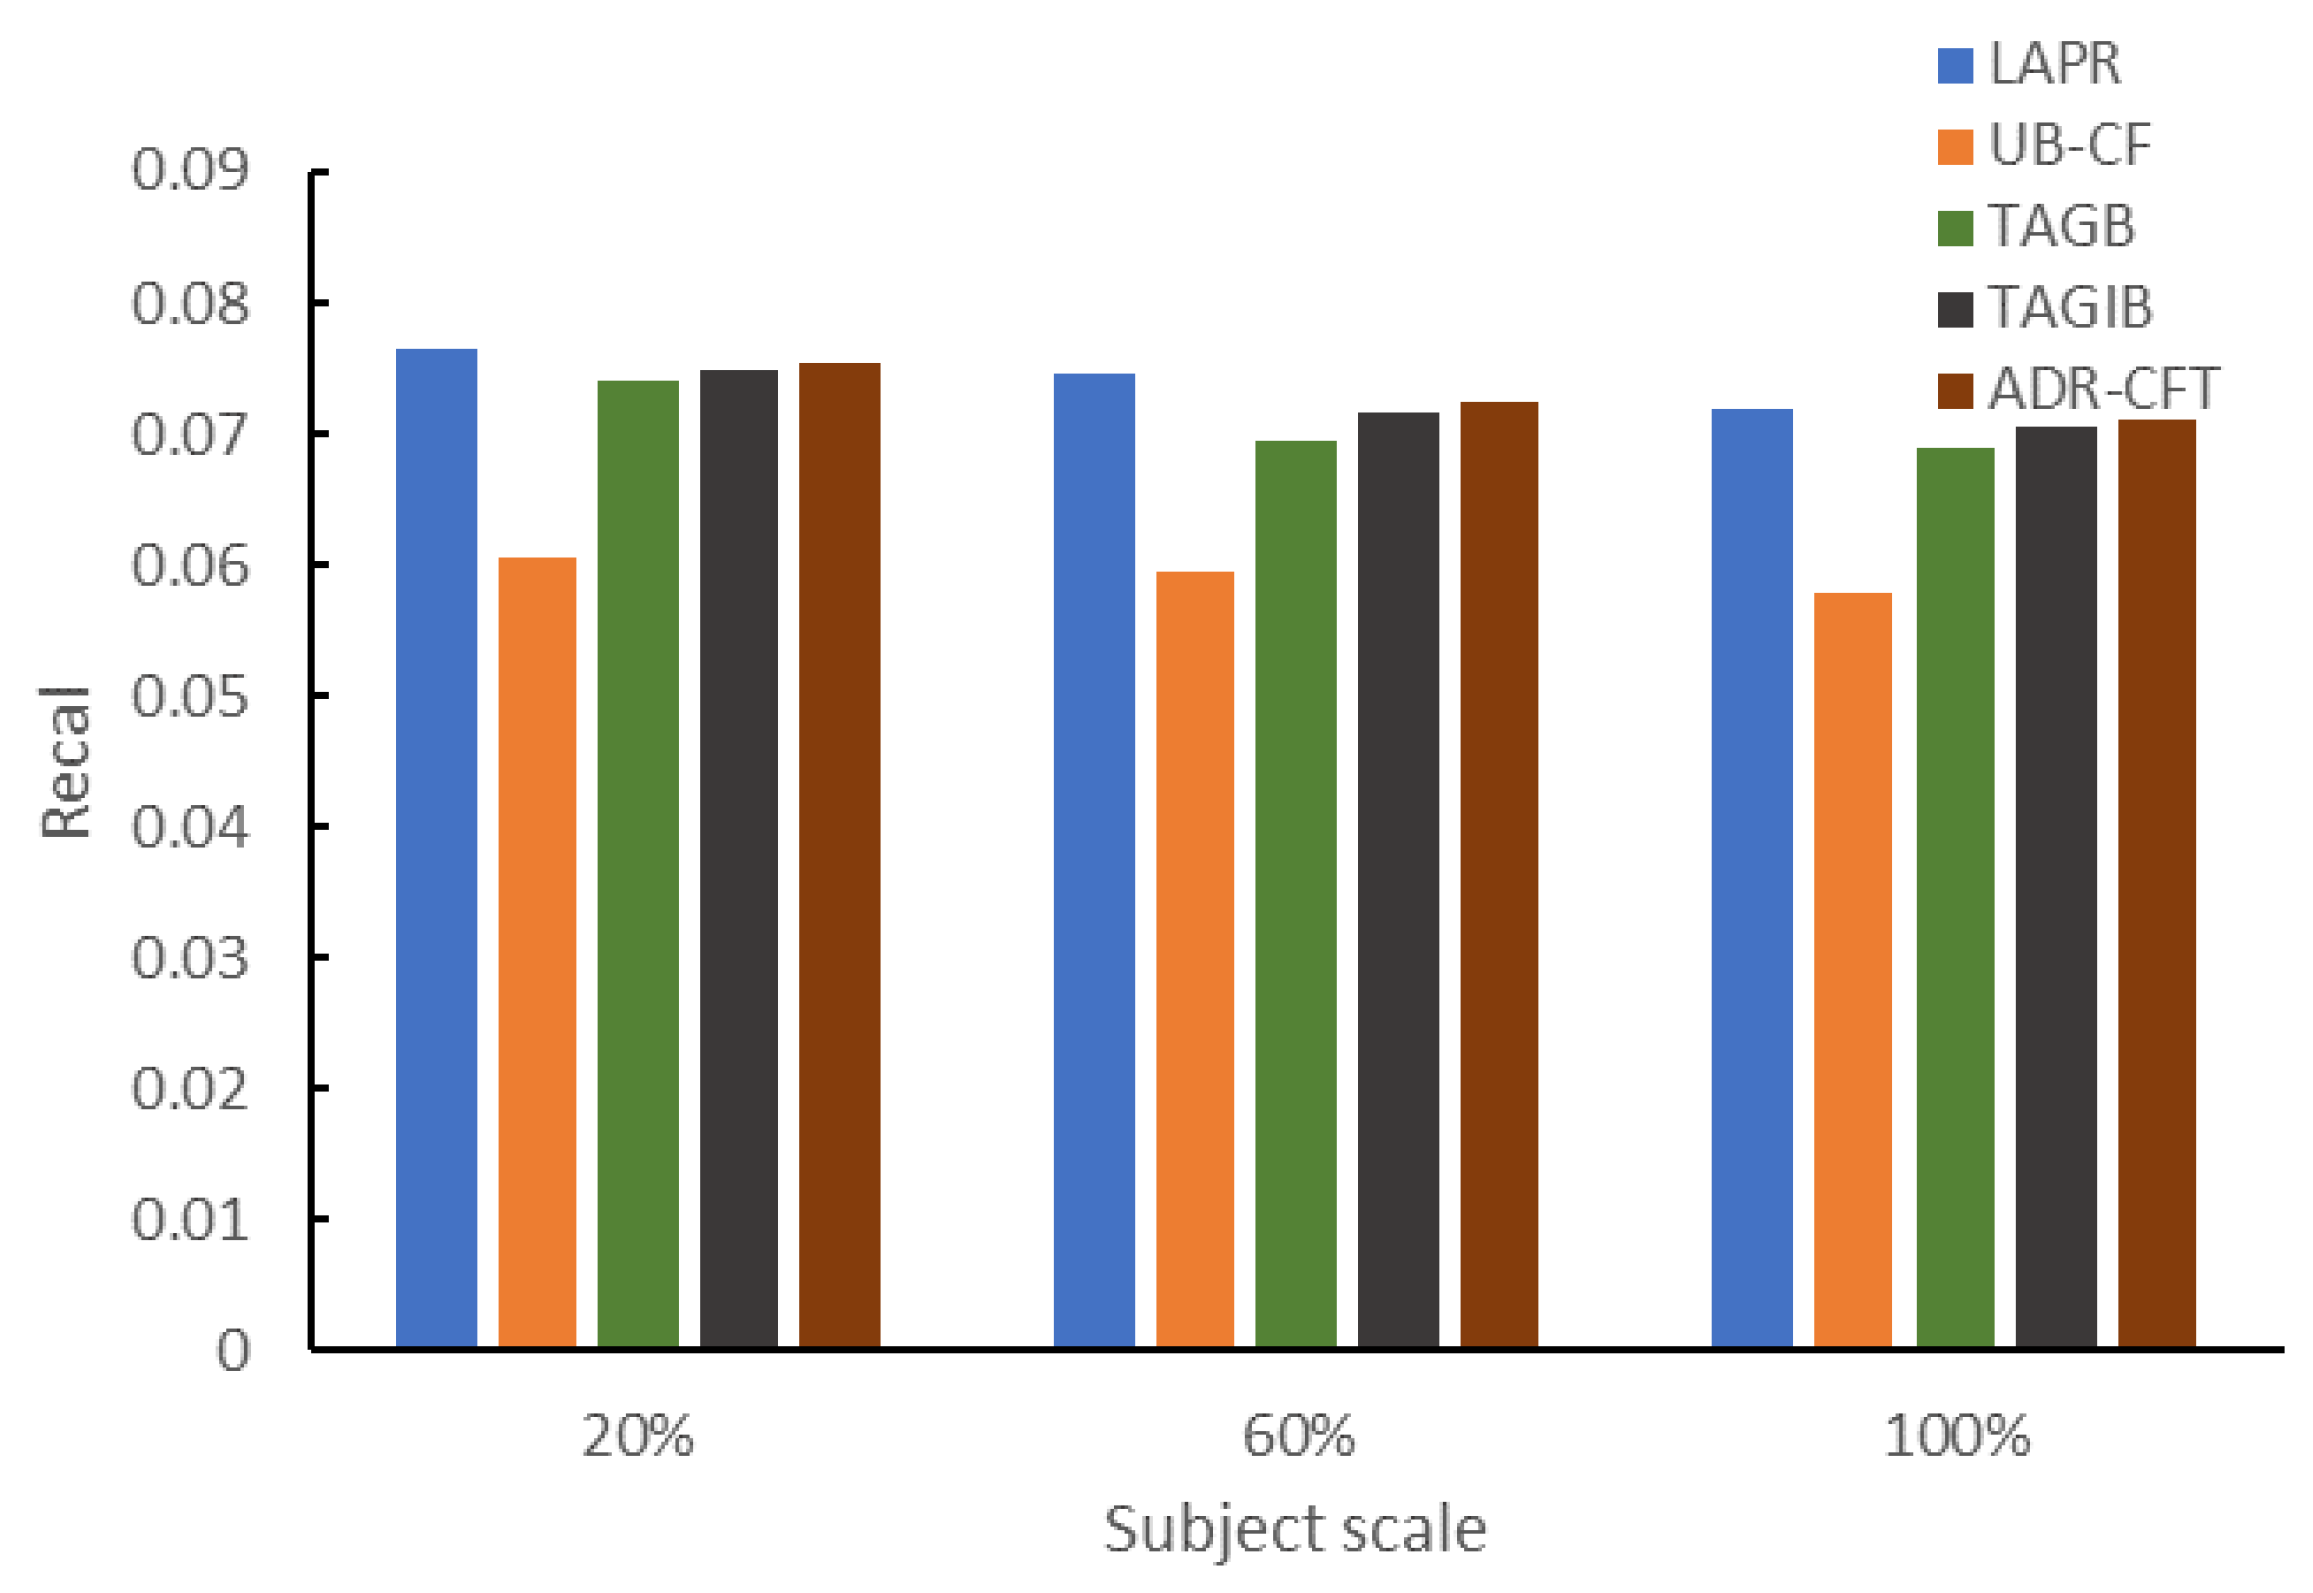
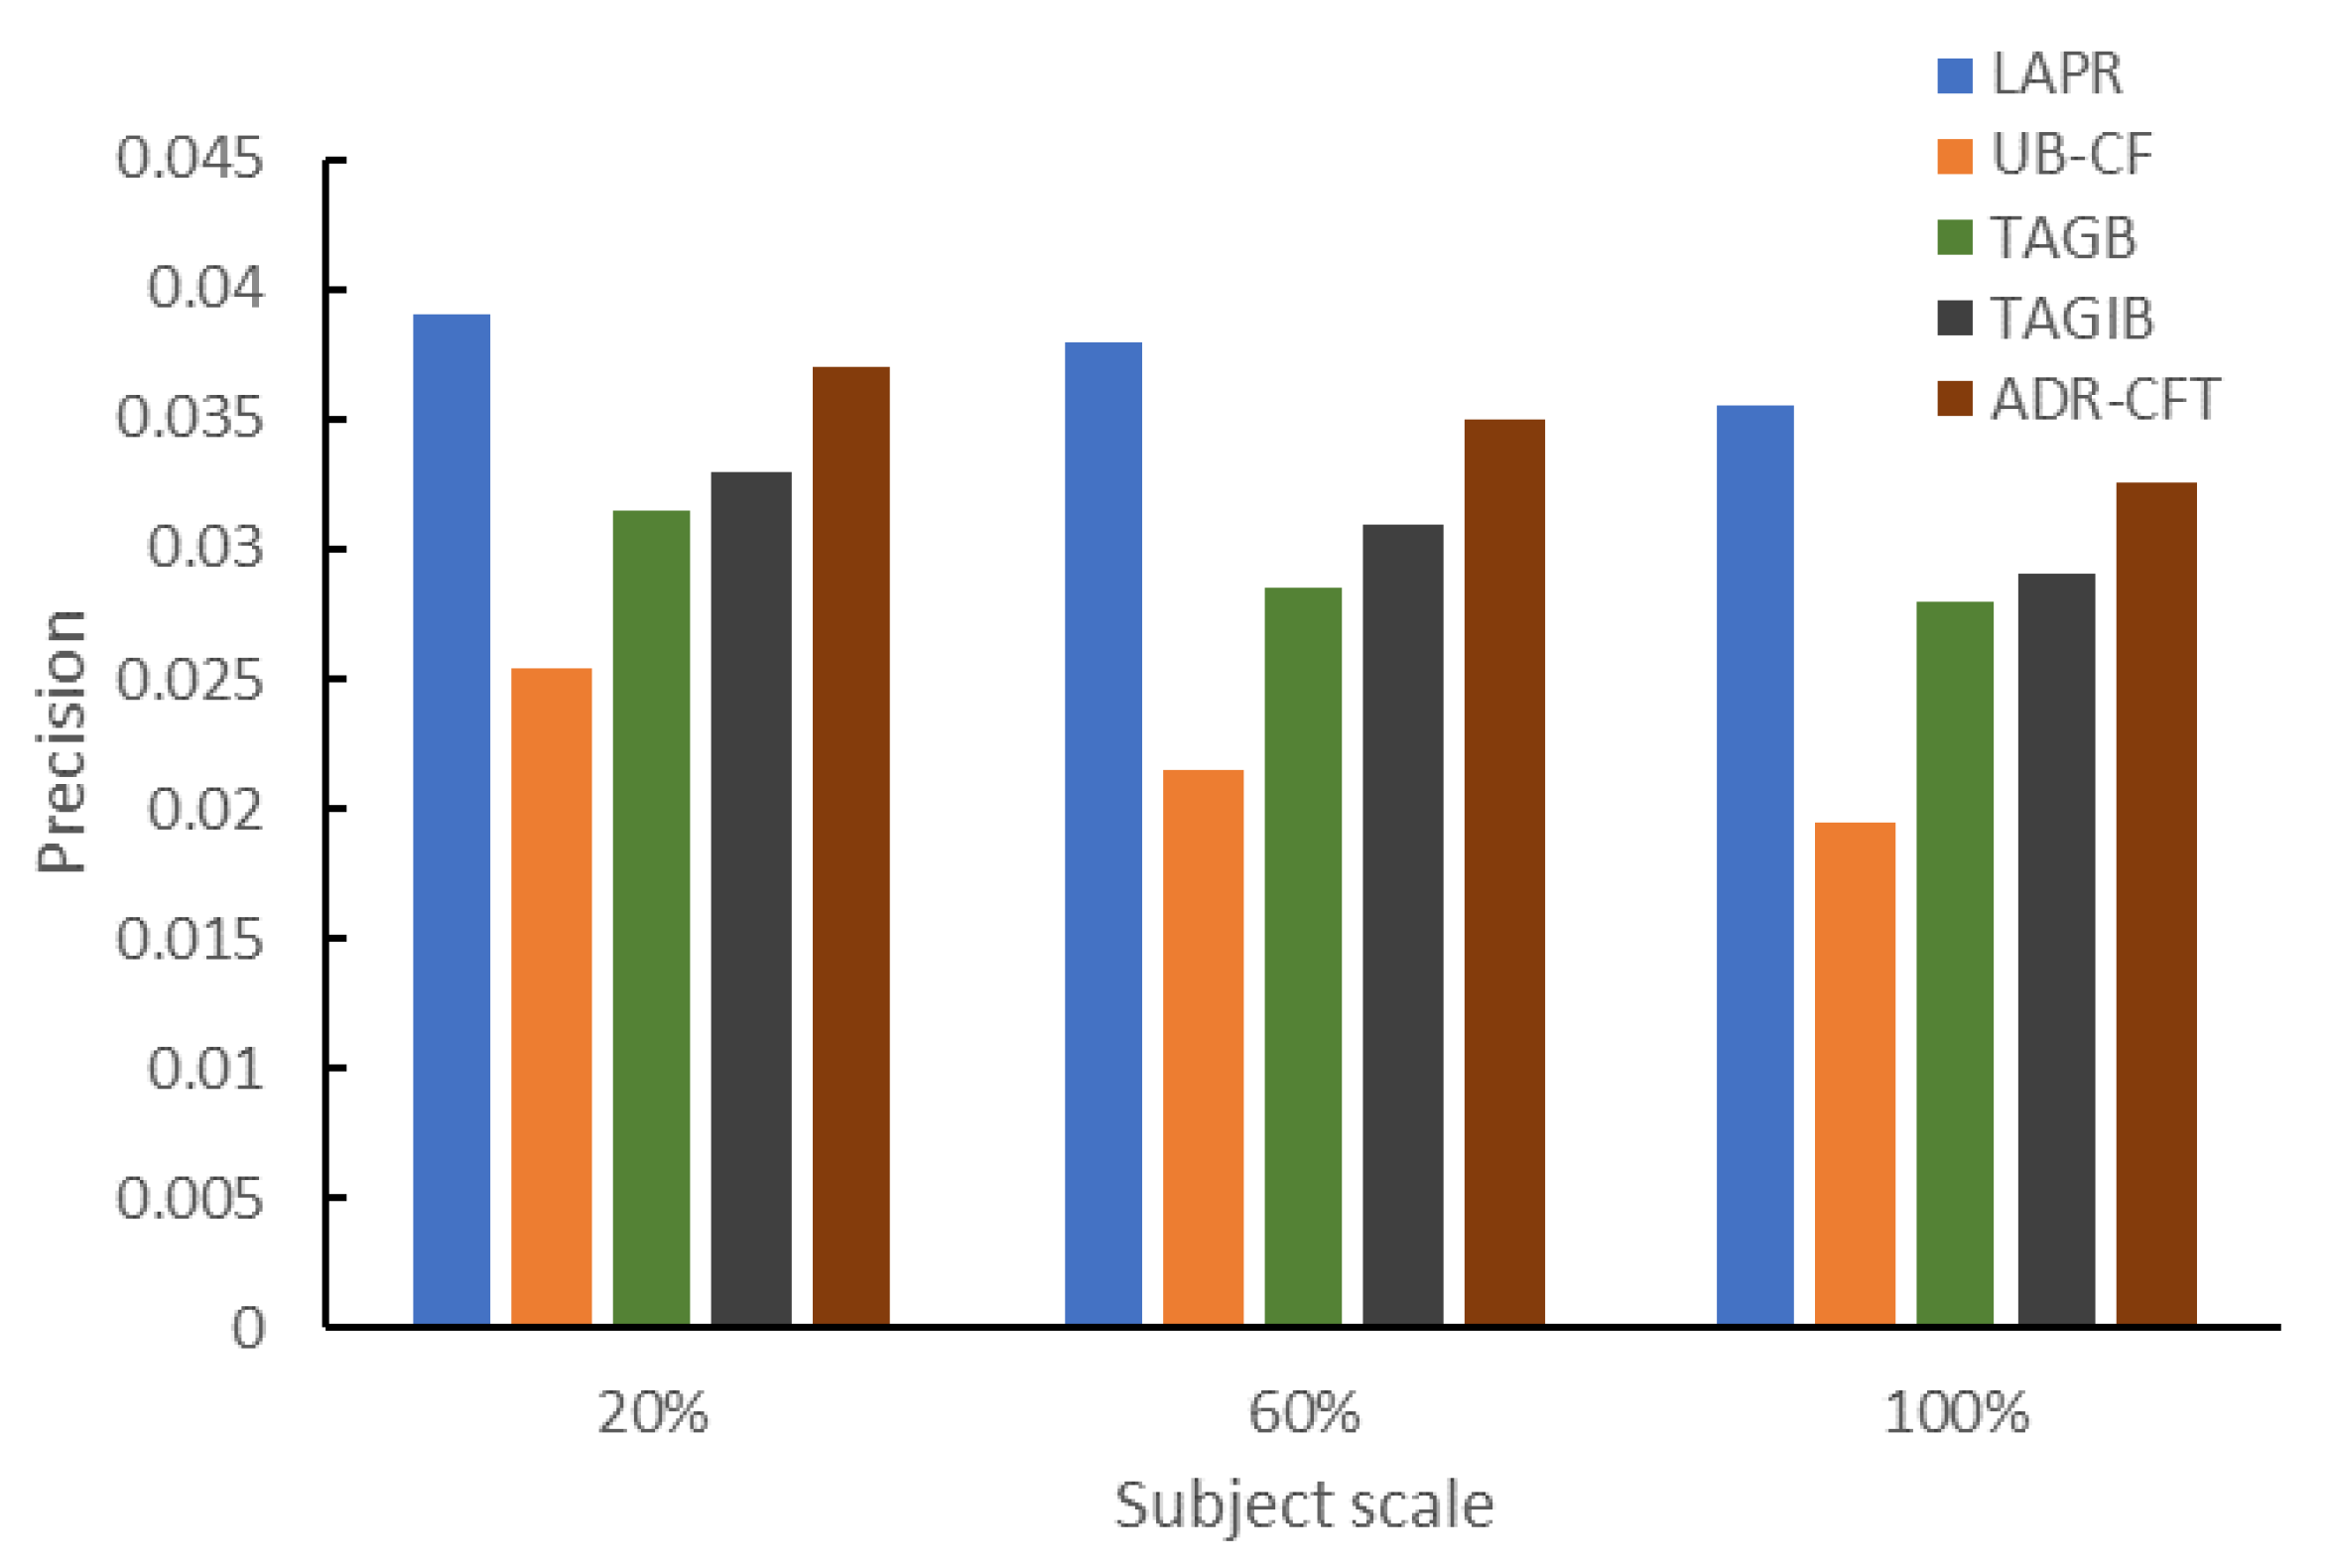
5.2.1. The Qualities of the TOP-5 Recommendation on Different Subject Scales

The number of subjects determines the actual size of the collected data that can be used in the experiment. The more subjects, the more data leads to more differentiated information. For each of the methods (LAPR, UB-CF, TAGB, TAGIB, ADR-CFT), we chose 20%, 60%, and 100% of the subjects [100] to deliver TOP-5 recommendations. Qualities of the recommendations are compared with the values of recall, precision, and F-Measure. Table 2, Table 3 and Table 4 show the comparison for the values of recall, precision, and F-Measure, respectively.
Table 2, Table 3 and Table 4 convey a piece of strong information that LAPR outperforms other classical methods in terms of recall, accuracy, and F-Measure. The number of users (subjects) does pose influences on the performances of LAPR and the other methods. Further comparisons are illustrated in Figure 8, Figure 9 and Figure 10.
From the figures, we can see on the subject scale of 20%, recall of LAPR is a little bit higher but close to the other methods, recalls of the methods (besides UB-CF) do not show significant differences. From 20% to 60%, the differences in the performances of the methods gradually expand. On the subject scale of 60%, the differences of recall, precision, and F-Measure of the methods all reach a peak. On the subject scale of 100%, the differences of recall, precision, and F-Measure of the methods stop expending and even show a trend of shrinking. No drastic changes are seen in the differences in performances of the methods on the subject scale of 60% to 100%.
We believe the main reason for this result is that the methods of both LAPR and the others suffer from data sparsity due to the small number of users (subjects) on the subject scale of 20%. From 20% to 60%, the increment in the number of users (subjects) leads to an increase in the data set. With more data comes more information for the methods to use, which in turn helps to improve the quality of the recommendation results. However, when certain criteria are reached, the increment in the number of users contributes little to the quality of the data set; thus, the differences of the recommendation quality of the methods stop expending and even show a trend of shrinking. LAPR can use additional information on user aesthetic preference for the interface layout, which helps LAPR to show a better performance. The results prove that the recommendation method incorporating aesthetic preference for layout can improve the quality of the recommendation results.

5.2.2. The Qualities of TOP-N Recommendations for All Subjects

In the TOP-N recommendation task, the choice of N, which is related to the length of the recommendation list also has an impact on the quality of the recommendation. In this paper, we chose the N values commonly used in the TOP-N recommendation tasks, i.e., 5, 10, 15, 20. By comparing and analyzing recall, precision, and F-Measure of LAPR and the other four classical methods on the subject scale of 100%, the results are shown in Table 5, Table 6 and Table 7.
Table 5, Table 6 and Table 7 convey that LAPR has a significant advance over the other methods in terms of recall, precision, and F-Measure in all the TOP-N tasks. Further comparisons on the three metrics are illustrated in Figure 11, Figure 12 and Figure 13.
From the comparisons, although LAPR advances the other classical methods in all the three metrics, the advantages of LAPR on the other methods (besides UB-CF) are not as dominant as the precision advantage of LAPR shown in the single content task. The weakened advantages indicate that besides being influential to users’ adoption for mobile marketing contents, aesthetic preference for layout is not a dominant factor in users’ decision-making process. Another finding is that with the increase of N in the TOP-N recommendation tasks, different degrees of quality degradation have emerged for both LAPR and the other methods. When N = 10, LAPR does not suffer a sharp decline in recall and precision like other algorithms. The same thing happens in F-Measure comparison for N = 10. This should be the result of both the increase in the length of the recommendation list and the ability of LAPR to utilize additional information (aesthetic preference for layout). Since LAPR introduces a new ranking mechanism for recommendation results, the items in the recommendation list of LAPR that meet the preferences of the subjects have increased in comparison with the length increase of the list.
On the other hand, the results also reflect that with the increase of information, the contribution of incorporating aesthetic preference information to improving the quality of recommendation results declines. This may be explained with the fact that when the length of the recommendation list increases, more information is brought to users, and the quality of the recommendation results of LAPR also suffers from the increasing items in the list that are irrelevant to certain user preferences.
As N in TOP-N grows, the advantage of the qualities over other methods improved by incorporating aesthetic preference information also shows a decline after reaching a certain level. This can be interpreted by working memory load. An excessively long list would cause a high working memory load of the subject [101,102], and reduce their attention level, which in turn causes the decline in recommendation quality.
The recommendation method proposed in this paper introduces user aesthetic preference for layout into the recommendation process. By quantifying the layout design of the marketing content interface from an aesthetic perspective, and constructing similarity calculation methods from the aesthetic preference for layout, a hybrid recommendation mechanism is build. The method uses more information to recommend than other classical methods. The experimental results prove that the recommendation method incorporating layout aesthetic preference information can improve the quality of the recommendation results.

6. Conclusions

This paper explores a mobile marketing recommendation method that incorporates layout aesthetic preferences. Based on the traditional content-based and collaborative filtering mobile marketing recommendation methods, this method introduces user aesthetic preference for the layout of the marketing content interface. To utilize the information of user aesthetic preference for the layout, we have done a lot of work. The layout design of the marketing content interface is quantified from the aesthetic perspective with the quantification method proposed in our work. The similarity model of user aesthetic preference is constructed by using factors that affect users’ aesthetic preferences for the interface layout. A new sorting method is designed to rearrange the recommendation results, thereby improving the accuracy of the recommendation results. Experimental results show that compared to classical marketing content recommendation methods, our method that incorporates layout aesthetic preferences surpasses others in the accuracy of the TOP-10 recommendation in the single content recommendation task. It suggests that layout aesthetic preference is a factor that can affect the users in adopting marketing recommendations. To further promote the sustainability of m-commerce, layout aesthetic preference should be considered in building a mobile marketing recommendation system. Conventional tasks in our experiment reveal that our method shows advantages over other methods in the metrics of recall, precision, and F-Measure across four levels of different recommendation list lengths and on three different user (subject) scales. This conveys that incorporate layout aesthetic preference information can improve the quality of the recommendation results.
However, in this paper, we invest only the layout of the interface design of mobile marketing content, and it is believed that other attributes of the interface design also have impacts on users’ aesthetic preferences. Whether these attributes have impacts on recommendations remain to be studied. In our paper, data sparsity and the cold-start problem of the proposed method is not mentioned, and we mitigate the problem by working to ensure the quality of our data sets. We believe this problem should be further studied.

Author Contributions

L.X. built the framework of the paper. S.W. and H.M. carried out the collection and preprocessing of the data. S.W. designed the experiment and method. L.X. provided analytical and experimental tools. S.W. finished the experiments and the article. L.X. and H.M. reviewed and edited the paper. All authors have read and agree to the published version of the manuscript.

Funding

This paper was supported by the National Social Science Fund Projects of China (No. 19BGL098) and the Ministry of Education of Humanities and Social Science Project of China (No. 18JJD790013).

Conflicts of Interest

The authors claim that there is no conflict of interest.

References

  1. Park, D.H.; Kim, H.K.; Choi, I.Y.; Kim, J.K. A literature review and classification of recommender systems research. Expert Syst. Appl. 2012, 39, 10059–10072. [Google Scholar] [CrossRef]
  2. Yang, W.S.; Cheng, H.C.; Dia, J.B. A location-aware recommender system for mobile shopping environments. Expert Syst. Appl. 2008, 34, 437–445. [Google Scholar] [CrossRef]
  3. Aimeur, E.; Brassard, G.; Fernandez, J.; Onana, F. ALAMBIC: A privacy-preserving recommender system for electronic commerce. Int. J. Inf. Sec. 2008, 7, 307–334. [Google Scholar] [CrossRef]
  4. Baltrunas, L.; Ludwig, B.; Peer, S.; Ricci, F. Context relevance assessment and exploitation in mobile recommender systems. Pers. Ubiquitous Comput. PUC 2012, 16, 1–20. [Google Scholar] [CrossRef]
  5. Kompan, M.; Bieliková, M. Content-Based News Recommendation. In E-Commerce and Web Technologies; Buccafurri, F., Semeraro, G., Eds.; Lecture Notes in Business Information Processing; Springer: Berlin/Heidelberg, Germany, 2010; pp. 61–72. [Google Scholar] [CrossRef]
  6. Yang, Z.; Wu, B.; Zheng, K.; Wang, X.; Lei, L. A Survey of Collaborative Filtering-Based Recommender Systems for Mobile Internet Applications. IEEE Access 2016, 4, 3273–3287. [Google Scholar] [CrossRef]
  7. Woerndl, W.; Schueller, C.; Wojtech, R. A Hybrid Recommender System for Context-aware Recommendations of Mobile Applications. In Proceedings of the 2007 IEEE 23rd International Conference on Data Engineering Workshop, Istanbul, Turkey, 17–20 April 2007; pp. 871–878. [Google Scholar] [CrossRef]
  8. Chen, C.C.; Wan, Y.H.; Chung, M.C.; Sun, Y.C. An effective recommendation method for cold start new users using trust and distrust networks. Inf. Sci. 2013, 224, 19–36. [Google Scholar] [CrossRef]
  9. Nikolakopoulos, A.N.; Kouneli, M.A.; Garofalakis, J.D. Hierarchical Itemspace Rank: Exploiting hierarchy to alleviate sparsity in ranking-based recommendation. Neurocomputing 2015, 163, 126–136. [Google Scholar] [CrossRef]
  10. Gunawardana, A.; Shani, G. A Survey of Accuracy Evaluation Metrics of Recommendation Tasks. J. Mach. Learn. Res. 2009, 10, 2935–2962. [Google Scholar]
  11. Beel, J.; Langer, S.; Genzmehr, M.; Gipp, B.; Breitinger, C.; Nürnberger, A. Research paper recommender system evaluation: A quantitative literature survey. In Proceedings of the International Workshop on Reproducibility and Replication in Recommender Systems Evaluation, RepSys 2013, Hong Kong, China, 12 October 2013; pp. 15–22. [Google Scholar] [CrossRef] [Green Version]
  12. Ström, R.; Vendel, M.; Bredican, J. Mobile marketing: A literature review on its value for consumers and retailers. J. Retail. Consum. Serv. 2014, 21, 1001–1012. [Google Scholar] [CrossRef] [Green Version]
  13. Mulcahy, R.F.; Riedel, A.S. ‘Touch it, swipe it, shake it’: Does the emergence of haptic touch in mobile retailing advertising improve its effectiveness? J. Retail. Consum. Serv. 2018, in press. [Google Scholar] [CrossRef]
  14. Li, Y.M.; Yeh, Y.S. Increasing trust in mobile commerce through design aesthetics. Comput. Hum. Behav. 2010, 26, 673–684. [Google Scholar] [CrossRef]
  15. Cyr, D.; Head, M.; Ivanov, A. Design aesthetics leading to m-loyalty in mobile commerce. Inf. Manag. 2006, 43, 950–963. [Google Scholar] [CrossRef]
  16. Sahami Shirazi, A.; Henze, N.; Schmidt, A.; Goldberg, R.; Schmidt, B.; Schmauder, H. Insights into layout patterns of mobile user interfaces by an automatic analysis of android apps. In Proceedings of the 5th ACM SIGCHI Symposium on Engineering Interactive Computing Systems, EICS ’13, London, UK, 24–27 June 2013; pp. 275–284. [Google Scholar] [CrossRef]
  17. Lee, Y.; Benbasat, I. A Framework for the Study of Customer Interface Design for Mobile Commerce. Commun. ACM 2003, 46, 79–102. [Google Scholar] [CrossRef]
  18. van Schaik, P.; Ling, J. Modelling user experience with web sites: Usability, hedonic value, beauty and goodness. Interact Comput. 2008, 20, 419–432. [Google Scholar] [CrossRef] [Green Version]
  19. Aldhafferi, N.; Watson, C.; Sajeev, A. Personal Information Privacy Settings of Online Social Networks and Their Suitability for Mobile Internet Devices. Int. J. Secur. Priv. Trust Manag. 2013, 2, 1–17. [Google Scholar] [CrossRef]
  20. Keith, M.; Babb, J.; Lowry, P. A Longitudinal Study of Information Privacy on Mobile Devices. In Proceedings of the 2014 47th Hawaii International Conference on System Sciences, Waikoloa, HI, USA, 6–9 January 2014; pp. 3149–3158. [Google Scholar] [CrossRef]
  21. Ricci, F. Mobile Recommender Systems. J. IT Tour. 2011, 12, 205–231. [Google Scholar] [CrossRef]
  22. Huang, J.J.S.; Yang, S.J.H.; Huang, Y.M.; Hsiao, I.Y.T. Social Learning Networks: Build Mobile Learning Networks Based on Collaborative Services. J. Educ. Technol. Soc. 2010, 13, 78–92. [Google Scholar]
  23. Bhandari, U.; Sugiyama, K.; Datta, A.; Jindal, R. Serendipitous Recommendation for Mobile Apps Using Item-Item Similarity Graph. In Information Retrieval Technology; Banchs, R.E., Silvestri, F., Liu, T.Y., Zhang, M., Gao, S., Lang, J., Eds.; Lecture Notes in Computer Science; Springer: Berlin/Heidelberg, Germany, 2013; pp. 440–451. [Google Scholar] [CrossRef]
  24. Fang, B.; Liao, S.; Xu, K.; Cheng, H.; Zhu, C.; Chen, H. A novel mobile recommender system for indoor shopping. Expert Syst. Appl. 2012, 39, 11992–12000. [Google Scholar] [CrossRef]
  25. Guo, Y.; Yin, C.; Li, M.; Ren, X.; Liu, P. Mobile e-Commerce Recommendation System Based on Multi-Source Information Fusion for Sustainable e-Business. Sustainability 2018, 10, 147. [Google Scholar] [CrossRef] [Green Version]
  26. Lu, J.; Wu, D.; Mao, M.; Wang, W.; Zhang, G. Recommender system application developments: A survey. Decis. Support Syst. 2015, 74, 12–32. [Google Scholar] [CrossRef]
  27. Lops, P.; de Gemmis, M.; Semeraro, G. Content-based Recommender Systems: State of the Art and Trends. In Recommender Systems Handbook; Ricci, F., Rokach, L., Shapira, B., Kantor, P.B., Eds.; Springer: Boston, MA, USA, 2011; pp. 73–105. [Google Scholar] [CrossRef]
  28. Gao, H.; Tang, J.; Hu, X.; Liu, H. Content-aware point of interest recommendation on location-based social networks. In Proceedings of the Twenty-Ninth AAAI Conference on Artificial Intelligence, AAAI’15, Austin, TX, USA, 25–26 January 2015; pp. 1721–1727. [Google Scholar]
  29. Musto, C.; Semeraro, G.; Lops, P.; de Gemmis, M. Combining Distributional Semantics and Entity Linking for Context-Aware Content-Based Recommendation. In Proceedings of the 22nd International Conference, UMAP 2014, Aalborg, Denmark, 7–11 July 2014; pp. 381–392. [Google Scholar] [CrossRef]
  30. Ekstrand, M.D.; Riedl, J.T.; Konstan, J.A. Collaborative Filtering Recommender Systems. HCI 2011, 4, 81–173. [Google Scholar] [CrossRef]
  31. Su, X.; Khoshgoftaar, T.M. A survey of collaborative filtering techniques. Adv. Artif. Intell. 2009, 2009, 4:2. [Google Scholar] [CrossRef]
  32. Ahn, H.J. A new similarity measure for collaborative filtering to alleviate the new user cold-starting problem. Inf. Sci. 2008, 178, 37–51. [Google Scholar] [CrossRef]
  33. Bobadilla, J.; Ortega, F.; Hernando, A. A collaborative filtering similarity measure based on singularities. Inf. Process. Manag. 2012, 48, 204–217. [Google Scholar] [CrossRef] [Green Version]
  34. Zeng, C.; Xing, C.X.; Zhou, L.Z.; Zheng, X.H. Similarity Measure and Instance Selection for Collaborative Filtering. Int. J. Electron. Commer. 2004, 8, 115–129. [Google Scholar] [CrossRef]
  35. Verbert, K.; Manouselis, N.; Ochoa, X.; Wolpers, M.; Drachsler, H.; Bosnic, I.; Duval, E. Context-Aware Recommender Systems for Learning: A Survey and Future Challenges. IEEE Trans. Learn. Technol. 2012, 5, 318–335. [Google Scholar] [CrossRef]
  36. Haruna, K.; Akmar Ismail, M.; Suhendroyono, S.; Damiasih, D.; Pierewan, A.C.; Chiroma, H.; Herawan, T. Context-Aware Recommender System: A Review of Recent Developmental Process and Future Research Direction. Appl. Sci. 2017, 7, 1211. [Google Scholar] [CrossRef] [Green Version]
  37. Dao, T.H.; Jeong, S.R.; Ahn, H. A novel recommendation model of location-based advertising: Context-Aware Collaborative Filtering using GA approach. Expert Syst. Appl. 2012, 39, 3731–3739. [Google Scholar] [CrossRef]
  38. Barranco, M.J.; Noguera, J.M.; Castro, J.; Martínez, L. A Context-Aware Mobile Recommender System Based on Location and Trajectory. In Management Intelligent Systems; Casillas, J., Martínez-López, F.J., Corchado Rodríguez, J.M., Eds.; Advances in Intelligent Systems and Computing; Springer: Berlin/Heidelberg, Germnay, 2012; pp. 153–162. [Google Scholar] [CrossRef]
  39. Liu, X.; Aberer, K. SoCo: A social network aided context-aware recommender system. In Proceedings of the 22nd International Conference on World Wide Web, WWW ’13, Rio de Janeiro, Brazil, 13–17 May 2013; pp. 781–802. [Google Scholar] [CrossRef]
  40. Bouneffouf, D.; Bouzeghoub, A.; Gançarski, A.L. Contextual-Bandit Algorithm for Mobile Context-Aware Recommender System. In Neural Information Processing; Huang, T., Zeng, Z., Li, C., Leung, C.S., Eds.; Lecture Notes in Computer Science; Springer: Berlin/Heidelberg, Germany, 2012; pp. 324–331. [Google Scholar] [CrossRef]
  41. Gorgoglione, M.; Panniello, U.; Tuzhilin, A. The effect of context-aware recommendations on customer purchasing behavior and trust. In Proceedings of the Fifth ACM Conference on Recommender Systems; RecSys ’11, Chicago, IL, USA, 23–27 October 2011; pp. 85–92. [Google Scholar] [CrossRef]
  42. Zheng, Y.; Bamshad, M.; Robin D, B. The Role of Emotions in Context-aware Recommendation. Decisions@RecSys 2013, 2013, 21–28. [Google Scholar]
  43. Carrer-Neto, W.; Hernández-Alcaraz, M.L.; Valencia-García, R.; García-Sánchez, F. Social knowledge-based recommender system. Application to the movies domain. Expert Syst. Appl. 2012, 39, 10990–11000. [Google Scholar] [CrossRef] [Green Version]
  44. Tarus, J.K.; Niu, Z.; Yousif, A. A hybrid knowledge-based recommender system for e-learning based on ontology and sequential pattern mining. Future Gener. Comput. Syst. 2017, 72, 37–48. [Google Scholar] [CrossRef]
  45. Tarus, J.K.; Niu, Z.; Mustafa, G. Knowledge-based recommendation: A review of ontology-based recommender systems for e-learning. Artif. Intell. Rev. 2018, 50, 21–48. [Google Scholar] [CrossRef]
  46. Aggarwal, C.C. Neighborhood-Based Collaborative Filtering. In Recommender Systems: The Textbook; Aggarwal, C.C., Ed.; Springer International Publishing: Cham, Switzerland, 2016; pp. 29–70. [Google Scholar] [CrossRef]
  47. Lee, T.Q.; Park, Y.; Park, Y.T. A Similarity Measure for Collaborative Filtering with Implicit Feedback. In Advanced Intelligent Computing Theories and Applications with Aspects of Artificial Intelligence; Huang, D.S., Heutte, L., Loog, M., Eds.; Lecture Notes in Computer Science; Springer: Berlin/Heidelberg, Germany, 2007; pp. 385–397. [Google Scholar] [CrossRef]
  48. Bag, S.; Kumar, S.K.; Tiwari, M.K. An efficient recommendation generation using relevant Jaccard similarity. Inf. Sci. 2019, 483, 53–64. [Google Scholar] [CrossRef]
  49. Li, J.; Zhang, L.; Meng, F.; Li, F. Recommendation Algorithm based on Link Prediction and Domain Knowledge in Retail Transactions. Procedia Comput. Sci. 2014, 31, 875–881. [Google Scholar] [CrossRef] [Green Version]
  50. Agarwal, V.; Bharadwaj, K.K. A collaborative filtering framework for friends recommendation in social networks based on interaction intensity and adaptive user similarity. Soc. Netw. Anal. Min. 2013, 3, 359–379. [Google Scholar] [CrossRef]
  51. Krishnamurthy, B.; Gill, P.; Arlitt, M. A few chirps about twitter. In Proceedings of the First Workshop on Online Social Networks, WOSN ’08, Seattle, WA, USA, 18 August 2008; pp. 19–24. [Google Scholar] [CrossRef]
  52. Marcus, A. Principles of Effective Visual Communication for Graphical User Interface Design. In Readings in Human–Computer Interaction; Baecker, R.M., Grudin, J., Buxton, W.A.S., Greenberg, S., Eds.; Interactive Technologies; Morgan Kaufmann: Burlington, MA, USA, 1995; pp. 425–441. [Google Scholar] [CrossRef]
  53. Goodwin, N.C. Functionality and usability. Commun. ACM 1987, 30, 229–233. [Google Scholar] [CrossRef]
  54. Blair-Early, A.; Zender, M. User Interface Design Principles for Interaction Design. Design Issues 2008, 24, 85–107. [Google Scholar] [CrossRef]
  55. Edell, J.A.; Burke, M.C. The Power of Feelings in Understanding Advertising Effects. J. Consum. Res. 1987, 14, 421–433. [Google Scholar] [CrossRef]
  56. Darden, W.R.; Babin, B.J. Exploring the concept of affective quality: Expanding the concept of retail personality. J. Bus. Res. 1994, 29, 101–109. [Google Scholar] [CrossRef]
  57. Smith, J.; MacLean, K. Communicating emotion through a haptic link: Design space and methodology. Int. J. Hum. Comput. Stud. 2007, 65, 376–387. [Google Scholar] [CrossRef]
  58. Hone, K.S.; Graham, R. Towards a tool for the Subjective Assessment of Speech System Interfaces (SASSI). Nat. Lang. Eng. 2000, 6, 287–303. [Google Scholar] [CrossRef]
  59. Hui, S.L.T.; See, S.L. Enhancing User Experience Through Customisation of UI Design. Procedia Manuf. 2015, 3, 1932–1937. [Google Scholar] [CrossRef] [Green Version]
  60. Sharif, B.; Maletic, J.I. An eye tracking study on the effects of layout in understanding the role of design patterns. In Proceedings of the 2010 IEEE International Conference on Software Maintenance, Timisoara, Romania, 12–18 September 2010; pp. 1–10. [Google Scholar] [CrossRef] [Green Version]
  61. Goldberg, J.H.; Kotval, X.P. Computer interface evaluation using eye movements: Methods and constructs. Int. J. Ind. Ergon. 1999, 24, 631–645. [Google Scholar] [CrossRef]
  62. Pold, S. Interface Realisms: The Interface as Aesthetic Form. Postmod. Cult. 2005, 15, 5–6. [Google Scholar] [CrossRef] [Green Version]
  63. Cremonesi, P.; Elahi, M.; Garzotto, F. User interface patterns in recommendation-empowered content intensive multimedia applications. Multimed. Tools Appl. 2017, 76, 5275–5309. [Google Scholar] [CrossRef] [Green Version]
  64. Petersen, M.G.; Hallnäs, L.; Jacob, R.J. Introduction to special issue on the aesthetics of interaction. ACM Trans. Comput. Hum. Interact. 2008, 15, 14:1–14:5. [Google Scholar] [CrossRef]
  65. Gedo, M.M. Art and Visual Perception: A Psychology of the Creative Eye. J. Am. Psychoanal. Assn. 1975, 23, 676–677. [Google Scholar]
  66. Altaboli, A.; Lin, Y. Investigating Effects of Screen Layout Elements on Interface and Screen Design Aesthetics. Adv. Hum.-Comput. Interact. 2011, 2011, 1–10. [Google Scholar] [CrossRef] [Green Version]
  67. Zhou, L.; Xue, C.; Tang, W.; Li, J.; Niu, Y. Aesthetic evaluation method of interface elements layout design. Jisuanji Fuzhu Sheji Yu Tuxingxue Xuebao/J. Comput. Aided Des. Comput. Graph. 2013, 25, 758–766. [Google Scholar]
  68. Child, I.L. Personal preferences as an expression of aesthetic sensitivity. J. Personality 1962, 30, 496–512. [Google Scholar] [CrossRef]
  69. Götz, K.O.; Lynn, R.; Borisy, A.R.; Eysenck, H.J. A New Visual Aesthetic Sensitivity Test: I. Construction and Psychometric Properties. Percept. Mot. Skills 1979, 49, 795–802. [Google Scholar] [CrossRef]
  70. Myszkowski, N.; Storme, M.; Zenasni, F.; Lubart, T. Is visual aesthetic sensitivity independent from intelligence, personality and creativity? Personal. Individ. Differ. 2014, 59, 16–20. [Google Scholar] [CrossRef]
  71. Labouvie-Vief, G. Intelligence and cognition. In Handbook of the Psychology of Aging, 2nd ed.; The handbooks of Aging; Van Nostrand Reinhold Co.: New York, NY, USA, 1985; pp. 500–530. [Google Scholar]
  72. Anderson, M. Intelligence and Development: A Cognitive Theory; Blackwell Publishing: Malden, MA, USA, 1992. [Google Scholar]
  73. Davis, B.; Sumara, D. Cognition, Complexity, and Teacher Education. Harv. Educ. Rev. 1997, 67, 105–126. [Google Scholar] [CrossRef]
  74. McCrae, R. Aesthetic Chills as a Universal Marker of Openness to Experience. Motiv. Emot. 2007, 31, 5–11. [Google Scholar] [CrossRef]
  75. Feist, G.J.; Brady, T.R. Openness to Experience, Non-Conformity, and the Preference for Abstract Art. Empir. Stud. Arts 2004, 22, 77–89. [Google Scholar] [CrossRef]
  76. Leder, H.; Belke, B.; Oeberst, A.; Augustin, D. A model of aesthetic appreciation and aesthetic judgments. Br. J. Psychol. 2004, 95, 489–508. [Google Scholar] [CrossRef]
  77. Silvia, P.J. Creativity and Intelligence Revisited: A Latent Variable Analysis of Wallach and Kogan (). Creat. Res. J. 2008, 20, 34–39. [Google Scholar] [CrossRef]
  78. Lubart, T.; Guignard, J.H. The Generality-Specificity of Creativity: A Multivariate Approach. In Creativity: From Potential to Realization; American Psychological Association: Washington, DC, USA, 2006; pp. 43–56. [Google Scholar] [CrossRef]
  79. Lv, Q.; Josephson, W.; Wang, Z.; Charikar, M.; Li, K. Ferret: A toolkit for content-based similarity search of feature-rich data. SIGOPS Oper. Syst. Rev. 2006, 40, 317–330. [Google Scholar] [CrossRef]
  80. Pirasteh, P.; Hwang, D.; Jung, J.E. Weighted Similarity Schemes for High Scalability in User-Based Collaborative Filtering. Mob. Netw. Appl. 2015, 20, 497–507. [Google Scholar] [CrossRef]
  81. Mu, X.; Chen, Y.; Yang, J.; Jiang, J. An improved similarity algorithm based on hesitation degree for user-based collaborative filtering. In Proceedings of the 5th International Conference on Advances in Computation and Intelligence, ISICA’10, Wuhan, China, 22–24 October 2010; pp. 261–271. [Google Scholar]
  82. Wang, J.; Vries, A.P.D.; Reinders, M.J.T. Unifying user-based and item-based collaborative filtering approaches by similarity fusion. In Proceedings of the 29th Annual International ACM SIGIR Conference on Research and Development in Information Retrieval, SIGIR ’06, Seattle, WA, USA, 6–11 August 2006; pp. 501–508. [Google Scholar]
  83. Ngo, D.C.L.; Teo, L.S.; Byrne, J.G. Modelling interface aesthetics. Inf. Sci. 2003, 152, 25–46. [Google Scholar] [CrossRef]
  84. Chevrier, J.; Delorme, A. Aesthetic preferences: Influence of perceptual ability, age and complexity of stimulus. Percept. Mot. Skills 1980, 50, 839–849. [Google Scholar] [CrossRef] [PubMed]
  85. Wu, B. Formation and division of Chinese cultural districts. Acad. Mon. 1996, 3, 10–15. [Google Scholar]
  86. Zheng, Z.Y.; Jia, C.Y.; Wang, Z.F.; Dun, L.I. Computing Research of User Similarity Based on Micro-blog. Comput. Sci. 2017, 44, 262–266. [Google Scholar]
  87. Anastasakos, T.; Hillard, D.; Kshetramade, S.; Raghavan, H. A collaborative filtering approach to ad recommendation using the query-ad click graph. In Proceedings of the 18th ACM conference on Information and Knowledge Management, CIKM ’09, Hong Kong, China, 2–6 November 2009; pp. 1927–1930. [Google Scholar] [CrossRef] [Green Version]
  88. Schlee, C. Targeted Advertising Technologies in the ICT Space: A Use Case Driven Analysis; Google-Books-ID: CZQsBAAAQBAJ; Springer: Berlin/Heidelberg, Germany, 2013. [Google Scholar]
  89. Cantador, I.; Bellogín, A.; Fernández-Tobías, I.; López-Hernández, S. Semantic Contextualisation of Social Tag-Based Profiles and Item Recommendations. In E-Commerce and Web Technologies; Huemer, C., Setzer, T., Eds.; Lecture Notes in Business Information Processing; Springer: Berlin/Heidelberg, Germnay, 2011; pp. 101–113. [Google Scholar] [CrossRef] [Green Version]
  90. Kim, H.N.; Ji, A.T.; Ha, I.; Jo, G.S. Collaborative filtering based on collaborative tagging for enhancing the quality of recommendation. Electron. Commer. Res. Appl. 2010, 9, 73–83. [Google Scholar] [CrossRef]
  91. Karypis, G. Evaluation of Item-Based Top-N Recommendation Algorithms. In Proceedings of the Tenth International Conference on Information and Knowledge Management, CIKM ’01, Atlanta, GA, USA, 5–10 November2001; pp. 247–254. [Google Scholar] [CrossRef]
  92. Krestel, R.; Fankhauser, P.; Nejdl, W. Latent dirichlet allocation for tag recommendation. In Proceedings of the Third ACM Conference on Recommender Systems, RecSys ’09, New York, NY, USA, 23–25 October 2009; pp. 61–68. [Google Scholar] [CrossRef]
  93. Collobert, R.; Weston, J.; Bottou, L.; Karlen, M.; Kavukcuoglu, K.; Kuksa, P. Natural Language Processing (Almost) from Scratch. J. Mach. Learn. Res. 2011, 12, 2493–2537. [Google Scholar]
  94. Liu, X.; He, P.; Chen, W.; Gao, J. Multi-Task Deep Neural Networks for Natural Language Understanding. arXiv 2019, arXiv:1901.11504. [Google Scholar]
  95. Miri, M.S.; Mahloojifar, A. Retinal Image Analysis Using Curvelet Transform and Multistructure Elements Morphology by Reconstruction. IEEE Trans. Biomed. Eng. 2011, 58, 1183–1192. [Google Scholar] [CrossRef]
  96. Li, Q.; Lu, W.; Yang, J. A Hybrid Thresholding Algorithm for Cloud Detection on Ground-Based Color Images. J. Atmos. Ocean. Technol. 2011, 28, 1286–1296. [Google Scholar] [CrossRef]
  97. Bellogin, A.; Castells, P.; Cantador, I. Precision-oriented evaluation of recommender systems: An algorithmic comparison. In Proceedings of the Fifth ACM Conference on Recommender Systems, RecSys ’11, Chicago, IL, USA 23–27 October 2011; pp. 333–336. [Google Scholar] [CrossRef] [Green Version]
  98. Paradiso, S. Cerebral Blood Flow Changes Associated With Attribution of Emotional Valence to Pleasant, Unpleasant, and Neutral Visual Stimuli in a PET Study of Normal Subjects. Am. J. Psychiatry 1999, 156, 1618–1629. [Google Scholar] [CrossRef]
  99. Lane, R.D.; Chua, P.M.L.; Dolan, R.J. Common effects of emotional valence, arousal and attention on neural activation during visual processing of pictures. Neuropsychologia 1999, 37, 989–997. [Google Scholar] [CrossRef] [Green Version]
  100. Jin, Z.; Zhang, J.; Xiangjun, L.I.; Wen, H.; Zhang, H. A Collaborative Filtering Advertising Recommendation Algorithm with Tag. Comput. Eng. 2018, 44, 236–242, 247. [Google Scholar]
  101. Fockert, J.W.D.; Rees, G.; Frith, C.D.; Lavie, N. The role of working memory load in selective attention. Science 2001, 291, 1803–1806. [Google Scholar] [CrossRef] [PubMed] [Green Version]
  102. Brissenden, J.A.; Somers, D.C. Cortico–cerebellar networks for visual attention and working memory. Curr. Opin. Psychol. 2019, 29, 239–247. [Google Scholar] [CrossRef] [PubMed]
Figure 1. The model framework for the mobile marketing recommendation method incorporating layout aesthetic preference.
Sustainability 12 02496 g001
Figure 2. The structure and procedure of recommendation list generation based on aesthetic preference for layout.
Sustainability 12 02496 g002
Figure 3. A typical process of recommendation list rearranging.
Sustainability 12 02496 g003
Figure 4. An example of the materials used in a single content task.
Sustainability 12 02496 g004
Figure 5. An example of colored materials and their grayed-out version in conventional tasks.
Sustainability 12 02496 g005
Figure 6. Metrics definition, goals the metrics are testing, experiment tasks in which the metrics are used to test the goals.
Sustainability 12 02496 g006
Figure 7. Comparison of precisions in a single content task (TOP-10) for different methods.
Sustainability 12 02496 g007
Figure 8. Comparison of recalls in conventional task (TOP-5) for different methods on different subject scales.
Sustainability 12 02496 g008
Figure 9. Comparison of precisions in conventional task (TOP-5) for different methods on different subject scales.
Sustainability 12 02496 g009
Figure 10. Comparison of F-Measures in conventional task (TOP-5) for different methods on different subject scales.
Sustainability 12 02496 g010
Figure 11. Comparison of recalls in conventional task (TOP-N) for different methods on all subjects.
Sustainability 12 02496 g011
Figure 12. Comparison of precisions in conventional task (TOP-N) for different methods on all subjects.
Sustainability 12 02496 g012
Figure 13. Comparison of F-Measures in conventional task (TOP-N) for different methods on all subjects.
Sustainability 12 02496 g013
Table 1. Precisions in a single content task (TOP-10) for different methods.
MethodLAPRUB-CFTAGBTAGIBADR-CFT
Precision0.38930.18140.17650.18610.1881
Table 2. Recalls in conventional tasks (TOP-5) for different methods on different subject scales.
Subject ScaleLAPRUB-CFTAGBTAGIBADR-CFT
20%0.07650.06050.07450.07520.0755
60%0.07450.05950.06950.07150.0725
100%0.07230.05810.06960.07050.0712
Table 3. Precisions in conventional tasks (TOP-5) for different methods on different subject scales.
Subject ScaleLAPRUB-CFTAGBTAGIBADR-CFT
20%0.03930.02540.03150.03310.0372
60%0.03810.02150.02850.03130.0353
100%0.03550.01950.02840.02910.0325
Table 4. F-Measures in conventional tasks (TOP-5) for different methods on different subject scales.
Subject ScaleLAPRUB-CFTAGBTAGIBADR-CFT
20%0.05170.03580.04420.04580.0497
60%0.05030.03160.04040.04320.0472
100%0.04760.02920.03980.04110.0446
Table 5. Recalls in conventional task (TOP-N) for different methods on all subjects.
TOP-NLAPRUB-CFTAGBTAGIBADR-CFT
TOP-50.07260.05830.06950.07050.0713
TOP-100.06950.04550.06050.06050.0615
TOP-150.06050.03690.0520.05250.0538
TOP-200.04750.02550.04270.04050.0415
Table 6. Precisions in conventional task (TOP-N) for different methods on all subjects.
TOP-NLAPRUB-CFTAGBTAGIBADR-CFT
TOP-50.03550.01950.02820.02930.0325
TOP-100.03450.01530.02240.02450.0271
TOP-150.02940.01260.01550.01740.0235
TOP-200.02470.00730.01310.01520.0197
Table 7. F-Measures in conventional task (TOP-N) for different methods on all subjects.
TOP-NLAPRUB-CFTAGBTAGIBADR-CFT
TOP-50.04760.02920.03980.04110.0446
TOP-100.04610.02260.03230.03440.0375
TOP-150.03920.01800.02390.02570.0321
TOP-200.03190.01100.01960.02190.0261

