Article

What Factors Affect the Level of Green Urbanization in the Yellow River Basin in the Context of New-Type Urbanization?

1
Business School, Hohai University, Changzhou 213022, China
2
School of Finance and Economics, Jiangsu University, Zhenjiang 212013, China
3
School of Economics, Lanzhou University, Lanzhou 730000, China
*
Author to whom correspondence should be addressed.
Sustainability 2020, 12(6), 2488; https://doi.org/10.3390/su12062488
Submission received: 17 February 2020 / Revised: 15 March 2020 / Accepted: 18 March 2020 / Published: 22 March 2020
(This article belongs to the Special Issue Urban Economics, City Development and Future Social Challenges)

Abstract

:
Promoting new-type urbanization with the concept of green development has become an inevitable requirement for high-quality development in the Yellow River Basin. Grasping the development trend and influencing factors of green urbanization level in the Yellow River Basin is of great significance for implementing the international conventions on environmental protection and participating in global environmental governance. This paper selects the green urbanization level panel data of nine provinces in the Yellow River Basin from 2006 to 2018. Then, principal component analysis and factor analysis are applied to measure and evaluate the green urbanization level of each province. Furthermore, this paper constructs a dynamic panel estimation model and uses differential generalized method of moments (DIF-GMM) model and system generalized method of moments (SYS-GMM) model to explore the influencing factors. The results show that the overall level of green urbanization in the Yellow River Basin has steadily and rapidly increased, and there are significant spatial differences. The green urbanization level of eastern provinces is significantly higher than that of central and western provinces. In addition, the overall level of green urbanization shows a convergence trend. From the perspective of influencing factors, the factors that have significant positive effects on the level of green urbanization include economic development level, technological innovation level, and urban size. Industrial structure, foreign direct investment (FDI), and education level counteract the level of green urbanization. However, environmental regulation strength and opening degree fail to pass the significance test. Therefore, it is necessary to promote and upgrade industrial transformation, improve the quality of opening up, and strengthen cooperation in technological innovation and environmental governance. There are requirements that the government control the urban size and population scientifically and implement the environmental access system strictly in order to improve the level of green urbanization in the Yellow River Basin. It is more possible to achieve harmonious economic and ecological environment development.

1. Introduction

In September 2019, the Chinese government incorporated “ecological protection and high-quality development in the Yellow River Basin” into its national strategy for regional coordination. The Yellow River Basin is widely considered to be the birthplace of Chinese civilization. It spans nine provinces in the western, central, and eastern regions. At the end of 2018, the GDP of the Yellow River Basin was 23.9 trillion yuan (3.61 trillion USD), accounting for 26.5% of the national GDP. The Yellow River Basin is one of the urbanized concentrated areas in China, with a population of 420 million, accounting for 30.3% of the total population. The urbanization rate of the population increased from 38.49% in 2006 to 54.34% in 2018. With the acceleration of urbanization, a large number of resource element input-oriented production activities lead to low resource utilization. The per capita energy consumption of Shaanxi Province in the Yellow River Basin increased by nearly 109.69% from 1.5921 tons per person in 2006 to 3.3385 tons per person in 2018. Resource consumption increased sharply [1,2]. The report of the 19th National Congress of the People’s Republic of China regards green development as the first measure for the construction of an ecological civilization. The industrial solid waste production in the Yellow River Basin accounts for more than 45% of the national industrial solid waste production, and sulfur dioxide emissions account for about 40%. The problem of urban pollution caused by the prosperity of the secondary industry in the Yellow River Basin severely affects the self-purification capacity of the ecosystem and greatly restricts the development of green urbanization [3,4]. In the context of ecological priority and green development, it is essential to explore the development trend and inter-regional differences of the level of green urbanization in the Yellow River Basin. Analyzing its influencing factors is of great significance to promote high-quality development of ecological protection in the Yellow River Basin.
Green urbanization generally refers to a new-type urbanization mode that integrates green development into urban development, solves a series of practical problems in the process of urbanization and achieves the optimization of urban economic development and the ecological carrying capacity and resource supply. Finally, it will realize the sustainable development of human and society and the healthy development of the city [5,6]. The majority of existing studies explore the connotation of green urbanization from a theoretical perspective, analyze existing problems, and propose policy recommendations. The research on green urbanization abroad started with the introduction of Ebenezer Howard’s pastoral city theory [7]. It continued to develop from Parker’s urban ecological theory, which advocated focusing on urban environmental issues [8]. Dong (2014) proposed a strategic framework for green urbanization to better advance the key tasks of green urbanization [9]. Marianne (2014) pointed out that achieving green growth requires the development and implementation of more sustainable urbanization models [10]. Based on the Belt and Road Initiative, Xiao (2017) pointed out that the green urbanization construction should be adapted to local conditions, and a unique green urbanization road that is suitable for regional development should be taken, by comparing domestic greening construction in domestic nodes, countries, and regions along the route [11]. Gu (2018) indicated from a strategic perspective that green urbanization is an important starting point for green development in the new era, and it is necessary to promote green urbanization in terms of green industry, green technology, and optimization of urban spatial layout [12].
However, the realization of green urbanization should be quantitatively analyzed from the perspectives of economy, resources, environment, policy and other dimensions. It should not stop at the theoretical level. Many scholars at home and abroad selected the entropy method and data envelopment analysis to measure and evaluate green urbanization indexes. This kind of methods does not need to clarify the functional relationship between variables. It has such a significant advantage in evaluating the input-output change law, that it is widely used by scholars. Watanabe (2007) calculated the growth efficiency of urban green economy based on the constraints of population and capital investment [13]. Ding (2019) used the entropy method to calculate the comprehensive development level of new-type urbanization in 11 coastal provinces and measured the coupling and coordination relationship among the constituent elements [14]. Xu (2019) adopted the entropy method to measure the level of new-type urbanization and analyzed the economic growth effects of new-type urbanization and industrial structure upgrade [15]. Zou (2017) applied the comprehensive index method to quantitatively study the evolution of the spatial-temporal pattern of green urbanization in Shandong Province [16]. As one of China’s core economic belts, the Yellow River Basin has an important impact on China’s promotion of green urbanization. This paper selects nine provinces in the Yellow River Basin as key research areas. In order to implement the international conventions on environmental protection and promote sustainable development in the Yellow River Basin, the green urbanization level is used as the core indicator to construct an evaluation index system. The principal component analysis and factor analysis models are applied. Starting from the four dimensions of economy, resources, environment, and policy, this paper measures and evaluates the level of green urbanization in each province. This paper also grasps the development trend and inter-regional differences of the level of green urbanization in each province of the Yellow River Basin. The generalized method of moments (GMM) model is employed to explore the influencing factors of the level of green urbanization in each province, to clarify the correlation between each influencing factor and the development of regional green urbanization. It has strong theoretical and practical significance to make up for the shortcomings of environmental pollution in the development of new-type urbanization and to promote high-quality development in the Yellow River Basin.

2. Model Construction

2.1. Evaluation Model

The level of green urbanization in the Yellow River Basin is affected by many factors such as economy, society, policy and environment. In order to better measure and evaluate the level of green urbanization in the Yellow River Basin, this paper uses principal component analysis and factor analysis to analyze the relevant data of 9 provinces in the Yellow River Basin. Principal component analysis and factor analysis are commonly used data reduction methods. This method can compress multivariate data, extract key variable information and reflect the original multivariate mass data information with fewer comprehensive variables [17,18]. The matrix of n degree X 1 , X 2 , , X m is first constructed. Then, the tests of Bartlett and KMO are carried out. Formula (1) calculates the correlation coefficient matrix R . There are K principal components whose cumulative contribution rate is greater than 80% and the eigenvalue is greater than 1. Note that the contribution of the P principal component is K p in formula (2). λ p is a feature value. The percentile score is F i in formula (3). f i p is the principal component value after 0 ~ 1 processing.
R = | 1 n 1 t = 1 m X t i X i j | ( m × m )   ( i = 1 , 2 , , m ; j = 1 , 2 , , m )
K p = λ p / p = 1 k λ p
F i = 100 × p = 1 k K p f i p
In order to better achieve the research purpose and find out the potential dominant factors, factor analysis is performed on the data. Factor analysis is based on the correlation coefficient matrix ρ using the principal component method to extract the principal factors. Suppose that the eigenvalue and eigenvector pair of correlation coefficient matrix ρ is ( λ ^ 1 , ε ^ 1 ) , ( λ ^ 2 , ε ^ 2 ) , , ( λ ^ m , ε ^ m ) . The number of p < m is common factor. The estimated factor load matrix is L ˜ = [ λ ^ 1 ε ^ 1 λ ^ 2 ε ^ 2 λ ^ P ε ^ P ] . The contribution of the main factor i to the total variance is w i = λ ^ i / m . The factor score is calculated using the least squares method from the principal component estimation. Formula (4) is the basic model of factor analysis. The mean vector μ , the factor load matrix L , and the special variance matrix φ are all known [19,20]. Assume the special factor ε is the error, and the formula for calculating the factor score f ^ i is the formula (5). Finally, the weighted comprehensive evaluation can obtain the comprehensive score of D j in formula (6), in which there is j ( j m ) .
X μ = L F + ε
f ^ i = ( L ^ L ^ Z ) 1 L ^ Z Z i
D j = i = 1 p w i f i

2.2. Dynamic Panel Estimation Model

The dynamic panel estimation model can solve the endogenous problems caused by missing variables, measurement errors or the model’s own causes. It can effectively avoid biased and non-uniform problems caused by random effects or OLS fixed effect methods [21]. The panel data used in this paper is from nine provinces in the Yellow River Basin from 2006 to 2018. Since the level of green urbanization is a dynamic evolution process, it is suitable to use a dynamic panel estimation model for quantitative dynamic analysis. The GMM model is often used in the dynamic panel estimation model. The GMM model includes differential generalized method of moments (DIF-GMM) model and system generalized method of moments (SYS-GMM) model. DIF-GMM removes the effects of individual effects by making first-order differences to the equations. It eliminates the problem of incomplete estimation caused by variables that do not change with time [22]. SYS-GMM has high estimation efficiency and retains variable coefficients that do not change with time. Besides, it can flexibly select instrumental variables, so that the estimation results have less bias [23]. In Formula (7), y i t is the explained variable, y i , t 1 is the lag term of the explained variable, x i t is the explaining variable, and ε is the random interference term. In the ordinary dynamic estimation panel model shown in formula (8), the explaining variable includes the multi-order lag term of the explained variable. The influence of the multi-order lag term on the explained variable is fully considered.
y i t = α + ρ y i , t 1 + x i t β + z i δ + u i + ε i t   ( t = 2 , 3 , , T )
y i t = α + ρ 1 y i , t 1 + ρ 2 y i , t 2 + + ρ p y i , t p + x i t β + z i ζ + u i + ε i t

3. Empirical Test

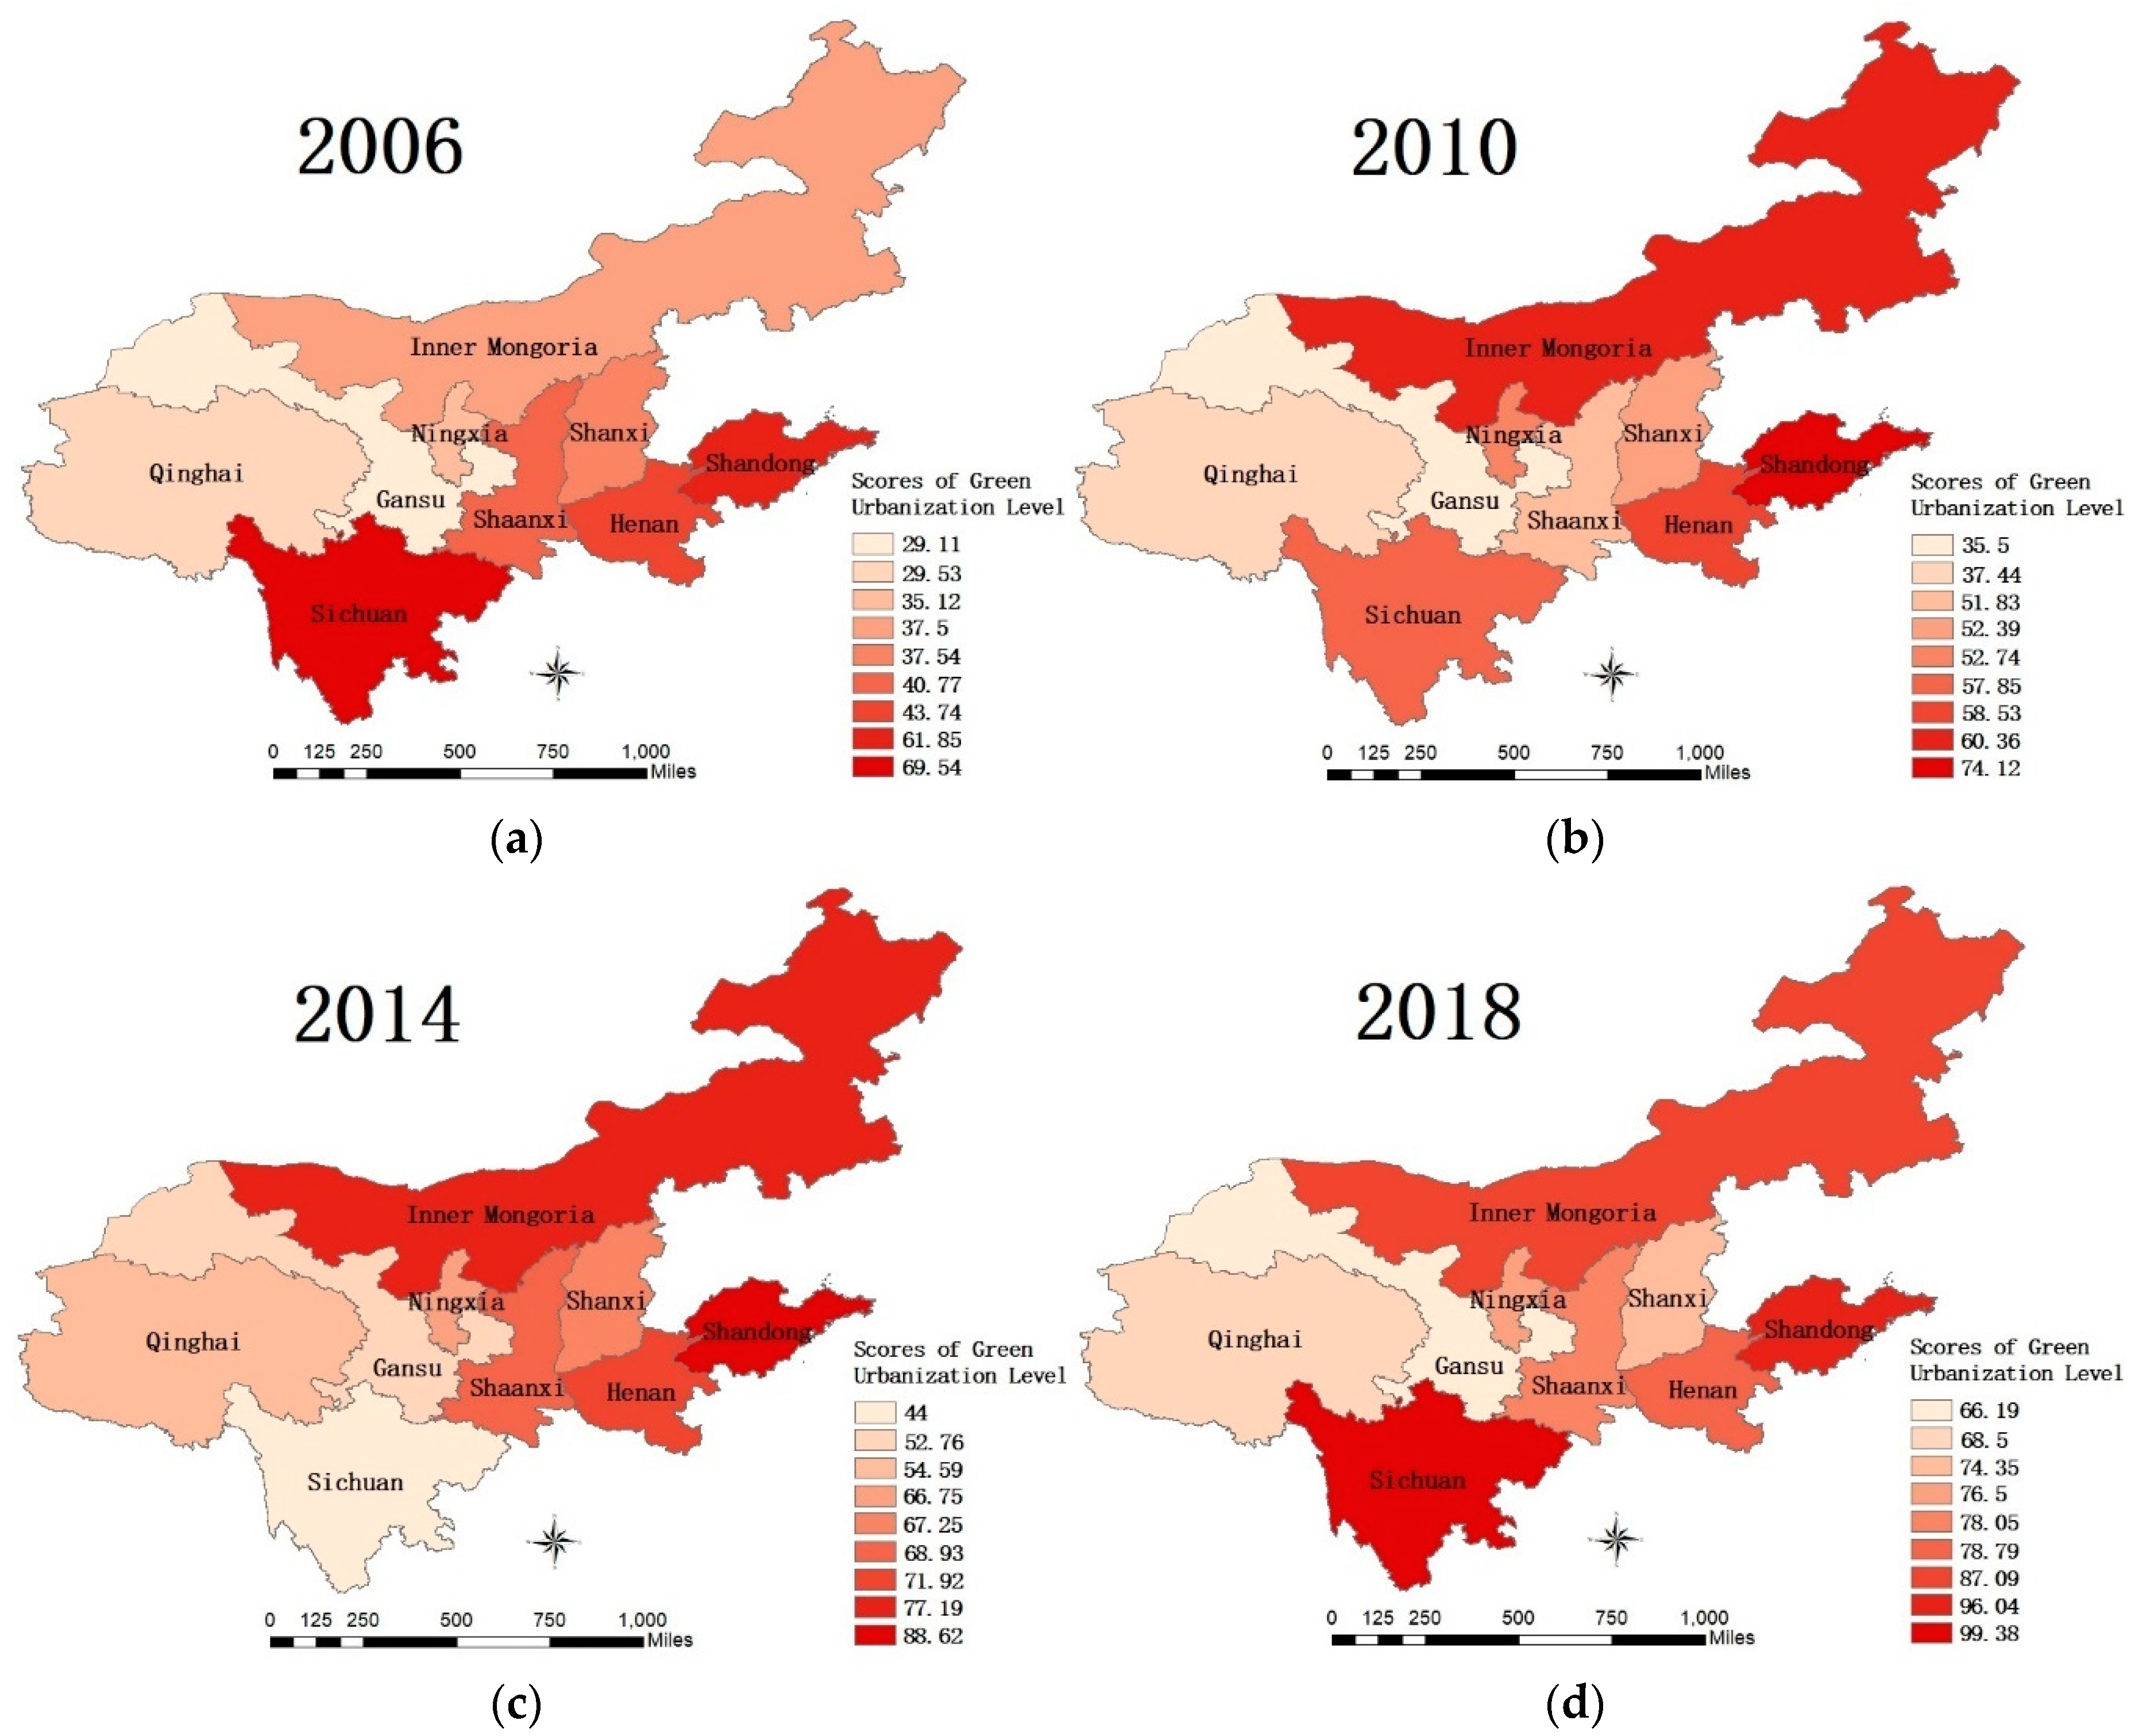
3.1. Evaluation of Green Urbanization Level

The evaluation index system for the level of green urbanization in the Yellow River Basin should conform to the overall idea of combining innovation, greenness, and development. It requires the coordination of all aspects of the economy, resources, ecology, and society [24]. Based on the principles of comprehensiveness, objectivity, systematization, and operability, the evaluation index system of green urbanization level is constructed, as shown in Table 1 below. The establishment of green urbanization level indexes depends on the four dimensions of economy, resources, ecology, and society. Under the overall perspective of green development, based on environmental carrying capacity, supported by policy, and driven by economic driving force and resource traction, green urbanization development is promoted [25]. In this paper, 25 evaluation factors are selected, among which the international general IPCC data with fixed coefficient and the weighted total value of coal, coke, kerosene, gasoline, diesel, fuel oil and natural gas consumption are adopted as carbon dioxide emissions [26].
Based on the panel data of nine provinces in the Yellow River Basin from 2006 to 2018, this paper uses the principal component analysis and factor analysis to obtain the comprehensive scores of green urbanization levels in nine provinces, as shown in Table 2 and Table 3. The scores of green urbanization level in the provinces of the Yellow River Basin are significantly different from 2006 to 2018. The overall trend is increasing year by year. It can be seen that people have gradually increased the emphasis on green development in recent years [27]. The scores of green urbanization level in Shandong Province are generally higher than those of other provinces. The level of green urbanization in western provinces needs to be further improved. Both results are in line with the reality of the Yellow River Basin. Because the new variables obtained by factor analysis are an internal analysis of each original variable, the results are more in accordance with the trend of green urbanization. Above all, this paper uses the results of factor analysis as the measure of green urbanization level.

3.2. Dynamic Panel Data Analysis

New-type urbanization takes population urbanization as its core, economic growth, and takes ecological environment as the main goal. It is essentially related to the level of technological innovation, education, openness, and urban size [28]. Table 4 shows the specific indexes selected in the model. The level of economic development employs the GDP per capita as an explaining variable. The floating population is an important part of China’s economic contribution. The industrial structure uses the ratio of the added value of the secondary industry to the GDP. Many provinces in the Yellow River Basin are still in the transition period from industrial society to post-industrial society. The developed secondary industry is representative [29]. The level of technological innovation is represented by the intensity of R&D funding. Social research and experimental development are conducive to improving the level of regional green urbanization. Foreign direct investment (FDI) uses the total investment of foreign enterprises as explaining variable. The pollution haven effect of FDI needs to be further tested. The number of years of education per person is the symbol of the educational level. The popularity of education affects the development of talents and even the region. The strength of environmental regulations is expressed by the proportion of industrial pollution source treatment investment in environmental pollution treatment investment. Environmental special investment has direct influences on the level of green urbanization in the region. The degree of opening uses the total amount of imports and exports to represent. The development of international trade affects the level of green urbanization through scale effects, technical effect, and structural effects. Urban size is the proportion of increase in the urban population. Population size is the most significant feature of urban size.
Combining the two model theories of DIF-GMM and SYS-GMM, the panel data of 9 provinces in the Yellow River Basin was estimated by STATA in order to perform regression analysis. The regression results of the factors affecting the green urbanization level are shown in Table 5 below. The analysis results of both models passed the Wald test and Sargan test. The urbanization level in the lag period presents a significant positive effect. There are two variables that are not significant in both model estimated results, which meets the experimental standards. The number of eight variables that are positively and negatively correlated with the level of green urbanization in the DIF-GMM analysis is half, which is more in line with the reality of the Yellow River Basin. Compared with the SYS-GMM, the DIF-GMM has a significantly higher second-order lag term. That is why the DIF-GMM model is more reasonable and can more accurately reflect the dynamic regression relationship between the level of green urbanization and various indexes [30].

4. Discussion of Results

4.1. Green Urbanization Level

Judging from the dynamic evolution of the levels of green urbanization in the nine provinces in the Yellow River Basin, the level of green urbanization in all provinces has significantly improved. In particular, the green urbanization level score of Inner Mongolia increased by 239% from 37.5 in 2006 to 87.09 in 2018. It was always been ranked in the middle and upper reaches. During the study period, the average growth rate of the nine provinces is about 97%. The improvement of green urbanization level scores in Sichuan Province is the least, and the ranking has changed significantly. Its green urbanization level score in 2006 was 69.54, they fell 42% to 40.51 in 2015, and then rose 145.3% to 99.38 in 2018, showing a V-shaped trend, which is inseparable from the introduction and implementation of the Belt and Road policy [31]. In addition, the scores of green urbanization level in Sichuan and Shandong provinces remained at 1.1–3 times that of other provinces in 2006. There is relatively limited room for improvement in their green urbanization levels. In terms of stages, the level of green urbanization in the provinces of the Yellow River Basin has increased rapidly, and the overall trend is increasing. It can be seen that the provinces in the Yellow River Basin have paid more and more attention to green development in the last 10 years and have achieved remarkable results.
From the perspective of the spatial differentiation of the green urbanization level, it can be seen from Figure 1 that the green urbanization level scores in different provinces in the Yellow River Basin are significantly different. From 2006 to 2018, the difference between the highest value and the lowest value in each province is stable between 30–45. There has been no trend of increasing and decreasing. Judging from the average value of the level of green urbanization, all provinces have gradually and steadily increased. However, the average value of eastern provinces is significantly higher than that of central and western provinces. The average value of central provinces is higher than that of western provinces. Moreover, Shandong Province is the only eastern province in the Yellow River Basin. It has a relatively high level of economic development, with a per capita GDP from 23,546 yuan (2953.66 USD) per capita in 2006 to 76,267 yuan (11,525.22 USD) per capita in 2018. The green urbanization level score of Shandong Province has increased by 55.27% from 61.85 to 96.04. It ranks among the top two provinces in the Yellow River Basin. It is a pioneer in advancing green urbanization and insists on promoting new-type urbanization with the concept of green development [32]. Central provinces have relatively stable levels of green urbanization from 2006 to 2018, which is inseparable from the resource-intensive provinces in Shanxi and Henan. While vigorously developing the economy, we should also take the ecological benefits into account. The gap between western provinces is large. The scores of green urbanization level in Sichuan are significantly higher than those in other western provinces, which have greatly improved between 2006 and 2018. The other western provinces are affected by the relatively weak economic development.
In terms of the regional convergence of green urbanization, the standard deviation of the green urbanization level in the Yellow River Basin remained basically stable from 2006 to 2018. The level of green urbanization in all provinces has steadily improved. The standard deviation of the central provinces remained between 3 and 5, while the standard deviation of the western provinces remained between 9 and 15. It can be seen that the development of green urbanization in the central provinces is relatively stable. And it cannot be separated from the pollution prevention and control efforts of resource-intensive industries in recent years [33]. Regarding to the coefficient of variation, from 0.33 in 2006 to 0.14 in 2018, the coefficient of variation in all provinces gradually decreased, showing a trend of convergence. The coefficients of variation of central provinces ranged from 0.11 in 2006 to 0.04 in 2018. In addition, the coefficients of variation of western provinces decreased from 0.37 to 0.16. The overall trend is the same, showing a convergence trend. All in all, the scores of green urbanization level in the provinces of the Yellow River Basin increased gradually and steadily from 2006 to 2018. From a geographical point of view, the scores of green urbanization level in eastern provinces are higher than those in central and western provinces. Overall, the differences between green urbanization levels in central and western provinces are small. However, the intra-group differences of western provinces are greater than those of central provinces, showing that the level of green urbanization in the central and western regions lags behind the eastern regions.

4.2. Analysis of Influencing Factors

Through the significance test and interaction analysis of explaining variables; the simultaneous change characteristics of the response variable green urbanization level in different explaining variables can be obtained. Looking at the lagging terms of the level of green urbanization; the lagging terms of the level of green urbanization present a significant positive effect. And the marginal utility of the first lag is higher than that of the second lag. This shows that the level of green urbanization in the Yellow River Basin has a significant cumulative advantage; that is; the increasing “inertia” in the Matthew effect [34]. A higher level of green urbanization means that in the past production activities; economic development and ecological benefits have a good degree of matching. What is more, for the Yellow River Basin and even the Chinese government, it is necessary to improve the support for ecological civilization construction and the ability to control environmental pollution on the basis of insisting on economic development. Maintaining the sustainability of relevant policies can ensure the stability of the development of green urbanization in the Yellow River Basin [35]. However, this does not mean that provinces with low scores of green urbanization level cannot catch up. Local governments and enterprises in the Yellow River Basin need to make efforts in technological innovation and pollution control.
GDP per capita is positively correlated with the level of green urbanization, indicating that the level of economic development has a positive impact on the level of green urbanization in the region. The per capita GDP of Gansu Province increased by nearly 38.7% from 8749 yuan (1097.49 USD) per capita in 2006 to 31,336 yuan (4735.39 USD) per capita in 2018. Gansu Province, which has a low level of economic development, also scores low on the level of green urbanization. In the same way, Shandong Province, with a higher level of economic development, has higher scores on green urbanization. This confirms the positive relationship between the level of economic development and the level of regional green urbanization. With the economic growth of the Yellow River Basin, people’s income has increased. People used to pursue purely the growth of material wealth. But now they pay more attention to the quality of the ecological environment, which promotes the development of green urbanization to a certain extent [36]. Some experts hold the view that economic growth is inseparable from the enrichment of human resources, which in turn has the effects of population agglomeration and industrial agglomeration and promotes technological progress and industrial upgrading [37]. Therefore, to some extent, economic growth means a reasonable economic development model and a high level of technological innovation, laying a solid foundation for green development. In general, while improving the level of economic development in the Yellow River Basin, we should pay attention to the harmonious development of the economy and the environment. It is important to improve relevant laws and regulations related to green environmental protection and raise citizens’ environmental awareness. In the process of economic development, priority should be given to the development of high-efficiency and low-pollution industries to promote the steady improvement of regional green urbanization.
From the perspective of industrial structure, the proportion of the added value of the secondary industry to regional GDP is negatively related to the level of green urbanization. The evolution of industrial structure is the main source of driving force for new-type urbanization development. The greater the proportion of the added value of the secondary industry in the regional GDP, the greater the proportion of the secondary industry in the total industrial development. It shows that most provinces in the Yellow River Basin are in the transition period from an industrial society to a post-industrial society. The secondary industry of them is more developed. A large number of heavy industries inevitably produce environmental pollution problems [38]. Comparing the industrial structure of the provinces in the Yellow River Basin, it can be seen that the proportion of high-tech industries in Sichuan, Shaanxi, and Henan accounts for about 20% of GDP, while other provinces are all below 10%. The industrial structure of the provinces in the Yellow River Basin needs to be adjusted and upgraded urgently. The rationalization of the industrial structure is conducive to the improvement of the level of green urbanization. Therefore, we should encourage adjustment and upgrade of the industrial structure, vigorously develop the tertiary industry and green environmental protection industry. Then the green development of the industry in the Yellow River Basin will be promoted.
The intensity of R&D investment is positively correlated with the level of green urbanization, indicating that the level of technological innovation has an important positive effect on the development of green urbanization. Technological innovation is an effective way to ease resource constraints and environmental pressures. The higher the level of technological innovation is, which means a more advanced mode of production, the higher the utilization rate of resources will be. This can not only effectively alleviate the current situation of large energy loss, but also reduce the environmental pollution while promoting rapid economic development. It plays an important role in promoting the green development of industries in the Yellow River Basin. In addition, many experts have long pointed out that technological progress is the main source of economic growth [39]. The Yellow River Basin is in an important period of industrialization and urbanization. Strengthening the development of high-tech industries is an effective measure to improve the level of green urbanization in the region [40]. Therefore, it is necessary to increase investment in research and development of innovative technologies, accurately implement technological innovation funds dedicated to reducing pollutant emissions and saving resources in various regions. We should increase the introduction of innovative technologies and talents and encourage technological innovation activities.
The trade situation represents the degree of opening up in this paper. The degree of opening up is positively correlated with the level of green urbanization. However, it failed the significance test, indicating that this positive effect was not significant. Import and export trade affect the resources, talents, and technology of the region. The introduction of advanced talents, production experience, and technology through knowledge transfer have significant influences on the optimal allocation of production factors and resources in various places, thereby improving China’s education level, technological innovation level, and economic development [41]. However, many provinces in the western part of the Yellow River Basin have been relatively closed for a long time. The degree of opening is not high, which means foreign exchange is not extensive enough. The scale of foreign trade is quite small. Besides, their trade is dominated by processing trade, with a high degree of dependence on foreign trade. Most export products are industrial products with high energy consumption [42]. At present, the Yellow River Basin provinces are accelerating the pace of opening and strictly implementing the environmental access system of the Yellow River Basin. We should make reasonable arrangements for regional industrial division and cooperation, promote economic exchanges and cooperation. It is inevitable to improve the quality of opening up, which promotes the development of regional economy and green urbanization.
In terms of education level, the number of years of education per capita is negatively correlated with the level of green urbanization. It means that a higher number of years of education per capita does not effectively promote the development of regional green urbanization. Strengthening the country by talents is one of China’s important development strategies. The majority of scholars already proved that the improvement of technological innovation level can only be achieved with high-quality talents as the carrier [43]. Many provinces in the Yellow River Basin, such as Shaanxi and Henan, have a large number of schools and students. Their education has achieved a high degree of popularity. The average years of education in the Yellow River Basin in 2018 was 8.96. However, the quality of talents is not high due to the low quality of higher education, which also causes serious brain drain [44]. We should increase investment in education funding and focus on training high-tech talents. Taking talent exchange and scientific research cooperation as measures, it is essential to promote effective communication in the areas of science, education, technology, and green development between the Yellow River Basin and other domestic provinces. Eventually, the quality of the population that will support green urbanization will be achieved, which will in turn drive regional green urbanization.
The intensity of environmental regulation is negatively correlated with the level of green urbanization. However, it is not significant. This shows that the current positive effect of environmental pollution treatment investment on improving regional environmental quality has not yet been shown. Besides, the current efficiency of special environmental funds is not high and has acted in promoting the development of green urbanization. The provinces in the Yellow River Basin are dominated by the central and western provinces. Many of these provinces have serious environmental pollution caused by resource-intensive enterprises with high input and low output. The higher the special investment in industrial pollution source treatment investment in environmental pollution treatment investment, the greater the possibility of a corresponding reduction in environmental pollution. After that, regional green development will be promoted [45]. Therefore, the relevant institutional environment should be reasonably arranged and implemented to restrict the development of high energy consumption and high pollution industries. It is essential to carry out differentiated environmental access measures for each region. The investment structure of pollution control needs to be improved to achieve precise control. On this basis, green innovation is promoted by high-pollution enterprises by improving the utilization efficiency of special environmental funds [46].
There is a negative correlation between FDI and the level of green urbanization, which does not mean that the opening up and the development of green urbanization are mutually restricted. Rather, while opening up to the outside world promotes the development of urbanization, it also brings pollution haven effects. The haven effect of pollution means that the green production technology propagated by advanced technology foreign-invested enterprises can effectively improve the level of green urbanization. It indicates that the source country of foreign capital establishes its own pollution-intensive enterprises in countries or regions with relatively low environmental standards [47]. Foreign investment is an important driving force for regional economic development. The inflow of foreign capital attracts more resources and labor and promotes the development of labor-intensive and resource-intensive industries. Studies have shown that, for the Yellow River Basin, FDI brings more environmental pollution problems, which cause irreversible damage to China’s environment. The development of regional green urbanization is hindered [48]. Therefore, pollution-intensive enterprises in foreign-funded enterprises in less developed regions should be eliminated. It is inevitable to strengthen the screening of foreign companies entering China and raise the environmental access standards in less developed regions. Guiding FDI into green industries such as the tertiary industry and high-tech industries plays an important role in the green transformation of regional urbanization.
From the perspective of urban size, the proportion of urban population growth is positively related to the level of green urbanization. It means that the improvement of urbanization rate is conducive to the development of green urbanization. In recent years, the urbanization rate of the Yellow River Basin has been increasing year by year. The most intuitive feature of urban size is population size. The change of population size directly acts on the change of urban size. The urbanization rate reflects the agglomeration effect of urban population. At the same time, population agglomeration is conducive to the accumulation of capital and other factors. The continuous expansion of cities not only promotes the process of urbanization, but also plays a subtle part in promoting the development of green urbanization [49]. As for the urban size, “the bigger, the better” is not a correct expression. The disorderly expansion of cities will increase the pressure on land resources, water resources and energy. It will also increase life-type environmental pollution, resulting in continuous deterioration of the regional ecological environment quality. Only a reasonable urban size and urban population can promote the improvement of green urbanization. The government’s guiding role should be brought into play for scientific control [50].

5. Conclusions

In the context of new-type urbanization, green development has become an inevitable choice for high-quality development in the Yellow River Basin. For implementing the international conventions on environmental protection and participating in global environmental governance, this paper grasps the development trend and inter-regional differences in green urbanization level in the Yellow River Basin. In order to implement the principle of ecological priority and green development, this paper explores the relationship between its influencing factors and the development of green urbanization. It has important practical value to make up for the shortcomings of environmental pollution in the development of new-type urbanization and promote sustainable development in the Yellow River Basin. The paper selected evaluation indicators of environmental carrying capacity, policy support, economic driving force and resource traction. Relevant data of nine provinces in the Yellow River Basin from 2006 to 2018 were also collected. Principal component analysis and factor analysis models were used to measure and evaluate the level of green urbanization in each province. The research results show that from the perspective of the dynamic evolution of the level of green urbanization, the scores of green urbanization level in the provinces of the Yellow River Basin are increasing rapidly, and the overall trend is increasing. In terms of spatial differentiation of green urbanization levels, the levels of green urbanization in the provinces of the Yellow River Basin are significantly different. Due to economic, resource and other gaps between provinces, the level of green urbanization in eastern provinces was significantly higher than in central and western provinces. The green urbanization level of central provinces were higher than western provinces from 2006 to 2018. Regarding to the inter-regional convergence of green urbanization level, the green urbanization level of the Yellow River Basin from 2006 to 2018 has been steadily increased by provinces. The overall trend is the same, showing a trend of convergence.
This paper also used a dynamic panel estimation model. The influencing factors of the eight dimensions of economic development level, industrial structure, technological innovation level, FDI and education level on the factors affecting green urbanization in the Yellow River Basin were estimated. In this paper, relevant data of provinces in the Yellow River Basin from 2006 to 2018 were selected for the DIF-GMM and the SYS-GMM. From the regression results, the DIF-GMM is more appropriate. Specifically, the level of economic development effectively promotes the development of green urbanization. The rapid development of the secondary industry will inevitably lead to environmental pollution problems. It reacts on the level of green urbanization. The level of technological innovation can improve resource utilization and promote the green development of industries in the Yellow River Basin. FDI has a negative correlation with the level of green urbanization, which is in line with the effect of pollution haven. The inflow of foreign capital will cause regional environmental pollution and hinder the development of regional green urbanization. As a result of brain drain, the improvement of education level cannot simultaneously improve the level of green urbanization. The reaction of the intensity of environmental regulation on the level of green urbanization is not significant, which indicates that the utilization efficiency of environmental special funds is not high at present. Due to the two-sided nature of foreign trade, environmental pollution problems often arise. That is why the degree of opening represented by foreign trade has no significant positive impact on the level of green urbanization. The urban size is positively related to the level of green urbanization. To some degree, the improvement of urbanization rate is conducive to the agglomeration of capital and other elements, so as to improve the level of green urbanization.
In view of the above conclusions, we should promote the development of green urbanization in the Yellow River Basin from the following aspects. First, we should comprehensively promote the construction of new-type urbanization, adhere to the principle of giving consideration to ecological benefits while developing the economy, and then vigorously develop the tertiary industry. Only by accelerating industrial transformation and upgrading, the green development will be more possible to achieve. Second, we should master the spatial differences and development status of green urbanization level in the Yellow River Basin, develop strengths and make up weaknesses, and then formulate green development strategies with regional characteristics according to time and place. Third, the government should strengthen the cooperation between scientific and technological innovation and environmental governance, thus improving the level of scientific and technological innovation. It is important to improve the utilization efficiency of special environmental funds so that the green innovation of high polluting enterprises will be improved. Fourth, we should focus on training high-tech talents and improve the quality of higher education. By forming the population quality supporting the green urbanization construction, we can avoid brain drain and promote the regional green development. Fifth, strictly implement the environmental access system of the Yellow River Basin and restrict the flow of FDI to the “three high and one low” industries with “high input, high consumption, high pollution and low efficiency.” There are requirements to guide FDI into the high-tech and green fields and improve the quality of opening up. Giving full play to its positive impact on the high-quality opening is quite significant. Last but not least, it is essential to control the urban size in a scientific way and the flow of population and resources in a reasonable way. The development of regional green urbanization can be promoted by arranging the division and cooperation of regional industries reasonably.
However, there are many unconsidered places in future research that are worth exploring and discussing. The factors that influence the level of green urbanization in the region should be further explored. Dialectical research is needed on the role of foreign trade and FDI in the development of green urbanization. On the one hand, we must affirm the positive impact of foreign trade in promoting the introduction of advanced talents, production experience and technology. On the other hand, FDI has caused pollution evacuation effects and hindered the development of green urbanization. Therefore, the quality of opening to the outside world should be included in the evaluation process of green urbanization, in order to formulate more precise policies for the new-type urbanization development in the Yellow River Basin. In addition, industrial structure, education level, and environmental regulations may have different effects on the development of green urbanization at different stages of economic development. Therefore, it is better to study threshold effects and explore specific action directions in different economic periods. These questions will be answered in future research.

Author Contributions

Conceptualization, L.S. and R.D.; Formal analysis, Z.C. and R.D.; Funding acquisition, L.S.; Investigation, Q.X.; Project administration, X.D.; Software, R.D. and Q.X.; Supervision, X.D.; Validation, Z.C.; Writing—original draft, L.S. and Z.C.; Writing—review and editing, X.D. All authors have read and agreed to the published version of the manuscript.

Funding

This research was supported by the Social Science Foundation of Jiangsu Province (18GLC002), the National Natural Science Foundation of China (71603071), the National Social Science Foundation of China (16CJY018), and the Soft Science of Key R&D and Promotion Special Project of Henan Province (192400410104).

Conflicts of Interest

The authors declare no conflict of interest.

References

  1. Ren, K.Q.; Nie, W. Management of Environment Crisis and Green Urbanization Strategy. Chongqing Soc. Sci. 2014, 8, 15–22. [Google Scholar]
  2. Wang, S.Y.; Liu, J.S.; Yang, C.J. Eco-Environmental Vulnerability Evaluation in the Yellow River Basin. Pedosphere 2008, 2, 171–182. [Google Scholar] [CrossRef]
  3. Chen, Y.; Wang, W.T.; Fan, Y. A Review of the Research on the Evaluation of Regional Low-carbon Economy Development. China Popul. Resour. Environ. 2013, 23, 124–130. [Google Scholar]
  4. Khoshnava, S.M.; Rostami, R.; Zin, R.M.; Štreimikienė, D.; Yousefpour, A.; Strielkowski, W.; Mardani, A. Aligning the Criteria of Green Economy (GE) and Sustainable Development Goals (SDGs) to Implement Sustainable Development. Sustainability 2019, 11, 4615. [Google Scholar] [CrossRef] [Green Version]
  5. Chen, D.D.; Sun, D.Q. Development and Management Tasks of the Yellow River Basin:A Preliminary Understanding and Suggestion. Acta Geogr. Sin. 2019, 74, 2431–2436. [Google Scholar]
  6. Song, M.; Hu, C. A Coupling Relationship between the Eco-Environment Carrying Capacity and New-Type Urbanization: A Case Study of the Wuhan Metropolitan Area in China. Sustainability 2018, 10, 4671. [Google Scholar] [CrossRef] [Green Version]
  7. Huang, M.H.; Hui, Q. A Pastoral City? A Garden City? Re-understanding of Howard’s Garden City. City Plan. Rev. 2018, 42, 9–17. [Google Scholar]
  8. Yang, Z.S.; Cheng, Z.; Li, M.G.; Lin, J. Green Urbanization: International Experiences and Implications. Urban Environ. Stud. 2018, 1, 66–77. [Google Scholar]
  9. Dong, Z.F.; Yang, C.Y.; Wu, Q.; Gao, L.; Ge, C.Z. Study on the Strategic Framework of Chinese New Green Urbanization. Ecol. Econ. 2014, 30, 79–82. [Google Scholar]
  10. Fay, M.; Wang, J.Z.; Draugelis, G.; Deichmann, U. Role of Green Governance in Achieving Sustainable Urbanization in China. China World Econ. 2014, 22, 19–36. [Google Scholar] [CrossRef]
  11. Xiao, J.C.; Wang, L. Research on Green Urbanization under the Belt and Road Initiative. Environ. Prot. 2017, 45, 25–30. [Google Scholar]
  12. Gu, S.Z.; Li, X.; Wu, H.J. Strategic Thinking on Promoting the Development of Green Urbanization in New Era. J. Beijing Technol. Bus. Univ. Soc. Sci. 2018, 33, 107–116. [Google Scholar]
  13. Watanabe, M.; Tanaka, K. Efficiency analysis of Chinese industry: A directional distance function approach. Energy Policy 2007, 35, 6323–6331. [Google Scholar] [CrossRef]
  14. Ding, H.Y. Measurement of Comprehensive Development Level of New Urbanization in Coastal Areas. Stat. Decis. 2019, 35, 50–53. [Google Scholar]
  15. Xu, Q.; Fang, S.; Ma, L. New urbanization, upgrading of industrial structure and China’s economic growth-Empirical research based on spatial spillover and threshold effect. Syst. Eng. -Theory Pract. 2019, 39, 1407–1418. [Google Scholar]
  16. Zou, H.X.; Liu, K.; Ren, J.L. Temporal and spatial pattern evolution of green urbanization in Shandong Province. World Reg. Stud. 2017, 26, 78–85. [Google Scholar]
  17. Liu, C.L.; Wang, T.; Guo, Q.B. Factors Aggregating and the Regional Differences among China Urban Agglomerations. Sustainability 2018, 10, 4179. [Google Scholar] [CrossRef] [Green Version]
  18. Sun, D.S. Discussion on the Relationship between Principal Component Analysis and Factor Analysis and Software Implementation. Stat. Decis. 2008, 13, 153–155. [Google Scholar]
  19. Bao, C.; Chen, X.J. Spatial Econometric Analysis on Influencing Factors of Water Consumption Efficiency in Urbanizing China. J. Geogr. Sci. 2017, 27, 1450–1462. [Google Scholar] [CrossRef] [Green Version]
  20. Li, M.; Du, P.C. Research on the Differences of Regional Green Sustainable Innovation Capability in the Yangtze River Economic Belt. East China Econ. Manag. 2018, 32, 83–90. [Google Scholar]
  21. Lee, L.F.; Yu, J. A Spatial Dynamic Panel Dada with both Time and Individual Fixed Effects. Econom. Theory 2010, 26, 564–597. [Google Scholar] [CrossRef] [Green Version]
  22. Hakimi, A.; Inglesi-Lotz, R. Examining the Differences in the Impact of Climate Change on Innovation between Developed and Developing Countries: Evidence from a Panel System GMM Analysis. Appl. Econ. 2019, 1690126. [Google Scholar] [CrossRef]
  23. Zhang, Q.; Wang, K.P.; Li, D.L.; Lin, L. GMM and Misspecification Correction for Misspecified Models with Diverging Number of Parameters. Acta Math. Appl. Sin. 2019, 35, 780–797. [Google Scholar] [CrossRef]
  24. Zhang, G.S. Green Urbanization of China: Framework and Path Selection. J. Harbin Inst. Technol. Soc. Sci. Ed. 2018, 20, 123–131. [Google Scholar]
  25. Feng, K.; Jia, L.Y. Development Direction and Policy Focus of China’s Green Urbanization. Econ. Rev. 2016, 7, 27–32. [Google Scholar]
  26. Zhang, H.; Wei, X.P. Green Paradox or Forced Emission-reduction: Dual Effect of Environmental Regulation on Carbon Emissions. China Popul. Resour. Environ. 2014, 24, 21–29. [Google Scholar]
  27. Yang, H.R.; Zheng, H.; Liu, H.G.; Wu, Q. Non-Linear Effects of Environmental Regulation on Eco-Efficiency under the Constraint of Land Use Carbon Emissions: Evidence Based on a Bootstrapping Approach and Panel Threshold Model. Int. J. Environ. Res. Public Health 2019, 16, 1679. [Google Scholar] [CrossRef] [Green Version]
  28. Mao, Y.B.; Yuan, Y.K. An Empirical Study of the Impact of New Green Urbanization on Economic Growth. J. Shanghai Univ. Soc. Sci. Ed. 2014, 8, 15–22. [Google Scholar]
  29. Wu, H.T.; Hao, Y.; Weng, J.H. How does energy consumption affect China’s urbanization? New evidence from dynamic threshold panel models. Energy Policy 2019, 127, 24–38. [Google Scholar] [CrossRef]
  30. Shao, Q.L.; Li, J.Y.; Zhao, L.L. A Four-Dimensional Evaluation of the Urban Comprehensive Carrying Capacity of the Yangtze River Delta, China. Sustainability 2019, 11, 6816. [Google Scholar] [CrossRef] [Green Version]
  31. Gu, J.H.; Li, M.; Yang, L.L. Study on the System Coupling Coordination Evolution and Spatio-temporal of Low-carbon Green New Urbanization in China. Chin. J. Syst. Sci. 2019, 27, 86–92. [Google Scholar]
  32. Yang, Y.; Huang, C.; He, C.Y.; Huang, Q.X. The Spatiotemporal Dynamics of New-Type Urbanization Comprehensive Level in Shandong Peninsula Urban Agglomeration. Econ. Geogr. 2017, 37, 77–85. [Google Scholar]
  33. Zhang, G.S. Construction of the Yellow River Economic Belt: Significance, Feasibility and Path Selection. Econ. Probl. 2019, 7, 123–129. [Google Scholar]
  34. Pereira, M.; Suarez, D. Matthew Effect, Capabilities and Innovation Policy: The Argentinean Case. Econ. Innov. New Technol. 2018, 27, 62–79. [Google Scholar] [CrossRef]
  35. Wang, X.L.; Shao, Q.L. Non-linear effects of heterogeneous environmental regulations on green growth in G20 countries: Evidence from panel threshold regression. Sci. Total Environ. 2019, 660, 1346–1354. [Google Scholar] [CrossRef]
  36. Kim, S. The Effects of Foreign Direct Investment, Economic Growth, Industrial Structure, Renewable and Nuclear Energy, and Urbanization on Korean Greenhouse Gas Emissions. Sustainability 2020, 12, 1625. [Google Scholar] [CrossRef] [Green Version]
  37. Xie, Q.H.; Yang, G.S. Measurement of China’s Regional Green Development Efficiency under the Background of New Urbanization. Stat. Decis. 2019, 35, 132–136. [Google Scholar]
  38. Zhao, J.J.; Liu, Y.; Zhu, Y.K.; Qin, S.L.; Wang, Y.H.; Miao, C.H. Spatiotemporal differentiation and influencing factors of the coupling and coordinated development of new urbanization and ecological environment in the Yellow River Basin. Resour. Sci. 2020, 1, 1–13. [Google Scholar]
  39. Zhou, Y.Y.; Xu, Y.R.; Liu, C.Z.; Fang, Z.Q.; Guo, J.Y. Spatial Effects of Technological Progress and Financial Support on China’s Provincial Carbon Emissions. Int. J. Environ. Res. Public Health 2019, 16, 1743. [Google Scholar] [CrossRef] [Green Version]
  40. Li, C.; Li, M.; Zhang, L.; Li, T.; Ouyang, H.; Na, S. Has the High-Tech Industry along the Belt and Road in China Achieved Green Growth with Technological Innovation Efficiency and Environmental Sustainability? Int. J. Environ. Res. Public Health 2019, 16, 3117. [Google Scholar] [CrossRef] [Green Version]
  41. Zhao, L.D.; Yuan, T.; Zhao, Z.B. Threshold effect between urbanization and green development performance. J. Arid Land Resour. Environ. 2019, 33, 10–16. [Google Scholar]
  42. Ding, X.H.; Fu, Z.; Jia, J.H. Study on Urbanization Level, Urban Primacy and Industrial Water Utilization Efficiency in the Yangtze River Economic Belt. Sustainability 2019, 11, 6571. [Google Scholar] [CrossRef] [Green Version]
  43. Pang, Q.H.; Yang, T.T.; Li, H. The Spatial Relationship between Urban Carbon Emissions, Industrial Structure and Regional Innovation—An Analysis Based on the Data from 13 Prefecture-level Cities in Jiangsu Province. East China Econ. Manag. 2018, 32, 20–26. [Google Scholar]
  44. Yi, X.H.; Liu, J.D. Evaluation of Ecological Efficiency in Western China and Analysis of Its Influencing Factors. Stat. Decis. 2020, 36, 105–109. [Google Scholar]
  45. Jin, W.; Zhang, H.Q.; Liu, S.S.; Zhang, H.B. Technological innovation, environmental regulation, and green total factor efficiency of industrial water resources. J. Clean. Prod. 2019, 211, 61–69. [Google Scholar] [CrossRef]
  46. Zhang, G.J.; Deng, M.Y.; Yao, Y.Y.; Li, X.Y. Comprehensive level of the green development of industry in Guangdong province and spatial econometric analysis of the influencing factors. J. Nat. Resour. 2019, 34, 1593–1605. [Google Scholar]
  47. Li, W.H.; Li, C.; Huang, W.C.; Dong, C.J. Effect of environmental regulation on the manufacturing FDI in China: Spatial econometric studies. Bulg. Chem. Commun. 2017, 49, 26–31. [Google Scholar]
  48. Ding, X.H.; Tang, N.; He, J.H. The Threshold Effect of Environmental Regulation, FDI Agglomeration, and Water Utilization Efficiency under “Double Control Actions”—An Empirical Test Based on Yangtze River Economic Belt. Water 2019, 11, 452. [Google Scholar] [CrossRef] [Green Version]
  49. Lin, W.Q.; Wu, M.H.; Zhang, Y.; Zeng, R.J.; Zheng, X.J.; Shao, L.; Zhao, L.Y.; Li, S.X.; Tang, Y. Regional differences of urbanization in China and its driving factors. Sci. China Earth Sci. 2018, 61, 778–791. [Google Scholar] [CrossRef]
  50. Sun, P.J.; Song, W.; Xiu, C.L.; Liang, Z.M. Non-coordination in China’s Urbanization: Assessment and Affecting Factors. Chin. Geogr. Sci. 2013, 23, 729–739. [Google Scholar] [CrossRef] [Green Version]
Figure 1. The graduated color figures of green urbanization level scores of the Yellow River Basin in (a) 2006, (b) 2010, (c) 2014, and (d) 2018.
Sustainability 12 02488 g001
Table 1. Evaluation index system of green urbanization in the Yellow River Basin.
Target Evaluation Index Evaluation Factor
Green UrbanizationEconomic DriverGDP per capita X 11 ,
Per capita disposable Income of urban resident X 12 ,
Local fiscal expenditure per capita X 13 ,
Growth rate of fixed assets investment in society X 14 ,
Proportion of urban population X 15 ,
Proportion of high-tech industries to GDP X 16 ,
Proportion of GDP in tertiary industry X 17
Resource TractionWater resources per capita X 21 ,
Urban green space per capita X 22 ,
Wetland area per capita X 23 ,
Construction land per capita X 24 ,
Energy consumption per capita X 25 ,
Energy consumption per unit of GDP X 26
Environmental Carrying CapacityUrban sewage discharge X 31 ,
Sulfur dioxide emissions from urban living X 32 ,
Comprehensive utilization rate of industrial solid waste X 33 ,
Total industrial wastewater discharge X 34 ,
Dust emissions from urban life X 35 ,
Carbon dioxide emissions X 36
Policy SupportProportion of energy saving and environmental protection expenditure in fiscal expenditure X 41 ,
Total investment in environmental pollution treatment as a percentage of GDP X 42 ,
Proportion of planted area to total area X 43 ,
Municipal wastewater treatment rate X 44 ,
Green coverage in built-up areas X 45 ,
Harmless treatment rate of municipal solid waste X 46
Note: Data from “China Statistical Yearbook” and “China Energy Statistical Yearbook.”
Table 2. Comprehensive scores of green urbanization level based on principal component analysis.
Province2006200720082009201020112012201320142015201620172018
Sichuan64.2362.7561.4459.7858.2557.9254.6754.2152.1350.0666.7668.2569.93
Gansu49.4250.0750.8052.3654.6756.2960.1263.5065.2167.0567.9972.0272.37
Ningxia65.6669.8468.8370.7975.8578.2681.2584.9186.6686.7289.2089.9491.92
Inner Mongoria62.3864.7068.2371.6377.5881.7984.9484.5589.0489.3489.7591.6494.11
Shaanxi52.5754.2756.4858.5861.7364.1367.0969.6972.7374.9276.5376.1677.40
Shandong68.9671.6873.7575.6176.9880.0482.1383.6485.7586.9687.3388.4089.85
Shanxi61.7963.5666.5767.9670.1371.8274.9276.6379.3680.3083.8784.9784.22
Henan54.4656.0860.5762.2963.1064.9365.6767.5069.5570.9171.2573.3974.51
Qinghai50.1552.2353.6152.8255.4160.9961.8964.9066.2268.2670.8972.6074.58
AVG58.85 60.58 62.25 63.54 65.97 68.46 70.30 72.17 74.07 74.95 78.17 79.71 80.99
SD7.26 7.74 7.69 8.39 9.33 9.78 10.87 10.87 12.20 12.56 9.42 8.97 9.17
CV0.12 0.13 0.12 0.13 0.14 0.14 0.15 0.15 0.16 0.17 0.12 0.11 0.11
Table 3. Comprehensive scores of green urbanization level based on factor analysis.
Province2006200720082009201020112012201320142015201620172018
Sichuan69.5467.2864.1460.8157.8556.7649.8049.4044.0040.5172.8675.4299.38
Gansu29.1129.0131.4934.0535.5040.2144.3548.2252.7655.6058.1967.1866.19
Ningxia35.1238.8339.1045.3952.7452.4959.4263.9666.7567.8071.9273.8176.50
Inner Mongoria37.5043.0647.5453.4360.3665.7670.0072.3077.1977.8980.4983.4787.09
Shaanxi40.7741.8044.8647.1351.8357.7362.2265.4168.9372.4874.9175.4578.05
Shandong61.8566.4867.7471.8274.1278.6882.6984.2488.6291.7892.9594.9496.04
Shanxi37.5441.0044.8148.0752.3956.5960.0062.8967.2570.6471.0577.4674.35
Henan43.7447.8049.9653.7858.5363.1265.2268.4571.9274.8976.1277.7978.79
Qinghai29.5332.1733.1033.6437.4445.7849.4549.8454.5955.4759.6564.6968.50
AVG42.74 45.27 46.97 49.79 53.42 57.46 60.35 62.75 65.78 67.45 73.13 76.69 80.54
SD13.97 13.48 12.44 12.11 11.74 11.24 11.76 11.99 13.56 15.01 10.43 8.85 11.47
CV0.33 0.30 0.26 0.24 0.22 0.20 0.19 0.19 0.21 0.22 0.14 0.12 0.14
Table 4. Regression analysis indexes of green urbanization in the Yellow River Basin.
IndexExplaining Variable
Economic development levelGDP per capita y 1
Industrial structureProportion of the added value of the secondary industry to the regional GDP y 2
Technological innovation levelR&D investment intensity y 3
Foreign direct investmentTotal foreign investment y 4
Education levelYears of education per capita y 5
Environmental regulation strengthProportion of industrial pollution source treatment investment in environmental pollution treatment investment y 6
Degree of openingTotal imports and exports y 7
Urban sizeProportion of increase in urban population y 8
Note: Data from “China Statistical Yearbook” and Statistical yearbooks of 9 provinces in the Yellow River Basin.
Table 5. Green urbanization level dynamic panel regression results.
VariableEstimated CoefficientT Value P ValueEstimated CoefficientT Value P Value
DIF-GMMSYS-GMM
Explained VariableGreen urbanization levelGreen urbanization level
L10.48378.690.0000.77535.590.000
L20.08614.970.0010.01761.890.096
y10.00035.550.0000.00029.520.000
y2-5.7488−5.610.000−19.0625−20.030.000
y314.55844.190.0026.08830.810.439
y4-0.0027−5.860.000−0.0003−1.300.229
y5-1.7867−1.890.0921.62696.530.000
y6-2.1767−1.320.2191.02317.480.000
y70.05821.060.3160.03771.970.085
y83.99282.770.0225.85845.580.001
cons50.30912.610.0094.10681.990.082
Wald-test680.30.0001297.80.000
AR(1)−1.28260.200−2.12710.033
AR(2)0.92920.3831.39390.163
Sargan82.37230.406181.65360.223
Note: T value greater than 1.98 is a 0.05 significant level, while 2.62 is a 0.01 significant level.

