Article

Response of Potato (Solanum Tuberosum L.) Plants to Spraying by Hydrogen Peroxide

by
Ewa Szpunar-Krok
1,*,
Marta Jańczak-Pieniążek
1,
Karol Skrobacz
2,
Dorota Bobrecka-Jamro
1 and
Maciej Balawejder
2
1
Department of Crop Production, University of Rzeszow, 35-601 Rzeszów, Poland
2
Department of Food Chemistry and Toxicology, University of Rzeszow, 35-601 Rzeszów, Poland
*
Author to whom correspondence should be addressed.
Sustainability 2020, 12(6), 2469; https://doi.org/10.3390/su12062469
Submission received: 10 February 2020 / Revised: 12 March 2020 / Accepted: 17 March 2020 / Published: 21 March 2020
(This article belongs to the Special Issue Sustainable Development of the Bioeconomy—Challenges and Dilemmas)

Abstract

:
The biocidal properties of hydrogen peroxide (H2O2) could be used in plant protection. However, the effects of H2O2 foliar spraying on the performance of the potato photosynthetic apparatus are still unclear. A pot experiment was conducted to investigate the effect of foliar spraying, which was done twice, with various H2O2 concentrations (1, 3, 6, 12, and 18%) on the potato photosynthetic apparatus efficiency and antioxidant capacity. The measurements were taken four times: on the first and seventh day after each application. Foliar spraying with 1% H2O2 concentration was the most stimulating for the course of physiological processes in leaves. Further increased doses of H2O2 enhanced stress in plants which is manifested by a decrease in pigment levels, photosynthetic attributes, antioxidant capacity in leaves, and fresh mass above-ground parts of potato plants. The intensive effect of spraying was particularly observed on the first day after application, while later, the activity of the photosynthetic apparatus and antioxidant capacity increased. The study provides information that foliar spraying with 1% H2O2 can be taken into account in further research on the development of a potato plant protection methods.

1. Introduction

Concern for the state of the natural environment leads to an increased interest in environmentally friendly, non-toxic, and degradable biocides that could be used in plant protection. Such substance is H2O2: an oxidizing agent, topical, which decomposes to non-toxic by-products (water and oxygen). The medical use of 3% hydrogen peroxide (H2O2) concentration is common due to its antibacterial and antifungal activity. These properties could be also useful in plant cultivation. However, H2O2 as reactive oxygen species (ROS) could be harmful for living organisms. Recent studies show that ROS are not only a symptom of cellular dysfunction but can also play a part in signal transduction pathways in changing conditions [1]. In field conditions during their life cycle, plants are exposed to different biotic and abiotic stress factors. Evolution has developed mechanisms to adapt these organisms to environmental stressors, e.g., NO, H2S, and H2O2. On the other hand, plants developed stress tolerance regulatory mechanisms [2,3].
By-products of metabolic reactions (photosynthesis, photorespiration, and respiration) produced in plants during normal cell (aerobic) metabolism are ROS [4,5]. ROS can be found in radical and non-radical forms, which are more toxic because they are highly reactive. Radical forms include superoxide radical (O2•−), hydroxyl radical (OH), alkoxy radical (RO), and non-radical: hydrogen peroxide (H2O2), singlet oxygen (1O2) [6,7]. Overproduction and accumulation of ROS results from stresses (biotic and abiotic) and low activity of scavengers [8]. When the ROS levels are high, the damage process in plant cell is possible which can lead to plant destruction [9,10]. H2O2 could cause damage by oxidizing a variety of macromolecular targets, including those Calvin–Benson Cycle enzymes. Environmental stresses contribute to accumulation of ROS and can be a major cause of crop productivity loss [7,11].
H2O2 is produced in plant cells. Its level increases during stress situation and plays an important role in various physiological processes (senescence, stomatal movement, photorespiration, and photosynthesis) [11,12,13]. H2O2 is involved in the regulation of growth, development, and defense responses. It can also act as a signaling molecule and regulate stress adaptation and programmed cell death (PCD) [14,15]. The biological effect is dependent on the site of production, the developmental stage, previous occurrence of different kinds of stress, and on concentration. Low concentration of H2O2 can help plants with tolerance to biotic and abiotic stresses, but high concentration leads to PCD, which is important for developmental processes and environmental responses [10,11,16]. It is the second messenger and an important component of signal transduction cascade playing a part in plant adaptation in stress situation and protecting them [17]. This molecule is relatively stable compared to other ROS. Control over H2O2 diffusion is possible by changing its osmotic pressure. Then, it is transported across plasma membranes through specific channels—aquaporins [18,19]. H2O2 plays an essential role in signal mediating in stomatal closure, which is inducted by abscisic acid [17,20]. Pretreatment with H202 induces higher micro-tuberization, increases weight, and enhances the sprouting of microtubers [21]. López-Delgado et al. [22], based on research where potato plants were sprayed twice weekly, from 21 to 90 days after planting with 0.02 % or 0.17 % H2O2 concentrations, indicated that treatments significantly enhanced tuber starch accumulation by between 6.7% and 30%, and stems were up to 27% thicker, mainly due to enlarged medullar parenchyma cells, relative to control.
In a stress situation, e.g., in pathogen attack, plants develop several different defense strategies mediated by ROS [23,24]. ROS play two roles during plant-pathogen interactions. The first is pathogen limitation and death of plants’ cells at infection sites. The second is a signal distribution which induces defense responses to adjacent plant cells [25]. The earliest defense strategy in plants infected by pathogen is oxidative burst, which prevents plants from further spread of the infection inducted by pathogens [26,27,28]. H2O2 is involved in cell wall strengthening processes. The response to pathogen attack is connected with the enzymes of cell wall production which correlates with H2O2 synthesis [26]. It was observed that after fungal inoculation, lignin content in plant cells increased, thanks to which plants gain greater resistance. The fact of the biocidal properties of H2O2 may be used in plant protection [29]. The H2O2 application inhibited the growth of Septoria tritici on wheat plants [30]. However, the effectiveness of H2O2 depends on many factors, including concentration, exposure time, temperature, pH, and pathogen [31,32,33]. Bactericidal action is weaker compared to sporicidal action, but H2O2 is bacteriostatic at concentrations above 0.5% [34]. Depending on the bacterial strains (R. metallidurans, E. coli, S. oneidensis, or D. radiodurans), moderate to high physiological damage could be observed between 0.05% and 0.75% H2O2 [31], while other studies have shown that 1% H2O2 is the minimal concentration inhibiting the growth of C. acnes [35]. It was also demonstrated the efficacy of 1% H2O2 as a wash to decontaminate apples [36]. Sporicidal action H2O2 was obtained using a ~3% H202 concentration (the typical concentration topical sterilant solution) [34].
Due to vegetative propagation of potato through tubers, it is susceptible to pathogens transferred with seed potatoes. Wu et al. [37] showed that expression of a gene encoding H2O2 generating by transgenic potato plants confers resistance to bacterial as well as fungal pathogens. It was indicated that H2O2 as one of possible components of preparations can be used against late blight in organic potato production [38]. To prevent potato plant infestation by pathogens, farmers often perform several chemical plant protection treatments, which creates many threats to the natural environment.
The aim of this study was to assess the effect of foliar spraying with various H2O2 concentrations (1%, 3%, 6%, 12%, and 18%) on the potato plants (Solanum tuberosum L.) photosynthetic apparatus efficiency and to determine the safe dose that could be used in potato crop protection program.

2. Materials and Methods

2.1. Plant Material and Growth Conditions

The experiments were conducted at University of Rzeszow (Poland). Potato plants (Solanum tuberosum L. cv. Santé) were cultivated. Seed potatoes (mass approx. 7–8 g) with well-developed sprouts were placed in pots (15.5 × 15.5 cm, 3.5 kg of soil/pot), one plant in each pot. The experiments were conducted in four replications. Grain size distribution of the soil was determined using the granulometric method. Based on the analysis, the soil was classified as sandy loam (62% sand 0.05–2 mm, 32% silt 0.02–0.5 mm, 6% clay < 0.02 mm) [39]. Determinate TOC value was 4.8 ± 0.1 for utilized soil. Substrate moisture content was maintained at 60% of field water capacity. The pot experiment with potato was carried out in a growth chamber (Model GC-300/1000, JEIO Tech Co., Ltd., South Korea) under 22 ± 2°C, humidity 60 ± 3%RH, a photoperiod of 16/8 (L/D) h and light intensity maximum about 300 µE m−2 s−1. The pot positions were randomized every week.
Potato plants were foliar sprayed with hydrogen peroxide (H2O2) solutions of various concentrations. Six experimental trials were conducted as follows: control (without H2O2), 1% H2O2 (294 mM), 3% H2O2 (822 mM), 6% H2O2 (1764 mM), 12% H2O2 (3529 mM), and 18% H2O2 (5294 mM). H2O2 was diluted in demineralized water—100 ml of solution was prepared per each variant (25 ml per pot). A hand-sprayer was used for the spraying. There was a uniform spraying procedure: the same amount of solution per each pot until the solution ran out completely. Two treatments were applied: the first treatment 21 days after planting (plants had 8–9 leaves), the second treatment after seven days from the first one. The physiological measurements occurring in the potato leaves (gas exchange, relative Chl content, and Chl fluorescence) were taken four times: on the first and seventh day after each application. The measurements were performed on the first or second fully expended leaves. On seventh day after the second treatment, the plant injury was visually assessed by assigning 9-degree scale (9 corresponds to the absence of symptoms of damage to the leaves and stalks; 1 indicates total plants damage). The evaluation includes: the number of damaged leaves and stalks, the degree of damage, turgor of leaves, and stalks. It was assumed that 9° is equivalent to 0–5%, 8° = 6–15%, 7° = 16–25%, 6° = 26–40%, 5° = 41–60%, 4° = 61–75%, 3° = 76–85, 2° = 86–95%, and 1° = 96–100% of above-ground parts of plants with visible damage. The above-ground parts of plants were cut down and their fresh mass (FM) was weighed.

2.2. Gas Exchange

A Portable Photosynthesis Measurement System LCpro-SD (ADC BioScientific Ltd, Hoddesdon, UK) was used to determine the net photosynthetic rate (PN), transpiration rate (E), stomatal conductance (gs), and intercellular CO2 concentration (Ci) on fully expended leaves. In the determination process, the light intensity was 1500 mol m−2 s−1 and the leaf chamber temperature was 28°C. Two leaves were analyzed for each pot. The following parameters were measured: net photosynthetic rate (PN), transpiration rate (E) and stomatal conductance (gs).

2.3. Relative Chlorophyll Content

The measurements were performed by using a Chlorophyll Content Meter CCM-200plus (Opti-Sciences, Hudson, NH, USA). The relative Chl content was measured on fully expended potato leaves. Five leaves were analyzed for each pot.

2.4. Chlorophyll Fluorescence

The Chl fluorescence measurements were performed by using an analyzer fluorimeter (Pocket PEA, Hansatech Instruments, King’s Lynn, Norfolk, UK). The fluorescence signal was collected in the red actinic light with a peak wavelength of 627 nm light diode source and applied for 1 s at the maximal available intensity of 3500 μmol m−2 s−1. Fluorescence measurements were assessed in dark-adapted (30 min) leaves, using the leaf-clips which were put on the adaxial leaf blades away from the leaf vein [40,41]. Two measurements were made on each pot. The following parameters were recorded during the study: the maximal quantum yield of PSII photochemistry (Fv/Fm), the maximum quantum yield of primary photochemistry (Fv/F0), and the performance index (PI).

2.5. Determination of Antioxidant Activity Using ABTS•+ and DPPH Radicals

Frozen plant tissue (−67°C, 1g) were milled and homogenized with 15 ml of 75 % methanol solution. The homogenate was shaken for 30 min (150 rpm) and clarified by centrifugation at 7500·g for 10 min. The obtained supernatant was used to determine the antioxidant activity. Antioxidant activity was performed in triplicate.

2.5.1. Antioxidant Activity Against ABTS•+

The free radical scavenging activity was determined according to Re et al. [42]. A 7 mM solution of 2,2′-Azino-bis(3-ethylbenzothiazoline-6-sulfonic acid) diammonium salt (ABTS•+) in water solution of 2.45 mM K2S2O8 was prepared. Next, it was incubated in darkness for 24 h. Before the actual analysis, the radicals solution of ABTS•+ was diluted with distilled water until the absorbance 0.7 ± 0.02, at λ = 734 nm. A 1 ml solution of ABTS•+ radicals was placed in a glass tube and 10 μl of the sample prepared for analysis was added. After six minutes of incubation in darkness, the absorbance of the solutions was measured at λ = 734 nm (using a blank sample as reference).

2.5.2. Antioxidant Activity Against DPPH

To 1 ml of 100 μM 2,2-Di(4-tert-octylphenyl)-1-picrylhydrazyl, free radical (DPPH) radical solution (Sigma-Aldrich, Steinheim, Germany), 30 μL of plant extract was added. After 30 min of incubation in darkness, the absorbance was measured at 515 nm [43].
The antioxidant activities were determined based on a calibration curve for 100 μM–1.5 mM (±)-6-Hydroxy-2,5,7,8-tetramethylchromane-2-carboxylic acid (Trolox) solutions in methanol. The obtained results are presented as an equivalent of μmol of Trolox in 1 g of fresh leaves mass. On all measurement dates, three independent replicate measurements of antioxidant activity were performed for each H2O2 concentration.

2.6. Statistical Analysis

Statistical analysis was performed using TIBCO Statistica 13.3.0 (TIBCO Software Inc., Palo Alto, CA, USA). The Shapiro-Wilk test was performed to check the normal distribution at α = 0.05. The homogeneity of variance was also checked. Then, a two-way ANOVA test with repeated measurements (time evaluation as a factor) was used. To determine the significance of differences between average parameter values and their verification, a Tukey post-hoc test was performed.

3. Results

3.1. Gas Exchange

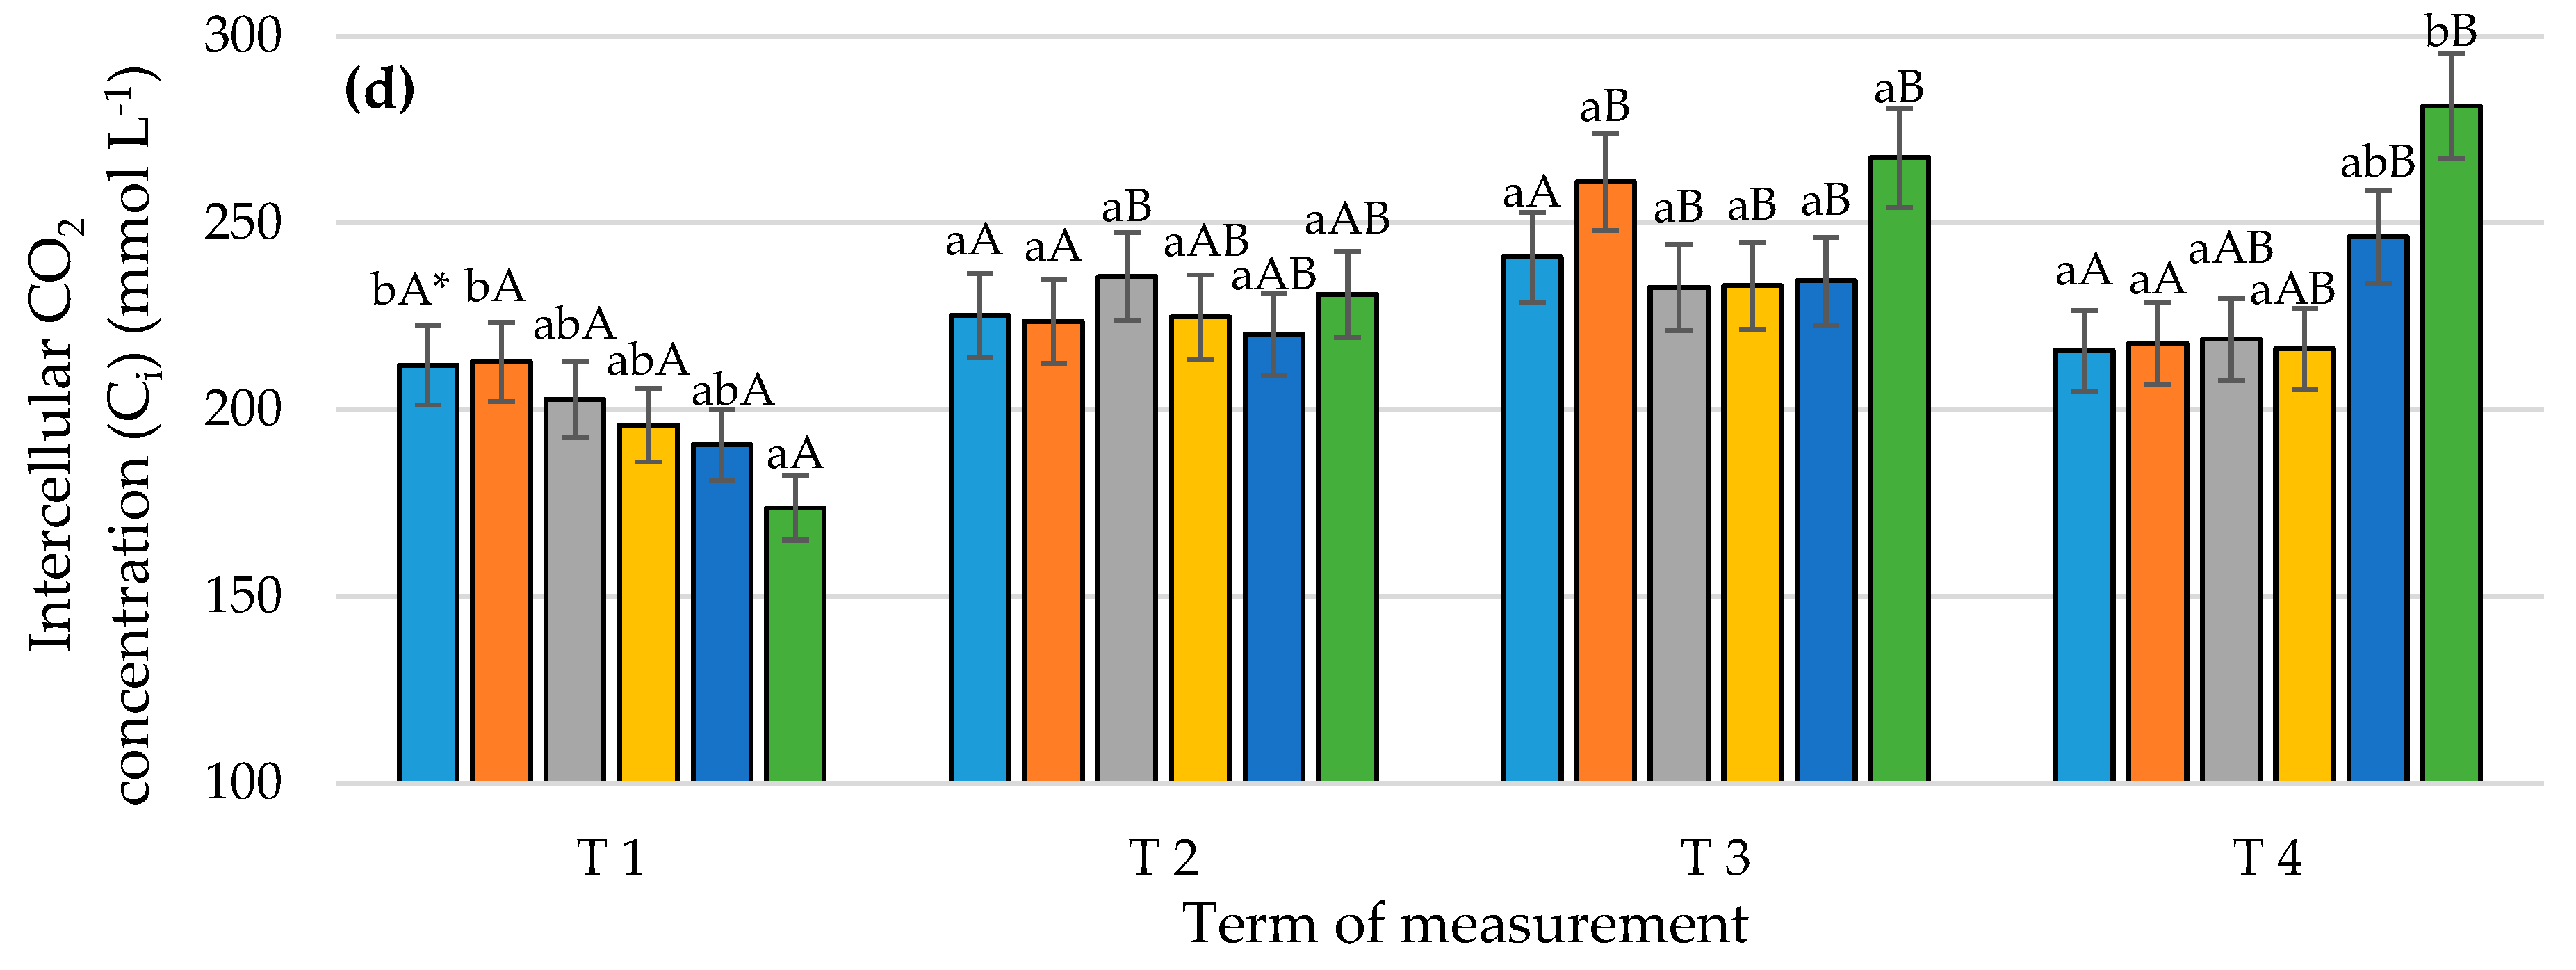
The relationship between the dose of H2O2 and the potato plants response was visible just after the first application, while strong relationships between the measured gas exchange parameters as the net photosynthetic rate (PN) (Figure 1a), transpiration rate (E) (Figure 1b), stomatal conductance (gs) (Figure 1c), intercellular CO2 concentration (Ci) (Figure 1d), and the dose were noted. On the first day after the first application, the increase of H2O2 concentration resulted in reduction of PN, E, gs and Ci in potato leaves. It should be noted that in case of the control and spraying with 1% and 3% H2O2 concentration, most of the measured parameters did not differ significantly.
The beneficial effect of H2O2 on the gas exchange process in the potato leaves was also observed on seventh day after the first spraying with H2O2. The value of parameters PN, E, and gs after application of 1%, 3%, and 6% H2O2 concentrations did not differ significantly compared to the control. For 12% and 18% H2O2 concentrations, it was lower than on the control. After the second application, increased H2O2 concentrations caused a decrease in the values parameters of PN, E, and gs in potato leaves compared to the control. On the first day after the second application, the values parameters of PN, E, and gs measured in plants leaves sprayed with 1% H2O2 concentration were significantly higher than on the control, and in plants treated with 3% and 6% concentrations, the parameters E and gs did not differ significantly with relation to the control. PN and gs were significantly modified by H2O2 foliar spraying also on seventh day after the second application. The lowest concentration (1%) had the most beneficial effect on PN, while after using 3% H2O2 concentration, this parameter did not differ significantly compared to the control. The highest values of PN, E, and gs parameters were found on seventh day after the first application and on first day after the second spraying with the lowest concentration (1%).
No unequivocal effect of the applied H2O2 concentrations on the parameter Ci in potato leaf was demonstrated (Figure 1d). On the first day after the first application, the increase in H2O2 concentration caused a significant decrease in Ci value in the potato leaves. In the last measurement term, the highest Ci values were obtained after spraying the plants with the highest H2O2 concentrations, while on the other dates, the concentrations did not significantly influence this gas exchange parameter.

3.2. Relative Chl Content

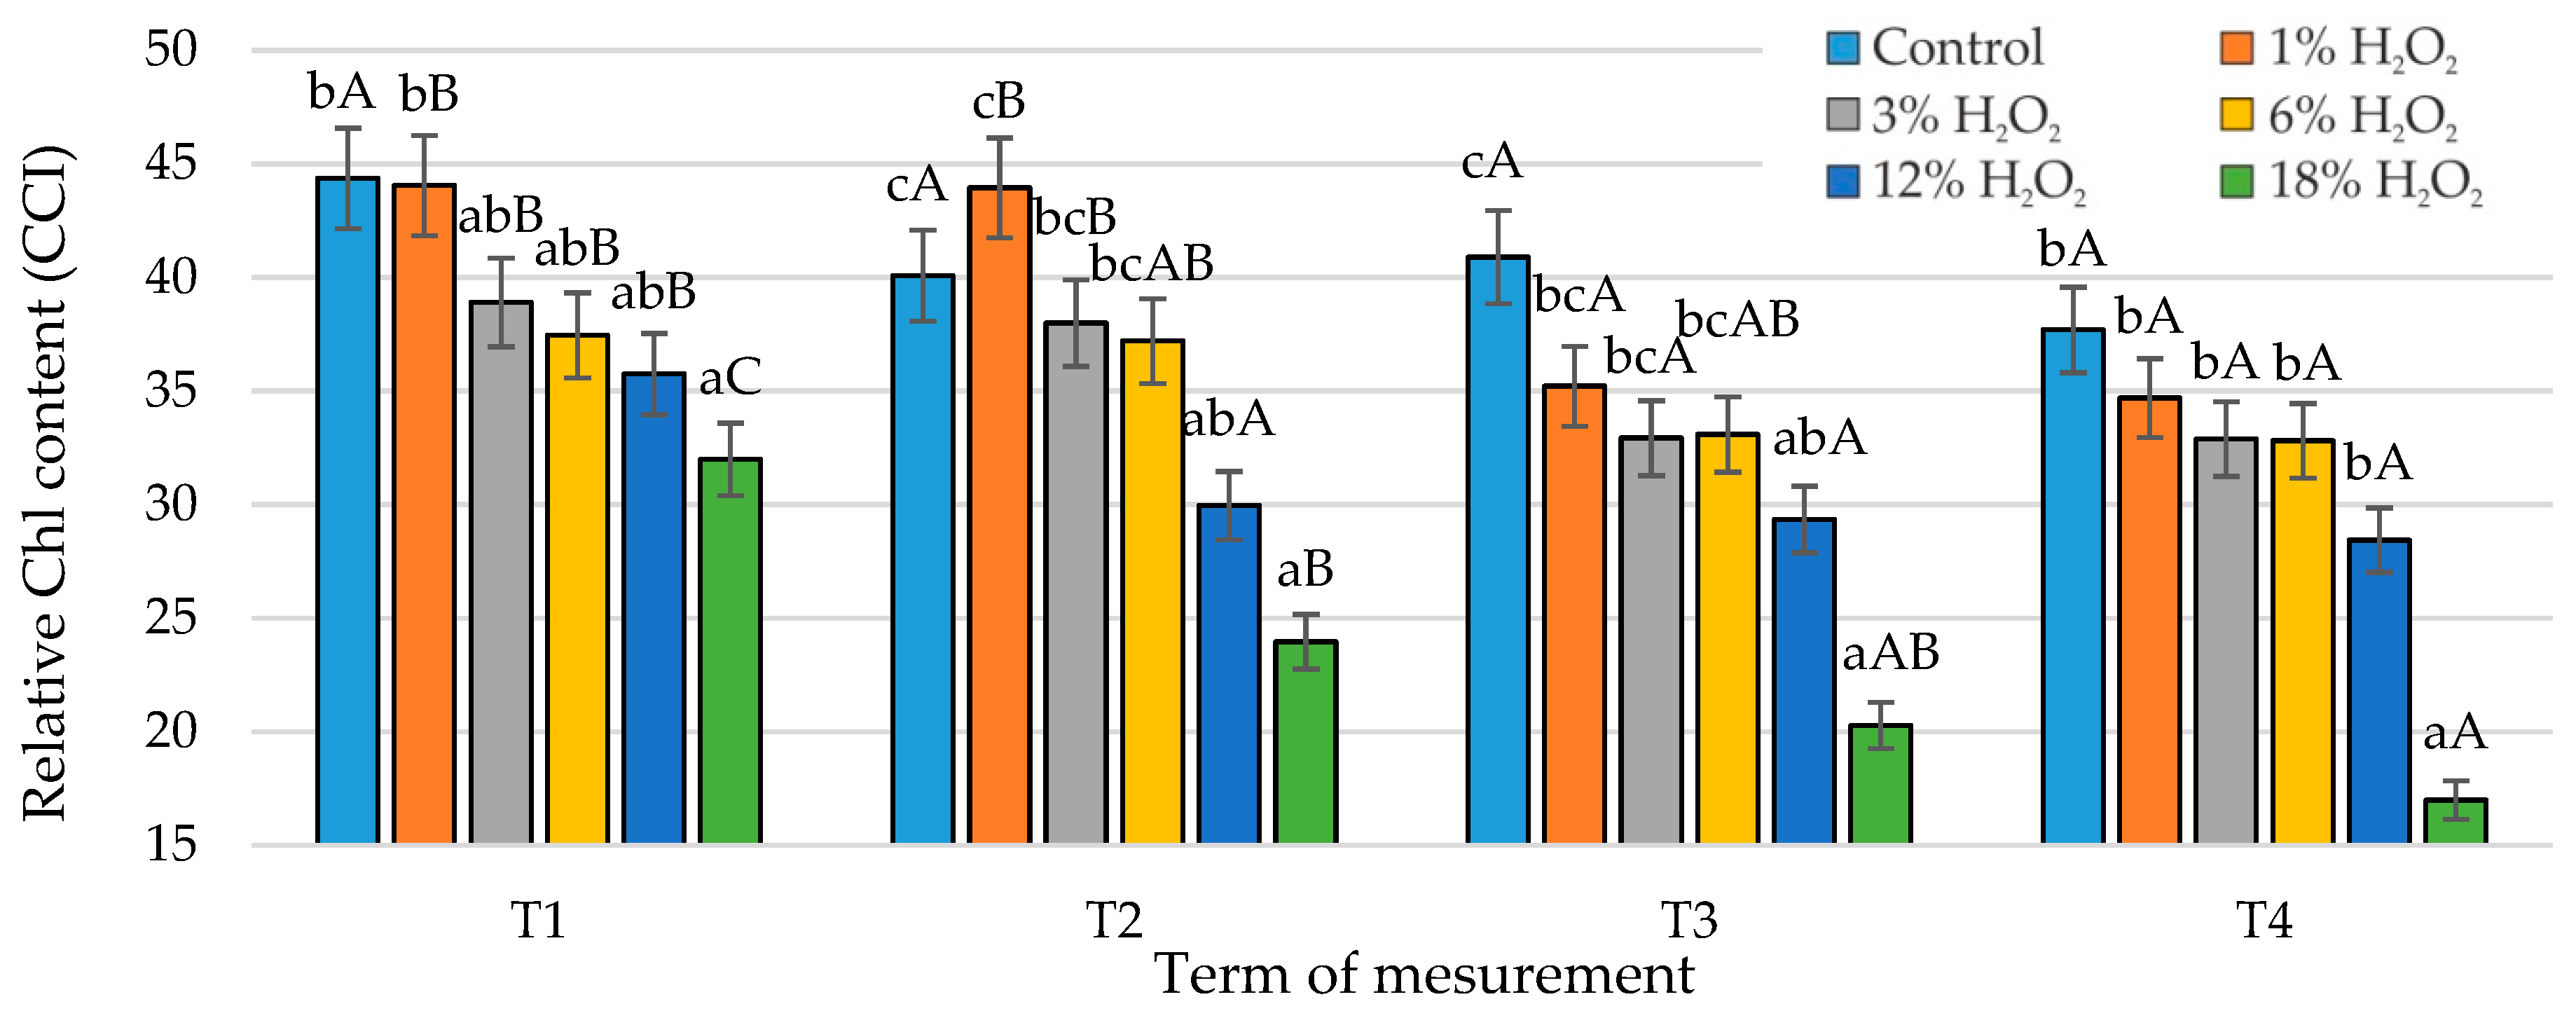
Application of H2O2 reduced the relative Chl content in the potato leaves (Figure 2). The response of the potato plants to the H2O2 spraying was observed just on first day after the first application. It should be noted that in case of the control and spraying with 1% H2O2 concentration, measured parameter does not differ significantly.
On all measurement dates, an increase in H2O2 concentration caused a decrease in the relative Chl content in potato leaves. The lowest H2O2 concentration (1%) had the most beneficial effect on the relative Chl content. After also using 3% and 6% concentrations, there was no significant reduction in relative Chl content compared to the control. A single application of 1%, 3%, and 6% did not significantly differentiate the relative Chl content, while higher H2O2 concentrations (12% and 18%) caused a decrease in this parameter value on subsequent measurement dates.

3.3. Chlorophyll Fluorescence

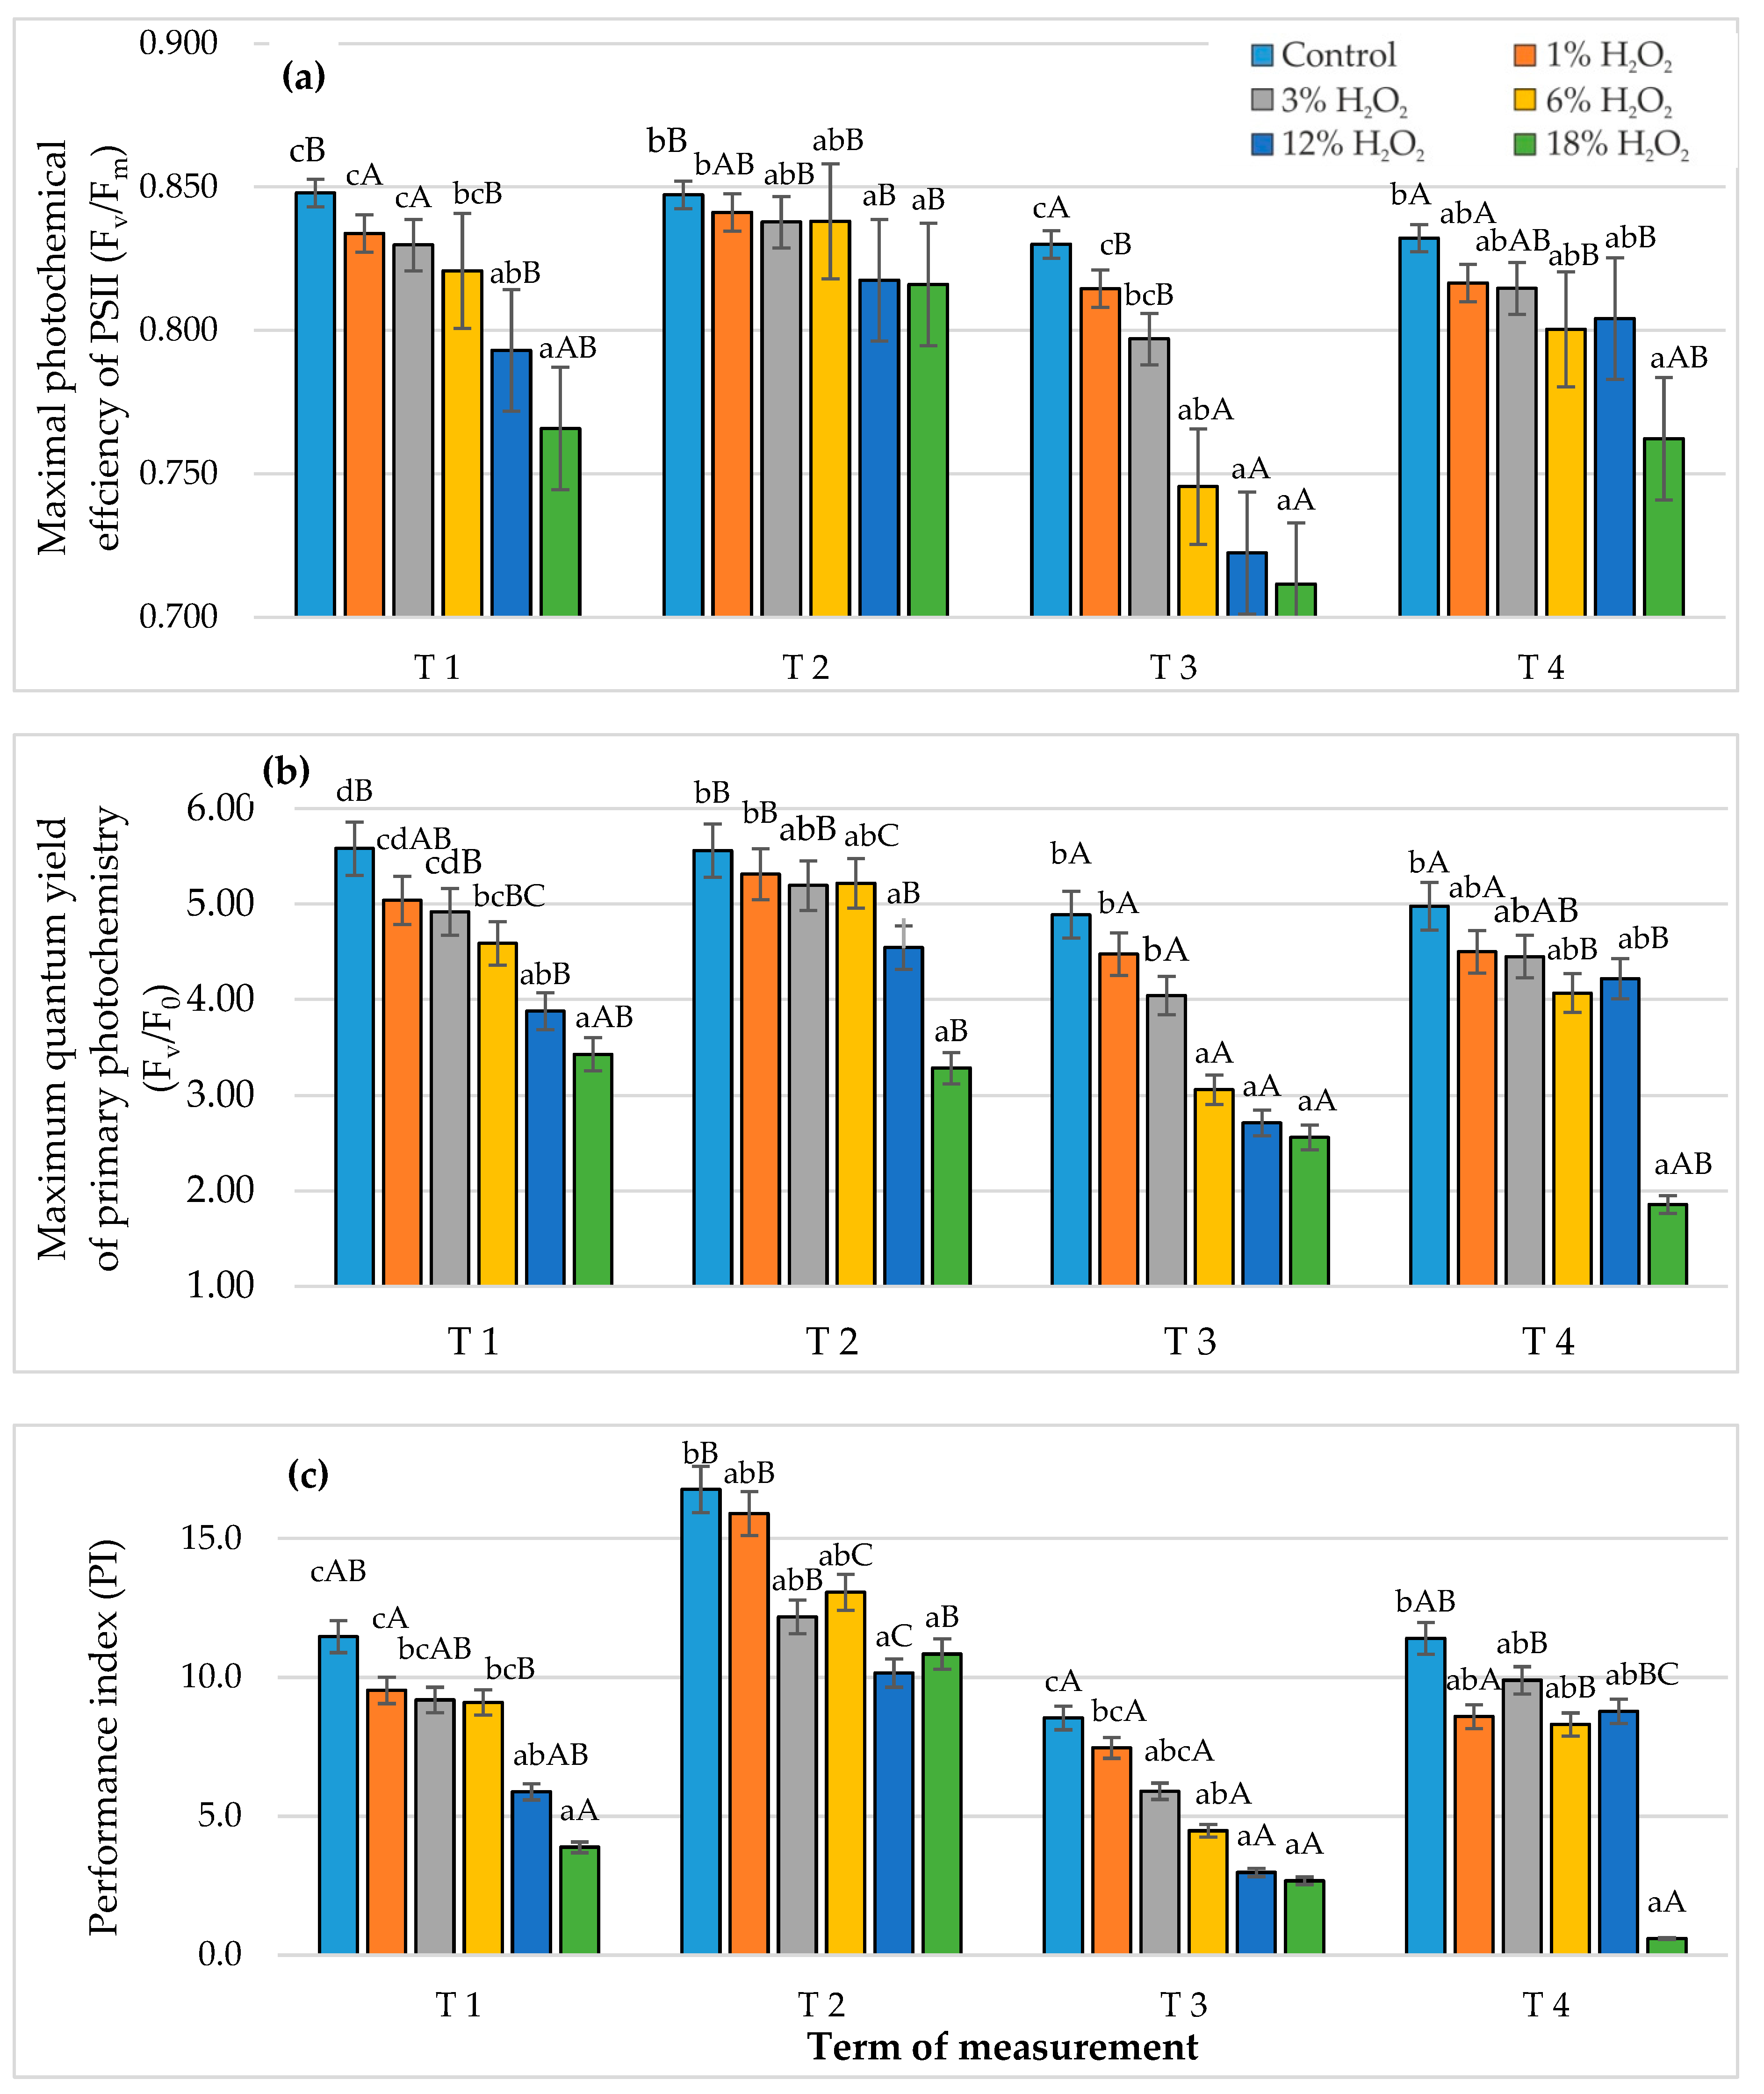
The potato plants responded to foliar spraying with H2O2 with reduction in the values of Chl fluorescence parameters (Figure 3a–c). A strong reaction of plants to H2O2 was observed especially on the first day after spraying.
The application of the second dose of H2O2 resulted in greater decrease in the values of Chl fluorescence parameters compared to the first dose. Increasing H2O2 concentrations on all measurement dates resulted in lowering these parameters. After first spraying with 1%, 3%, and 6% H2O2 concentrations and on the first day after the second application, values of Fv/Fm (Figure 3a), Fv/F0 (Figure 3b) and PI (Figure 3c) in potato leaves did not differ significantly compared to the control, while on the seventh day after the second application the lowest values of the tested chlorophyll fluorescence parameters were obtained due to the use of the highest H2O2 concentration (18%).

3.4. Antioxidant Activity

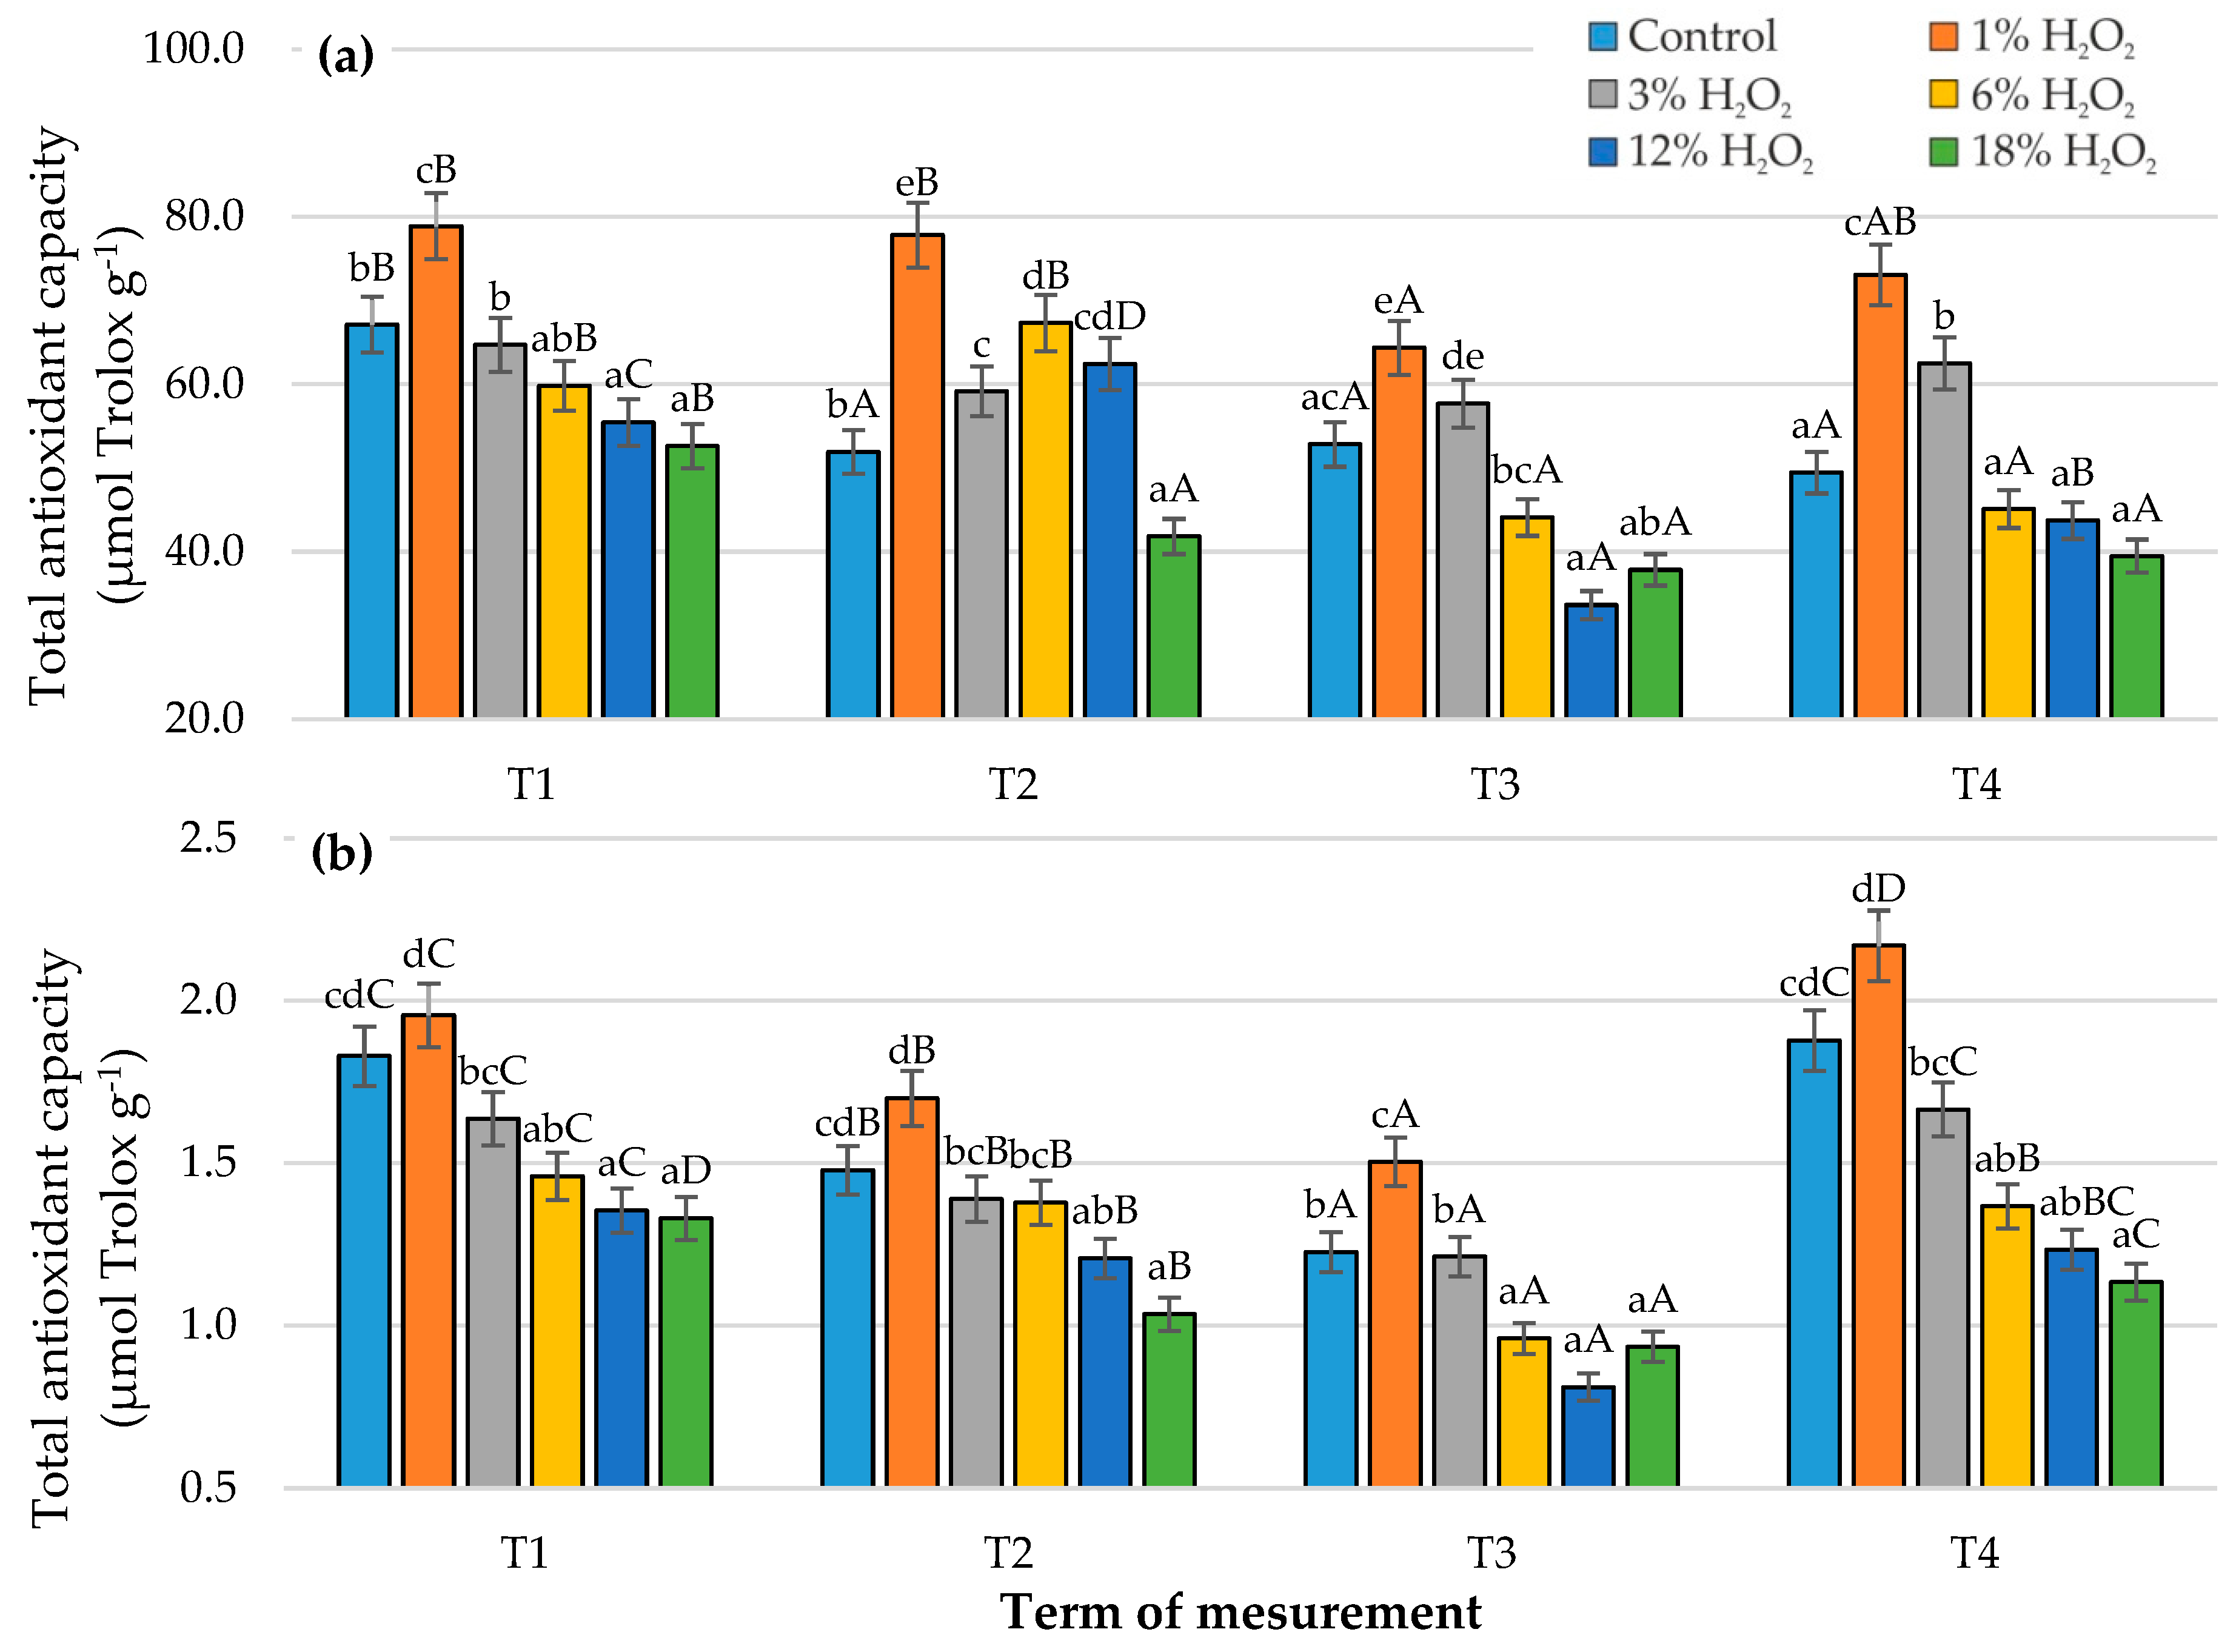
The effect of spraying with different concentrations of H2O2 on the changes in total antioxidant activity (AA) in potato leaves is shown in Figure 4. On all measurement dates, significantly the highest AA were found in potato leaves sprayed with 1% H2O2 concentration. On the first day after spraying the plants with 3% H2O2 concentration, AA did not differ significantly compared to the control, while a further increase in H2O2 concentration caused its decrease. On the seventh day after the first spraying, significantly higher AA compared to the control were found after application of 1%, 3%, 6%, and 12% H2O2, and on seventh day after the second spraying after using 1% and 3% H2O2.

3.5. Growth Parameters of Plants

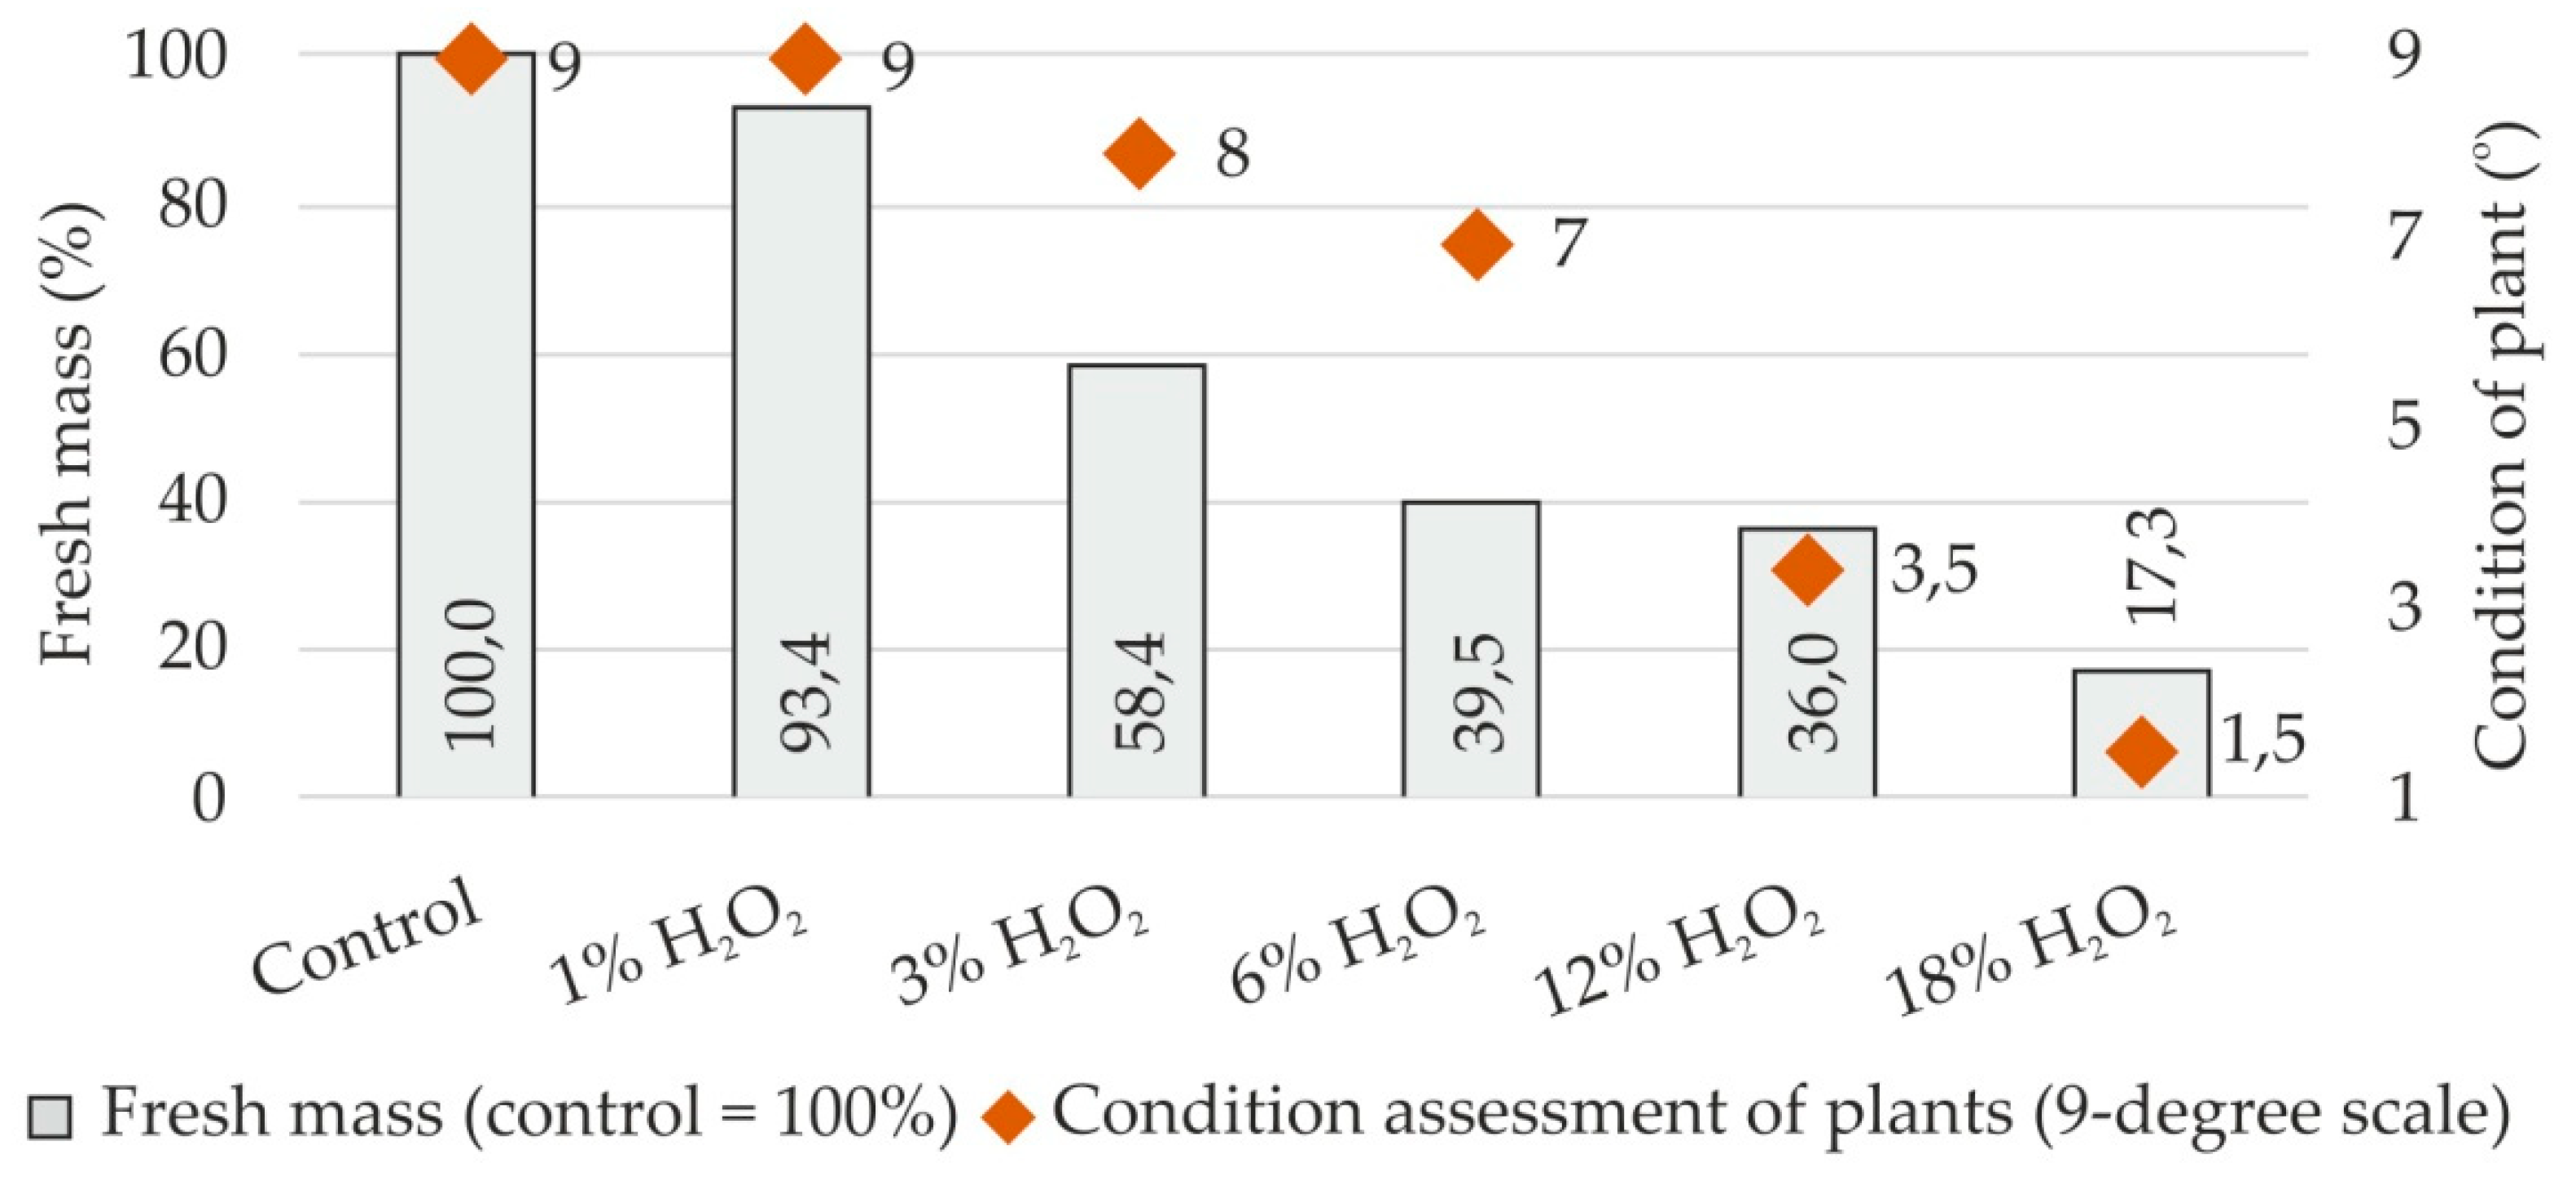
Two-time H2O2 application caused the reduction of fresh mass (FM) of aboveground parts of plants and deterioration of their condition. In plants treated with 1% concentration of H2O2, their condition did not deteriorate, but FM of their aboveground part decreased by 6.6% compared to the control (Figure 5). In plants treated with the highest concentration of H2O2 (18%), their FM decreased by 82.7% compared to the control, and the condition was rated at 1.5º.

4. Discussion

Numerous studies indicate H2O2 inhibitory effect on the growth and/or inactivation of pathogenic microorganisms. Since higher biocidal efficacy of H2O2 is observed at its higher concentrations [34,35,36], 1% of H2O2 was considered as minimal in these studies. Due to the fact that H2O2 is unstable, a strategy for its use and repetition of spraying treatments should be developed for the strategy to protect plants from pathogens. On farms that use intensive protection of potato plants against potato blight, which in Poland is the greatest threat in cultivating this species, it is recommended to spray the plants several times with fungicides (every 7–10 days). For this reason, in our experiment H2O2 spraying was performed twice, every seven days. Measurements of physiological parameters on the first day after H2O2 spraying were aimed at determining the strength of stress in plants caused by this treatment. Measurements on the seventh day after spraying were aimed at checking how plants coped with stress thanks to the activation of repair mechanisms.
H2O2 is relatively stable in vivo compared to other ROS molecules [44]. It is established that H2O2 acts as a signaling molecules with tremendous impact on plant growth and development [24]. Production of ROS is a hallmark of successful recognition of infection and activation of plant defenses. The rapid production of ROS by plants, particularly H2O2, indicates the successful recognition of pathogen infection and pathogen-associated molecular patterns [45]. The research assumes that spraying potato plants with H2O2, even before the attack of pathogens, could be a procedure that prepares them for such an attack. However, the dose of H2O2 should be chosen so as not to disturb the functioning of the photosynthetic apparatus of plants. This study indicated that only spraying with 1% H2O2 concentration stimulates physiological processes in the potato leaves. This is indicated by the values of parameters PN, E, and gs, which on all measurement dates were at a similar level or higher compared to the control. Beneficial effects on these gas exchange parameters were also found after spraying with 3% H2O2, but only on the seventh after the first spraying. It may be due to the fact that H2O2 activates in plants many signal molecules such as: Ca2+, ethylene, salicylic acid, abscisic acid, and NO [17,20]. Further increase of H2O2 concentration resulted in decrease of PN, E, and gs value, which can be explained an earlier stomatal closure. Kolla et al. [46] also indicated that the presence of externally added H2O2 decreased the stomatal opening. The limitation in stomatal opening can result in H2O2 production in guard cells under the influence at high CO2 [47] and induction to stomatal closure is caused by increasing H2O2 in guard cells, which can lead to an increase in the cytosolic Ca2+ concentrations [48]. According to Quan et al. [17] and Noctor et al. [20], H2O2 plays an essential role in signal mediating in stomatal closure which is inducted by abscisic acid. In case of environmental stresses, plants can induce tolerance mechanisms. Stomatal closure is one of the mechanisms which is activated in order to control transpiration. Exogenous addiction the abscisic acid (ABA) caused production of H2O2 and makes stomatal closure [47]. Knowledge of the regulatory action for ROS signaling processes in stomatal movement is still fragmentary [1].
In this experiment, the gs restriction resulted in PN reduction. This relationship is also indicated by studies on various plant species [13,47,49,50]. Photosynthetic responses of potato caused by another stress factor (potato virus Y (PVYNTN) infection) significantly reduces PN and gs, but has little influence on Ci [51]. The results of our research also confirm this relationship.
Measurement of Chl fluorescence is a non-invasive method for assessing the PSII state and is considered as an indicator of the response of plants to different environmental stresses [52,53]. H2O2, as a stress factor, also increases leaf Chl content and Chl fluorescence parameters such as Fv/Fm, PSII, and qP in marigold plants [54]. However, there have been reports that applying low H2O2 concentration increases tolerance of plants to stress factors. Uchida et al. [55] showed that spraying rice seedlings with low concentration of H2O2 (<10μM) allowed higher value of Fv/Fm. In this research, much higher H2O2 concentrations were used. It was observed that parameters Fv/Fm, Fv/F0, PI in potato leaves decrease under H2O2 foliar spraying. However, values of Fv/Fm, Fv/F0 and PI in potato leaves treated with 1%, 3%, and 6% H2O2 concentrations did not differ significantly compared to the control, except for the measurement taken on the first day after the first spraying where they were lower than during the control. The decrease of values of Chl fluorescence parameters in the leaves shows that the plant was exposed to the stress factor, which disrupted PSII functions and reduced the efficiency of electron transport. ROS, including H2O2, tend to react easily with most biomolecules of the cell, causing their degradation and destruction, contributing to cellular stress [56]. Higher plants are well equipped with enzymatic detoxification systems and antioxidants decreasing oxidative stress. This occurs by elimination and reduction of the ROS to less toxic and less reactive products [57]. The presence of ROS in particular H2O2 in plant cells in this study presumably exceeds the activity of antioxidant metabolism enzymes which inducts photosynthetic apparatus disturbance. It was also suggested that Chl fluorescence measurement is a more sensitive tool indicator to stress occurrence than gas exchange measurement. On all measurement dates, after the foliar spraying with the lowest concentration of H2O2 which the plants can treat as a stress factor, the values of PN, E, gs, were higher, but parameters of Chl fluorescence Fv/Fm, Fv/F0, PI were lower compared to the control.
Increased H2O2 concentration foliar application also causes decrease in Chl content. Ahmad et al. [58] observed that total Chl content in maize seedling did not increases significantly under the influence of exogenous application of H2O2 (20 and 40 mg L−1). In their research foliar spray with H2O2 improved shoot and root lengths of maize, which was associated with higher superoxide dismutase and Chl content. However, in this study, after spraying the plants with a much higher concentration of 1% H2O2 (~10 g L−1) Chl content in the leaves does not decrease significantly compared to the control. As compared to the control, after the application of 1% H2O2 concentration the condition of plants has not decreased and the FM of the aboveground part of the plant was only slightly reduced.
Measurement of AA can be another marker of stress in plants [43]. Oxidants cause a cascade of biochemical reactions that allow the production of compounds that protect against their toxic effects. One of such mechanisms is the activation of PAL (phenylalanine ammonia-lyase), which may be enhanced by the production of polyphenols that affect the AA [59]. The results clearly indicate that this effect occurs in plants sprayed with H2O2. Lower H2O2 concentrations appear to produce positive metabolic effects in potato plants. The strongest beneficial effect was observed in plants treated with 1% H2O2 concentrations, which was also shown in other measurements. The day after H2O2 application, measured of AA in the potato leaves was decreasing. Initial treatment of seeds and plants with H2O2 concentrations causes oxidative stress by disrupting ROS cell homeostasis and the ROS-dependent signaling network that enhancing the accumulation of latent defense proteins, such as ROS scavenging enzymes and modulation of physiological processes resulting in enhanced stress responses [60]. However, it was shown that on the seventh day after second H2O2 spraying, the AA increased again, which could be explained by an increase in the activity of antioxidant enzymes in tissues. We suppose that a 1% concentration of H2O2 could act as an abiotic elicitor, causing a series of intracellular interactions, which consequentially may induce stress resistance.
It was indicated that H2O2 primed a defense response in the mustard seedlings that could trigger the activation of both ROS and methylglyoxal detoxification pathways and enabled the seedlings tolerance to drought-induced oxidative damage [61]. In the maize grown under water-deficit conditions, after seed pretreatment with H2O2, enhanced the activity of antioxidant enzymes in seedlings was observed as well. An increase activity of superoxide dismutase (SOD), peroxidase (POD) and catalase (CAT) after using H2O2 was found in maize [62] and in cowpea [63]. Ahmad et al. [58] watched decline in photosynthetic pigments and increase in the concentration of proteins, H2O2, malondialdehyde (MDA), and ascorbic acid (AsA). The use of H2O2 in plant production can therefore be a valuable tool in the hands of farmers in protecting plants against environmental stress, and it can also potentially stop the development of pathogens through the sanitizing action of this compound.

5. Conclusions

This data shows that among the variants tested, foliar spraying of 1% H2O2 concentration was the most stimulating for the course of physiological processes in the leaves and did not worsen the condition of plants, although fresh mass (FM) above-ground parts of potato plants decreased slightly compared to the control. We conclude that application of 1% H2O2 can be taken into account in further research on the development of a potato plant protection method as an alternative to the conventional methods of their protection. Moreover, the H2O2 activity could be similar to other known abiotic elicitors, which may increase the effect of protection. These results verified in field conditions can be a contribution to the development of a method of potato plant protection program dedicated especially to sustainable and organic farming.

Author Contributions

E.S.-K., M.B. have contributed in developing the research ideas, conducting the research, analyzing the data, and writing the manuscript; M.J.-P., K.S., D.B.-J. has contributed in writing the manuscript; all authors provided efforts on research, lab analysis, read and approved the final manuscript. All authors have read and agreed to the published version of the manuscript.

Funding

The project was supported by the Minister of Science and Higher Education of Poland (Project No.026/RID/2018/19 “Regional Initiative of Excellence”, 2019–2022).

Conflicts of Interest

The authors declare no conflict of interest.

References

  1. Singh, R.; Parihar, P.; Singh, S.; Mishra, R.K.; Singh, V.P.; Prasad, S.M. Reactive oxygen species signaling and stomatal movement: Current updates and future perspectives. Redox Biol. 2017, 11, 213–218. [Google Scholar] [CrossRef]
  2. Das, K.; Roychoudhury, A. Reactive oxygen species (ROS) and response of antioxidants as ROS-scavengers during environmental stress in plants. Front. Environ. Sci. 2014, 2, 1–13. [Google Scholar] [CrossRef] [Green Version]
  3. Savvides, A.; Ali, S.; Tester, M.; Fotopoulos, V. Chemical priming of plants against multiple abiotic stresses: Mission possible? Trends Plant Sci. 2016, 21, 329–340. [Google Scholar] [CrossRef] [Green Version]
  4. Igamberdiev, A.U.; Lea, P.J. The role of peroxisomes in the integration of metabolism and evolutionary diversity of photosynthetic organisms. Phytochemistry 2002, 60, 651–674. [Google Scholar] [CrossRef]
  5. Sandalio, L.M.; Romero-Puertas, M.C. Peroxisomes sense and respond to environmental cues by regulating ROS and RNS signalling networks. Ann. Bot. 2015, 116, 475–485. [Google Scholar] [CrossRef] [PubMed] [Green Version]
  6. Nath, M.; Bhatt, D.; Prasad, R.; Gill, S.S.; Anjum, N.A.; Tuteja, N. Reactive oxygen species generation-scavenging and signaling during plant-arbuscular mycorrhizal and Piriformospora indica interaction under stress condition. Front. Plant Sci. 2016, 7, 1–7. [Google Scholar] [CrossRef] [PubMed] [Green Version]
  7. Raja, V.; Majeed, U.; Kang, H.; Andrabi, K.I.; John, R. Abiotic stress: Interplay between ROS, hormones and MAPKs. Environ. Exp. Bot. 2017, 137, 142–157. [Google Scholar] [CrossRef]
  8. Demidchik, V. Mechanisms of oxidative stress in plants: From classical chemistry to cell biology. Environ. Exp. Bot. 2015, 109, 212–228. [Google Scholar] [CrossRef]
  9. Heyno, E.; Klose, C.; Krieger-Liszkay, A. Origin of cadmium-induced reactive oxygen species production: mitochondrial electron transfer versus plasma membrane NADPH oxidase. New Phytol. 2008, 179, 687–699. [Google Scholar] [CrossRef]
  10. Hossain, M.A.; Bhattacharjee, S.; Armin, S.M.; Qian, P.; Xin, W.; Li, H.Y.; Burritt, D.J.; Fujita, M.; Tran, L.S. Hydrogen peroxide priming modulates abiotic oxidative stress tolerance: Insights from ROS detoxification and scavenging. Front. Plant Sci. 2015, 6, 1–19. [Google Scholar] [CrossRef] [Green Version]
  11. Gill, S.S.; Tuteja, N. Reactive oxygen species and antioxidant machinery in abiotic stress tolerance in crop plants. Plant Physiol. Biochem. 2010, 48, 909–930. [Google Scholar] [CrossRef] [PubMed]
  12. Dummermuth, A.L.; Karsten, U.; Fisch, K.M.; Königc, G.M.; Wiencke, C. Responses of marine macroalgae to hydrogen-peroxide stress. J. Exp. Mar. Biol. Ecol. 2003, 289, 103–121. [Google Scholar] [CrossRef] [Green Version]
  13. Meloni, D.A.; Oliva, M.A.; Martinez, C.A.; Cambraia, J. Photosynthesis and activity of superoxide dismutase, peroxidase and glutathione reductase in cotton under salt stress. Environ. Exp. Bot. 2003, 49, 69–76. [Google Scholar] [CrossRef]
  14. Gechev, T.S.; Hille, J. Hydrogen peroxide as a signal controlling plant programmed cell death. J. Cell Biol. 2005, 168, 17–20. [Google Scholar] [CrossRef] [PubMed] [Green Version]
  15. Ślesak, I.; Libik, M.; Karpinska, B.; Karpinski, S.; Miszalski, Z. The role of hydrogen peroxide in regulation of plant metabolism and cellular signalling in response to environmental stresses. Acta Biochim. Pol. 2007, 54, 39–50. [Google Scholar] [CrossRef]
  16. Petrov, V.D.; van Breusegem, F. Hydrogen peroxide—A central hub for information flow in plant cells. AoB PLANTS 2012, pls014. [Google Scholar] [CrossRef] [Green Version]
  17. Quan, L.J.; Zhang, B.; Shi, W.W.; Li, H.Y. Hydrogen peroxide in plants: A versatile molecule of the reactive oxygen species network. J. Integr. Plant Biol. 2008, 50, 2–18. [Google Scholar] [CrossRef]
  18. Bienert, G.P.; Møller, A.L.B.; Kristiansen, K.A.; Schulz, A.; Møller, I.M.; Schjoerring, J.K.; Jahn, T.P. Specific aquaporins facilitate the diffusion of hydrogen peroxide across membranes. J. Biol. Chem. 2007, 282, 1183–1192. [Google Scholar] [CrossRef] [Green Version]
  19. Dynowski, M.; Schaaf, G.; Loque, D.; Moran, O.; Ludewig, U. Plant plasma membrane water channel conduct the signalling molecule H2O2. Biochem. J. 2008, 414, 53–61. [Google Scholar] [CrossRef] [Green Version]
  20. Noctor, G.; Lelarge-Trouverie, C.; Mhamdi, A. The metabolomics of oxidative stress. Phytochemistry 2015, 112, 33–53. [Google Scholar] [CrossRef]
  21. López-Delgado, H.A.; Sánchez-Rojo, S.; Mora-Herrera, M.E.; Martínez-Gutierrez, R. Micro-tuberization as a long term effect of hydrogen peroxide on potato plants. Am. J. Pot. Res 2012, 89, 240–244. [Google Scholar] [CrossRef]
  22. López-Delgado, H.; Zavaleta-Mancera, H.A.; Mora-Herrera, M.E.; Vázquez-Rivera, M.; Flores-Gutiérrez, F.X.; Scott, I.M. Hydrogen peroxide increases potato tuber and stem starch content, stem diameter, and stem lignin content. Am. J. Pot. Res 2005, 82, 279. [Google Scholar] [CrossRef]
  23. Ali, M.; Cheng, Z.; Husain, A.; Hayat, S. Reactive oxygen species (ROS) as defenses against a broad range of plant fungal infections and case study on ROS employed by crops against Verticillium dahliae wilts. J. Plant Interact. 2018, 13, 353–363. [Google Scholar] [CrossRef] [Green Version]
  24. Khan, T.; Yusuf, M.; Fariduddin, Q. Hydrogen peroxide in regulation of plant metabolism: Signalling and its effect under abiotic stress. Photosynthetica 2018, 56, 1237. [Google Scholar] [CrossRef]
  25. Hernández, J.A.; Gullner, G.; Clemente-Moreno, M.J.; Künstler, A.; Juhász, C.; Díaz-Vivancos, P.; Király, L. Oxidative stress and antioxidative responses in plant-virus interactions. Physiol. Mol. Plant Pathol. 2016, 94, 134–148. [Google Scholar] [CrossRef] [Green Version]
  26. Otulak, K.; Garbaczewska, G. Localisation of hydrogen peroxide accumulation during Solanum tuberosum cv. Rywal hypersensitive response to Potato virus Y. Micron 2010, 41, 327–335. [Google Scholar] [CrossRef]
  27. Wojtaszek, P. Oxidative burst: An early plant response to pathogen infection. Biochem. J. 1997, 322, 681–692. [Google Scholar] [CrossRef] [Green Version]
  28. Yergaliyev, T.M.; Nurbekova, Z.; Mukiyanova, G.; Akbassova, A.; Sutula, M.; Zhangazin, S.; Bari, A.; Tleukulova, Z.; Shamekova, M.; Masalimov, Z.K.; et al. The involvement of ROS producing aldehyde oxidase in plant response to Tombusvirus infection. Plant Physiol. Biochem. 2016, 109, 36–44. [Google Scholar] [CrossRef]
  29. Taheri, P.; Irannejad, A.; Goldani, M.; Tarighi, S. Oxidative burst and enzymatic antioxidant systems in rice plants during interaction with Alternaria alternata. Eur. J. Plant Pathol. 2014, 140, 829–839. [Google Scholar] [CrossRef]
  30. Shetty, N.P.; Mehrabi, R.; Lütken, H.; Haldrup, A.; Kema, G.H.J.; Collinge, D.B.; Jørgensenshing, H.J. Role of hydrogen peroxide during the interaction between the hemibiotrophic fungal pathogen Septoria tritici and wheat. New Phytol. 2007, 174, 637–647. [Google Scholar] [CrossRef]
  31. Baatout, S.; De Boever, P.; Mergeay, M. Physiological changes induced in four bacterial strains following oxidative stress. Appl. Biochem. Microbiol. 2006, 42, 418–427. [Google Scholar] [CrossRef]
  32. Raffellini, S.; Schenk, M.; Guerrero, S.; Alzamora, S.M. Kinetics of Escherichia coli inactivation employing hydrogen peroxide at varying temperatures, pH and concentrations. Food Control 2011, 22, 920–932. [Google Scholar] [CrossRef]
  33. Linley, E.; Denyer, S.P.; McDonnell, G.; Simons, C.; Maillard, J.Y. Use of hydrogen peroxide as a biocide: New consideration of its mechanisms of biocidal action. J. Antimicrob. Chemother. 2012, 67, 1589–1596. [Google Scholar] [CrossRef] [PubMed] [Green Version]
  34. Baldry, M.G. The bactericidal, fungicidal and sporicidal properties of hydrogen peroxide and peracetic acid. J. Appl. Bacteriol. 1983, 54, 417–423. [Google Scholar] [CrossRef] [PubMed]
  35. Hernandez, P.; Sager, B.; Fa, A.; Liang, T.; Lozano, C.; Khazzam, M. Bactericidal efficacy of hydrogen peroxide on Cutibacterium acnes. Bone Joint Res. 2019, 8, 3–10. [Google Scholar] [CrossRef]
  36. Sapers, G.M.; Sites, J.E. Efficacy of 1% hydrogen peroxide wash in decontaminating apples and cantaloupe melons. J. Food Sci. 2003, 68, 1793–1797. [Google Scholar] [CrossRef]
  37. Wu, G.; Shortt, B.J.; Lawrence, E.B.; Levine, E.B.; Fitzsimmons, K.C.; Shah, D.M. Disease resistance conferred by expression of a gene encoding H2O2-generating glucose oxidase in transgenic potato plants. Plant Cell. 1995, 7, 1357–1368. [Google Scholar] [CrossRef]
  38. Dorn, B.; Musa, T.; Krebs, H.; Fried, P.M.; Forrer, H.R. Control of late blight in organic potato production: Evaluation of copper-free preparations under field, growth chamber and laboratory conditions. Eur. J. Plant Pathol. 2007, 119, 217. [Google Scholar] [CrossRef]
  39. Van Reeuwijk, L.P. Procedures for Soil Analysis; International Soil Reference and Information Centre; FAO: Wageningen, The Netherlands, 2002. [Google Scholar]
  40. Maxwell, K.; Johnson, G.N. Chlorophyll fluorescence—A practical guide. J. Exp. Bot. 2000, 51, 659–668. [Google Scholar] [CrossRef]
  41. Olechowicz, J.; Chomontowski, C.; Olechowicz, P.; Pietkiewicz, S.; Jajoo, A.; Kalaji, M.H. Impact of intraspecific competition on photosynthetic apparatus efficiency in potato (Solanum tuberosum) plants. Photosynthetica 2018, 56, 971–975. [Google Scholar] [CrossRef] [Green Version]
  42. Re, R.; Pellegrini, N.; Proteggente, A.; Pannala, A.; Yang, M.; Rice-Evans, C. Antioxidant activity applying an improved ABTS radical cation decolorization assay. Free Radic. Biol. Med. 1999, 26, 1231–1237. [Google Scholar] [CrossRef]
  43. Piechowiak, T.; Antos, P.; Kosowski, P.; Skrobacz, K.; Józefczyk, R.; Balawejder, M. Impact of ozonation process on the microbiological and antioxidant status of raspberry (Rubus ideaeus L.) fruit during storage at room temperature. Agric. Food Sci. 2019, 28, 35–44. [Google Scholar] [CrossRef]
  44. Reth, M. Hydrogen peroxide as second messenger in lymphocyte activation. Nat. Immunol. 2002, 3, 1129–1134. [Google Scholar] [CrossRef] [PubMed]
  45. Torres, M.A. ROS in biotic interactions. Physiol. Plant. 2010, 138, 414–429. [Google Scholar] [CrossRef] [PubMed]
  46. Kolla, V.A.; Vavasseur, A.; Raghavendra, A.S. Hydrogen peroxide production is an early event during bicarbonate induced stomatal closure in abaxial epidermis of Arabidopsis. Planta 2007, 225, 1421–1429. [Google Scholar] [CrossRef]
  47. Zhang, X.; Zhang, L.; Dong, F.; Gao, J.; Galbraith, D.W.; Song, C.P. Hydrogen peroxide is involved in abscisic acid induced stomatal closure in Vicia faba. Plant Physiol. 2001, 126, 1438–1448. [Google Scholar] [CrossRef] [Green Version]
  48. Rentel, M.C.; Knight, M.R. Oxidative stress-induced calcium signaling in Arabidopsis. Plant Physiol. 2004, 135, 1471–1479. [Google Scholar] [CrossRef] [Green Version]
  49. Cornic, G. Drought stress inhibits photosynthesis by decreasing stomatal aperture—Not by affecting ATP synthesis. Trends Plant Sci. 2000, 5, 187–188. [Google Scholar] [CrossRef]
  50. Sikder, S.; Qiao, Y.; Baodi, D.; Shi, C.; Liu, M. Effect of water stress on leaf level gas exchange capacity and water-use efficiency of wheat cultivars. Ind. J. Plant Physiol. 2016, 21, 300–305. [Google Scholar] [CrossRef]
  51. Zhou, Y.H.; Peng, Y.H.; Lei, J.L.; Zou, L.Y.; Zheng, J.H.; Yu, J.Q. Effects of potato virus YNTN infection on gas exchange and photosystem 2 function in leaves of Solanum tuberosum L. Photosynthetica 2004, 42, 417–423. [Google Scholar] [CrossRef]
  52. Kalaji, M.H.; Jajoo, A.; Oukarroum, A.; Brestic, M.; Zivcak, M.; Samborska, I.A.; Cetner, M.D.; Łukasik, I.; Goltsev, V.; Ladle, R.J. Chlorophyll a fluorescence as a tool to monitor physiological status of plants under abiotic stress conditions. Acta Physiol. Plant. 2016, 38, 102. [Google Scholar] [CrossRef] [Green Version]
  53. Mauromicale, G.; Ierna, A.; Marchese, M. Chlorophyll fluorescence and chlorophyll content in field-grown potato as affected by nitrogen supply, genotype, and plant age. Photosynthetica 2006, 44, 76–82. [Google Scholar] [CrossRef]
  54. Liao, W.B.; Huang, G.B.; Yu, J.H.; Zhang, M.L. Nitric oxide and hydrogen peroxide alleviate drought stress in marigold explants and promote its adventitious root development. Plant Physiol. Biochem. 2012, 58, 6–15. [Google Scholar] [CrossRef] [PubMed]
  55. Uchida, A.; Jagendorf, A.; Hibino, T.; Takabe, T.; Takabe, T. Effects of hydrogen peroxide and nitric oxide on both salt and heat stress tolerance in rice. Plant Sci. 2002, 163, 515–523. [Google Scholar] [CrossRef]
  56. Yadav, N.; Sharma, S. Reactive oxygen species, Oxidative stress and ROS scavenging system in plants. J. Chem. Pharm. Res. 2016, 8, 595–604. [Google Scholar]
  57. Larson, R. The antioxidants of higher plants. Phytochemistry 1988, 27, 969–978. [Google Scholar] [CrossRef]
  58. Ahmad, I.; Basra, S.M.A.; Afzal, I.; Farooq, M.; Wahid, A. Stand establishment improvement in spring maize through exogenous application of ascorbic acid, salicylic acid and hydrogen peroxide. Int. J. Agric. Biol. 2013, 15, 95–100. [Google Scholar]
  59. Piechowiak, T.; Balawejder, M. Impact of ozonation process on the level of selected oxidative stress markers in raspberries stored at room temperature. Food Chem. 2019, 298, 125093. [Google Scholar] [CrossRef]
  60. Borges, A.A.; Jiménez-Arias, D.; Expósito-Rodríguez, M.; Sandalio, L.M.; Pérez, J.A. Priming crops against biotic and abiotic stresses: MSB as a tool for studying mechanisms. Front. Plant Sci. 2014, 5, 642. [Google Scholar] [CrossRef] [Green Version]
  61. Hossain, M.A.; Fujita, M. Hydrogen peroxide priming stimulates drought tolerance in mustard (Brassica juncea L.) seedlings. Plant Gene Trait. 2013, 4, 20–109. [Google Scholar]
  62. Ashraf, M.A.; Rasheed, R.; Hussain, I.; Iqbal, M.; Haider, M.Z.; Parveen, S.; Sajid, M.A. Hydrogen peroxide modulates antioxidant system and nutrient relation in maize (Zea mays L.) under water deficit conditions. Arch. Agron. Soil Sci. 2014, 61, 507–523. [Google Scholar] [CrossRef]
  63. Hasan, S.A.; Irfan, M.; Masrahi, Y.S.; Khalaf, M.A.; Hayat, S. Growth, photosynthesis, and antioxidant response of Vigna unguiculata L. treated with hydrogen peroxide. Cogent Food Agric. 2016, 2, 1155331. [Google Scholar] [CrossRef]
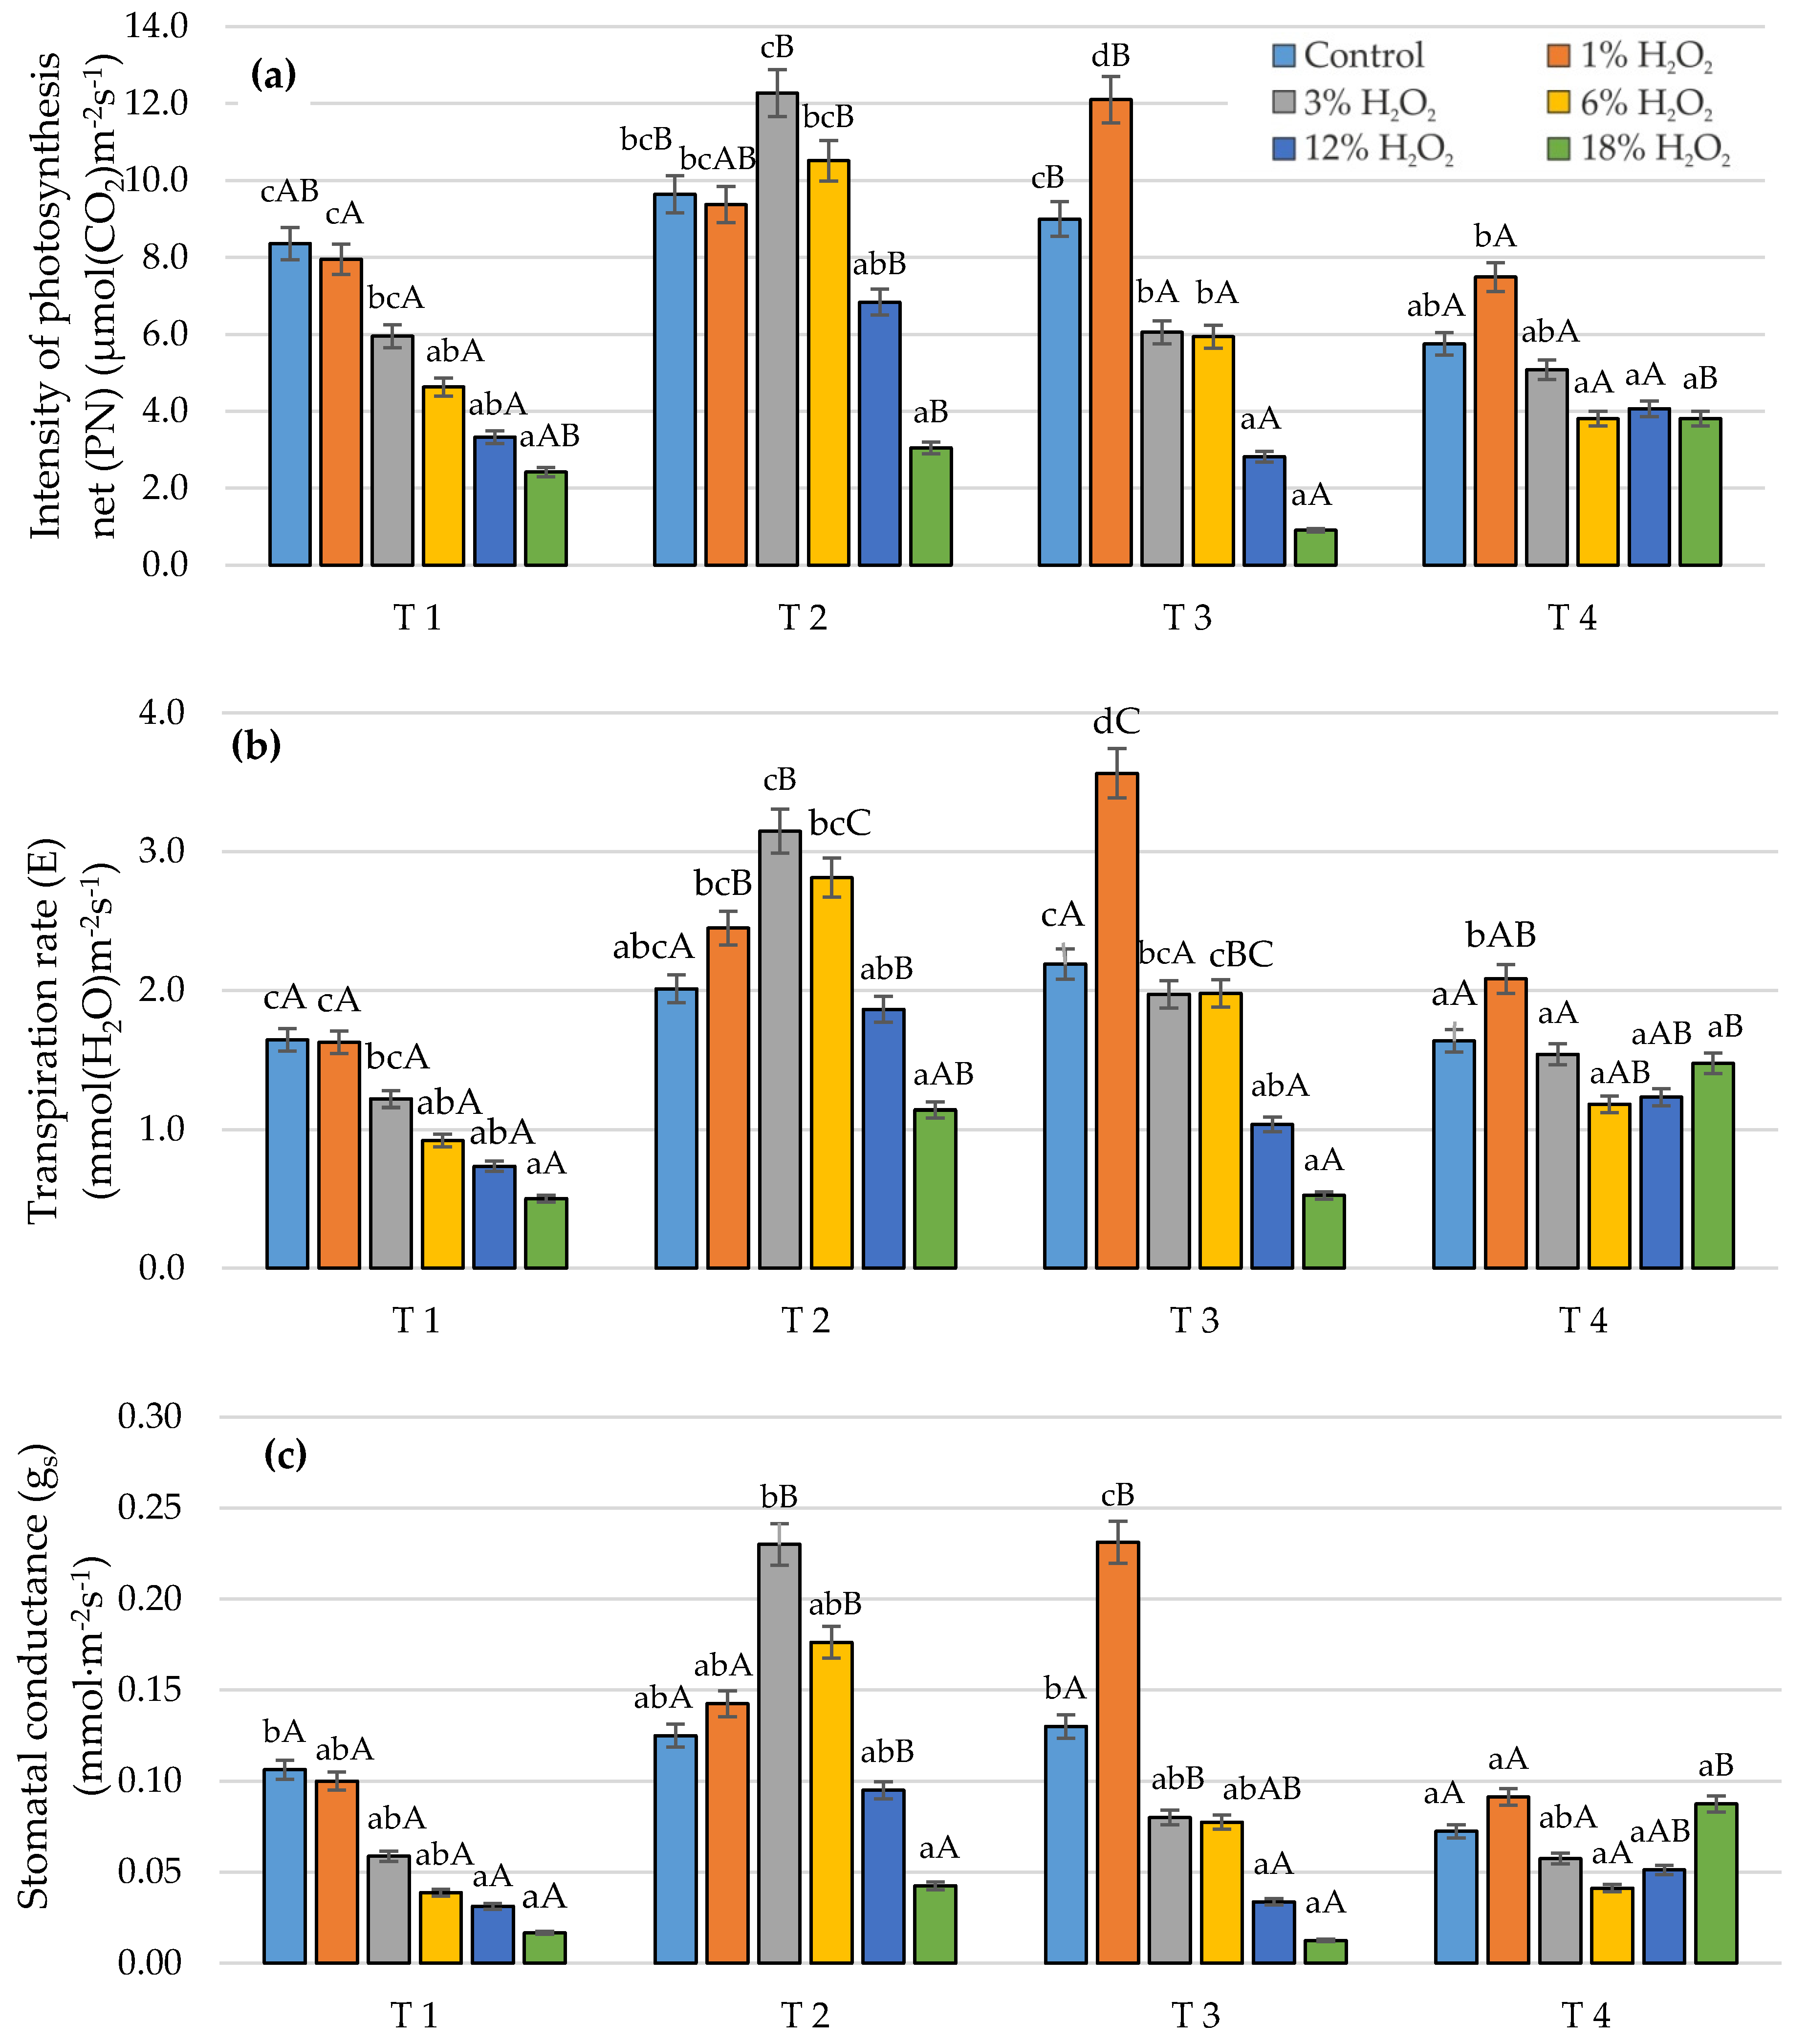
Figure 1. Impact of H2O2 concentrations and terms of measurement on gas exchange parameters in the leaves (T1—first day after the first application, T2—sevennth day after the first application, T3—first day after the second application, T4—seventh day after the second application). (a) intensity of photosynthesis net (PN), (b) transpiration rate (E), (c) stomatal conductance (gs), (d) intercellular CO2 concentration (Ci). * Lowercase letters indicate significant differences between the means on respective measurement dates, capital letters indicate significant differences between the measurement dates for each H2O2 concentrations (p < 0.05).
Sustainability 12 02469 g001aSustainability 12 02469 g001b
Figure 2. Impact of H2O2 concentrations and terms of measurement on relative Chl content (T1—first day after the first application, T2—seventh day after the first application, T3—first day after the second application, T4—seventh day after the second application. *Lowercase letters indicate significant differences between the means on respective measurement dates, capital letters indicate significant differences between the measurement dates for each H2O2 concentrations (p < 0.05).
Sustainability 12 02469 g002
Figure 3. Impact of H2O2 concentrations and terms of measurement on chlorophyll fluorescence parameters in leaves (T1—first day after the first application, T2—seventh day after the first application, T3—first day after the second application, T4—seventh day after the second application): (a) Fv/Fm – maximal photochemical efficiency of PSII, (b) Fv/F0—maximum quantum yield of primary photochemistry, (c) PI—performance index. *Lowercase letters indicate significant differences between the means on respective measurement dates, capital letters indicate significant differences between the measurement dates for each H2O2 concentrations (p < 0.05).
Sustainability 12 02469 g003
Figure 4. Impact of H2O2 concentrations and terms of measurement on the total antioxidant capacity in potato leaves (T1—first day after the first application, T2—seventh day after the first application, T3—first day after the second application, T4—seventh day after the second application); (a) method with ABTS•+ radical, (b) method with DPPH•+ radical. * Lowercase letters indicate significant differences between the means on respective measurement dates, and capital letters indicate significant differences between the measurement dates for each H2O2 concentrations (p < 0.05).
Sustainability 12 02469 g004
Figure 5. Changes in fresh mass of plants and condition assessment of plants (9—most favorable, 1—least favorable) at the end of the experiment (seventh day after the second application H2O2).
Sustainability 12 02469 g005