Article

Seismic Reliability-Based Design Approach for Base-Isolated Systems in Different Sites

by
Paolo Castaldo
1,* and
Tatiana Ferrentino
2
1
Department of Structural, Geotechnical and Building Engineering (DISEG), Politecnico di Torino, 10129 Corso Duca degli Abruzzi, Italy
2
Department of Civil Engineering, University of Salerno, 84084 Fisciano (SA), Italy
*
Author to whom correspondence should be addressed.
Sustainability 2020, 12(6), 2400; https://doi.org/10.3390/su12062400
Submission received: 28 January 2020 / Revised: 12 March 2020 / Accepted: 16 March 2020 / Published: 19 March 2020

Abstract

:
This study employs the seismic reliability-based design approach for inelastic structures isolated by friction pendulum isolators, considering two different highly seismic Italian sites to provide useful design recommendations. Incremental dynamic analyses are carried out to estimate the seismic fragility of the superstructure and of devices, assuming different structural properties and limit state thresholds. Finally, considering seismic hazard curves of the investigated sites, seismic reliability-based design curves are proposed to derive the dimensions in plan of devices and the ductility demand of the superstructure as a function of both the structural properties and the reliability level expected. The proposed results confirm the possibility of using seismic reliability-based design as a sustainable and applicable approach and represent a large data set to adopt this design methodology in any site with a similar seismic hazard.

1. Introduction

In line with [1], the safety assessment of structural systems as well as the study of techniques aimed at improving their reliability is a fundamental step within the idea of a holistic perspective for safety assessment of structures and infrastructures. In this context, the friction pendulum system (FPS) is an effective seismic isolation technique [2,3,4] for building frames due to its advantages (i.e., the isolated period does not depend on the mass of the superstructure and its properties in terms of longevity and durability). Over the years, modeling issues of FPS devices have been studied by [5,6,7,8] as well as other works that have investigated how the seismic performance is affected by the properties of the structural system and of the FPS isolator and by the characteristics of the seismic input. In this context, probabilistic analyses of base-isolated systems [9,10,11,12,13] have been developed including uncertainties in characteristics related to both the isolation devices and ground motions. In [14], a probabilistic evaluation of the seismic performance of steel buildings equipped with FPS devices was carried out in comparison to the response of non-isolated structures. Seismic reliability and robustness analyses of a 3D reinforced concrete (r.c.) elastic structure with FPS isolators were carried out in [15,16], assuming uncertainty in both the coefficient of friction and in the main characteristics of the vertical and horizontal components of each seismic excitation. The proposal of the seismic reliability-based design (SRBD) approach for elastic systems equipped with FPS was presented in [17], illustrating the results for several structural properties. In [17], the superstructure behaviour was assumed to be elastic, and any inelastic interaction with the non-linear isolation level response was not considered. However, when strong seismic events occur, the superstructure of a base-isolated system can present an inelastic response and, in this situation, seismic codes [18,19,20,21,22] provide low values of the strength reduction factor [18,22] or behavior factor [18,19] in order to avoid the ensuing non-linear phenomenon of dynamic amplification (partial resonance) [23]. Specifically, the Italian seismic code NTC08, the European seismic code Eurocode 8 as well as the Japanese building code provide a maximum value for the behavior factor equal to 1.5 for base-isolated structures, without explicitly distinguishing the ductility term and overstrength factor term. The US seismic design code, ASCE 7, prescribes that the strength reduction factor for a seismically isolated structure is 0.375 times the one for a corresponding fixed-base structure, with an upper limit equal to 2. In this context, the authors of [24] proposed that, if the response of base-isolated structures is not elastic, the ratio between the displacement ductility demand μ and the strength reduction factor R (or behavior factor) is equal to 3, confirming that the relationships published by [25,26] for flexible structures and for stiff structures cannot be used for base-isolated structures. Castaldo et al. [27] extended the SRBD approach, proposed by [17] for elastic systems, to inelastic perfectly elastoplastic base-isolated structures, defining seismic reliability-based relationships between the displacement ductility and the strength reduction factor and SRBD curves for FPS devices, assuming the seismic hazard of the L’Aquila site (Italy). In [28], the SRBD approach was successively extended to hardening and softening structures.
This study employs the SRBD approach for inelastic structures isolated by friction pendulum system (FPS) isolators to provide useful design recommendations for two Italian sites (i.e., Sant’Angelo dei Lombardi and Chiusaforte) with a high seismic hazard. The influences of the main mechanical parameters for base-isolated systems on the global inelastic performance are investigated considering several combinations of inelastic and elastic building properties, at different seismic intensity levels. In compliance with [27], the isolated structures are modeled as equivalent 2-degree-of-freedom (2dof) systems with a perfectly elastoplastic rule for the superstructure and a velocity-dependent model [5] for the non-linear FPS. The sliding friction coefficient and the uncertainties in the seismic records are assumed as relevant random variables. Precisely, assuming a Gaussian probability density function (PDF) for the friction coefficient, the Latin Hypercube Sampling (LHS) method [29,30,31] is adopted to sample the input data set. The two different Italian sites with a high seismic hazard assumed in this study are: Sant’Angelo dei Lombardi (lon: 15.21; lat: 40.922) and Chiusaforte (lon: 13.272; lat: 46.435). These two sites have been selected because they are characterized, respectively, by higher and lower seismic hazard in comparison to the L’Aquila site [27]. Scaling natural seismic records to the seismic intensities at the life safety limit state (in 50 years) for the two Italian sites, the yielding properties of the superstructures are defined for increasing strength reduction factors, in line with the codes [18,19,20,21]. Afterwards, incremental dynamic analyses (IDAs) are herein developed to compute the superstructure and FPS responses for increasing intensity levels and to derive seismic fragility curves of both the superstructure and the isolation level, assuming appropriate thresholds in relation to the limit states. By means of the convolution integral of the fragility curves with the seismic hazard curves of the two Italian sites, the seismic reliability curves of inelastic base-isolated structural systems, with a reference life of 50 years, are achieved. Finally, seismic reliability-based regression expressions that relate the displacement ductility demand to the ductility-dependent strength reduction factors, together with seismic reliability-based design (SRBD) curves to define the dimensions in plan of the FPS devices, are proposed for each Italian site. The results of the two sites, together with other literature outcomes related to another site [27], confirm the possibility of using seismic reliability-based design and represent a large data set useful to apply the SRBD methodology for a reliable preliminary design of base-isolated building frames with FPS devices in any area with a similar seismic hazard.

2. Inelastic Model with Equations of Motion for a Structural System Isolated by Single Concave Sliding Devices

In this section, the model of Naeim and Kelly [32] is revised to take into account the non-linearities in the response of single concave sliding bearings and of the superstructure (Figure 1). Precisely, the following equations of motion for an inelastic 2dof system isolated with FPS bearings (Figure 1) under a seismic input u ¨ g ( t ) apply:
( m b + m s ) u ¨ b + m s u ¨ s + c b u ˙ b + W R u b + φ d W sgn u ˙ b = ( m b + m s ) u ¨ g
m s u ¨ b + m s u ¨ s + c s u ˙ s + f s ( u s , sgn u ˙ s ) = m s u ¨ g
where u b denotes the displacement of the isolation devices with respect to the ground, m s and m b are, respectively, the mass of the superstructure and of the isolation level, W = ( m b + m s ) g is the weight on the seismic isolator, g is the gravity constant, R is the radius of curvature of the FPS, c s is the viscous damping constant of the superstructure, c b is the viscous damping constant of the bearing, and φ d is the friction coefficient of the seismic device. This last value depends on the velocity, according to [5,6,7], as follows:
φ d = f max ( f max f min ) exp ( α u ˙ b )
where f max and f min denote the friction coefficient at high and at very low velocities of sliding respectively, and α represents a constant for a given pressure, temperature and condition of FPS interfaces. This constant has herein been set as equal to 30, with the value of 3 for the f max / f min ratio [5,6,7].
A bilinear hysteretic rule is used to model the isolator response in the hypothesis, in order to consider the horizontal component of the bearing displacements. The device’s restoring force can be expressed as follows:
f b = W R u b + φ d W sgn ( u ˙ b )
A perfectly elastoplastic model is assumed to represent the inelastic behavior of the superstructure. So, the superstructure response is elastic if Equation (4) is satisfied, and the corresponding restoring force is given by Equation (5):
| u s , i u 0 , i 1 | < u y   f s , i 1 = f y u ˙ s , i u ˙ s , i 1 < 0
f s , i ( u s , sgn u ˙ s ) = k s ( u s , i u 0 , i 1 )
where f s , i denotes the superstructure restoring force at time instant i , f s , i 1 denotes the superstructure restoring force at time instant ( i 1 ), u s , i represents the superstructure deformation with respect to the isolation level at time instant i , u ˙ s , i and u ˙ s , i 1 denote the superstructure velocity at time instants i and ( i 1 ), respectively, u 0 , i 1 represents the maximum plastic excursion at time instant ( i 1 ), u y is the yield displacement, f y is the yield force, and k s is the elastic superstructure stiffness. Contrarily, the superstructure response is plastic if
| u s , i u 0 , i 1 | u y
so the restoring force applies:
f s , i ( u s , sgn u ˙ s ) = f y sgn ( u s , i u 0 , i 1 )
Let us introduce the mass ratio γ = m s / ( m s + m b ) [32], the isolation ω b = k b / ( m s + m b ) = g / R and structural ω s = k s / m s circular frequency, and the isolation ξ b = c b / ( 2 ( m b + m s ) ω b ) and structural ξ s = c s / 2 m s ω s damping ratio, and divide Equation (1a) by m b + m s and Equation (1b) by m s ; the equations of motion in non-dimensional form are:
u ¨ b + γ u ¨ s + 2 ξ b ω b u ˙ b + g R u b + φ d g sgn u ˙ b = u ¨ g
u ¨ b + u ¨ s + 2 ξ s ω s u ˙ s + a s ( u s , sgn u ˙ s ) = u ¨ g
where a s ( u s , sgn u ˙ s ) = f s ( u s , sgn u ˙ s ) / m s represents the force per unit mass of the superstructure. As commented in the following, the term representative of the viscous properties of the FPS ξ b = c b / ( 2 ( m b + m s ) ω b ) can be assumed to be equal to zero since the dissipative properties are mainly related to the sliding behavior [33].
The seismic isolation degree [34] can be defined as the ratio of the isolation T b = 2 π / ω b over the superstructure T s = 2 π / ω s period of vibration: I d = T b / T s .
In the hypothesis that the inelastic response of the equivalent 2dof model is representative of the behavior of multi-story frames [35,36,37], the corresponding strength reduction factor, q, is related only to the ductility-dependent component [27,35] and is defined as:
q = f s , e l f y = u s , e l u y
where f s , e l and u s , e l denote, respectively, the peak response values for the corresponding linear system during a ground motion. As discussed in [28], the abovementioned strength reduction factor, multiplied by the overstrength factor, is equivalent to the behavior factor.
The displacement ductility, μ , of the inelastic superstructure is evaluated as the ratio of the peak displacement of the inelastic system, u s , max = | u s ( t ) | max , over the yield displacement uy:
μ = u s , max u y

3. Uncertainties

The seismic reliability of a structural system is an evaluation of the probabilities exceeding the structural performance (SP) within its reference service life (e.g., 50 years) [38,39,40,41,42,43]. In accordance with the Pacific Earthquake Engineering Research Center (PEER)-like modular approach [44] and performance-based earthquake engineering (PBEE) approach [45,46], the steps to assess seismic reliability are:
-
Definition of an intensity measure (IM), used to separate the seismic intensity uncertainties and the randomness in the characteristics of the record;
-
Carrying out IDAs, as described in the following, under a large set of real ground motions scaled to different values of the IM, considering the relevant random variables and monitoring the principal structural parameters;
-
Calculation of fragility curves, which define the probabilities exceeding the structural performance (limit state thresholds) conditional to an IM value;
-
Computation of the average annual rates exceeding the limit state thresholds through the convolution integral between the fragility curves and seismic hazard curves of the sites;
-
Calculation of the probabilities exceeding the structural performance (limit state thresholds) in the time frame of interest (e.g., 50 years) through the Poisson distribution.
In this context, this work evaluates the seismic reliability of inelastic systems with FPS, located in two different Italian sites, considering both the friction coefficient and earthquake characteristics as the relevant random variables. Neither epistemic [47] nor other aleatory uncertainties in the superstructure properties are included because of their negligible effects on the statistical values of the response parameters, according to [48], especially for high isolation degrees.
As for the uncertainty in the sliding friction coefficient at large velocity for FPS devices [5,6,7], an appropriate Gaussian probability density function (PDF) [27] truncated from 0.5% to 5.5%, with a mean value equal to 3% [49], and a coefficient of variation equal to around 0.7% are employed. These values of the PDF, considered as representative values, are also assumed to compare the results with the outcomes achieved in [27]. By means of the LHS method [29,30,31], the input data set of the friction coefficient f max is sampled. In the following parametric study, 15 values of the random variable f max are defined as described in detail by [27]. Note that the friction coefficient has been assumed as the relevant random variable in order to consider its aleatory uncertainty due to dependence on other parameters such as thermal heating, axial force and number of cycles, as widely discussed in [5,6,7].
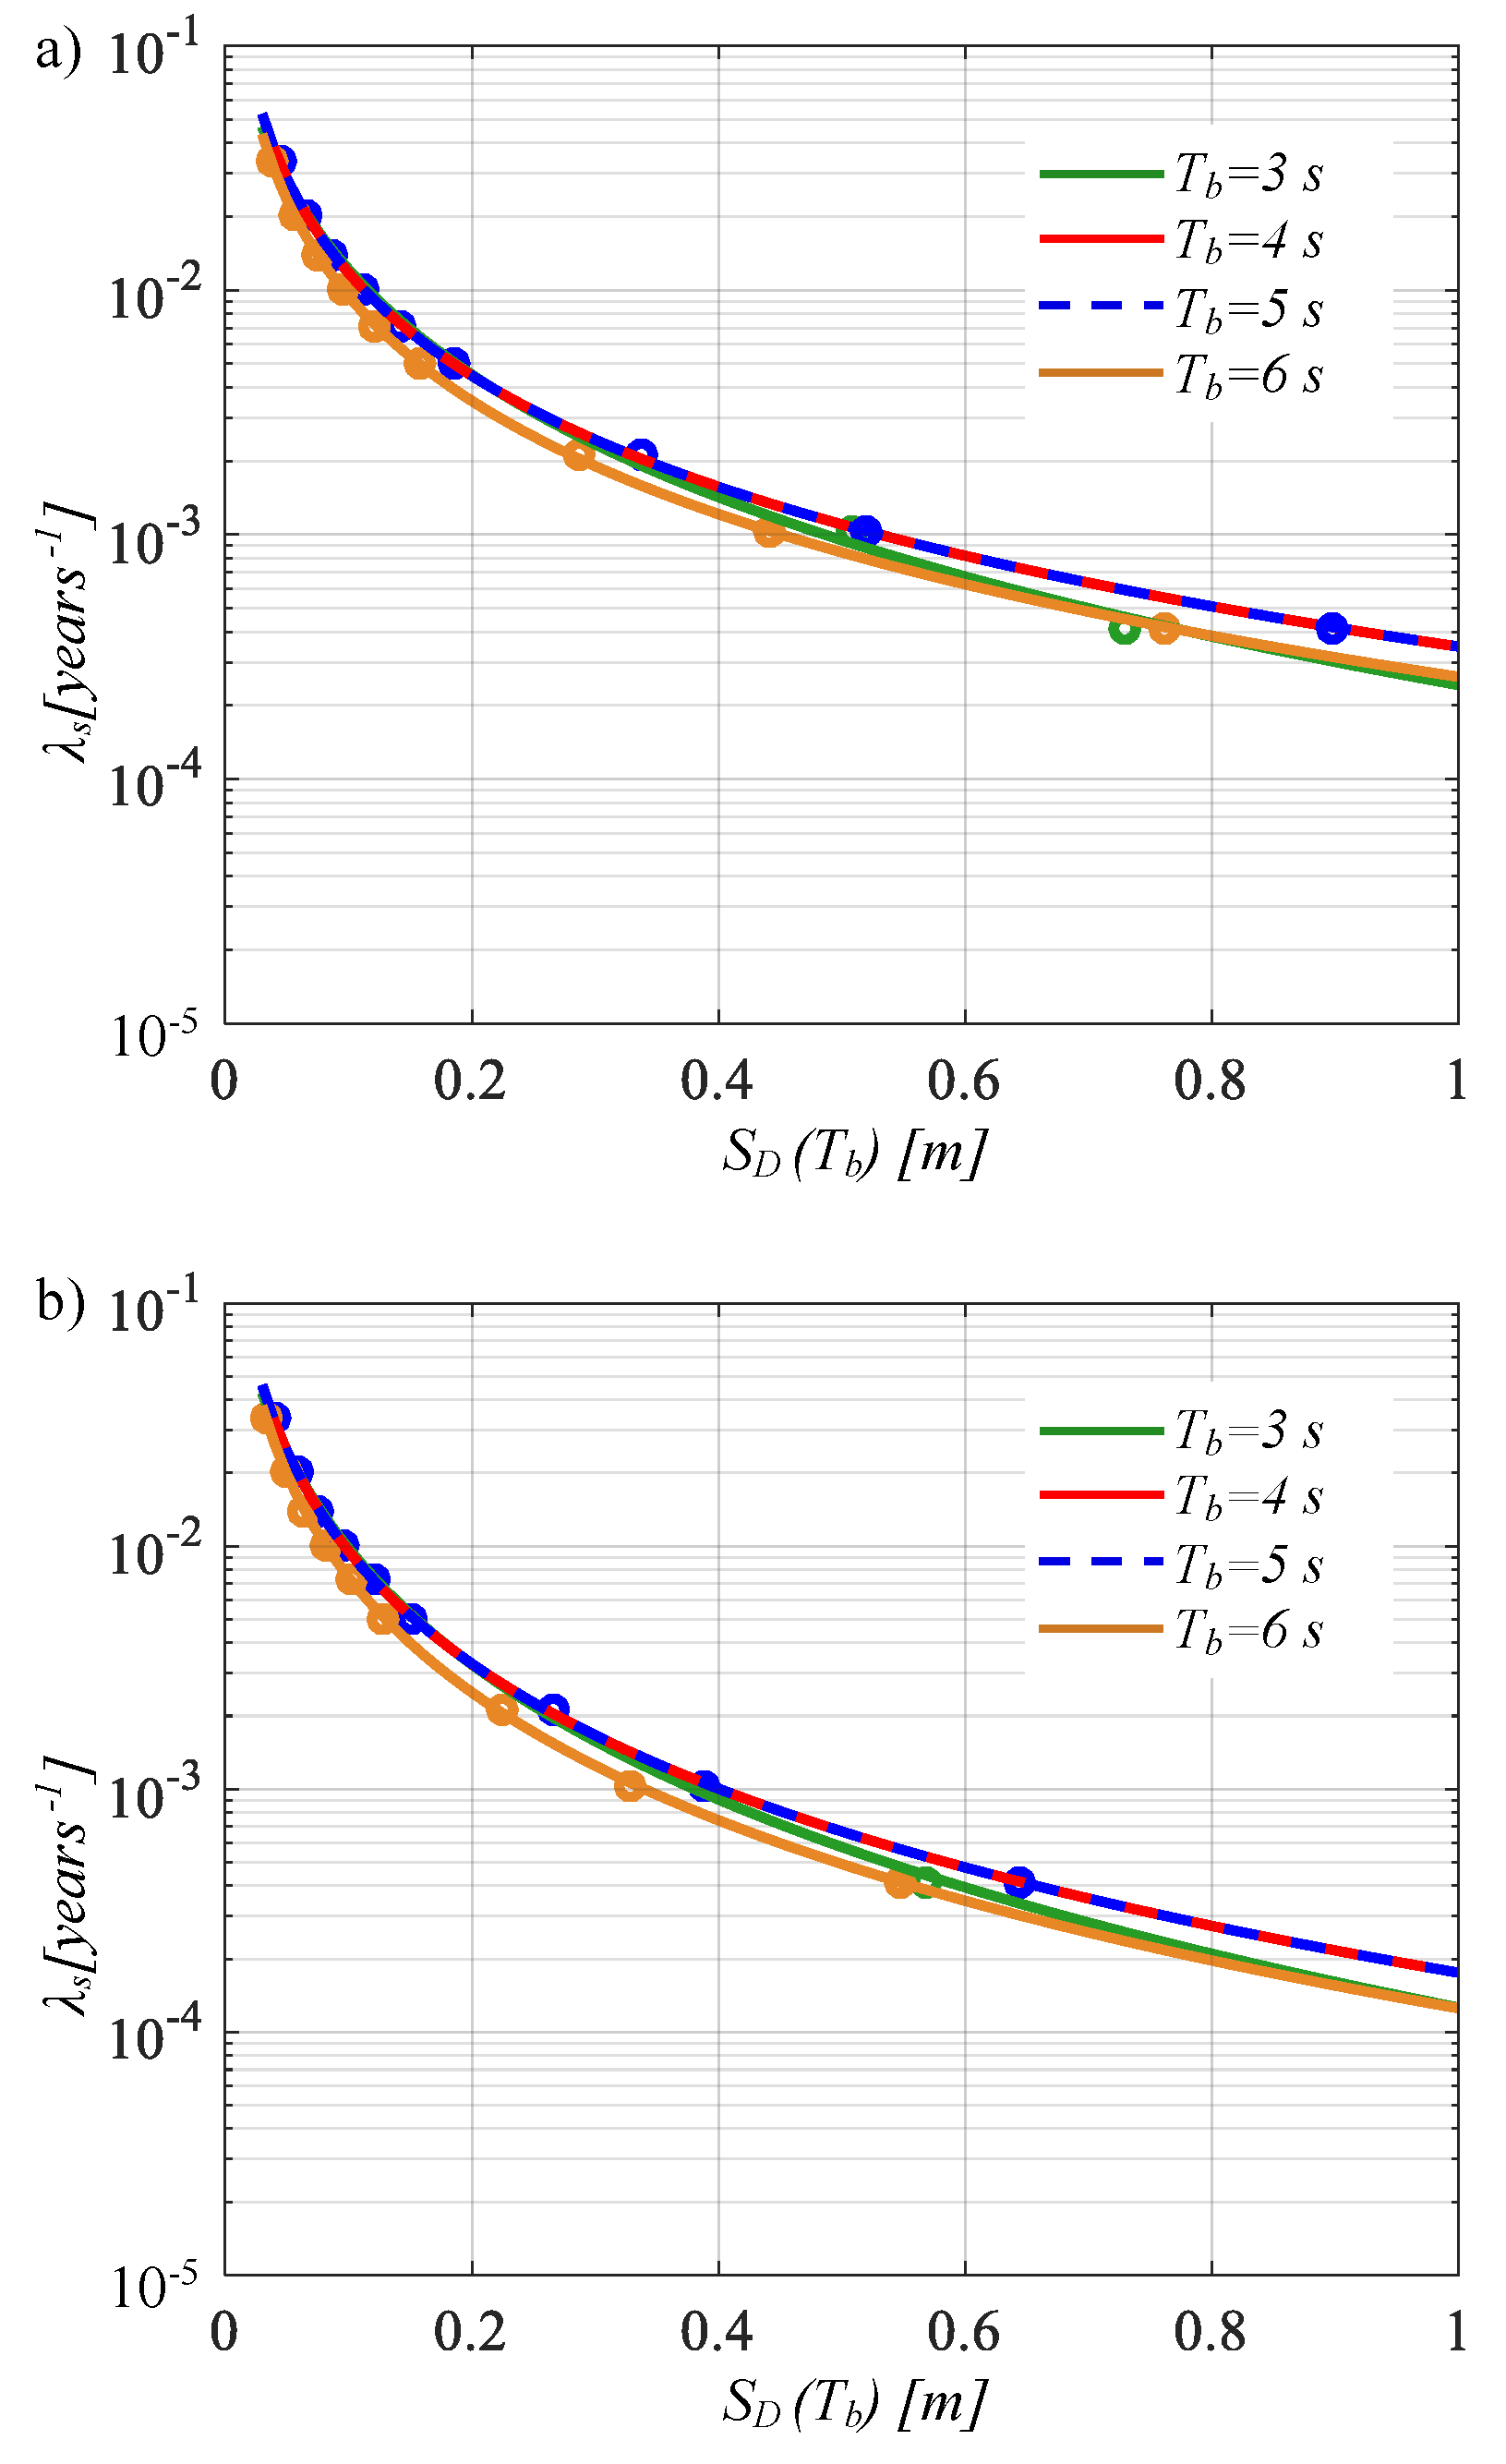
Regarding the seismic characteristics [45,46], the randomness in the seismic intensity can be described by a hazard curve, whereas the ground motion randomness for a fixed intensity level can be taken into account by means of a large set of different ground motion realizations scaled to the common IM value. In line with the efficiency, sufficiency, and hazard computability criteria [50,51], the spectral displacement S D ( ξ b , T b ) at the isolated period, T b = 2 π / ω b , with the damping ratio ξ b , which is related to the spectral acceleration, S D ( ξ b , T b ) = S p a ( ξ b , T b ) / ω b 2 , is chosen as the IM. In the analyses, the damping ratio ξ b is considered equal to zero, in compliance with other studies [27,33], so S D ( T b ) denotes hereinafter the corresponding IM. This study examines the local seismic hazard of the Sant’Angelo dei Lombardi site (Italy), with geographic coordinates 40°56′ N 15°11′ E, and the local seismic hazard of the Chiusaforte site (Italy), 46°24′ N 13°19′ E, for soil class B. The seismic hazard curves, expressed in terms of I M = S D ( T b ) and related to the isolated periods of interest (i.e., T b = 3 s, 4 s, 5 s and 6 s, as discussed in the next sections), have been defined according to NTC08, and are shown in Figure 2. Each curve, plotted in logarithmic scale, shows the average values of the annual rate λ exceeding the I M = S D ( T b ) level. From Figure 2, it can be observed that the seismic hazard curves related to the Sant’Angelo dei Lombardi site are higher than those related to the Chiusaforte site.
To take into account the record-to-record variability [50,51], a set of 30 ground motion records is defined. These records are derived from 19 different seismic natural events with a magnitude higher than 6 and an epicentral distance higher than around 9 km, selected from the ground motion databases of the Pacific Earthquake Engineering Research Center (PEER), of the Italian Accelerometric Archive (ITACA) and of the Internet Site for European Strong-Motion Data (ISESD) [52,53,54]. The characteristics of the selected ground motion records are reported in Table 1.
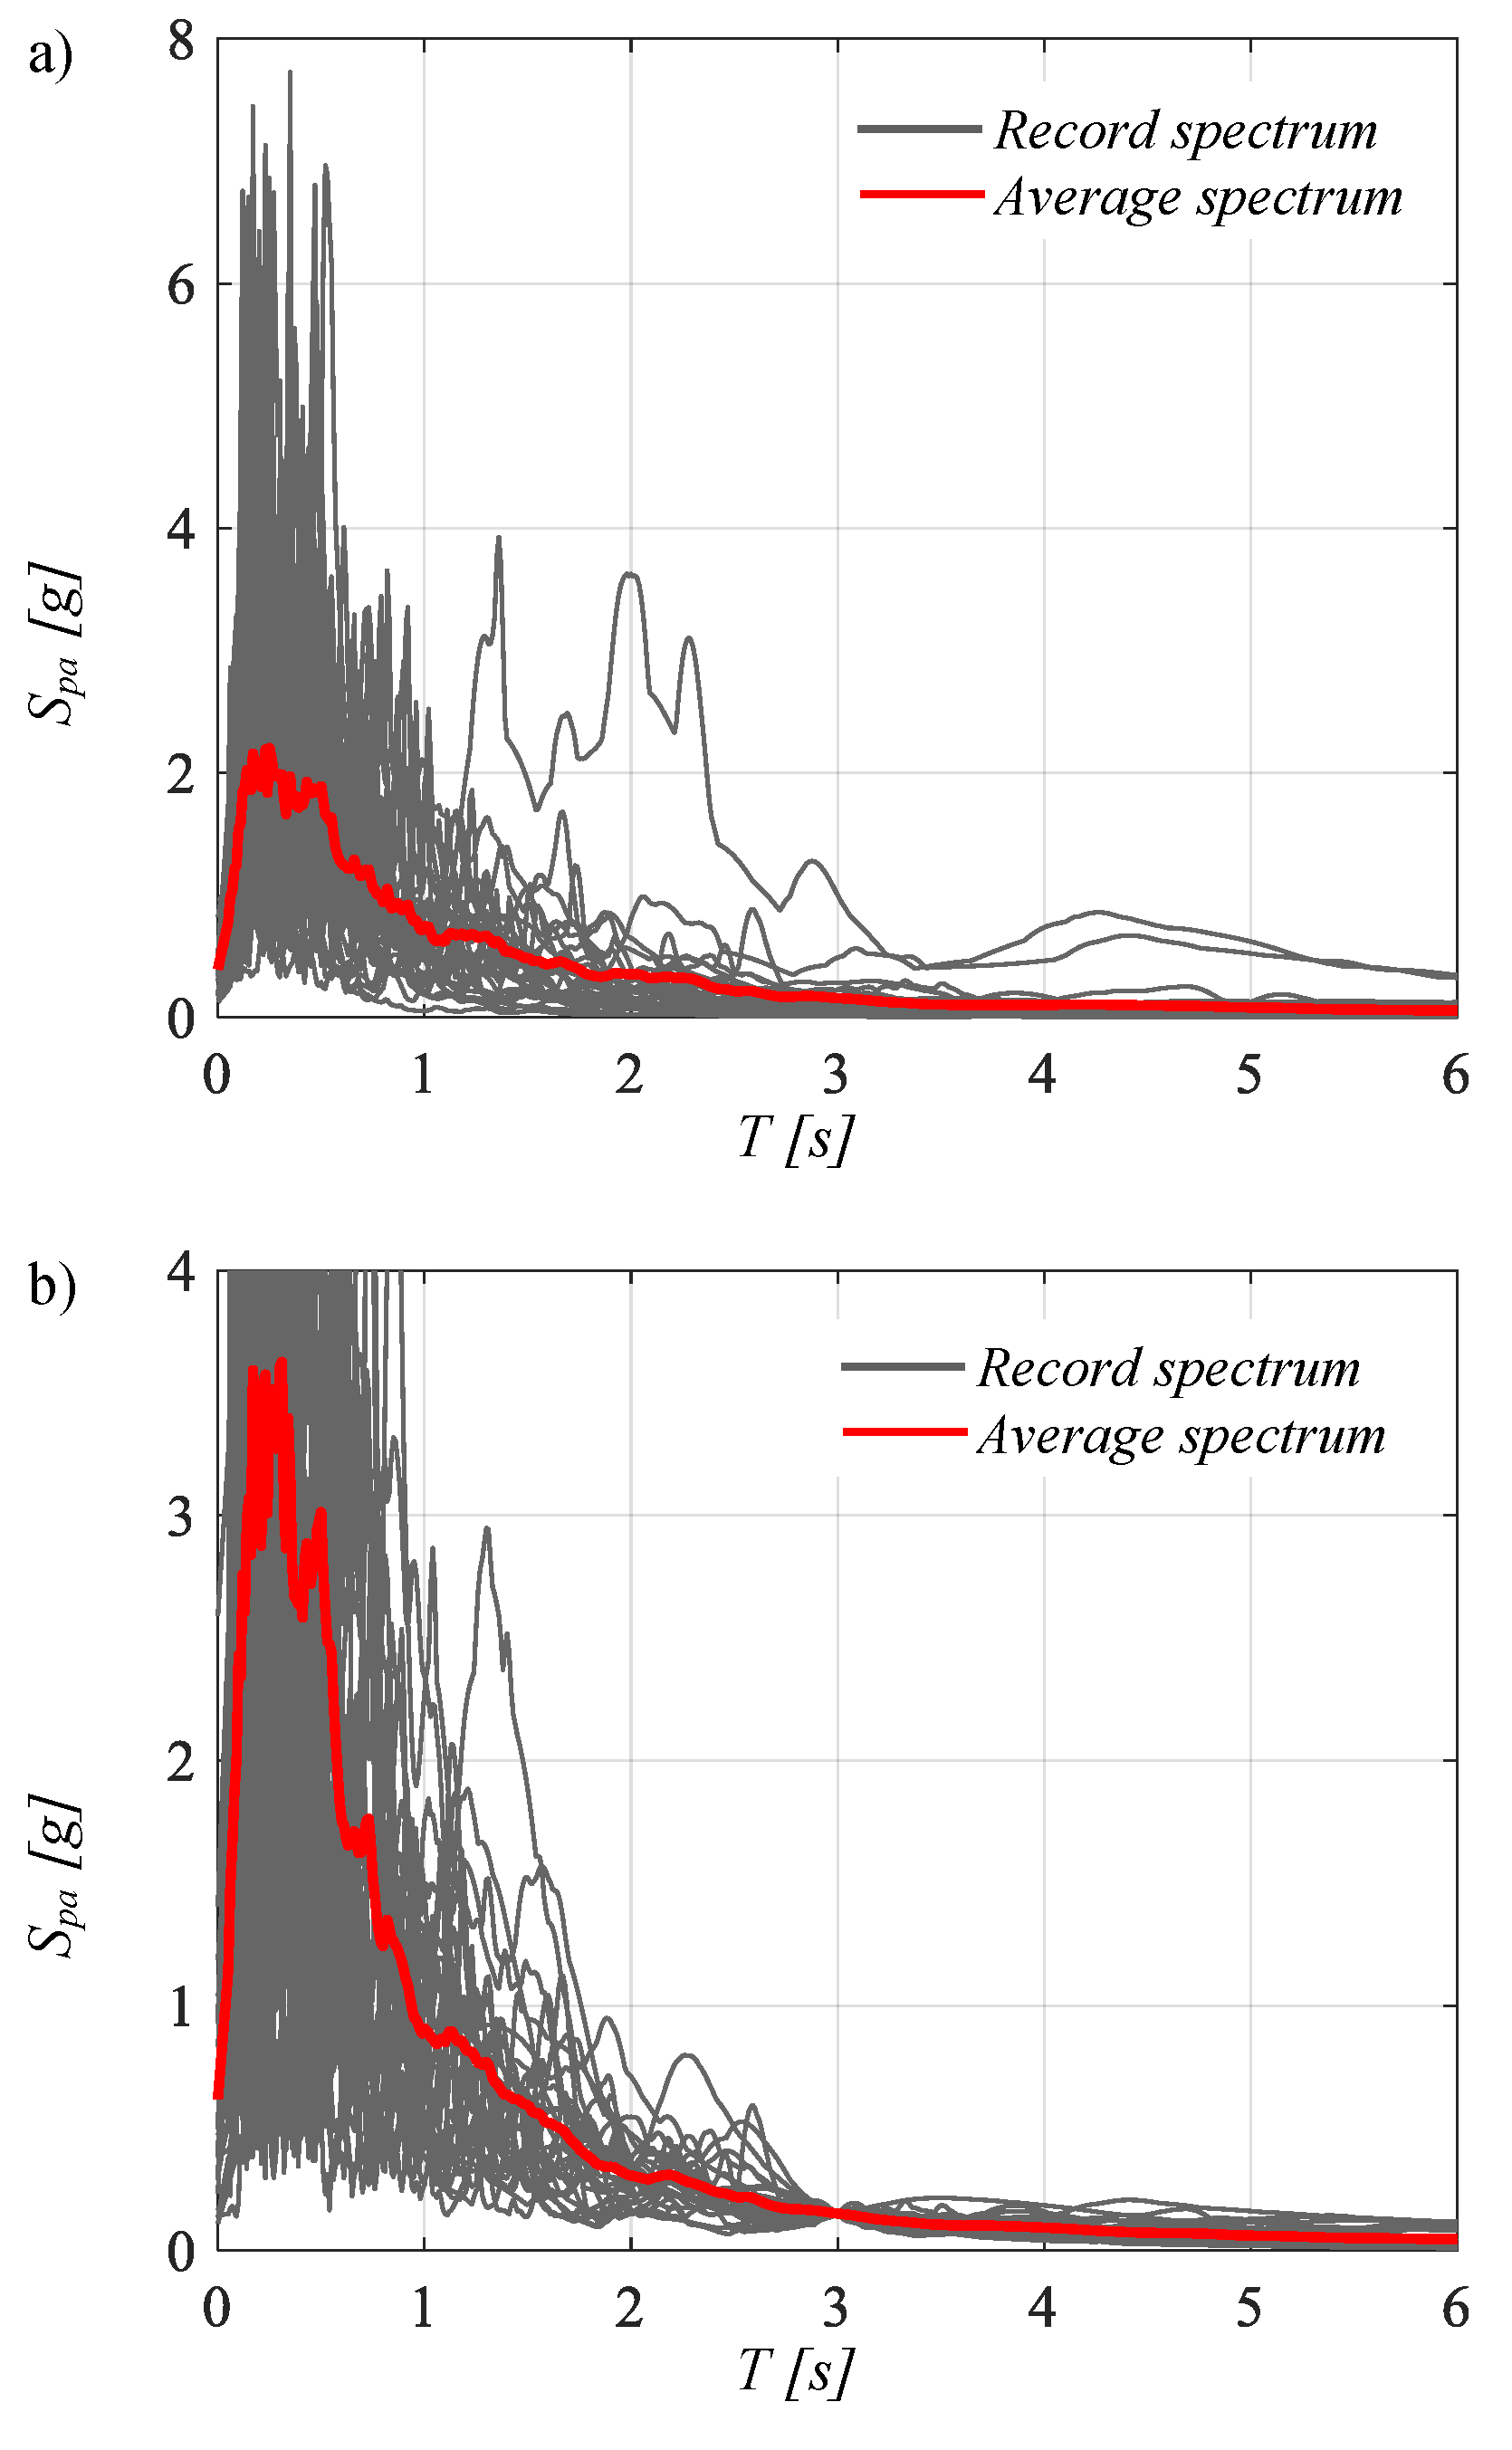
Figure 3a illustrates the response spectra S p a ( T b ) in terms of elastic pseudo-accelerations of the unscaled records of Table 1, whereas Figure 3b depicts the spectra of the records scaled to the IM value S D ( T b ) = 0.3376 m ( S p a ( T b ) = 0.151 g), the value derived from the seismic hazard of the Sant’Angelo dei Lombardi site (Italy) corresponding to the life safety limit state (in 50 years) for the period of 3 s, as an example.

4. Parametric Analysis

In order to determinate the seismic reliability of the inelastic base-isolated equivalent systems, located in Sant’Angelo dei Lombardi and Chiusaforte (Italy), respectively, the first step consists of carrying out incremental dynamic analyses (IDAs) [55] to assess the structural responses for increasing IM levels.
Several deterministic parameter combinations, according to Equation (8), are considered with the following range of variation: the seismic isolation degree I d : 2, 4, 6 and 8; the isolation period of vibration T b : 3 s, 4 s, 5 s and 6 s; the mass ratio γ : 0.6 and 0.8; the (ductility-dependent) strength reduction factor q : from 1.1 to 2 with a step of 0.1 [18,19,20,21]. The abovementioned values are herein considered with the scope to carry out a wide parametric analysis and compare the results with the outcomes of [27]. Combining the elastic properties (i.e., 4 values of both the I d and T b together with the 2 values of the mass ratio) with the inelastic properties (i.e., 10 values of the strength reduction factor q), 320 equivalent 2dof systems, with isolation damping ratio ξ b = 0% and superstructure damping ratio ξ s = 2%, are defined. With the purpose of developing the IDAs, the inelastic characteristics of each equivalent structural system have been designed for each site as explained in the following. Considering the elastic properties (i.e., with q = 1 for the superstructure), 32 different elastic equivalent 2dof systems with a design friction coefficient equal to 3% have been subjected to 30 seismic records, scaled to the IM = S D ( T b ) value related to the life safety limit state as stated in the code [19], for each site. Specifically, the IM = S D ( T b ) is equal to 0.3376 m at T b = 3, 4, 5 s (Figure 3b) and equal to 0.2872 m at T b = 6 s for the Sant’Angelo dei Lombardi site (Italy); the IM = S D ( T b ) is equal to 0.271 m at T b = 3, 4, 5 s (Figure 3b) and equal to 0.23 m at T b = 6 s for the Chiusaforte site (Italy). The dynamic analyses of the 32 base-isolated systems, located in the two different Italian sites, were run in Matlab-Simulink [56]. The elastic responses of the superstructure to the 30 scaled seismic records, expressed in terms of displacements relative to the base u s , e l , made it possible to compute the average yield strength f y , average and the average displacement u y , average for each value of q (i.e., the inelastic characteristics of 320 equivalent perfectly elastoplastic structural systems) in each site, according to Equation (11).
u y , average = f y , average k s = f s , e l , average k s q = u s , e l , average q

Incremental Dynamic Analysis Results

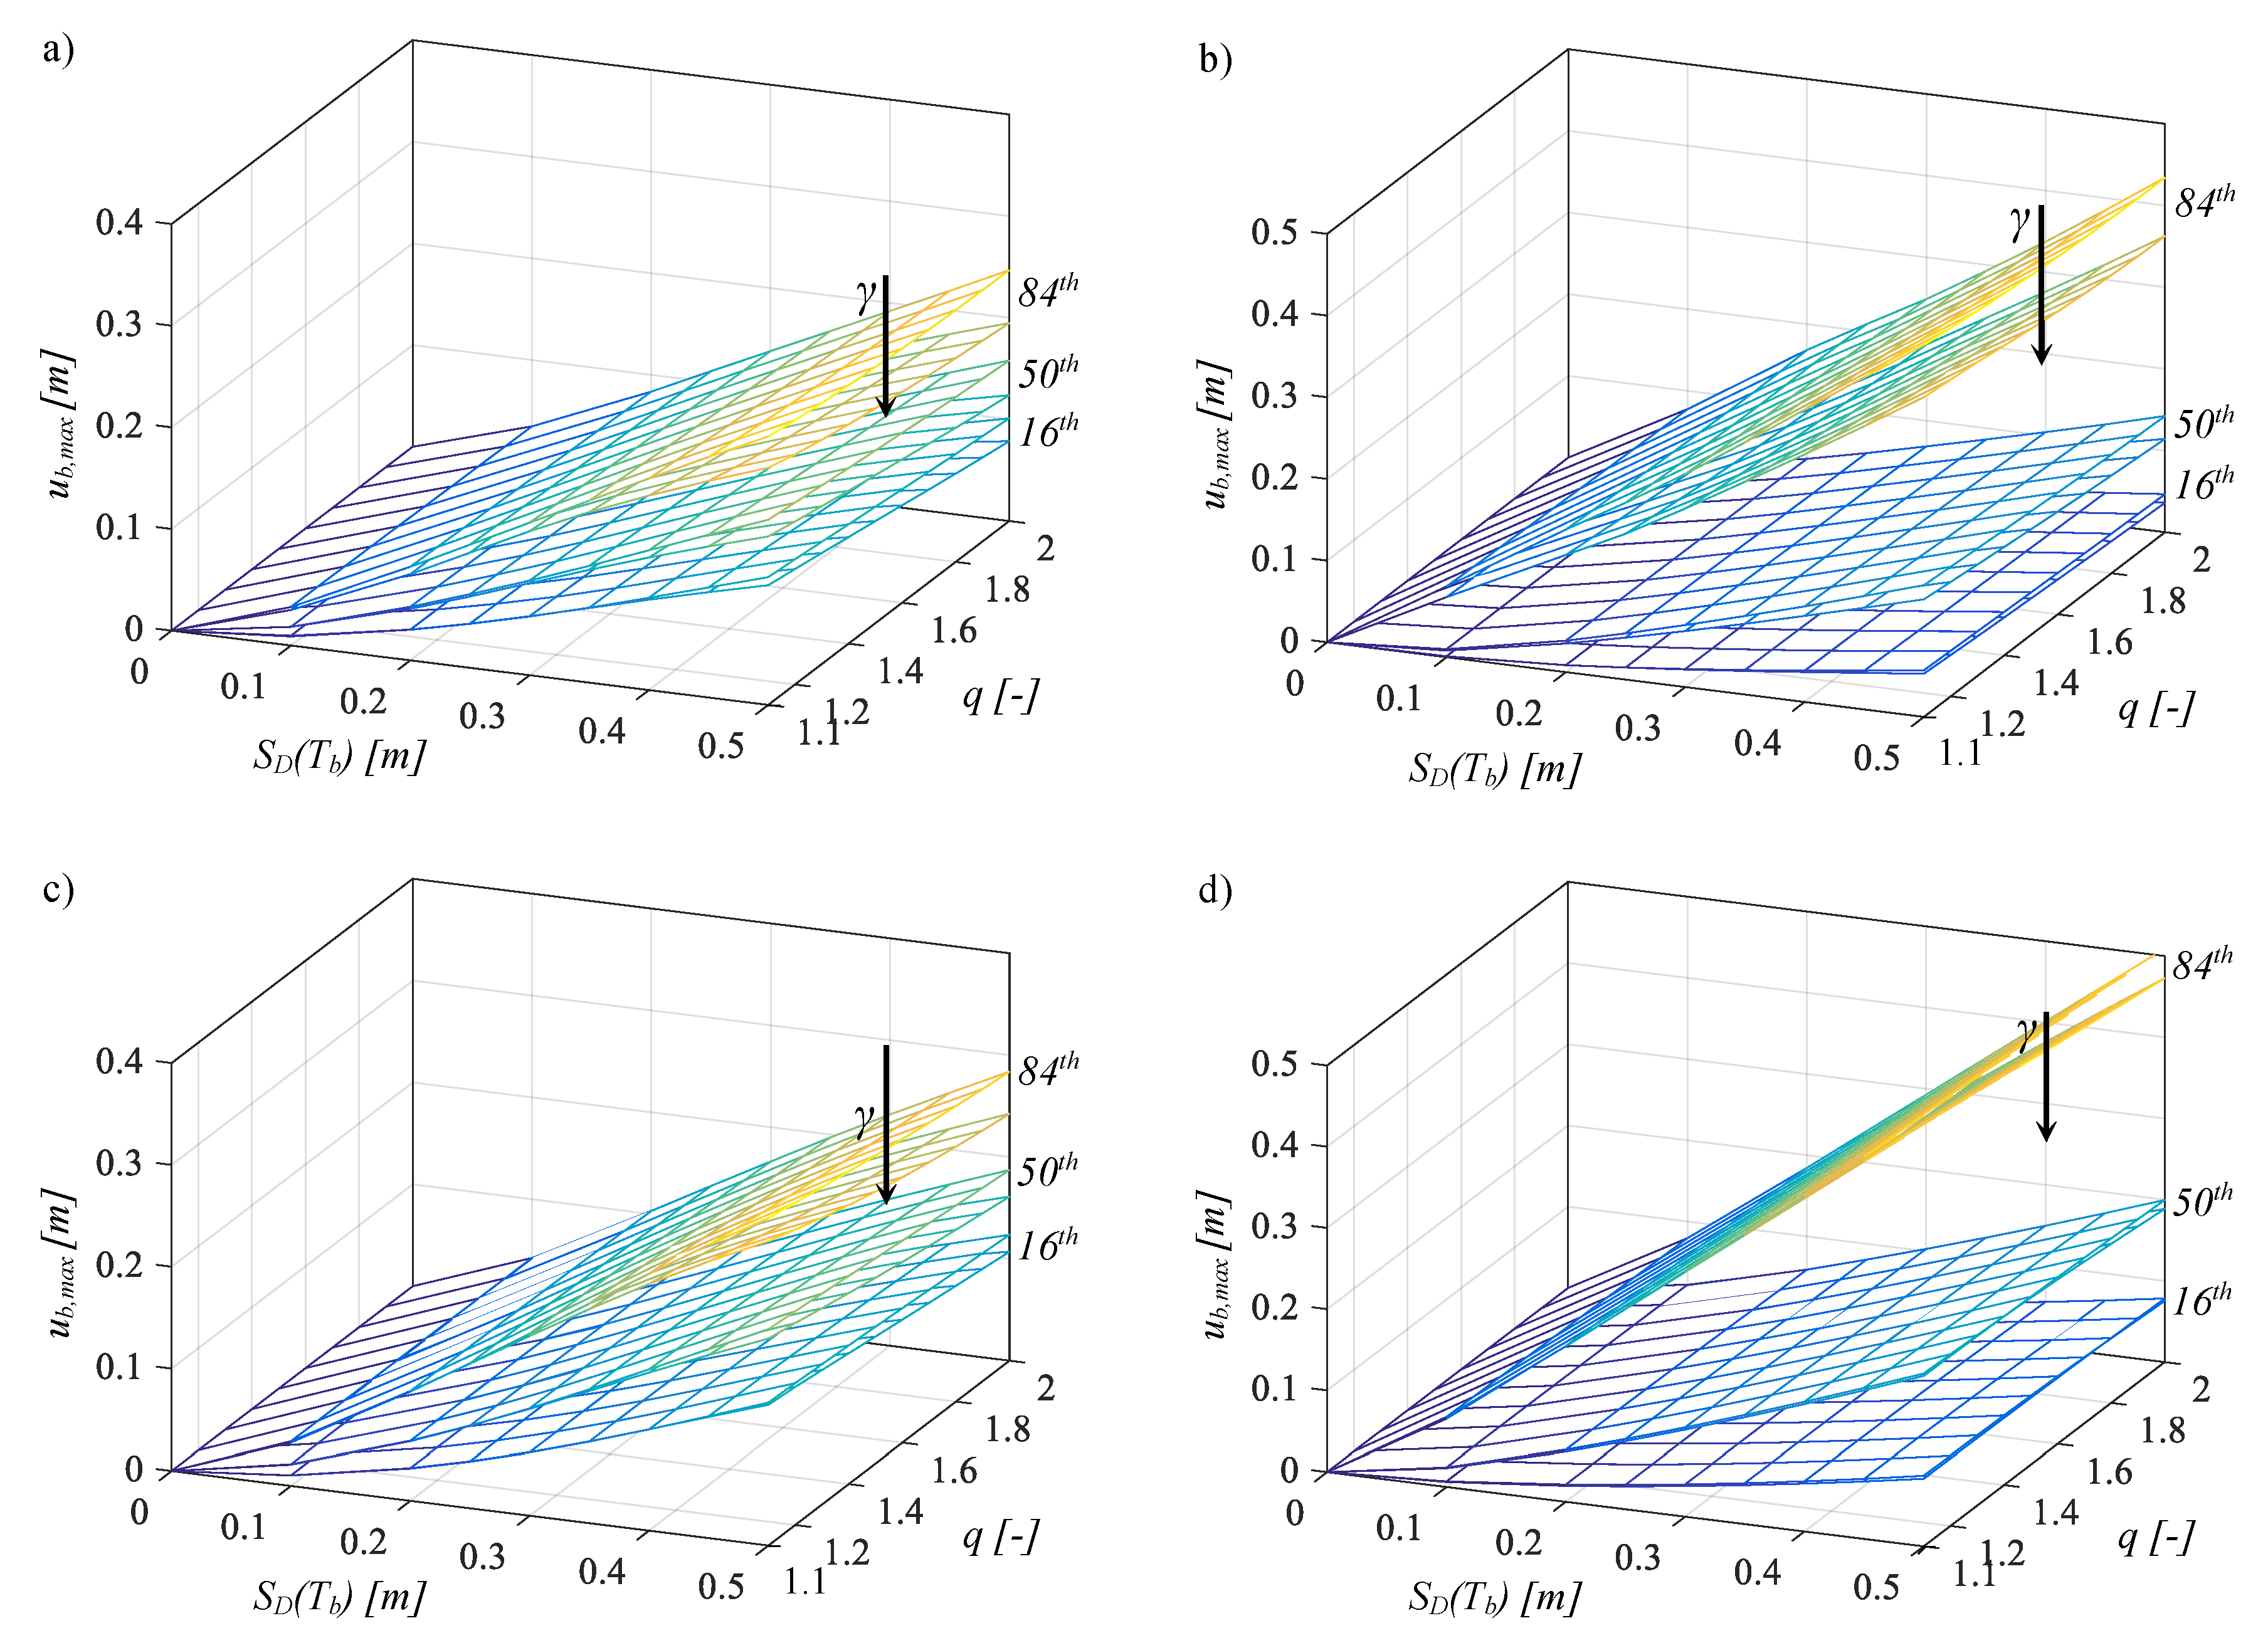
In this section, the IDA is performed. Specifically, for each site, each one of 320 different equivalent structural systems, combined to each value of 15 sampled friction coefficients, is subjected to 30 ground records with an intensity measure scaled to eight increasing levels. For the Sant’Angelo dei Lombardi site (Italy), the eight values of IM range from 0 m to 0.50 m, whereas for the Chiusaforte site (Italy), the IM ranges from 0 m to 0.45 m to cover the wide uncertainty in the IM up to values higher than the one related to the collapse limit state, according to [19]. The isolated non-linear systems are modeled in Matlab-Simulink [56] to solve the coupled equations (Equation (8)) and to determine the isolation and superstructure responses employing the Runge–Kutta–Fehlberg integration algorithm. The results of the incremental non-linear dynamic analyses (IDAs) are expressed in terms of the displacement ductility demand μ for the superstructure and the maximum displacement with respect to the ground u b , max = | u b ( t ) | max for the isolators. The response parameters μ and u b , max are assumed as engineering demand parameters (EDPs) for base-isolated systems and assumed to follow a lognormal distribution in compliance with PBEE [45] and with scientific literature studies [27,33,57]. A lognormal cumulative distribution can be used to probabilistically model both response parameters (i.e., the extreme values of the EDPs), by estimating the sample lognormal mean μ ln ( E D P ) , and the sample dispersion β ( E D P ) , by means of the maximum likelihood estimation method. From the knowledge of the sample lognormal mean and the dispersion, the 50th, 84th and 16th percentile of each lognormal distribution can be calculated [58,59]. Note that no numerical or physical threshold on the response parameters has been used in order to numerically calculate the statistical values. This means that the peak values from the non-linear time histories represent, respectively, the displacement demands for the superstructure and for the isolators.
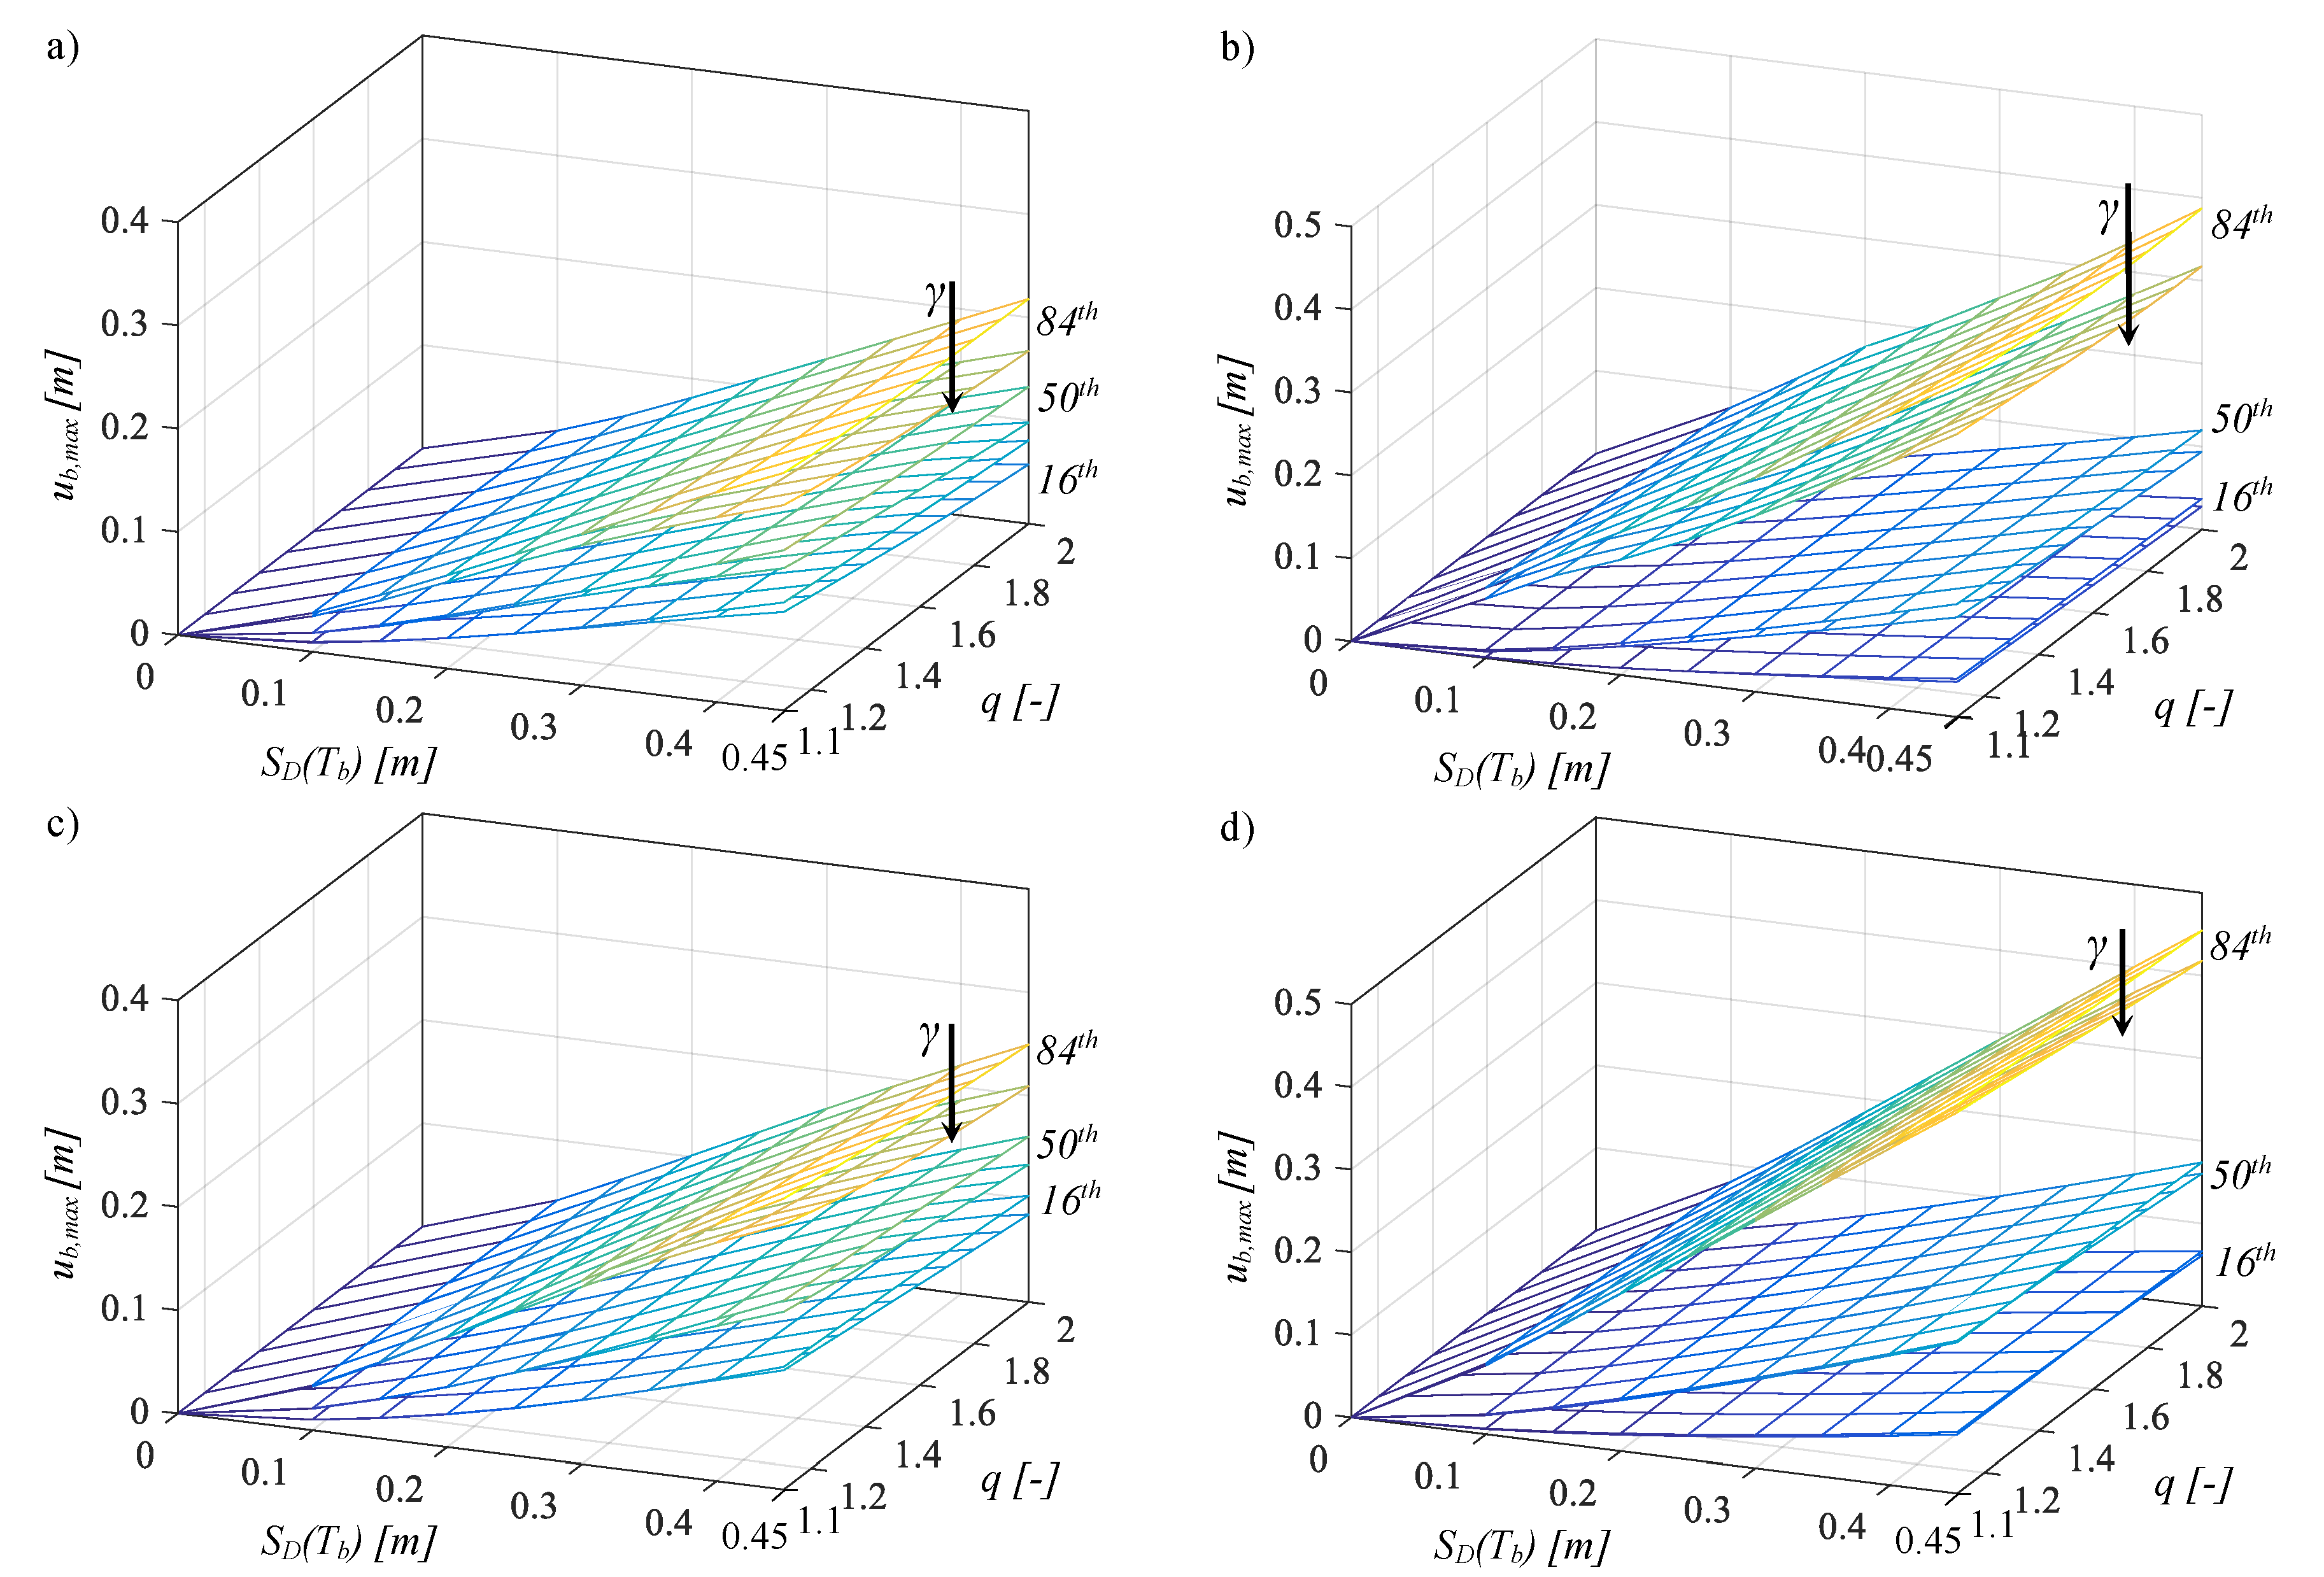
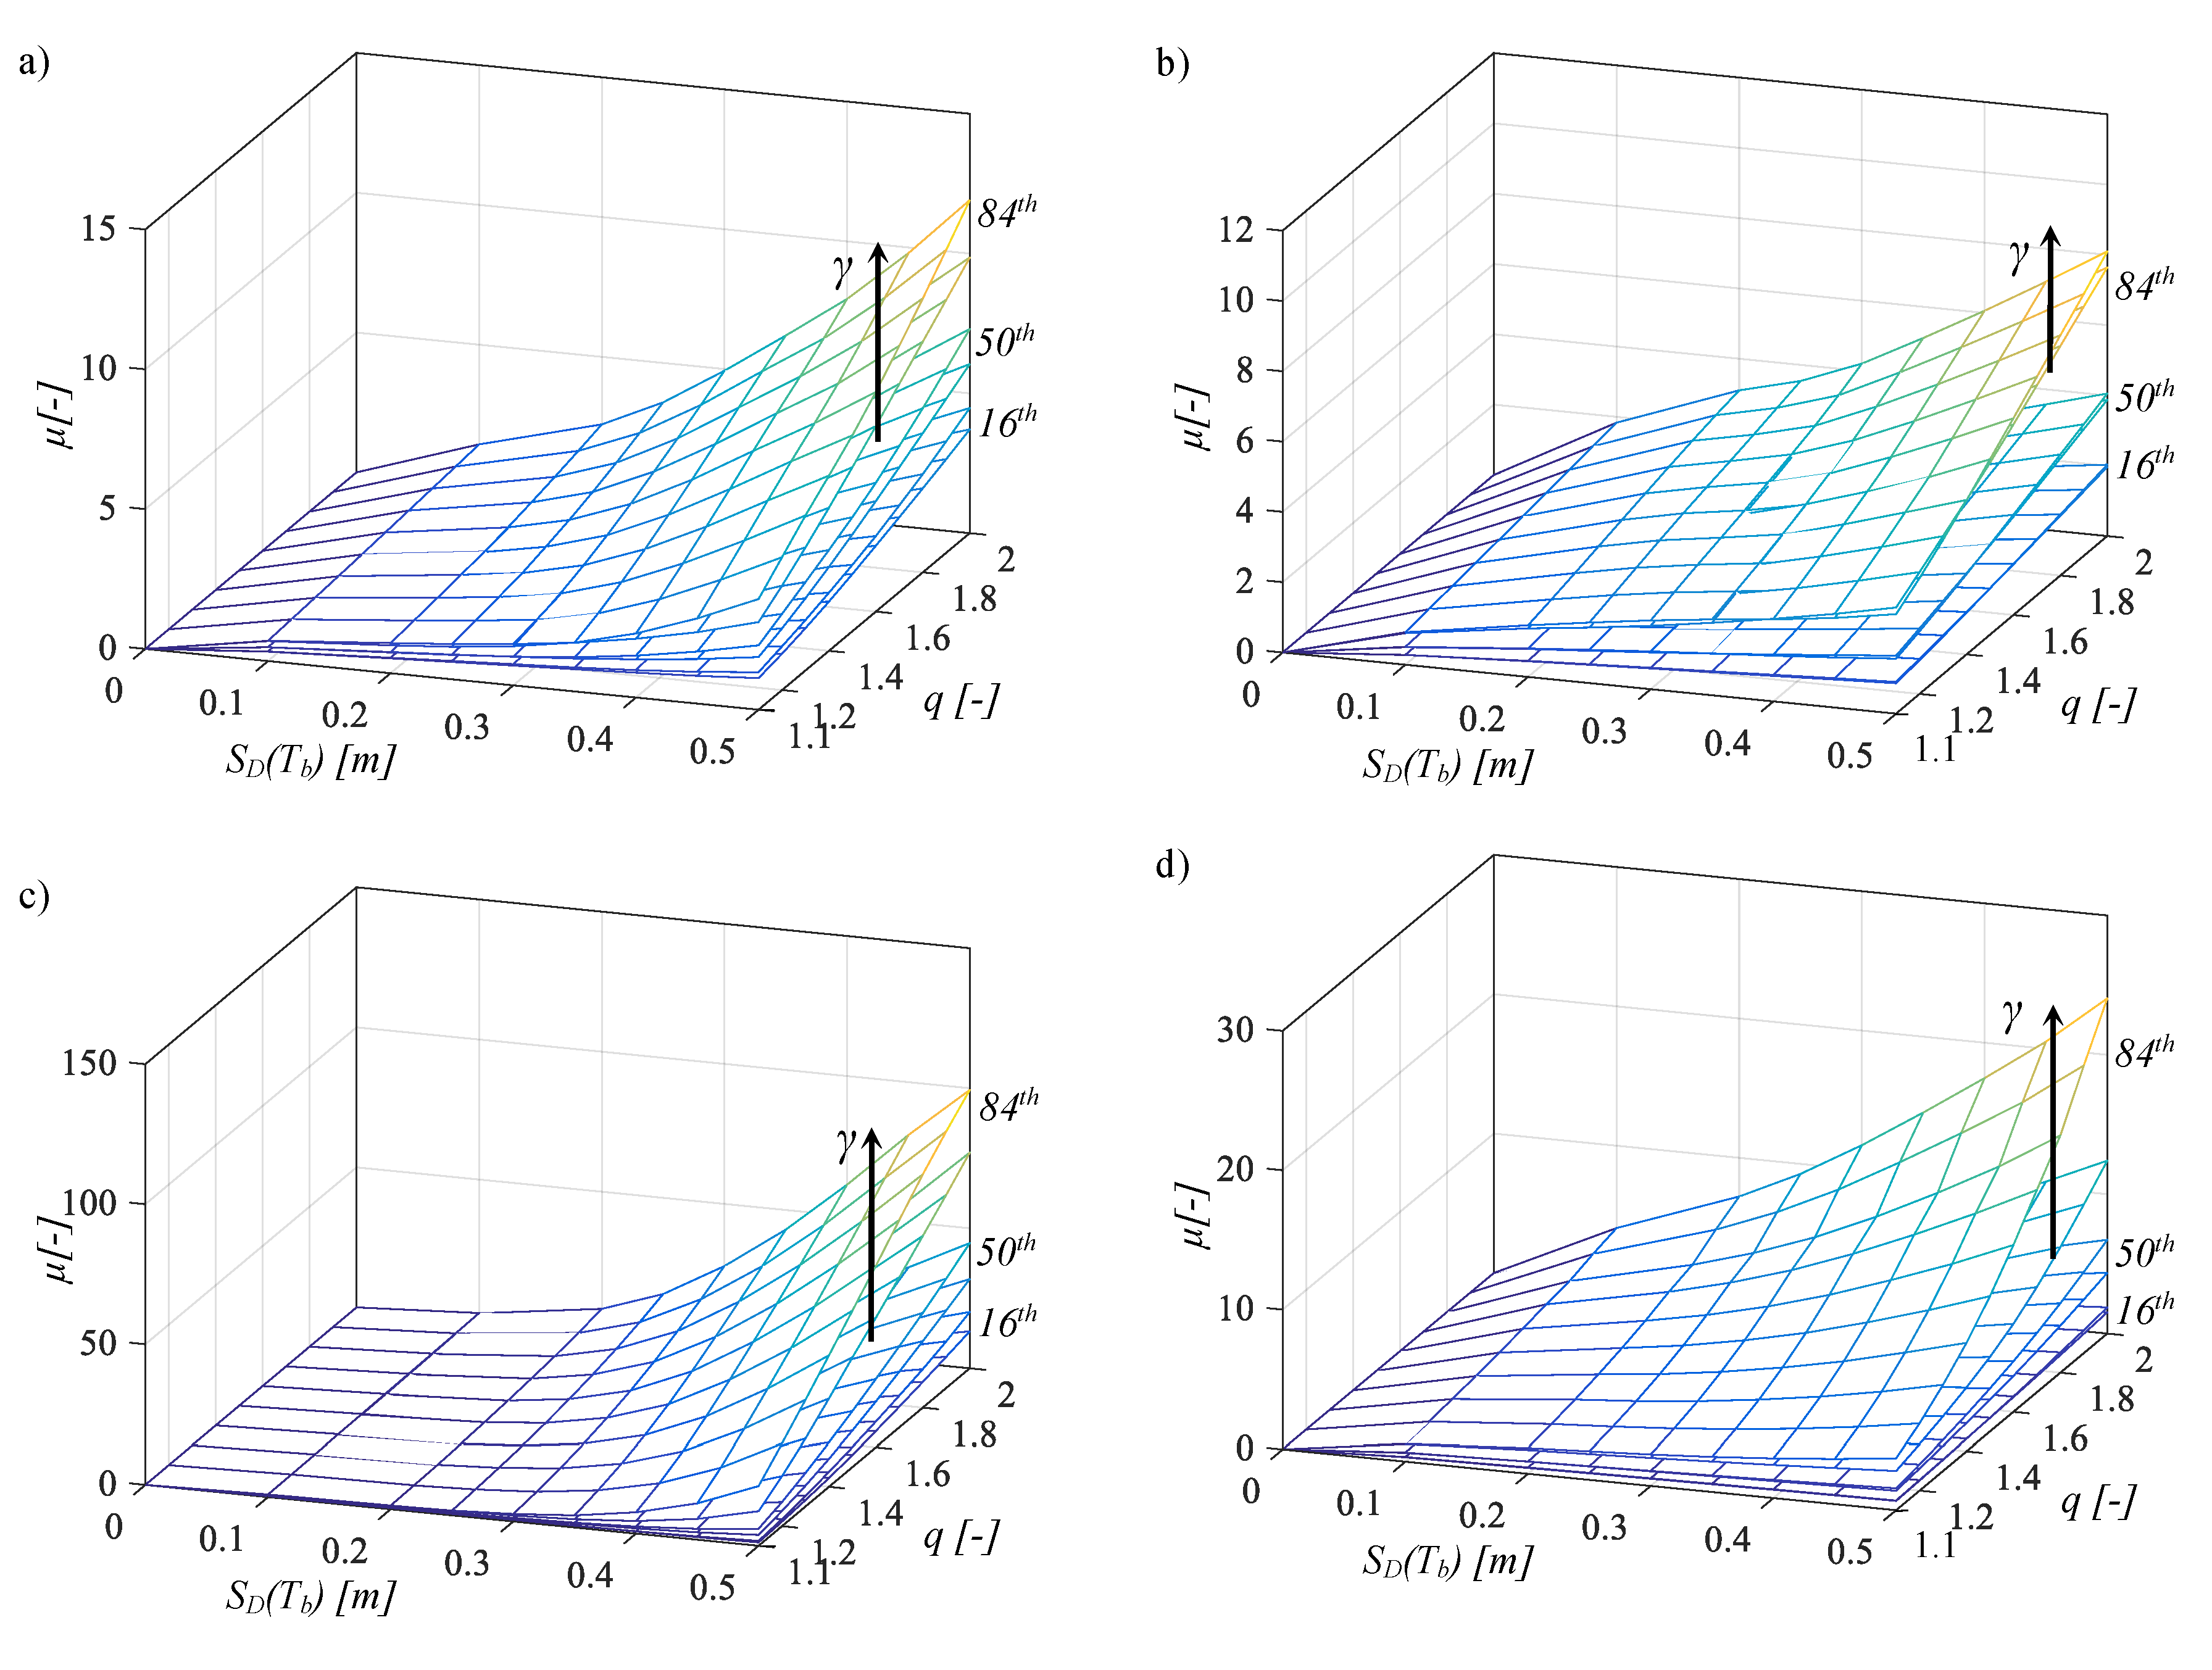
The IDA results developed in this study for equivalent isolated structures, located in the Sant’Angelo dei Lombardi site and in the Chiusaforte site, respectively, are illustrated in Figure 4, Figure 5, Figure 6 and Figure 7, in the form of meshes versus the intensity measure IM, while increasing the (ductility-dependent) strength reduction factor q. Each figure shows several surfaces for the different values of the mass ratio and of the percentile. Only the results corresponding to I d = 2 and 8, with T b = 3 s and 6 s, for each site of interest, are shown since the IDA results corresponding to the other values of Id and Tb are characterized by an intermediate trend for each site.
Figure 4 and Figure 5 illustrate the IDA results of the isolation device response parameter u b , max , corresponding to the different values of the system properties. The statistics of the EDP u b , max are influenced by I d and T b : the lognormal mean increases by decreasing T b and increasing I d , whereas the dispersion decreases by decreasing I d and T b . Both the statistical values increase by decreasing the mass ratio.
In addition, the variation of the strength reduction factor q has a negligible effect on the isolation response: a decrease in q leads to a slight increase in u b , max . Generally, the values of u b , max regarding the isolated systems located in the Sant’Angelo dei Lombardi site are slightly higher than the values related to the Chiusaforte site. Especially, the dispersion increases by increasing the seismic hazard and the intensity measure.
Figure 6 and Figure 7 depict the IDA curves of the superstructure EDP μ . The statistical value μ ln ( μ ) depends strongly on T b and I d : the displacement ductility demand μ increases by decreasing T b for fixed I d and q, in compliance with [60], but decreases for lower values of I d for fixed T b and q. In fact, an increase in T b , with values of both I d and q kept constant, leads to a less stiff structure. In this case, an increase in γ leads to an increase in superstructure damage, especially for a low value of I d . On the other hand, the strength reduction factor q strongly influences the superstructure behavior: the displacement ductility demand μ strongly increases with the increase in the strength reduction factor q. The statistical values of the EDP μ are quite similar for the two Italian sites.

5. Assessment of Seismic Fragility and Reliability

In this section, the seismic fragility, representative of the probabilities Pf exceeding different limit state thresholds conditional to each level of the IM, is estimated. Appropriate limit state thresholds have been selected, respectively, for the radius in plan of the single concave surface, r [m], for the FPS and the available displacement ductility, μ [-], for the superstructure as listed in Table 2 and Table 3. The reference failure probabilities in 50 years [39,40], which are not conditional to any level of the IM (i.e., Pf (50 years)), together with the assumed limit state thresholds corresponding to the limit states of the codes [18,19], are reported in Table 2 and Table 3. Precisely, as regards the isolation level, the reference failure probability in 50 years [39,40] related to the collapse limit state [19] is considered, whereas the reference failure probability in 50 years [39,40] for the superstructure is related to the life safety limit state [19], which has been considered during the design phase. The probabilities exceeding the different limit states at each level of the IM are numerically calculated by estimating the complementary cumulative distribution function (CCDF) for each one of the 320 equivalent structural systems, and then fitted through lognormal distributions [17,61] with an R-square higher than 0.9. Specifically, regarding a generic structural system, for each IM level, by means of the knowledge of the statistics of an EDP, it is possible to compute the probability exceeding a limit state threshold and then the complementary value with respect to 1. These complementary values for the increasing IM levels are fitted through a lognormal distribution.
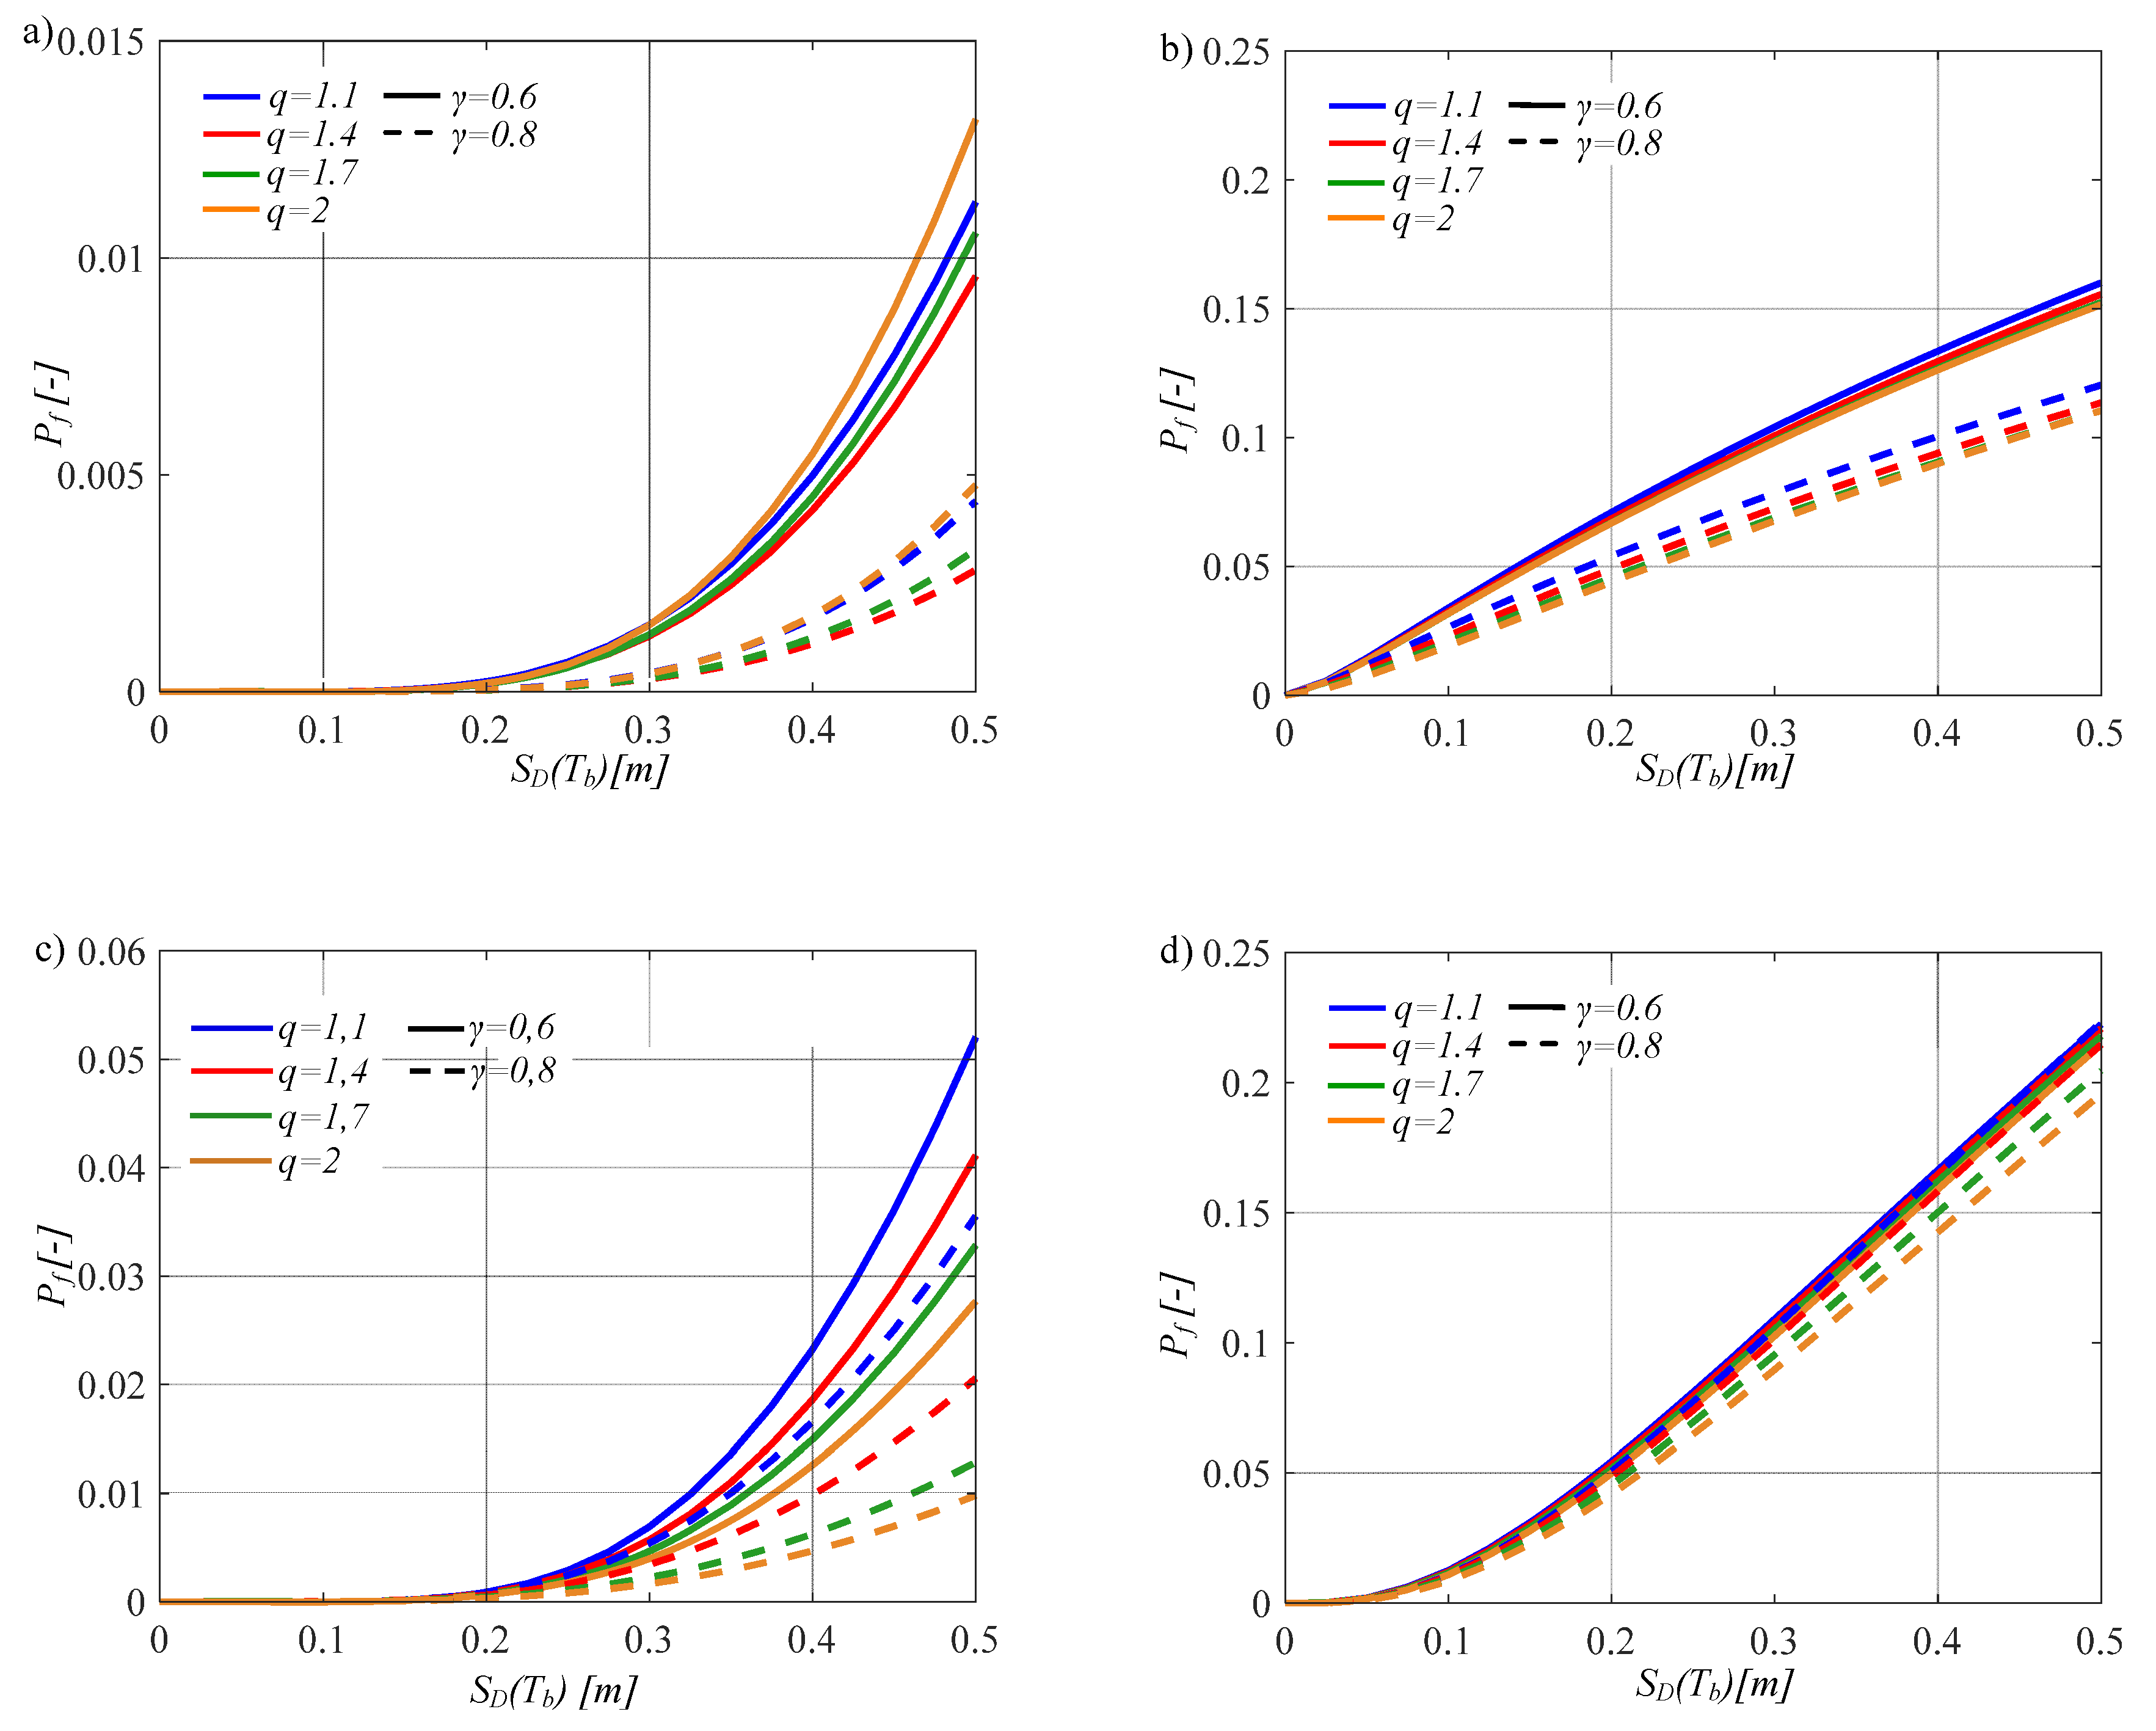
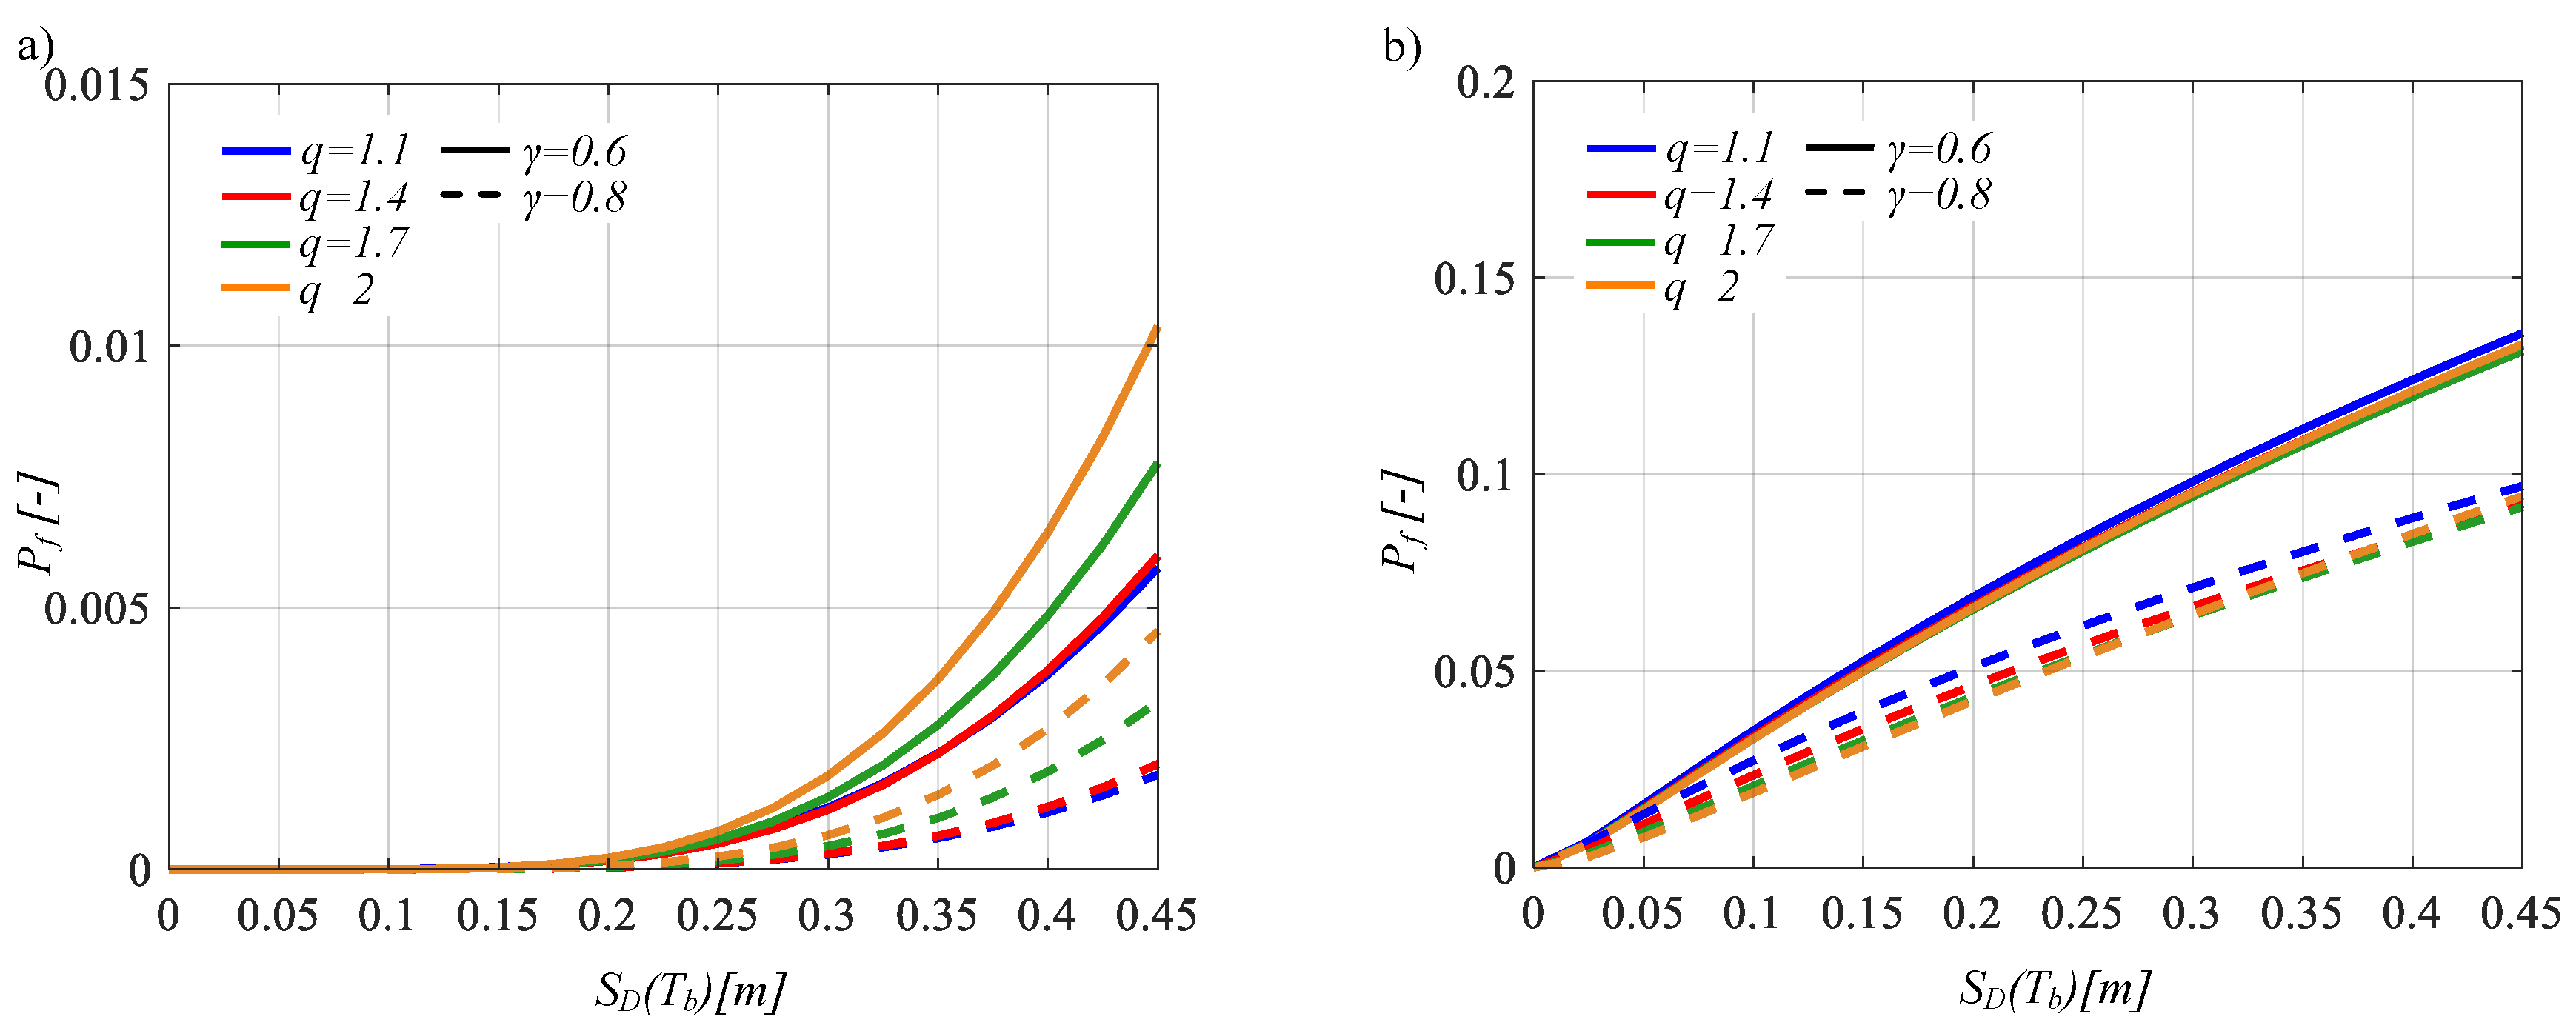
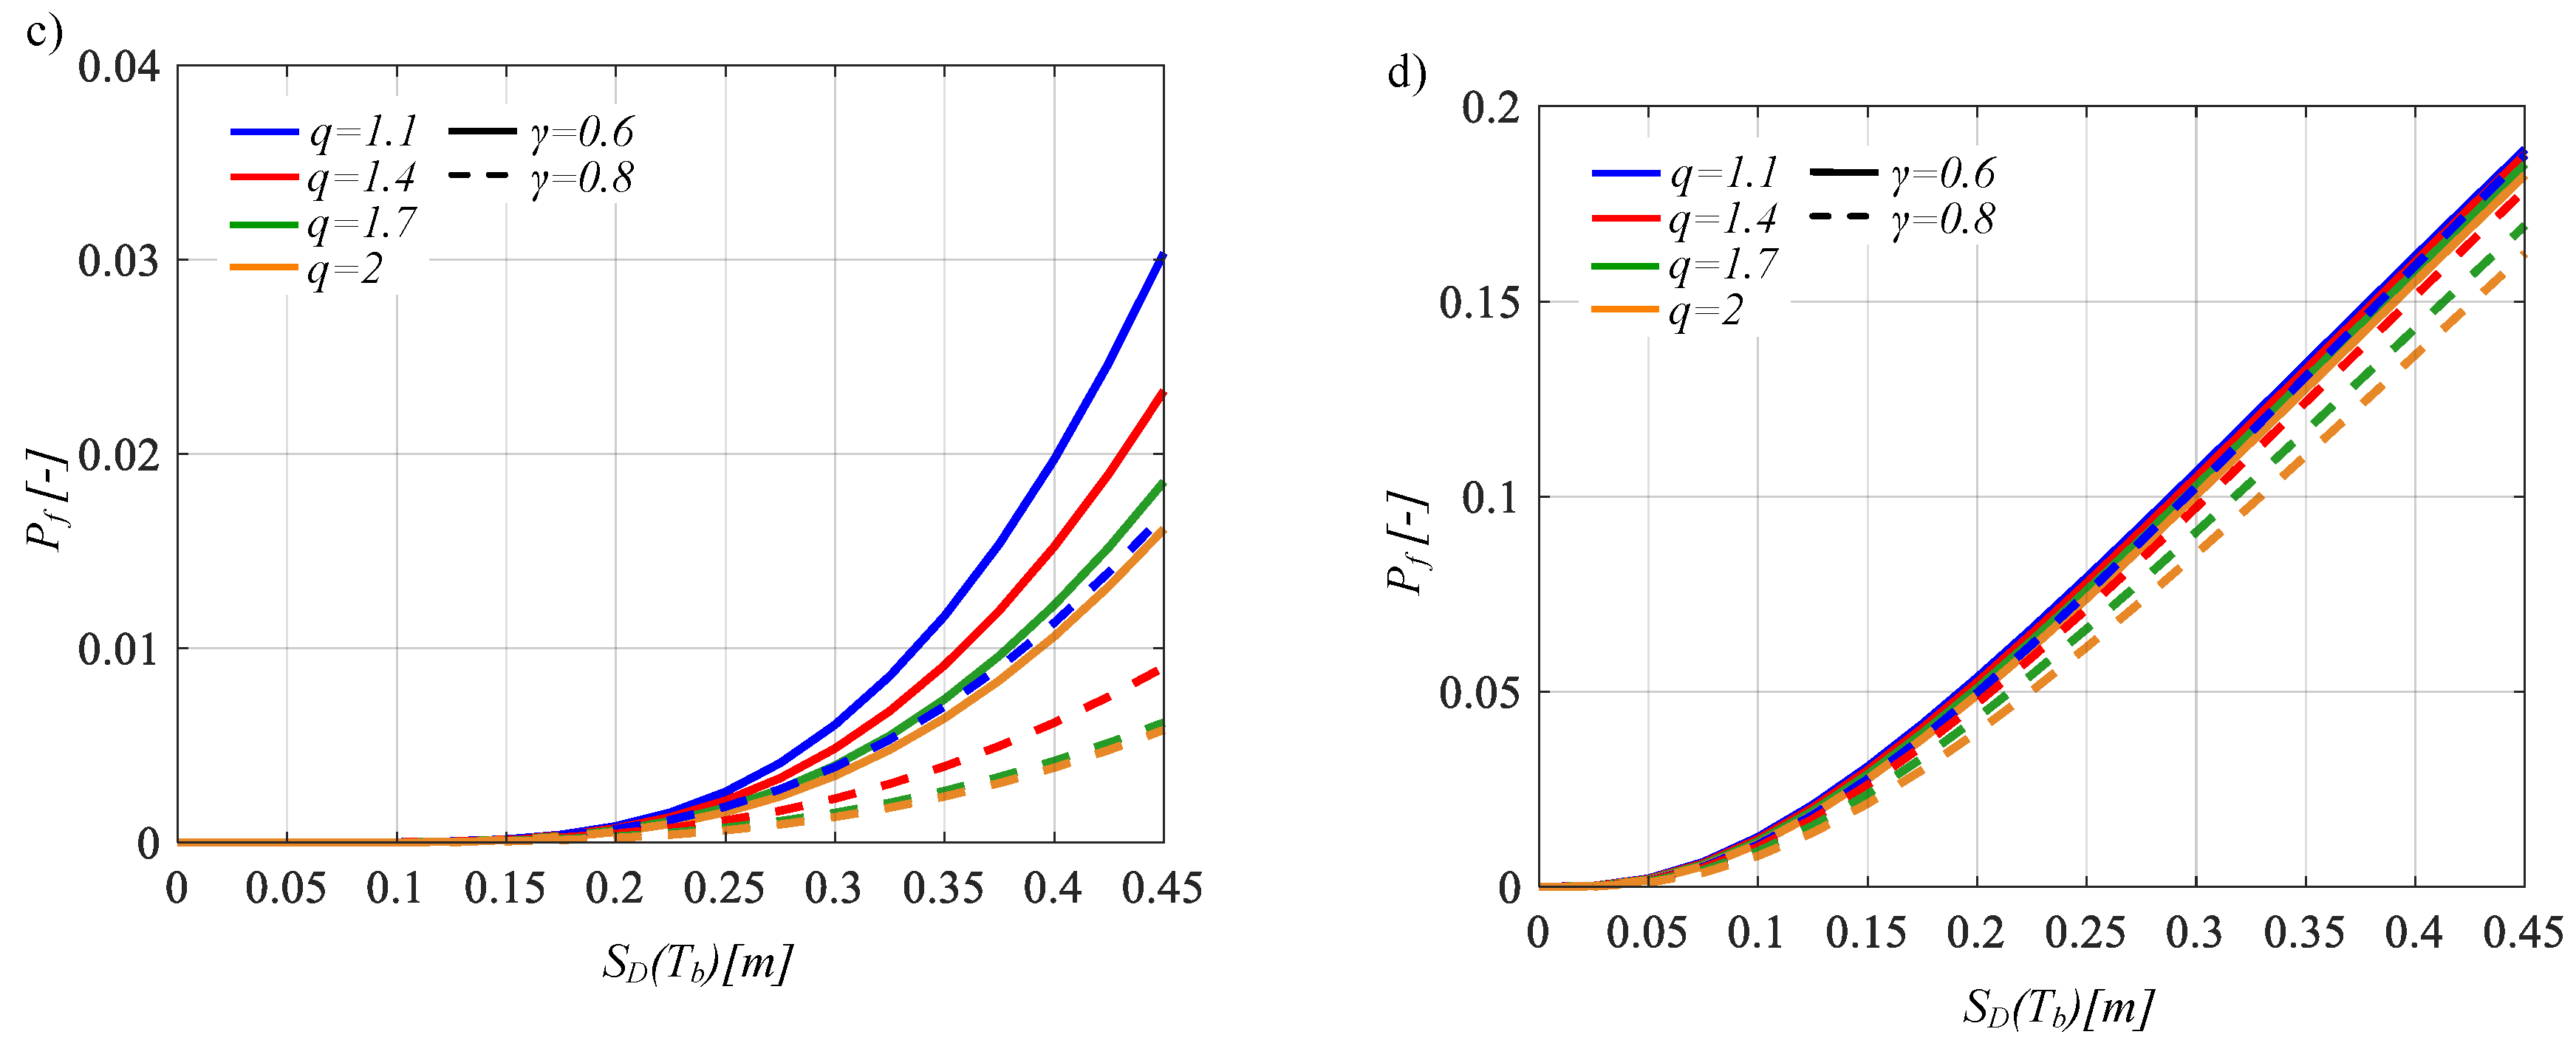
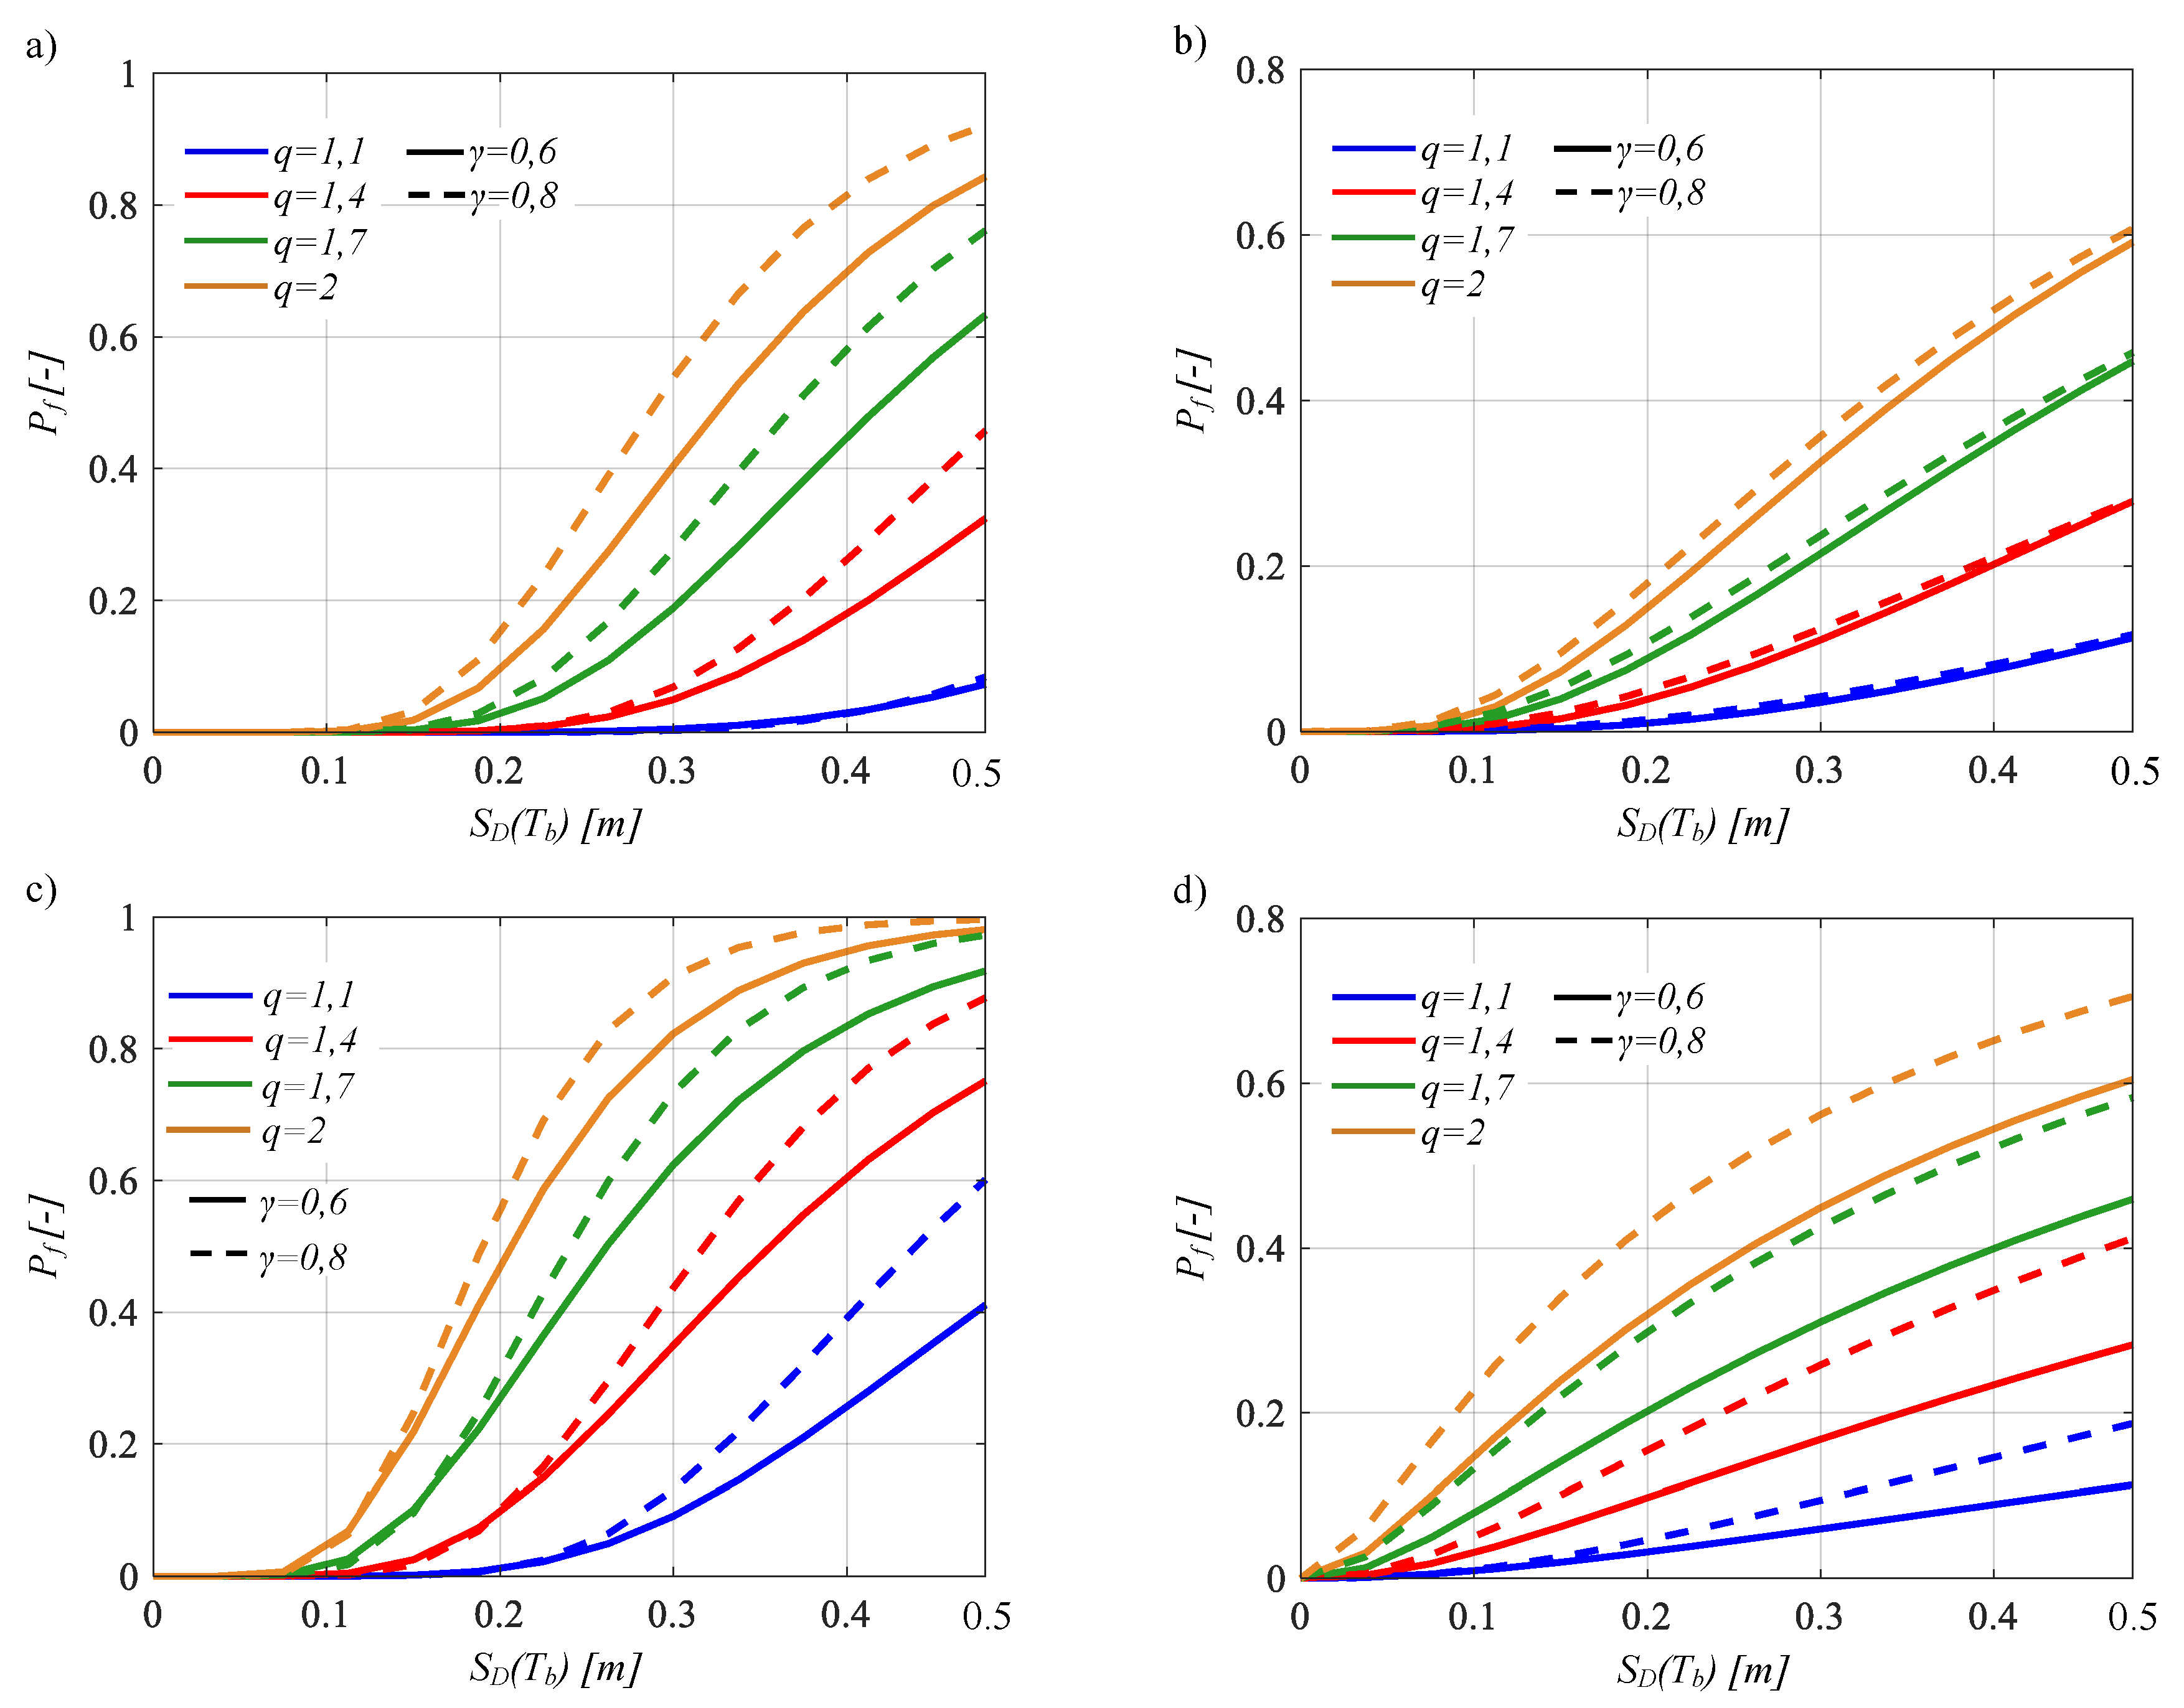
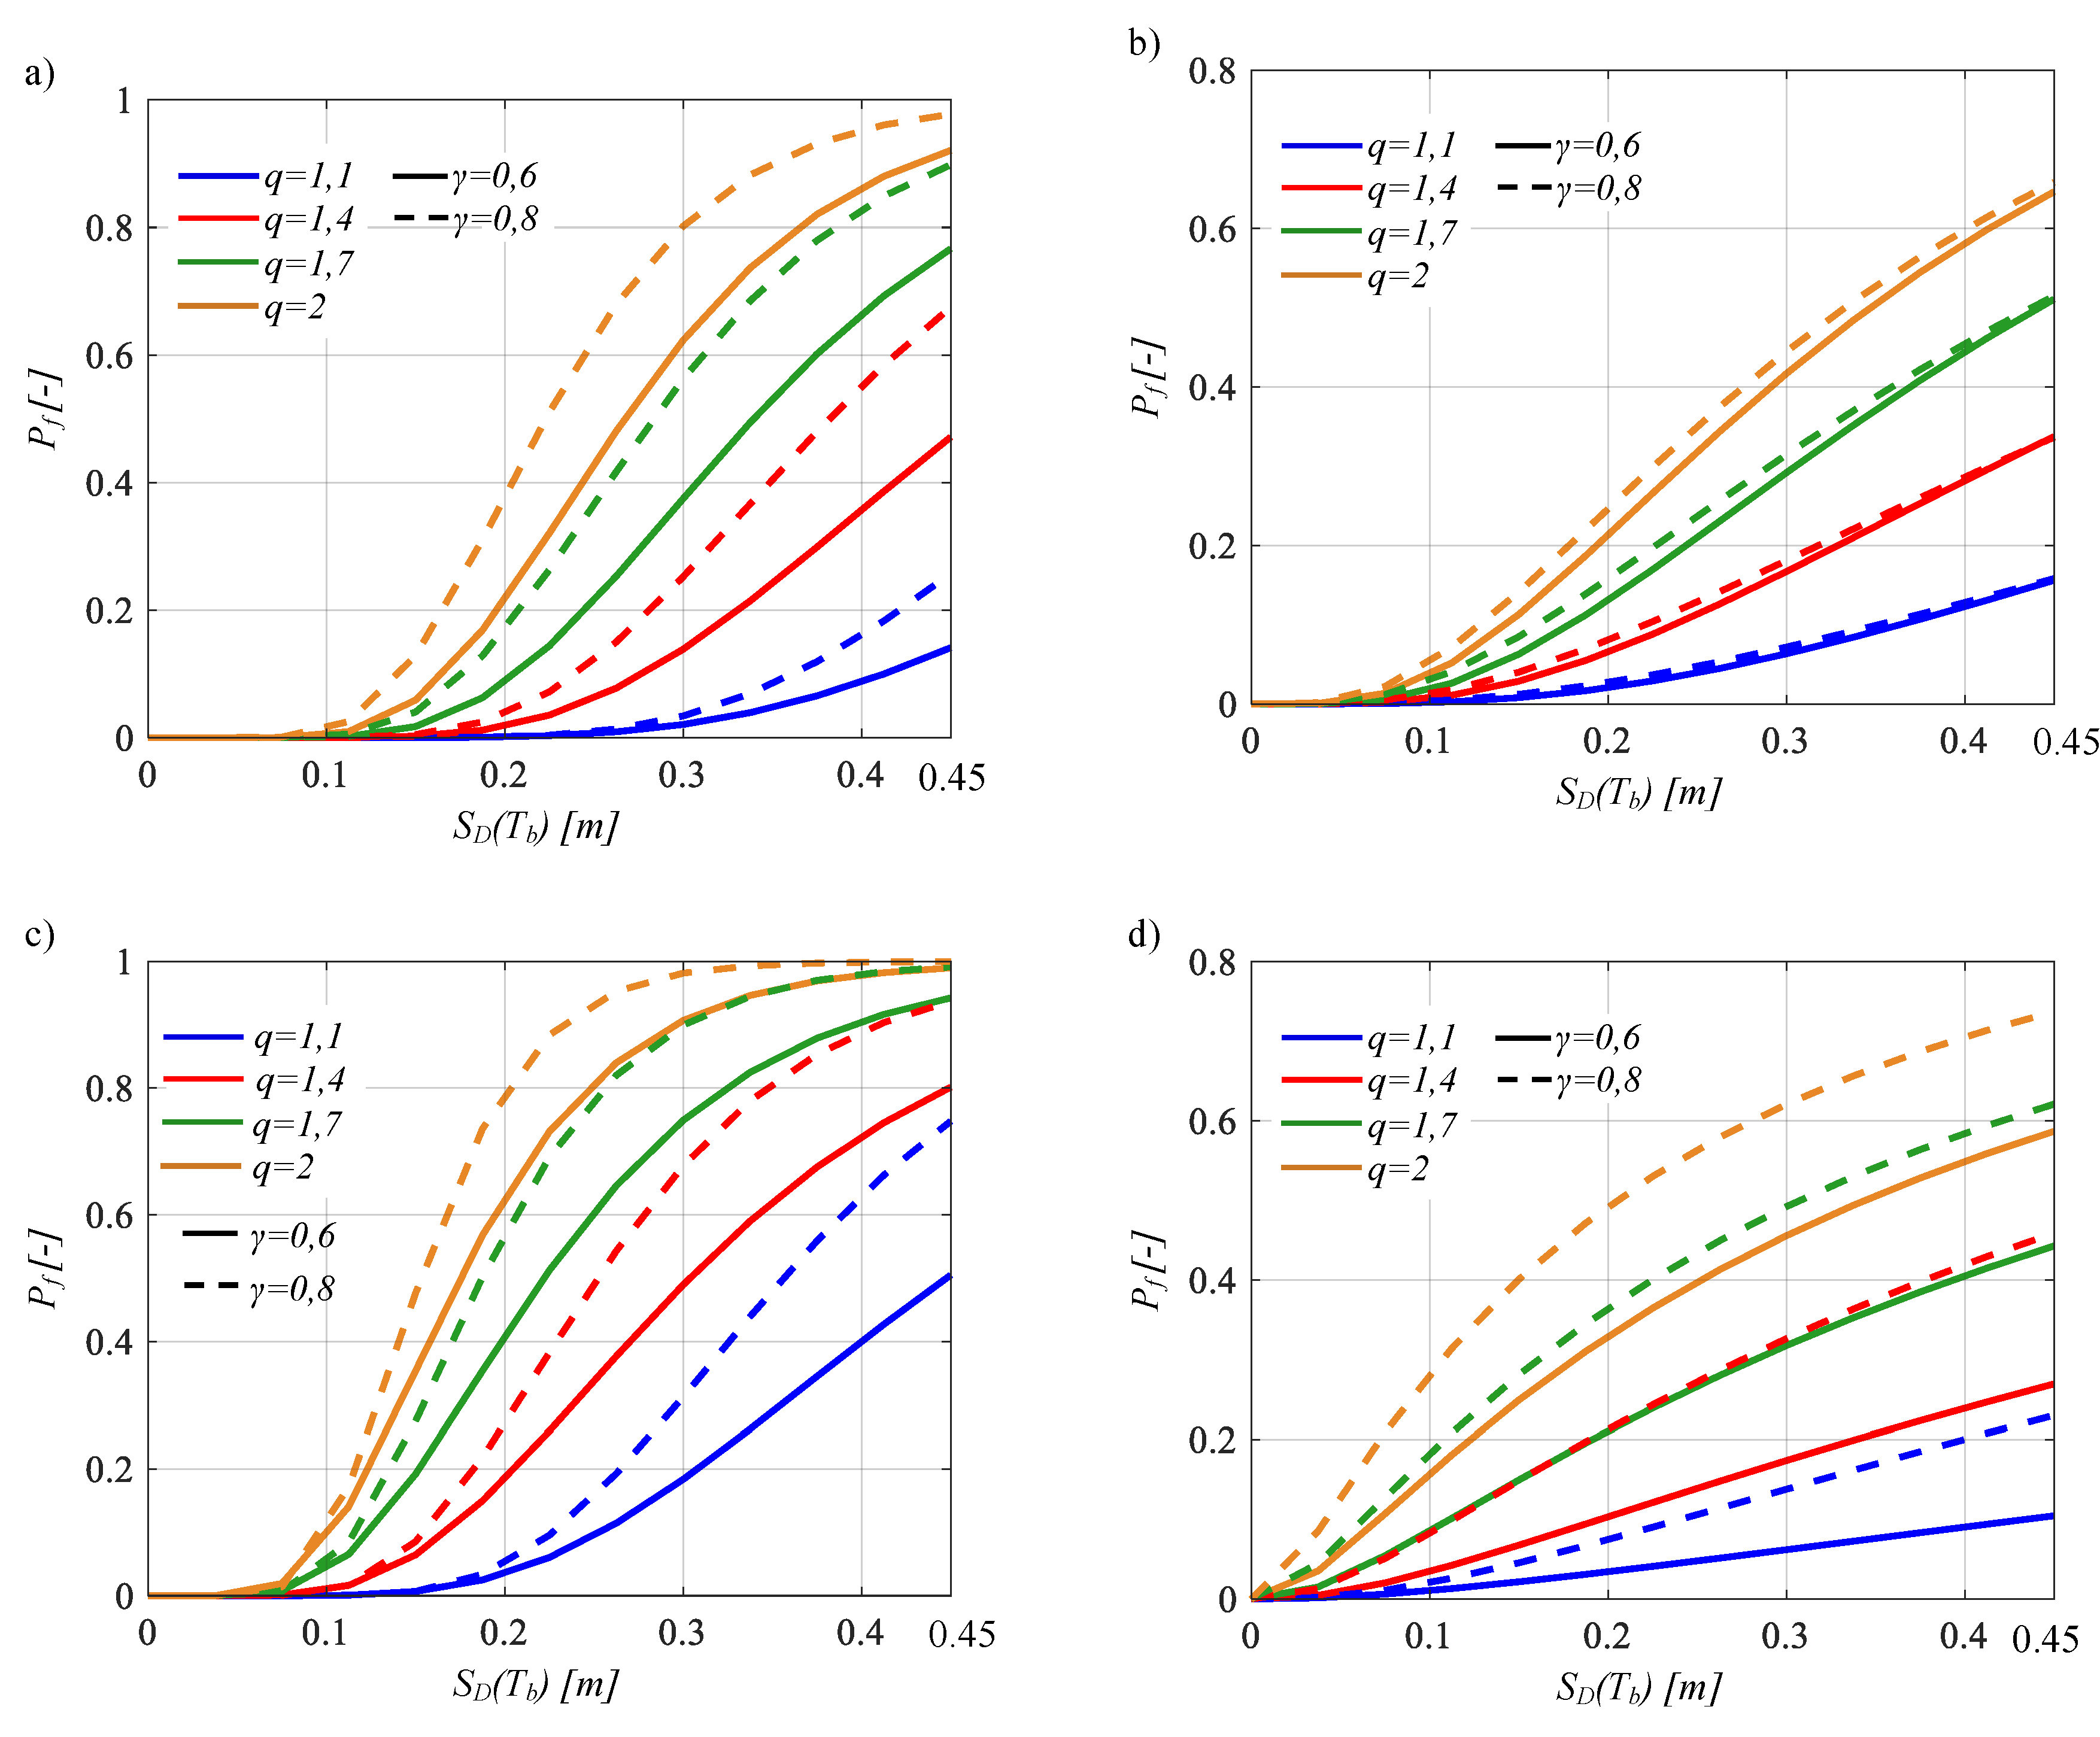
The fragility curves are depicted in Figure 8, Figure 9, Figure 10 and Figure 11, showing the P f versus the IM for both Italian sites. Each figure shows several curves for different values of the mass ratio and q. Only the results corresponding to one limit state threshold, i.e., to I d = 2 and 8, with T b = 3 s and 6 s, are illustrated. Generally, the seismic fragility increases with decreasing limit state thresholds.
The fragility curves of the isolation level are illustrated in Figure 8 and Figure 9. The exceeding probabilities slightly increase for lower values of γ and q. In addition, the isolation seismic fragility decreases by decreasing I d and T b . The exceeding probabilities P f are higher for the Sant’Angelo dei Lombardi site due to the higher seismic hazard measured in terms of SD(Tb).
The fragility curves of the superstructure are shown in Figure 10 and Figure 11. Lower values of γ lead to lower values of P f . The seismic fragility strongly increases for higher values of q. As regards the inelastic limit state thresholds (μ>1), the seismic fragility of the superstructure increases by decreasing T b with fixed I d because of the decrease in the superstructure period T s and in the corresponding yielding displacement, with the consequence that ensuing dynamic amplification occurs and therefore a high exceeding probabilities outcome. Differently, the superstructure seismic fragility decreases when I d decreases with fixed T b due to the increase in the superstructure period Ts and in the corresponding yielding displacement.
In general, the values of P f for isolated structures located in the Sant’Angelo dei Lombardi site are slightly higher than the values related to the Chiusaforte site, for each parameter combination.

Seismic Reliability Curves

As widely described in Section 3, the seismic reliability of a structural system is an evaluation of the probabilities exceeding the structural performance (SP) in 50 years [38,39,40,41,42,43,44,45,46]. Following the steps presented in Section 3, through the convolution integral and using a homogenous Poisson distribution, the exceedance probabilities in 50 years (i.e., Pf (50 years)) have been computed for both the isolation level and the superstructure.
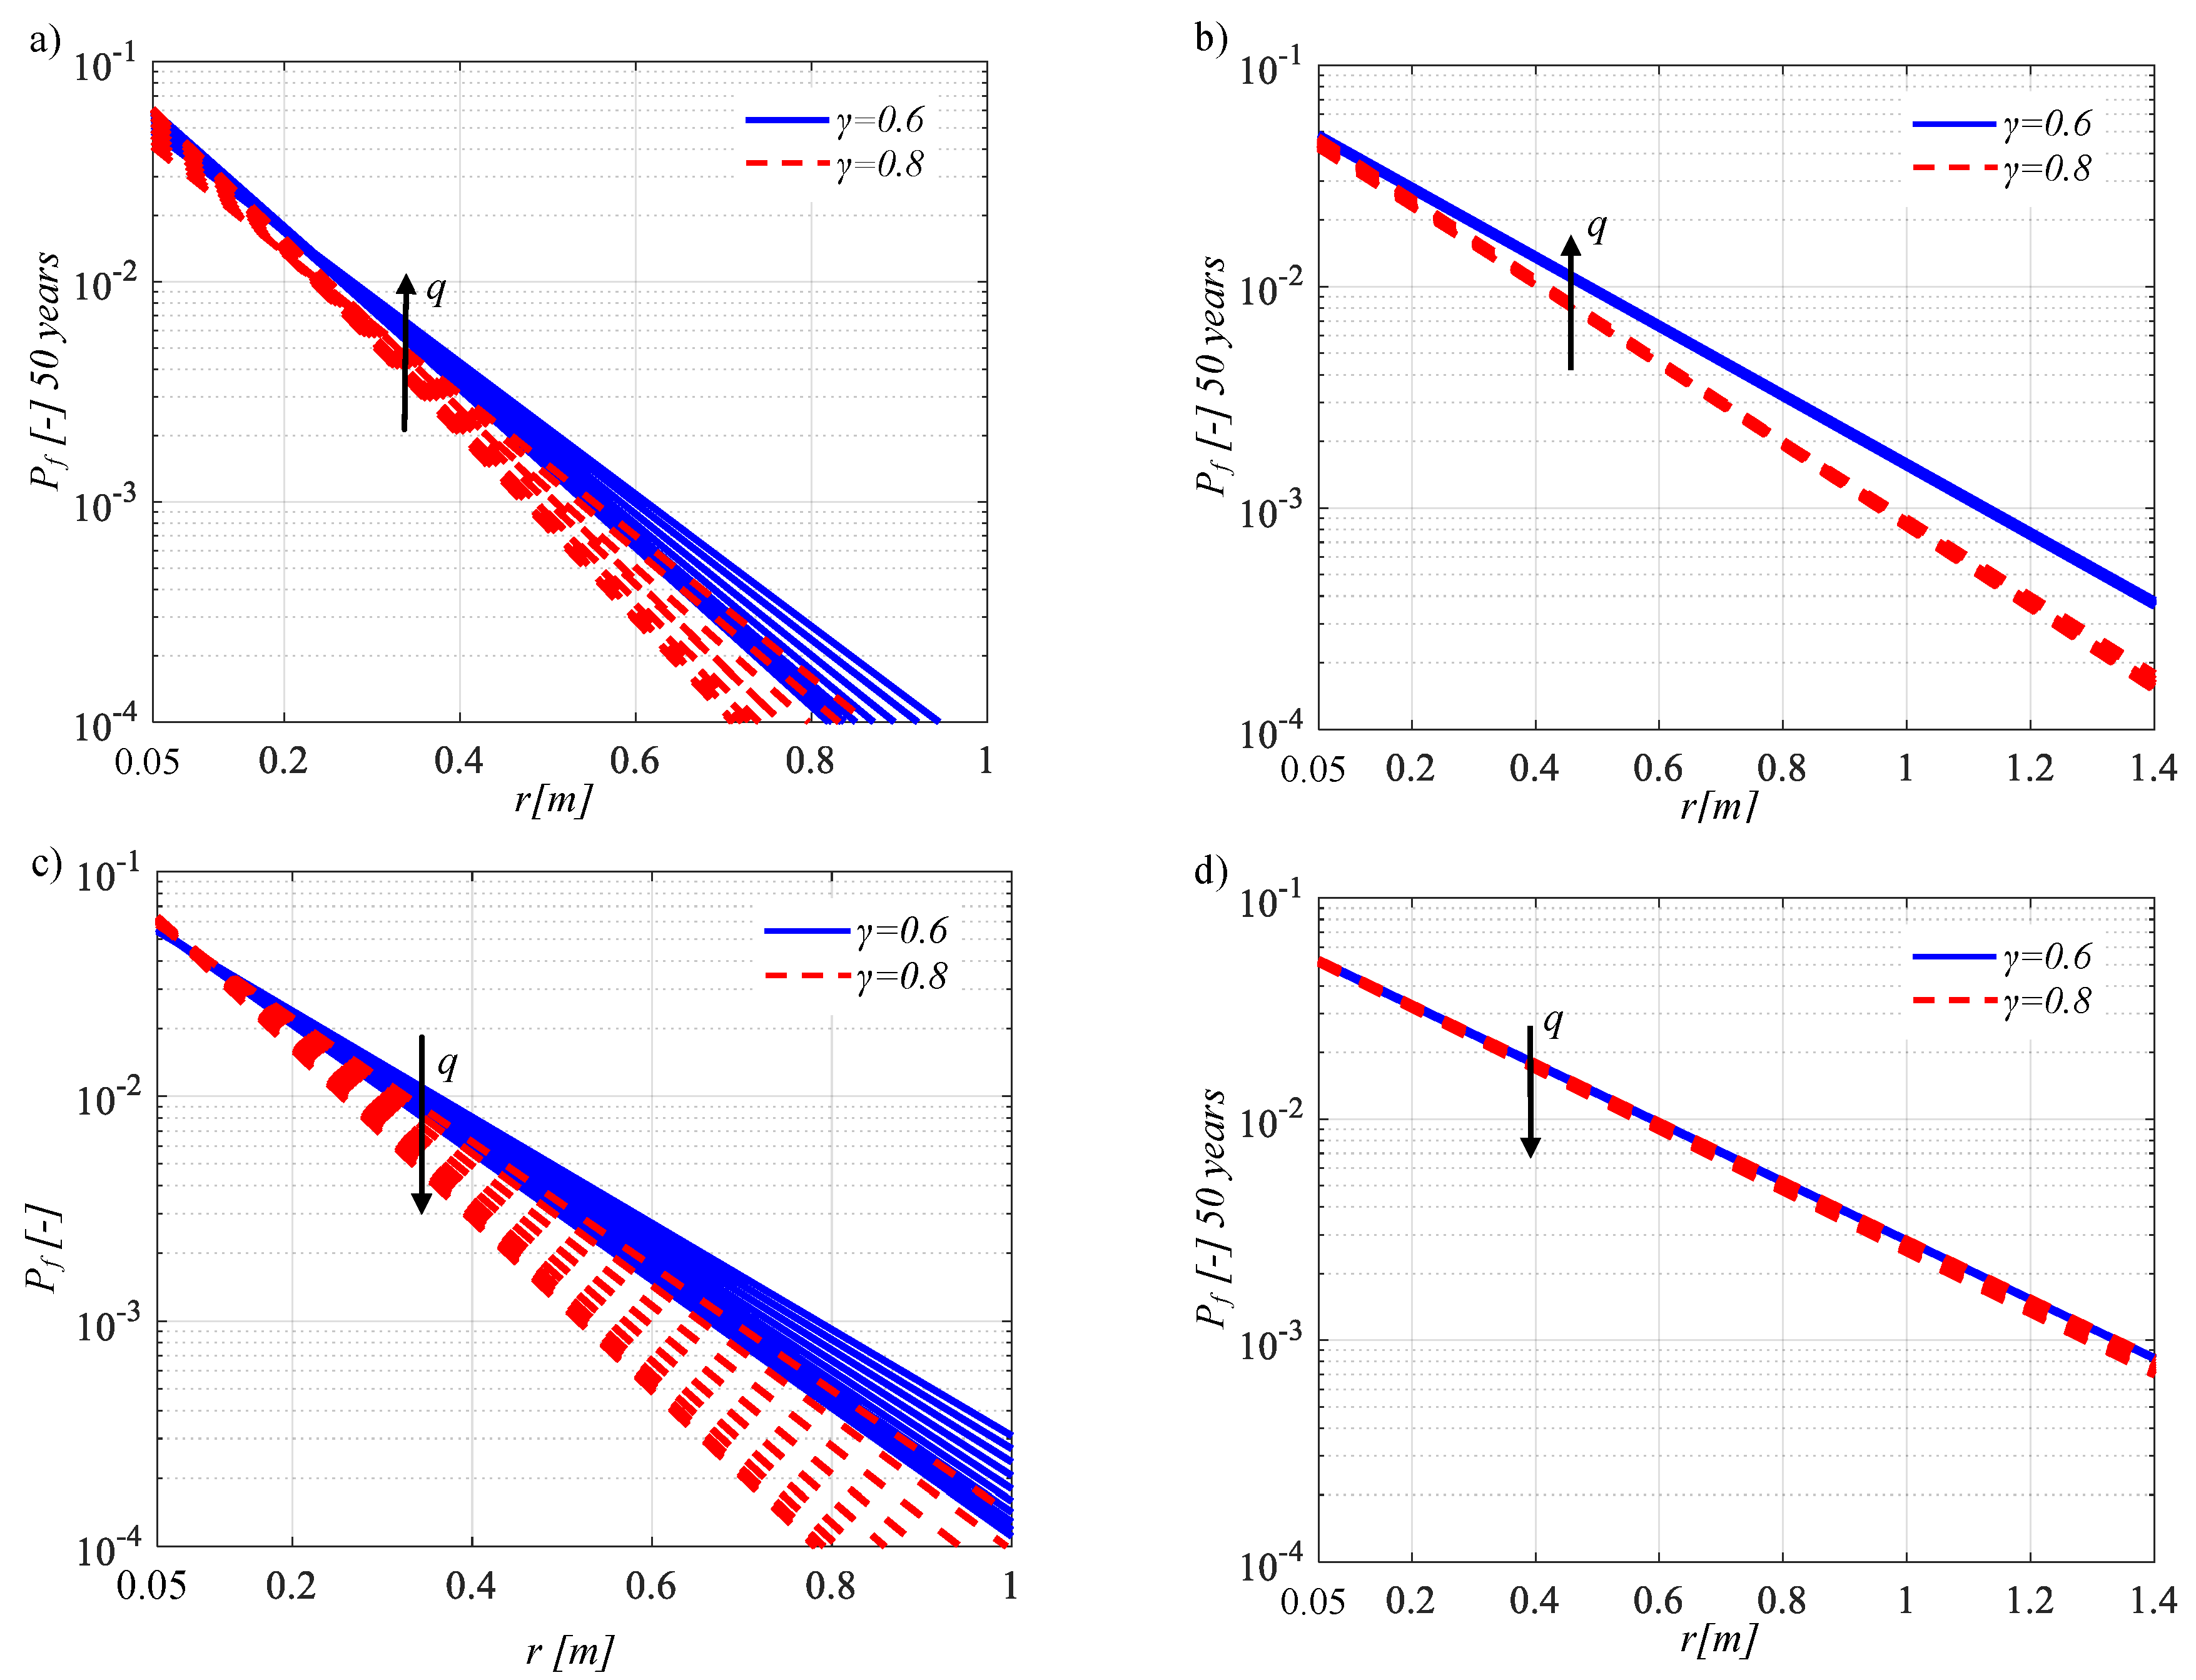
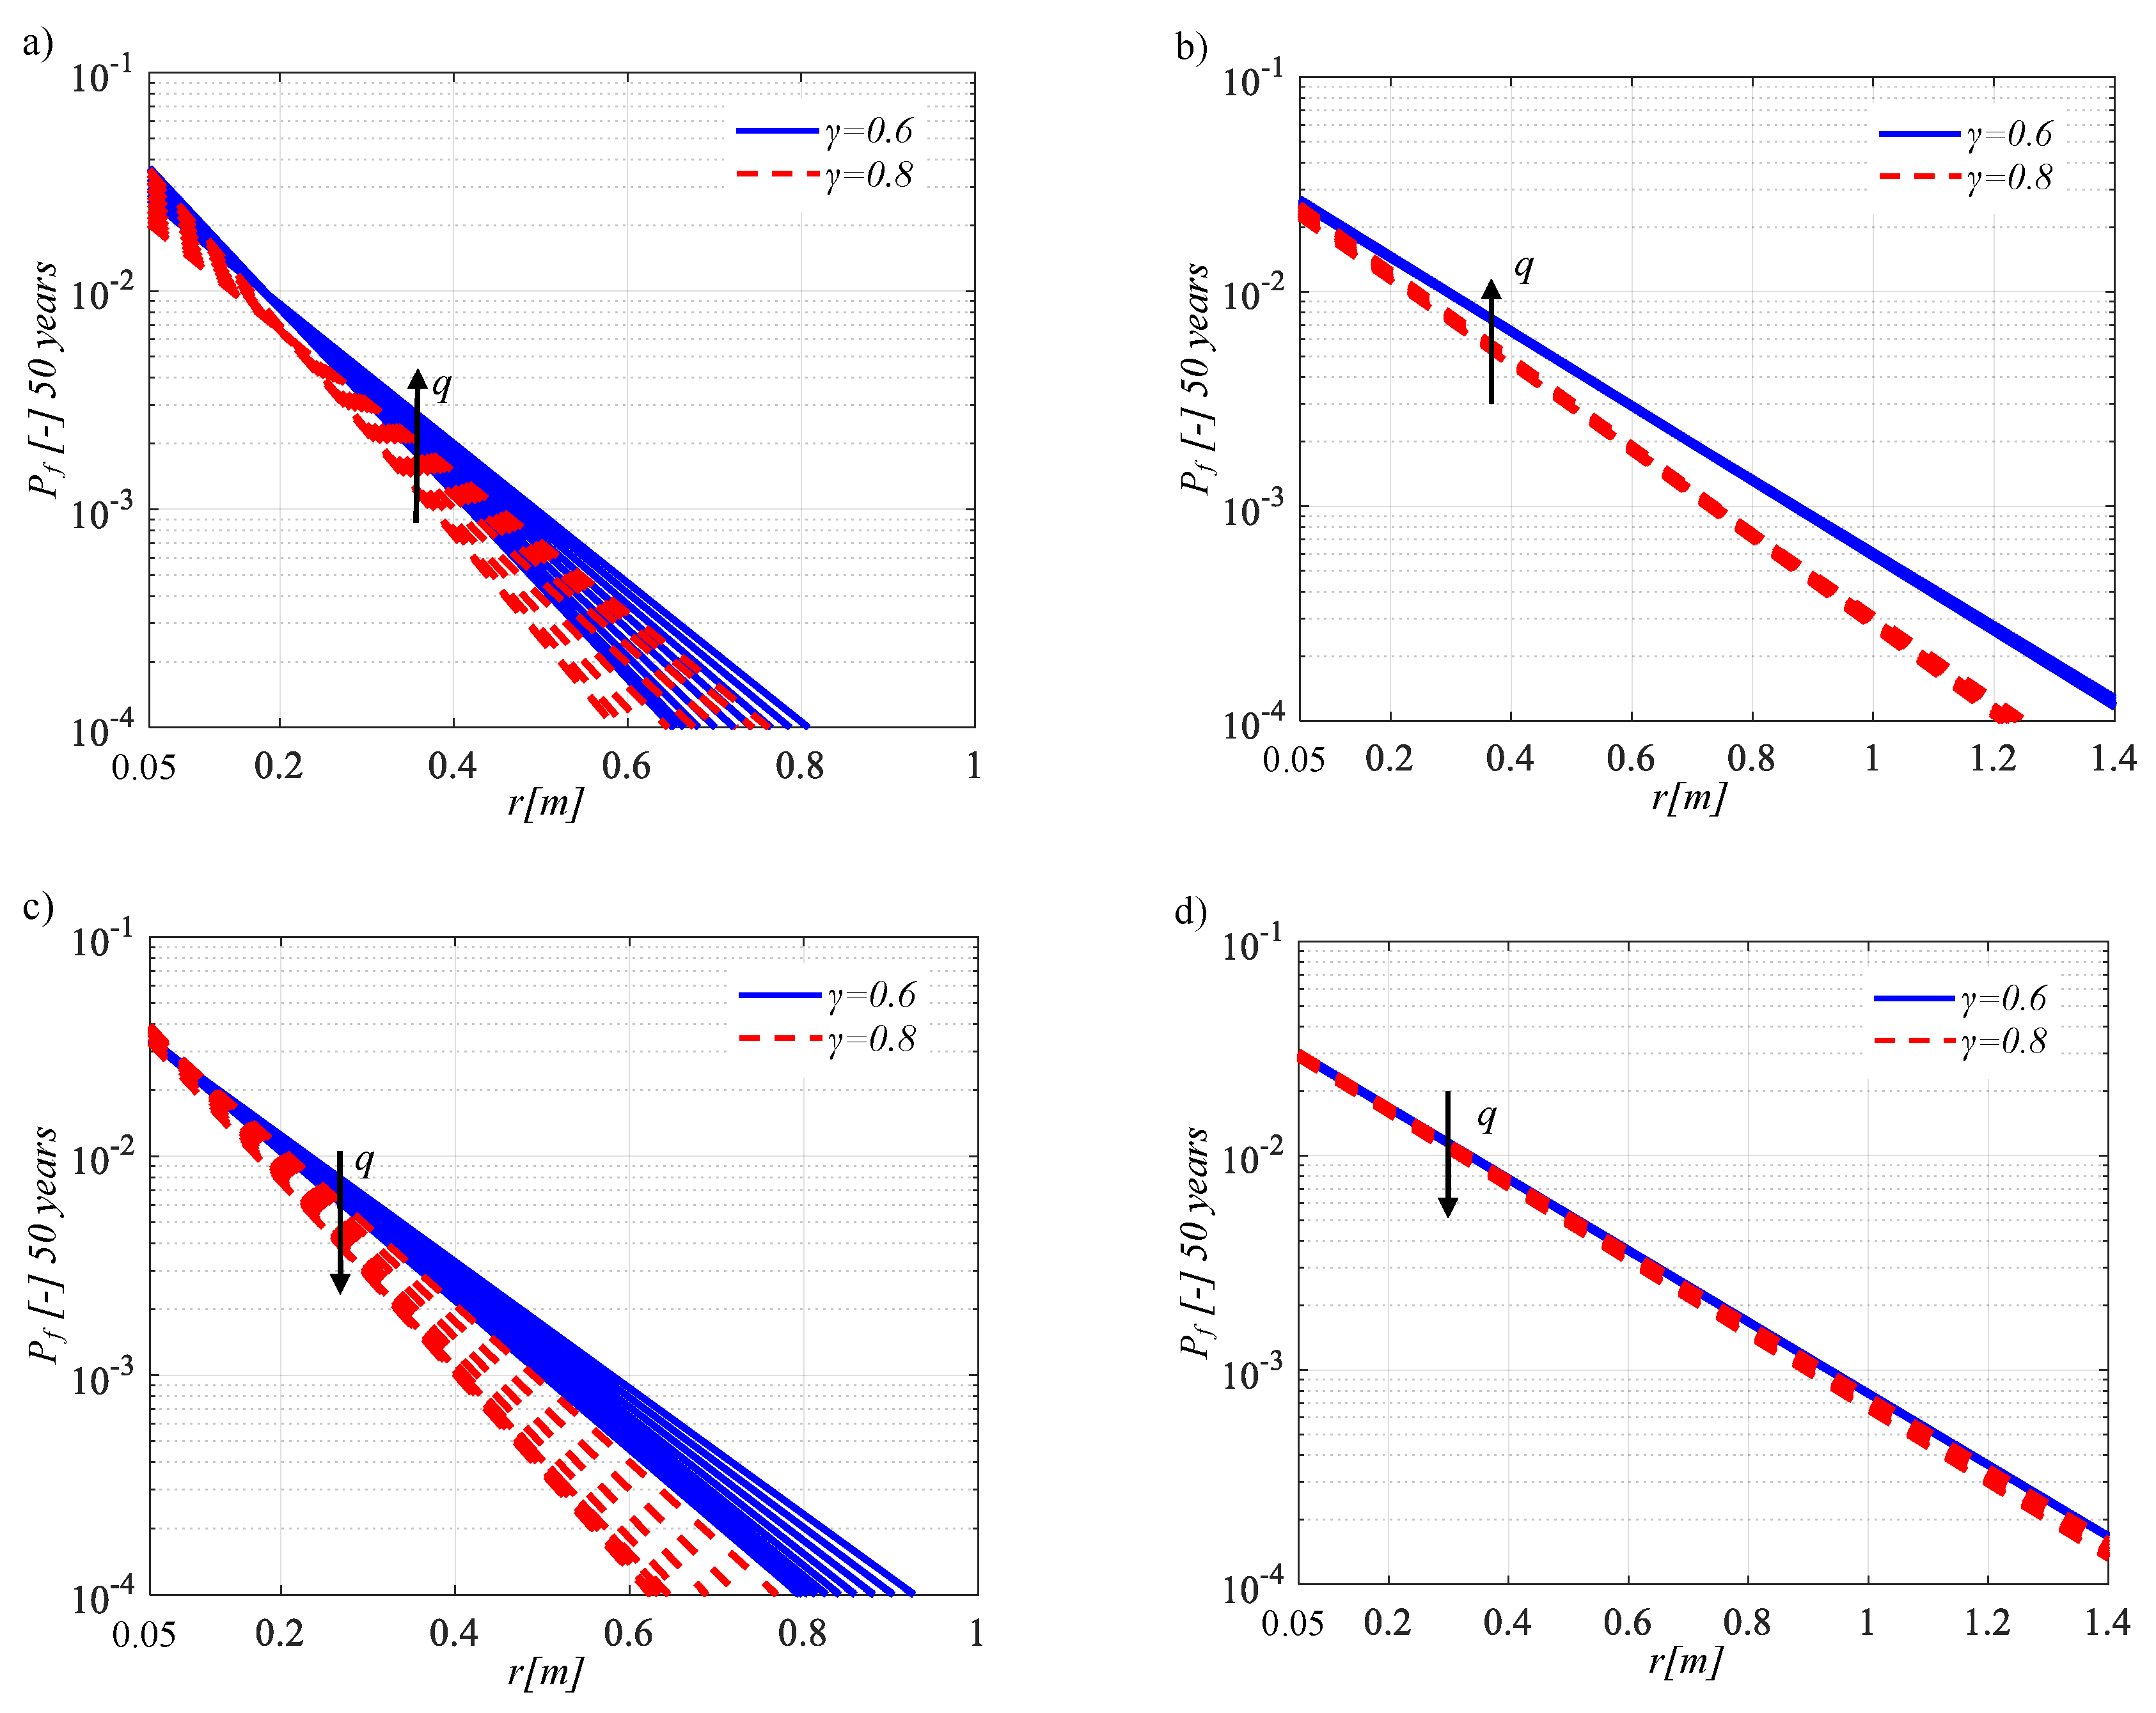
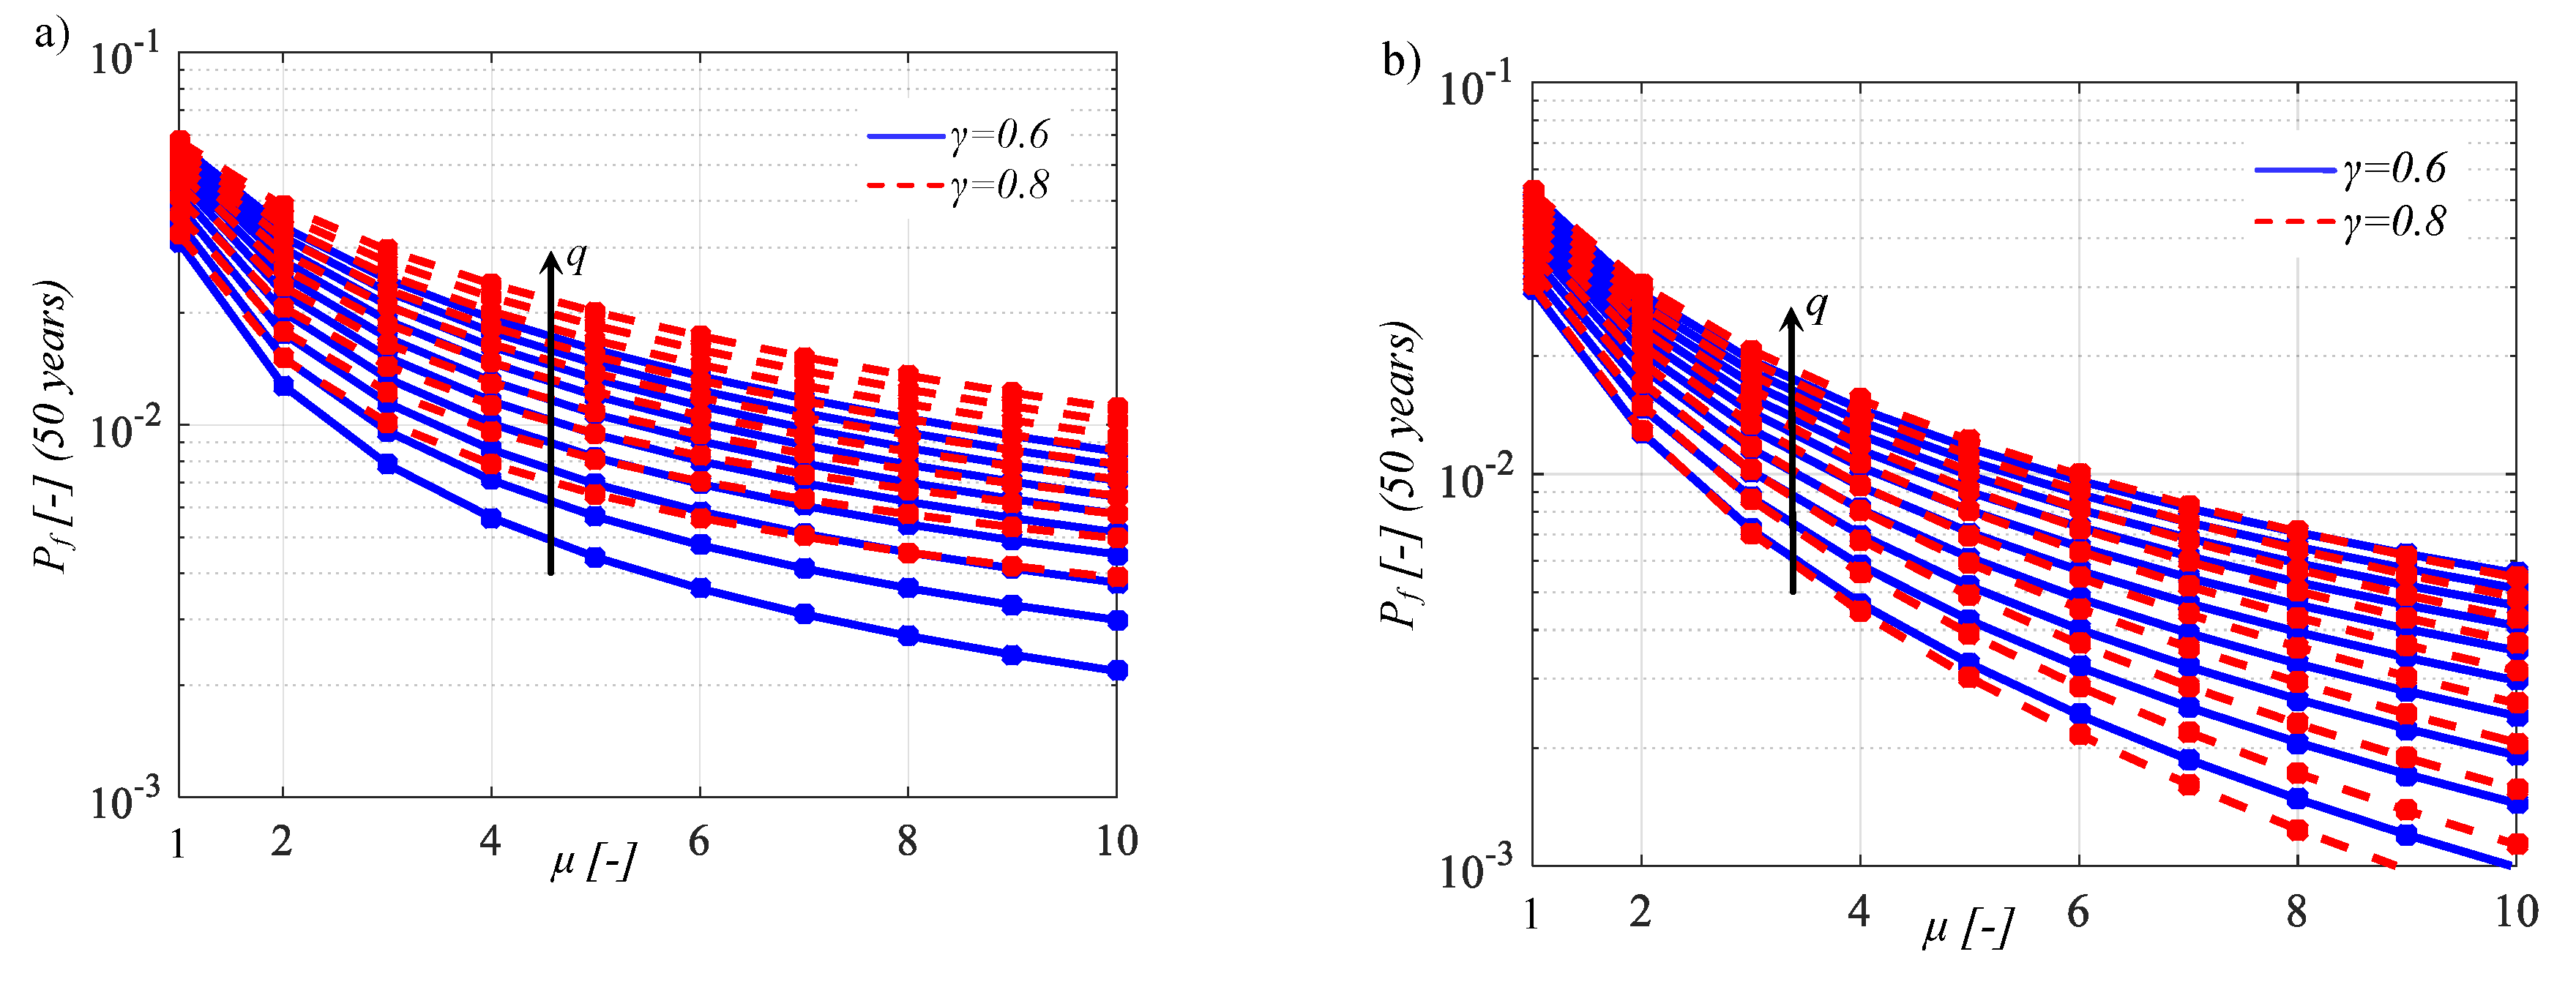
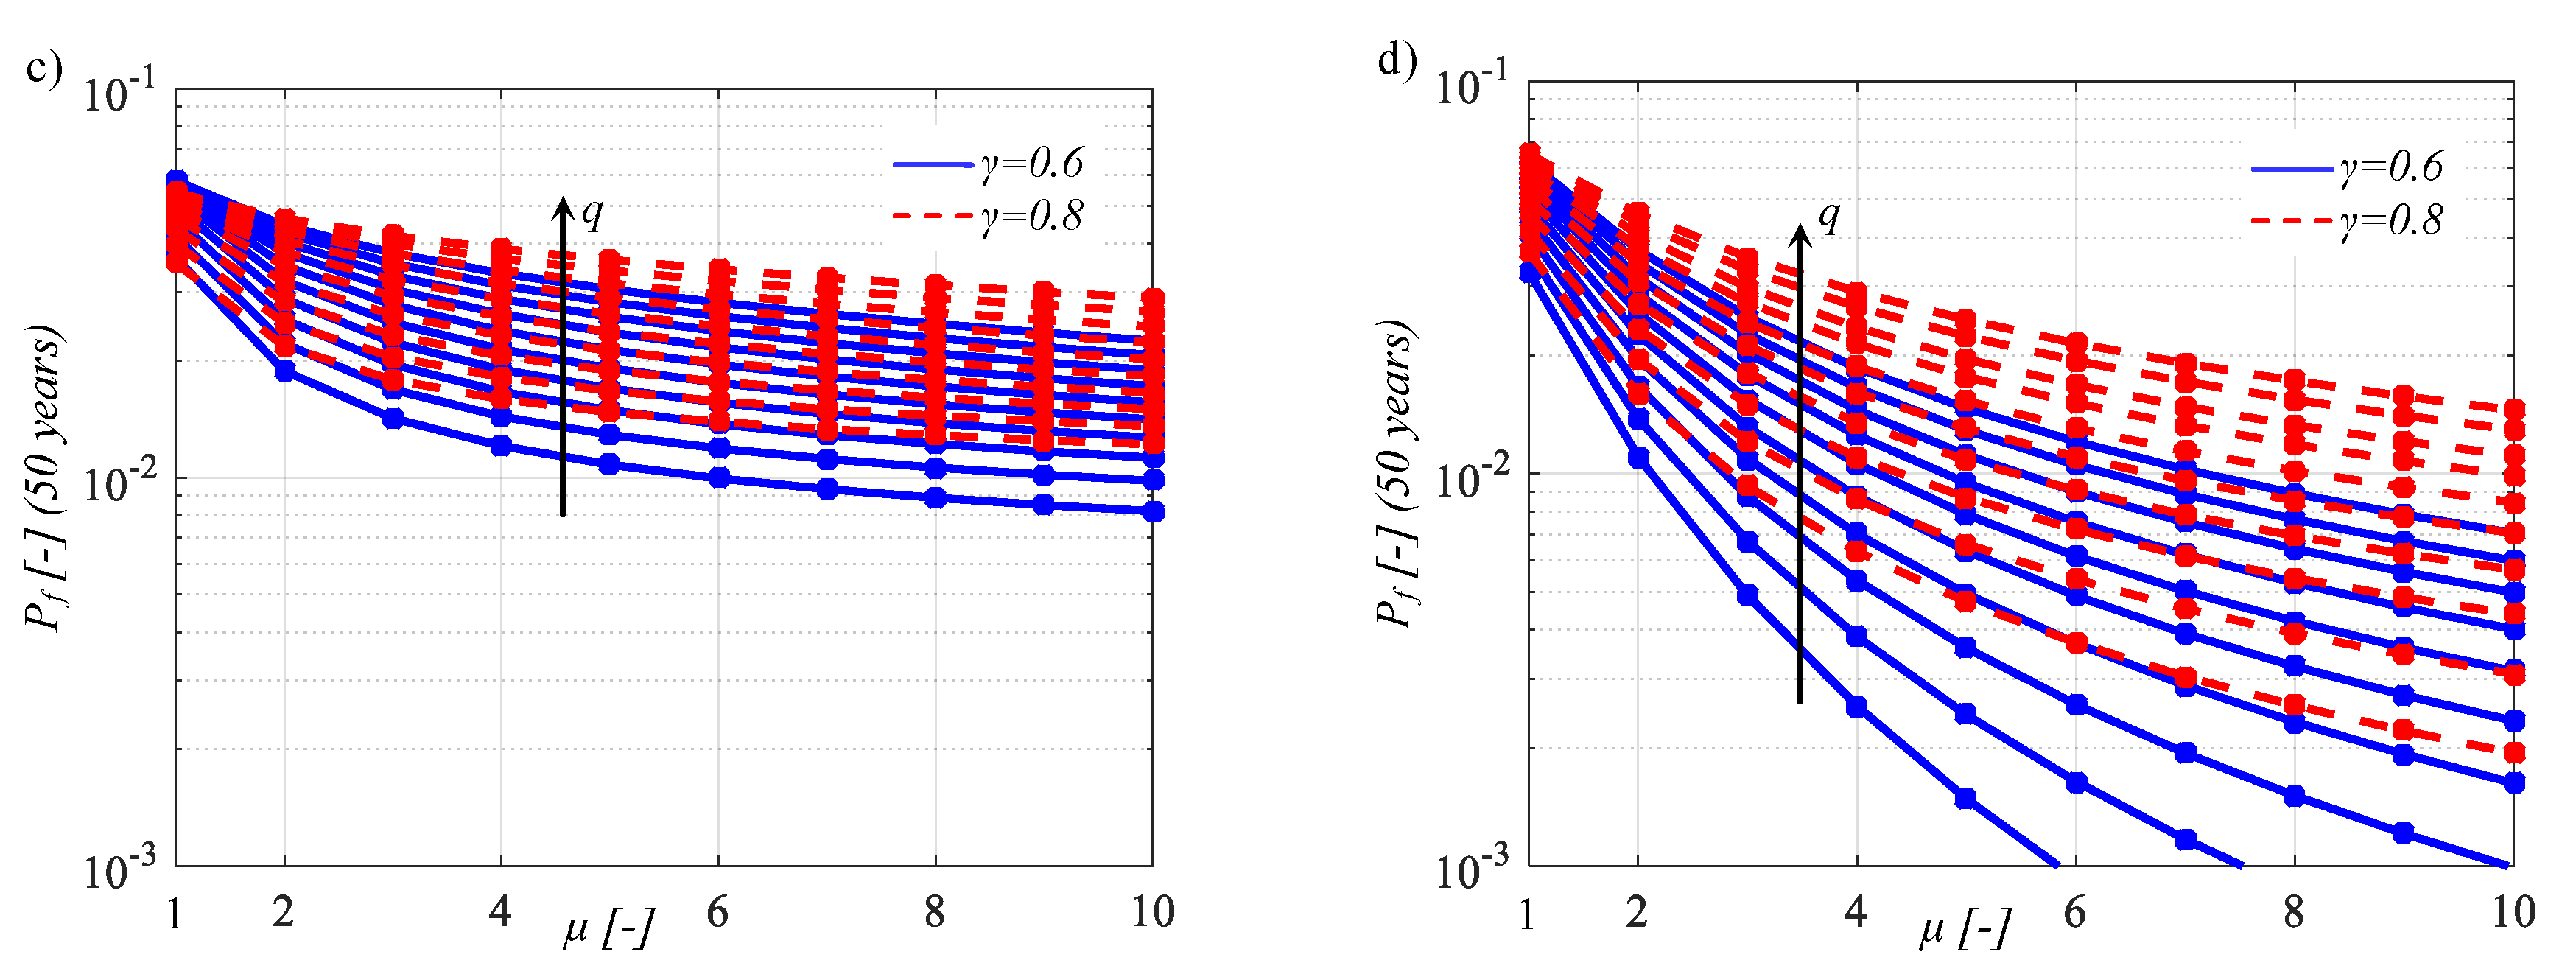
With regard to the isolation level, the seismic reliability assessment makes it possible to provide SRBD abacuses to define the dimension in plan r of the FPS bearings for structures located in areas with a high seismic hazard, as a function of both the expected reliability level and the structural parameters. The linear regression curves illustrated in the range between 10−1 and 10−4 in the semi-logarithmic space of Figure 12 and Figure 13 represent the seismic reliability of the devices for different displacement thresholds, in the range from 0.05 m to 1.4 m, for I d = 2 and 8, with T b = 3 s and 6 s, and for the two sites, respectively. The lowest value of R-square is 0.96 for both sites, demonstrating the effectiveness of the regressions. For both sites of interest, it is possible to observe that the seismic reliability of the isolation level decreases as Tb and Id increase. The arrow in the plots denotes the increase in q. For high values of T b , the curves related to the different values of q are quite overlapping, demonstrating a negligible influence of q. The seismic reliability is slightly influenced by γ and q, especially for high T b , whereas for low T b , the seismic reliability increases as q decreases and γ increases. From these structural performance (SP) curves (Figure 12 and Figure 13), it is possible to achieve an exceeding probability of Pf = 1.5 × 10⁻³ (related to the collapse limit state, reliability index β = 3 in 50 years) [39,40,41,42] by means of a radius in plan r ranging from about 0.35 m to about 1.4 m depending on the structural properties. These proposed SRBD abacuses can be used for a reliable and preliminary design of FPS devices for regular superstructure systems and in an area with a high seismic hazard. For each parameter combination, the values of radius r needed to have a specific seismic reliability level are slightly higher for the Sant’Angelo dei Lombardi site due to the higher seismic hazard.
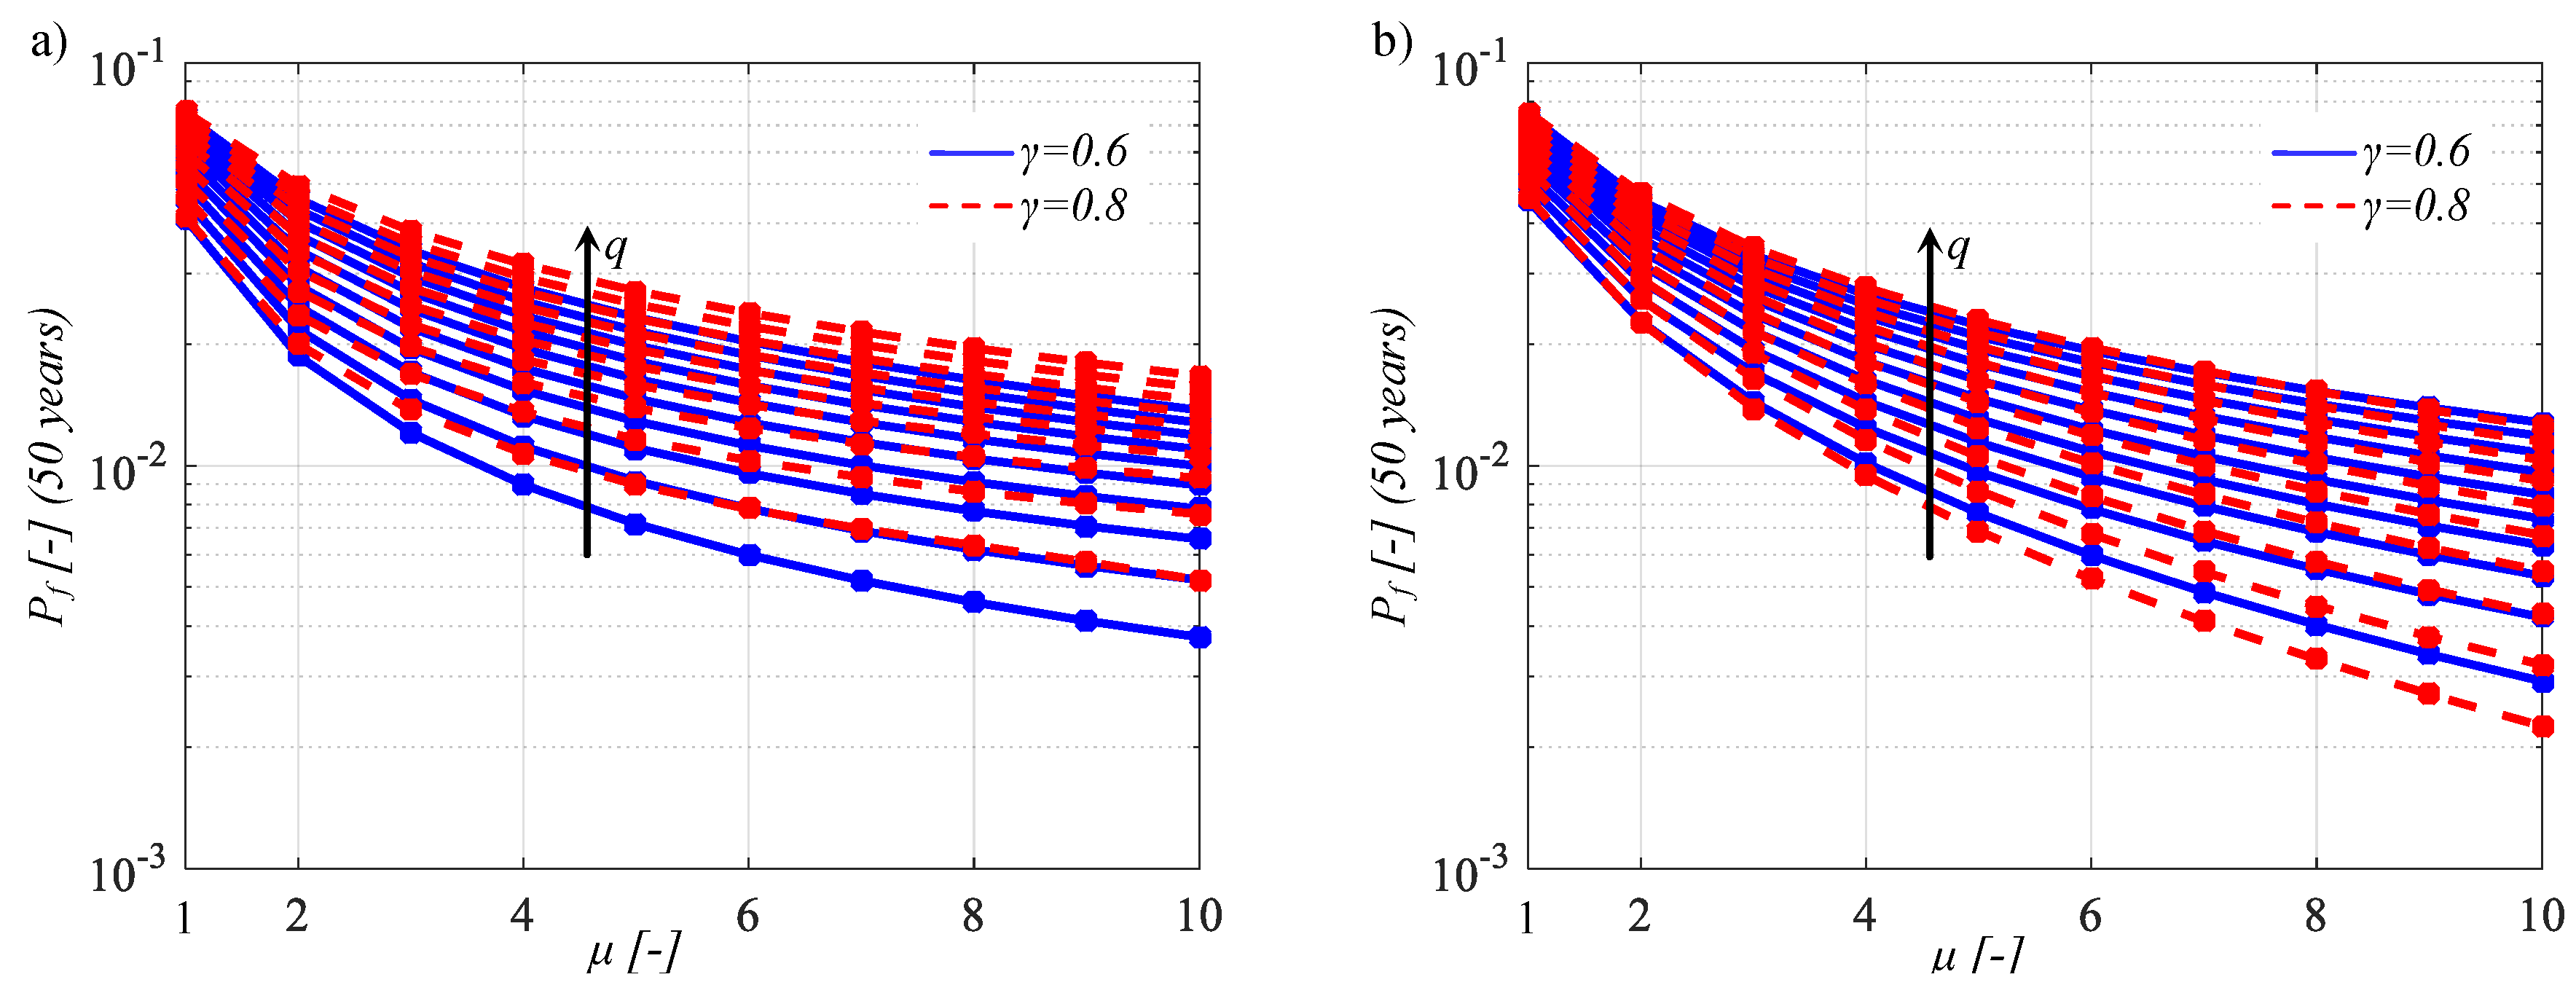
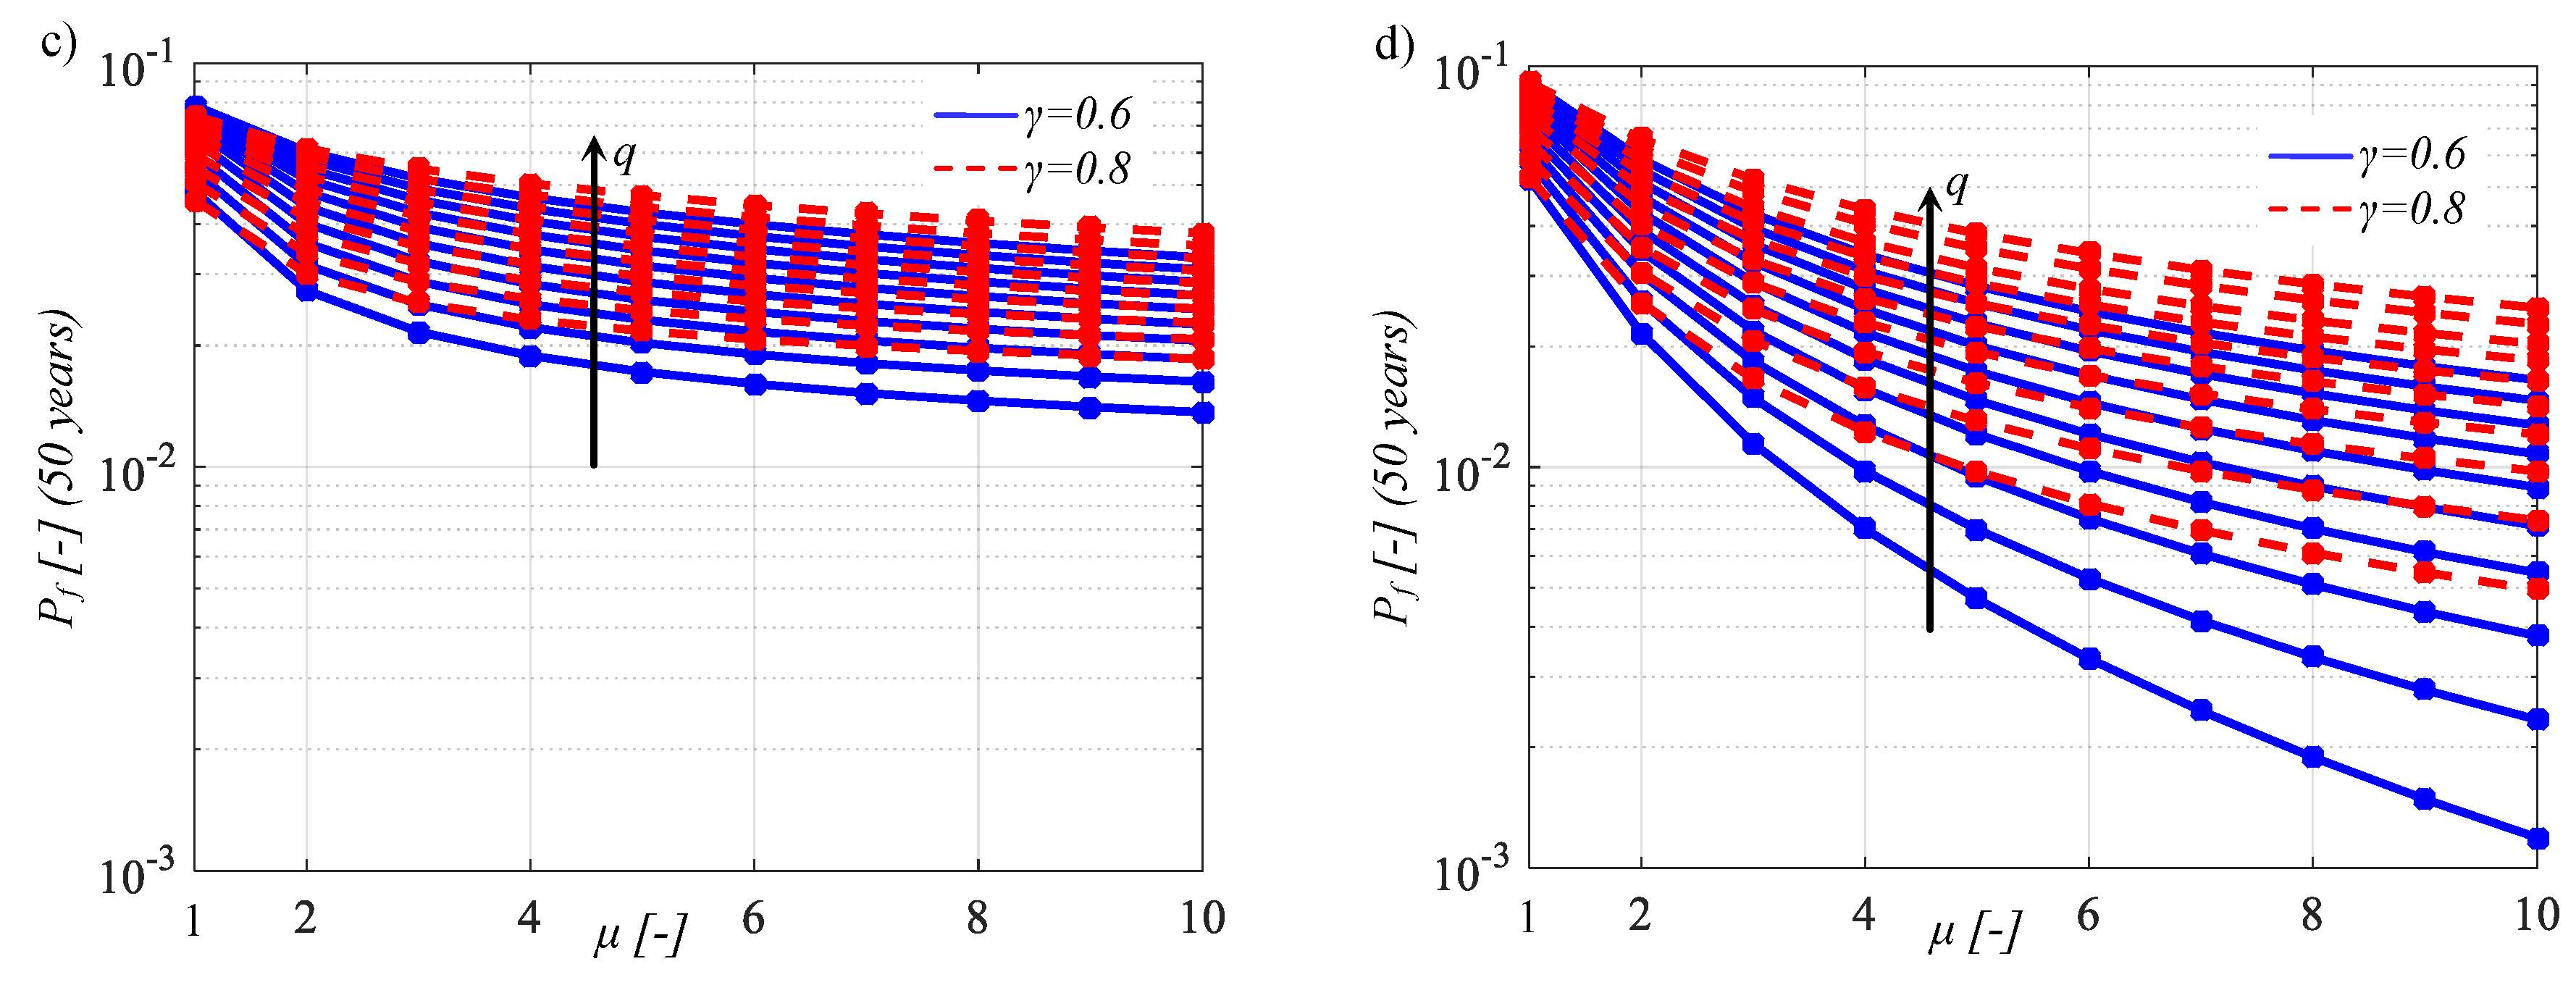
Figure 14 and Figure 15 show the seismic reliability curves (i.e., SP curves) of the inelastic superstructure, located in the Sant’Angelo dei Lombardi site and in the Chiusaforte site, respectively. The arrow in the plots denotes the increase in q.
Specifically, the exceeding probabilities (CCDFs) in 50 years are plotted in the range between 10−1 and 10−3 in the semi-logarithmic space as a function of the displacement ductility and for the different superstructure properties. The seismic reliability of the superstructure generally decreases for higher values of γ, Id, q and for lower Tb. For low values of Id, the curves related to the different values of q are less spaced, demonstrating a reduced influence of q. Similarly to the isolation reliability, the superstructure seismic reliability is slightly lower for the Sant’Angelo dei Lombardi site in all analyzed parameter combinations, especially for high values of γ and q, due to the higher seismic hazard.
However, the results related to both isolation level and superstructure are consistent with the outcomes in the literature [27] related to isolated structures located in L’Aquila (Italy), for each parameter combination.

6. Seismic Reliability-Based Displacement Ductility Demand for Increasing Strength Reduction Factors

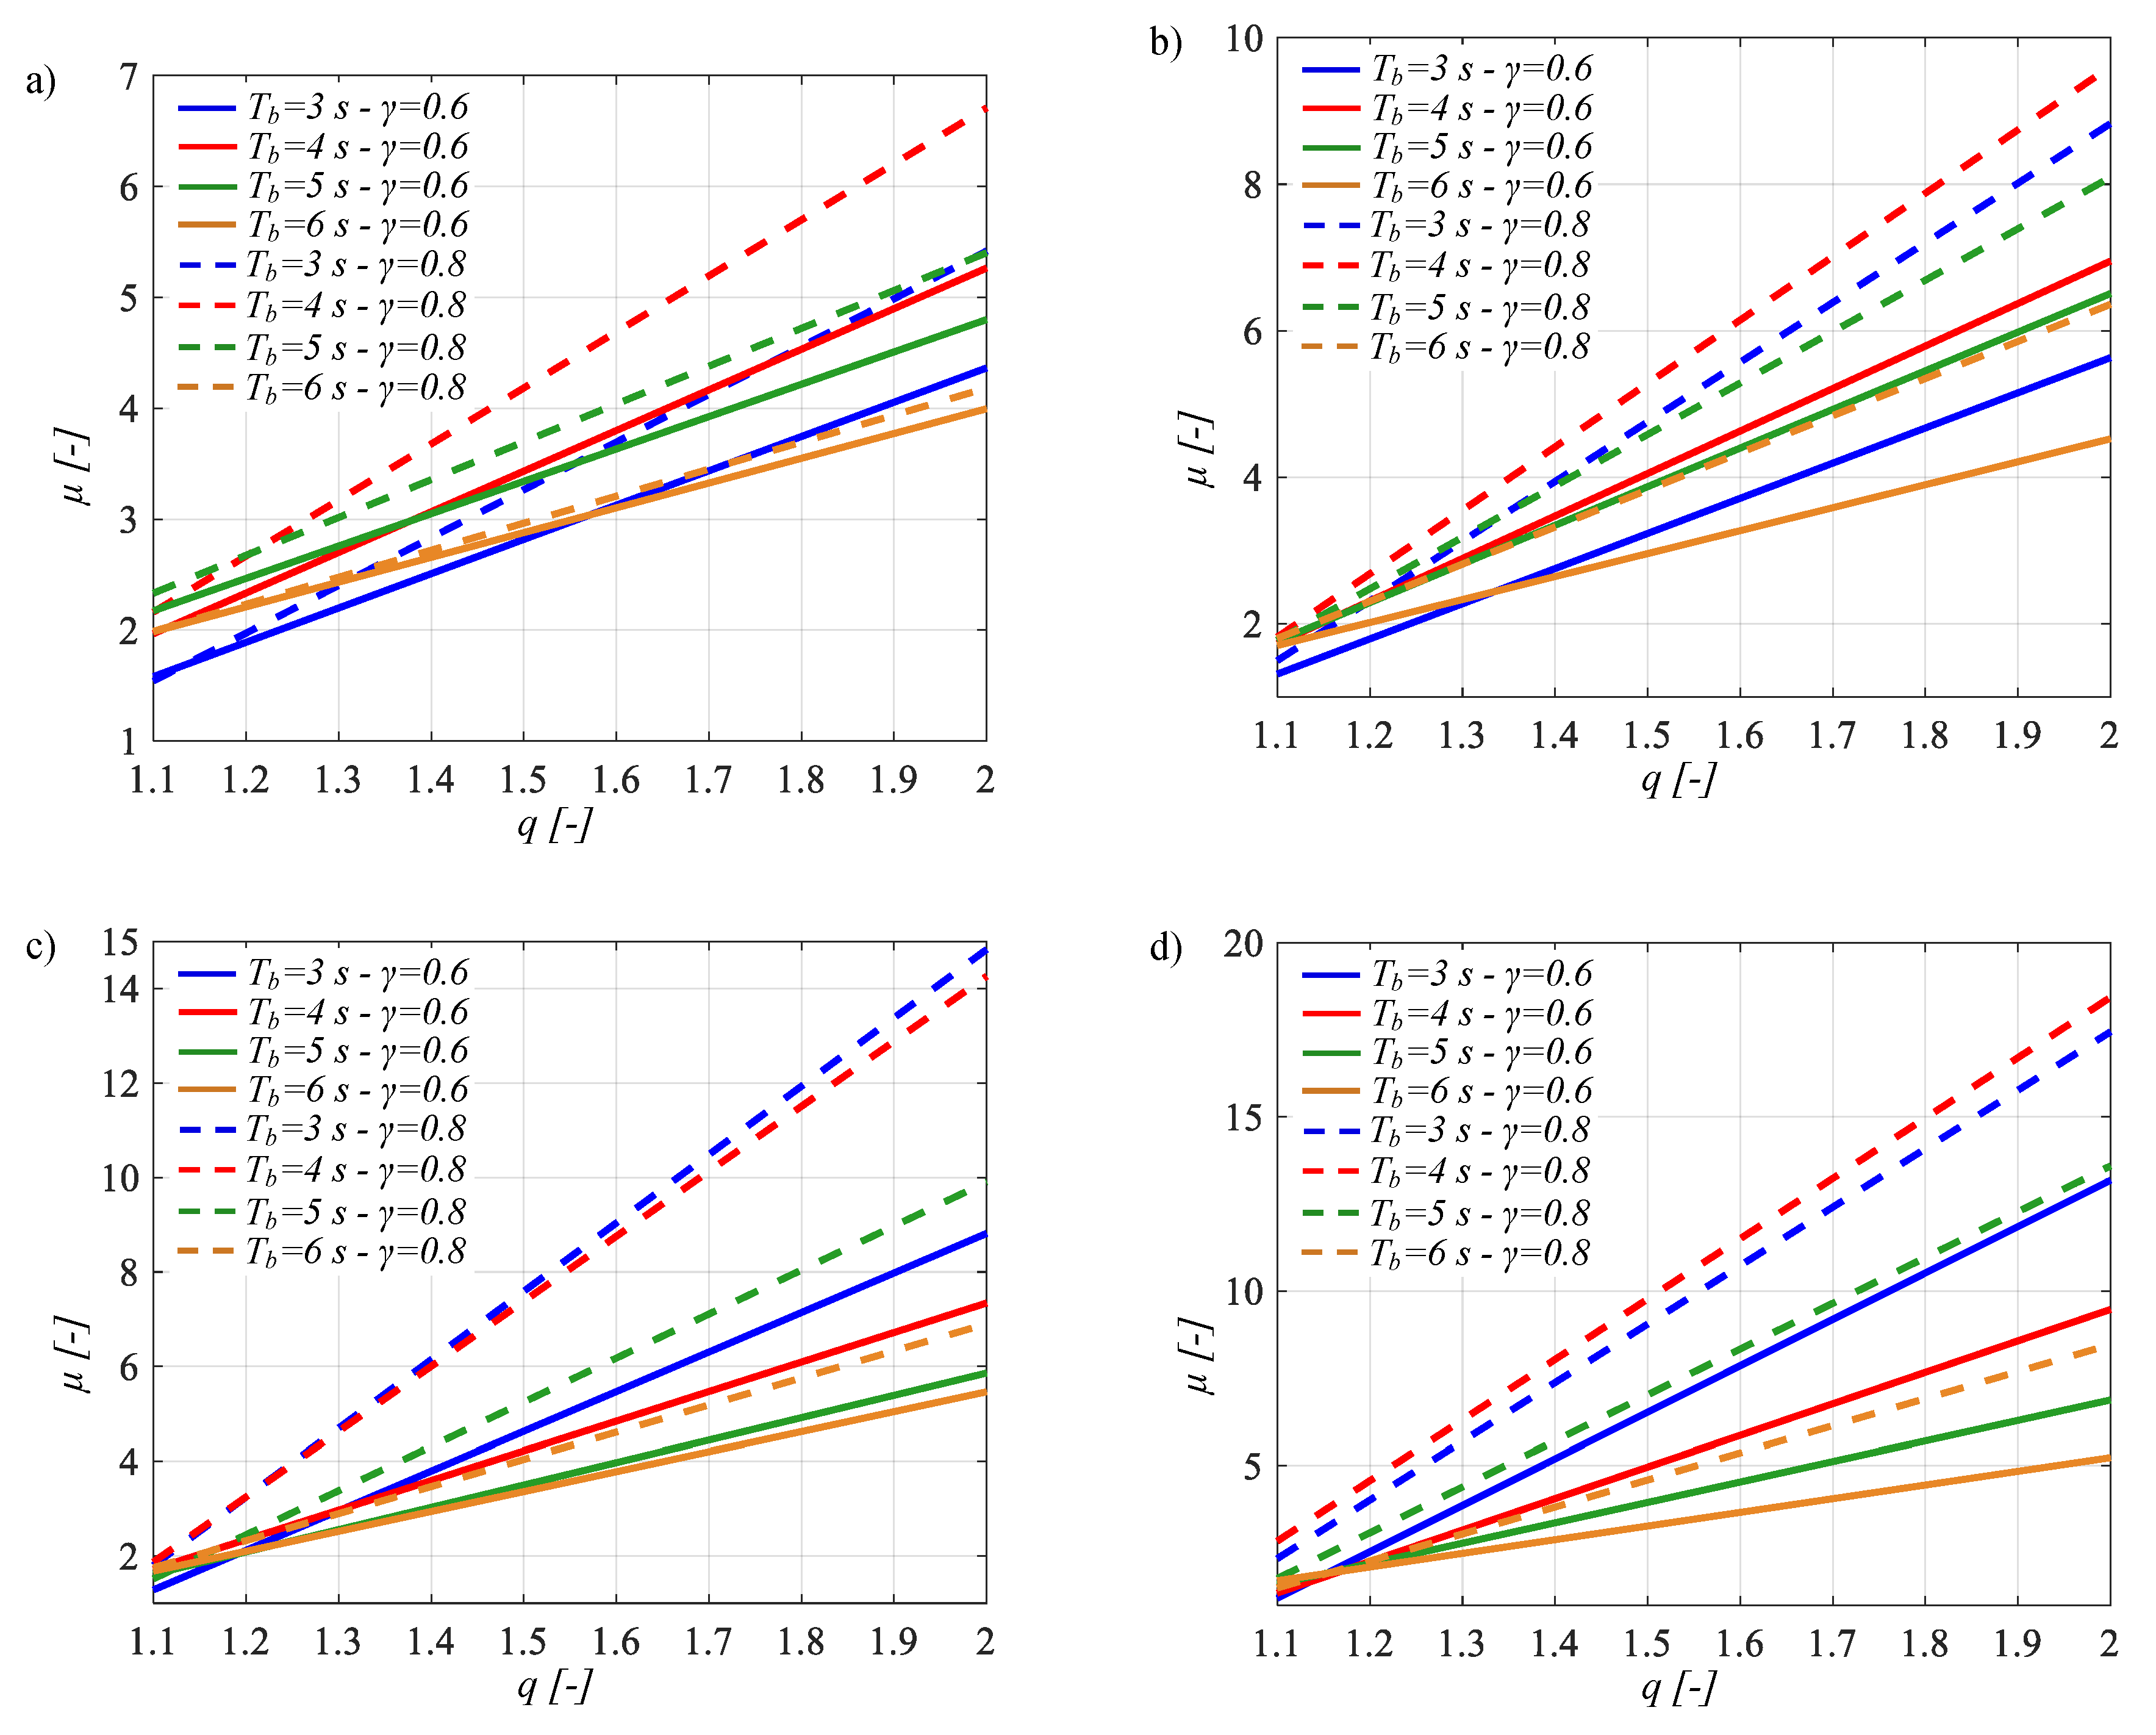
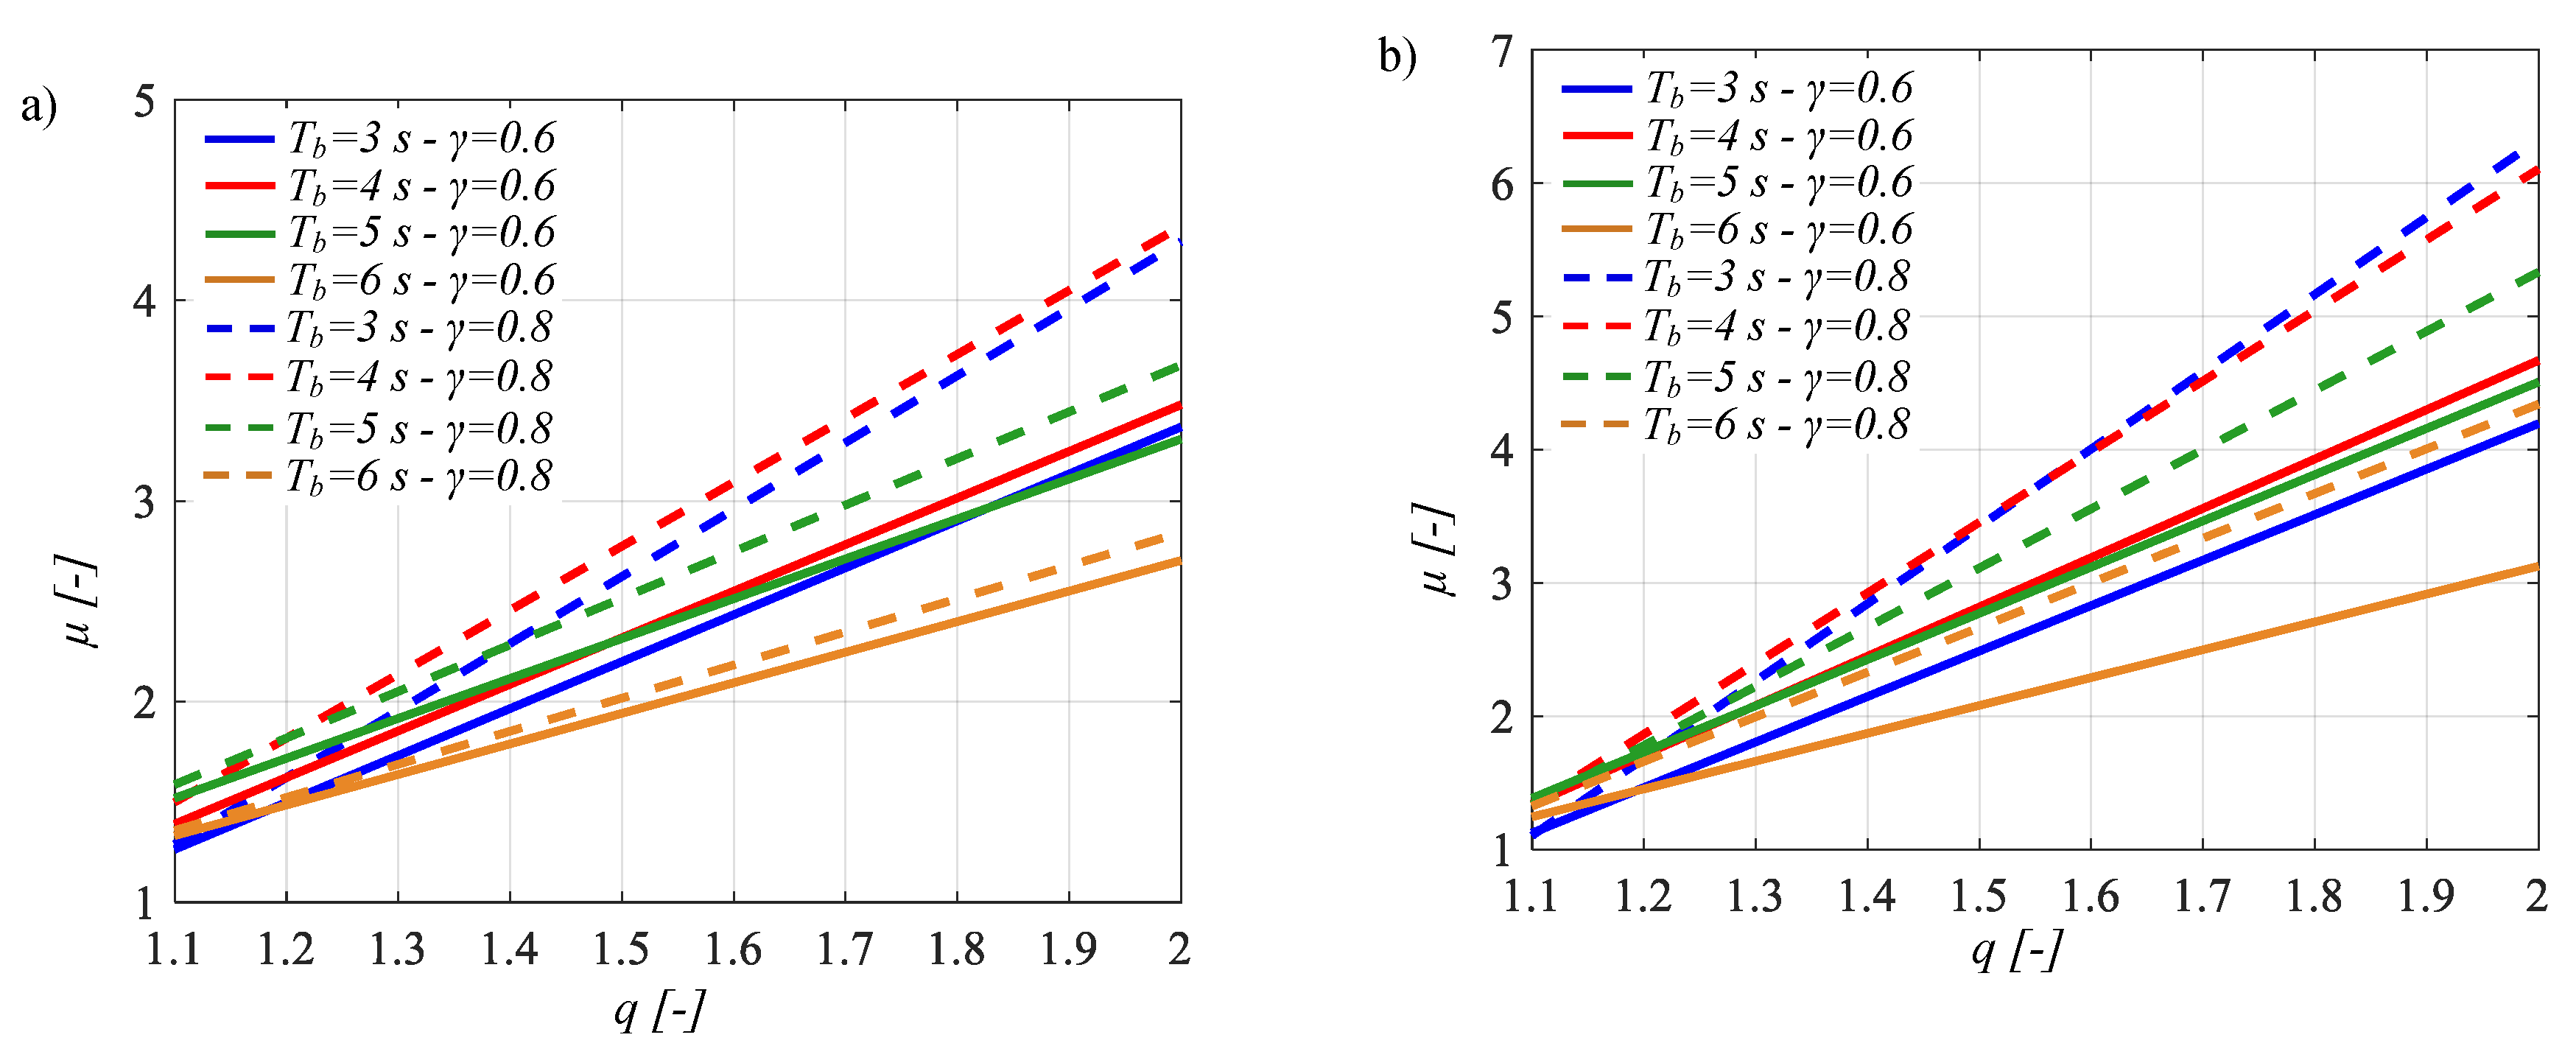
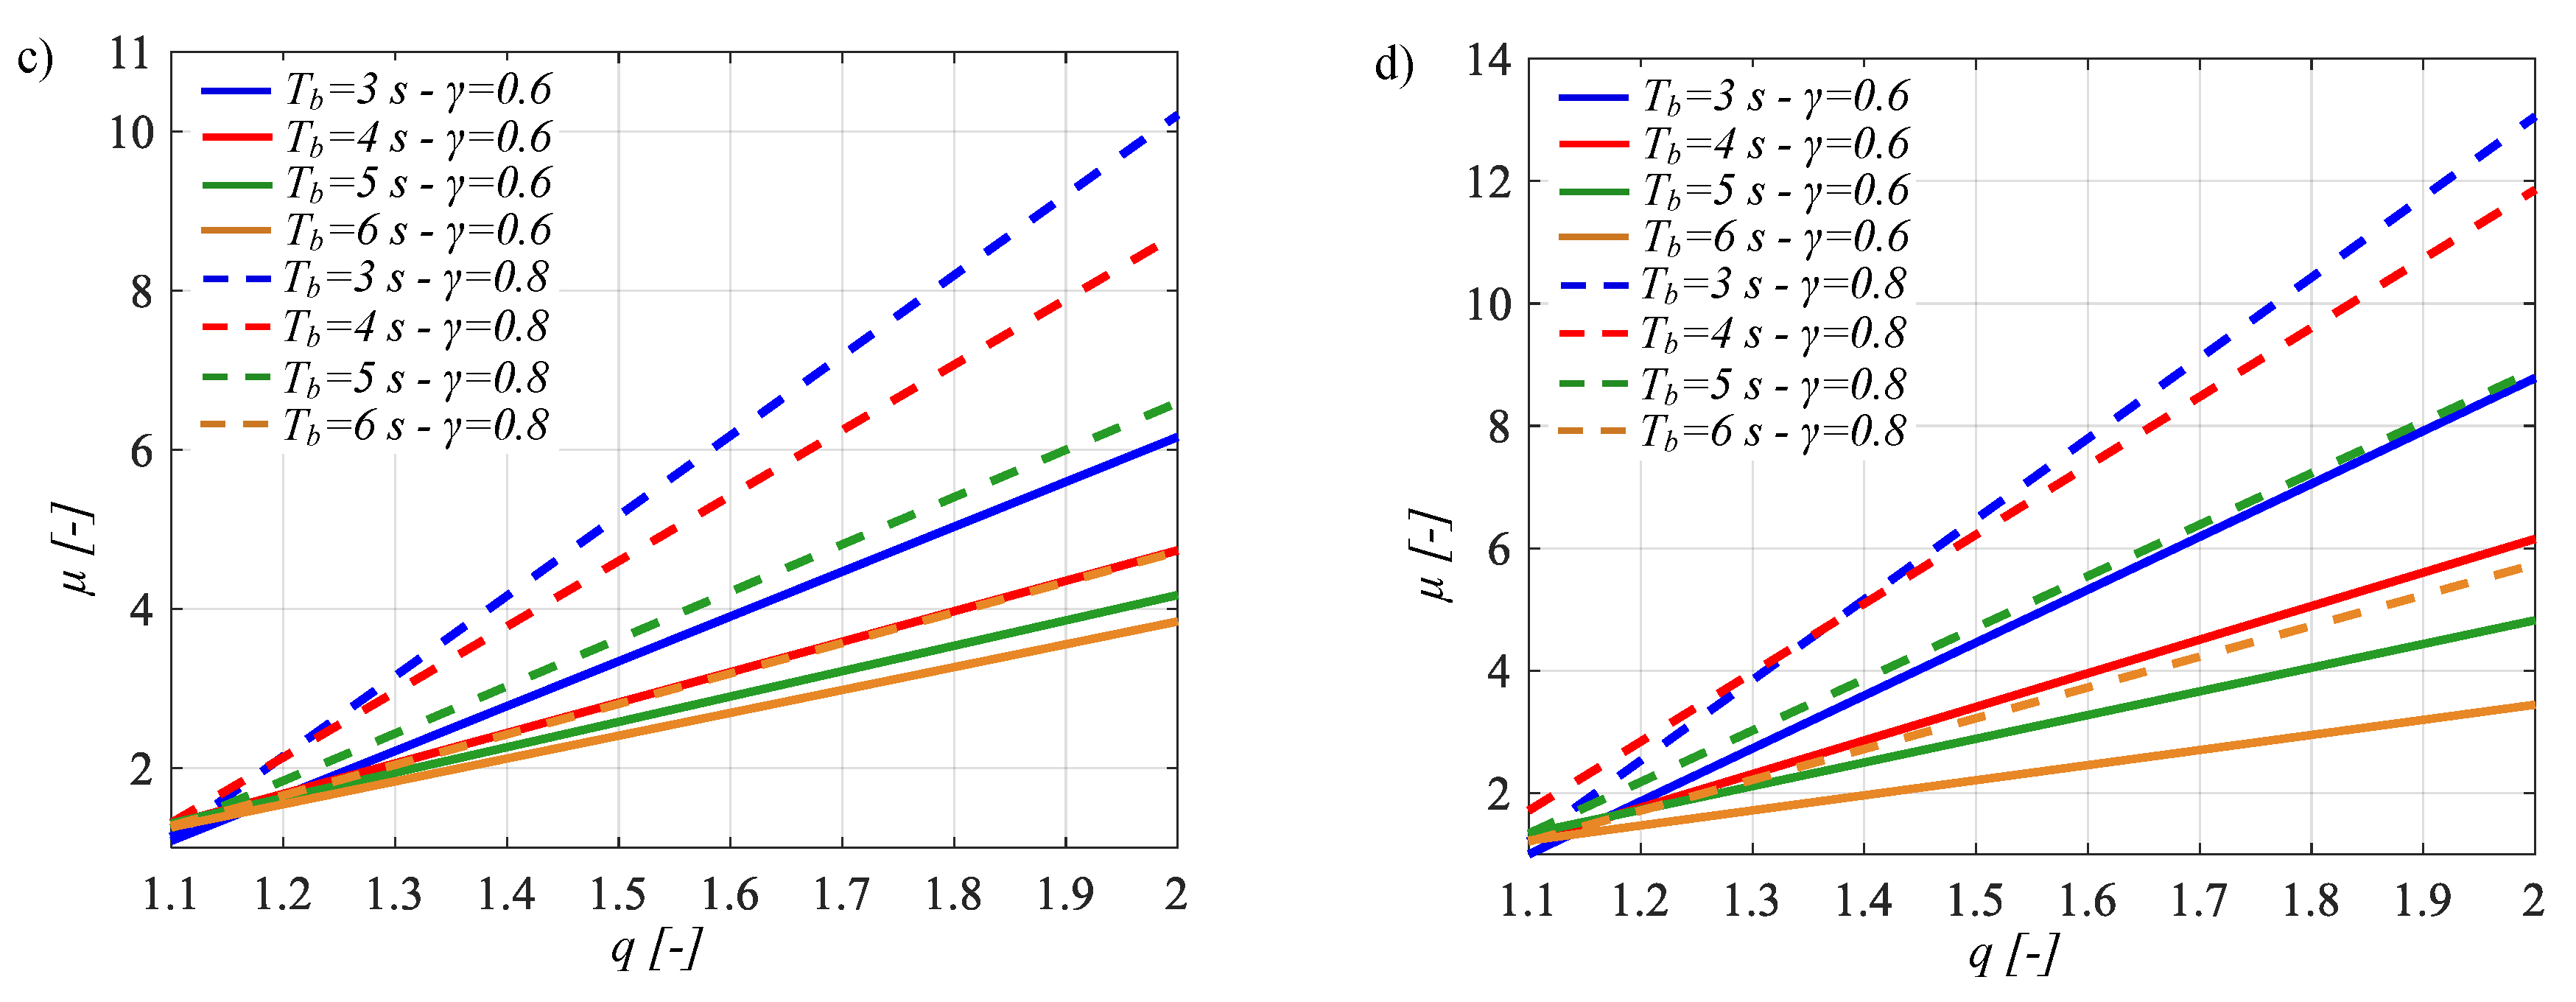
This section provides the displacement ductility demand as a function of q and of other structural parameters corresponding to the reference exceeding probability in 50 years equal to 2.2·10−2 [39] (i.e., the failure probability associated with the life safety limit state [19], Table 3), for each site. Note that for few structural properties has it been possible by means of exponential regressions (linear regressions in the logarithmic space) to estimate the displacement ductility demand corresponding to the life safety limit state exceeding probability. The abovementioned seismic reliability-based displacement ductility demands, fitted through linear regressions, with an R-square higher than 0.96 for the Chiusaforte site and higher than 0.95 for the Sant’Angelo dei Lombardi site, are plotted in Figure 16 and Figure 17 for both sites of interest and for each parameter combination depending on the (ductility-dependent) strength reduction factor q. These proposed seismic reliability-based regressions can be extended to regular base-isolated mdof (multi-degree-of-freedom) systems under the hypothesis of regularity, as stated in [62], and can provide useful design recommendations.
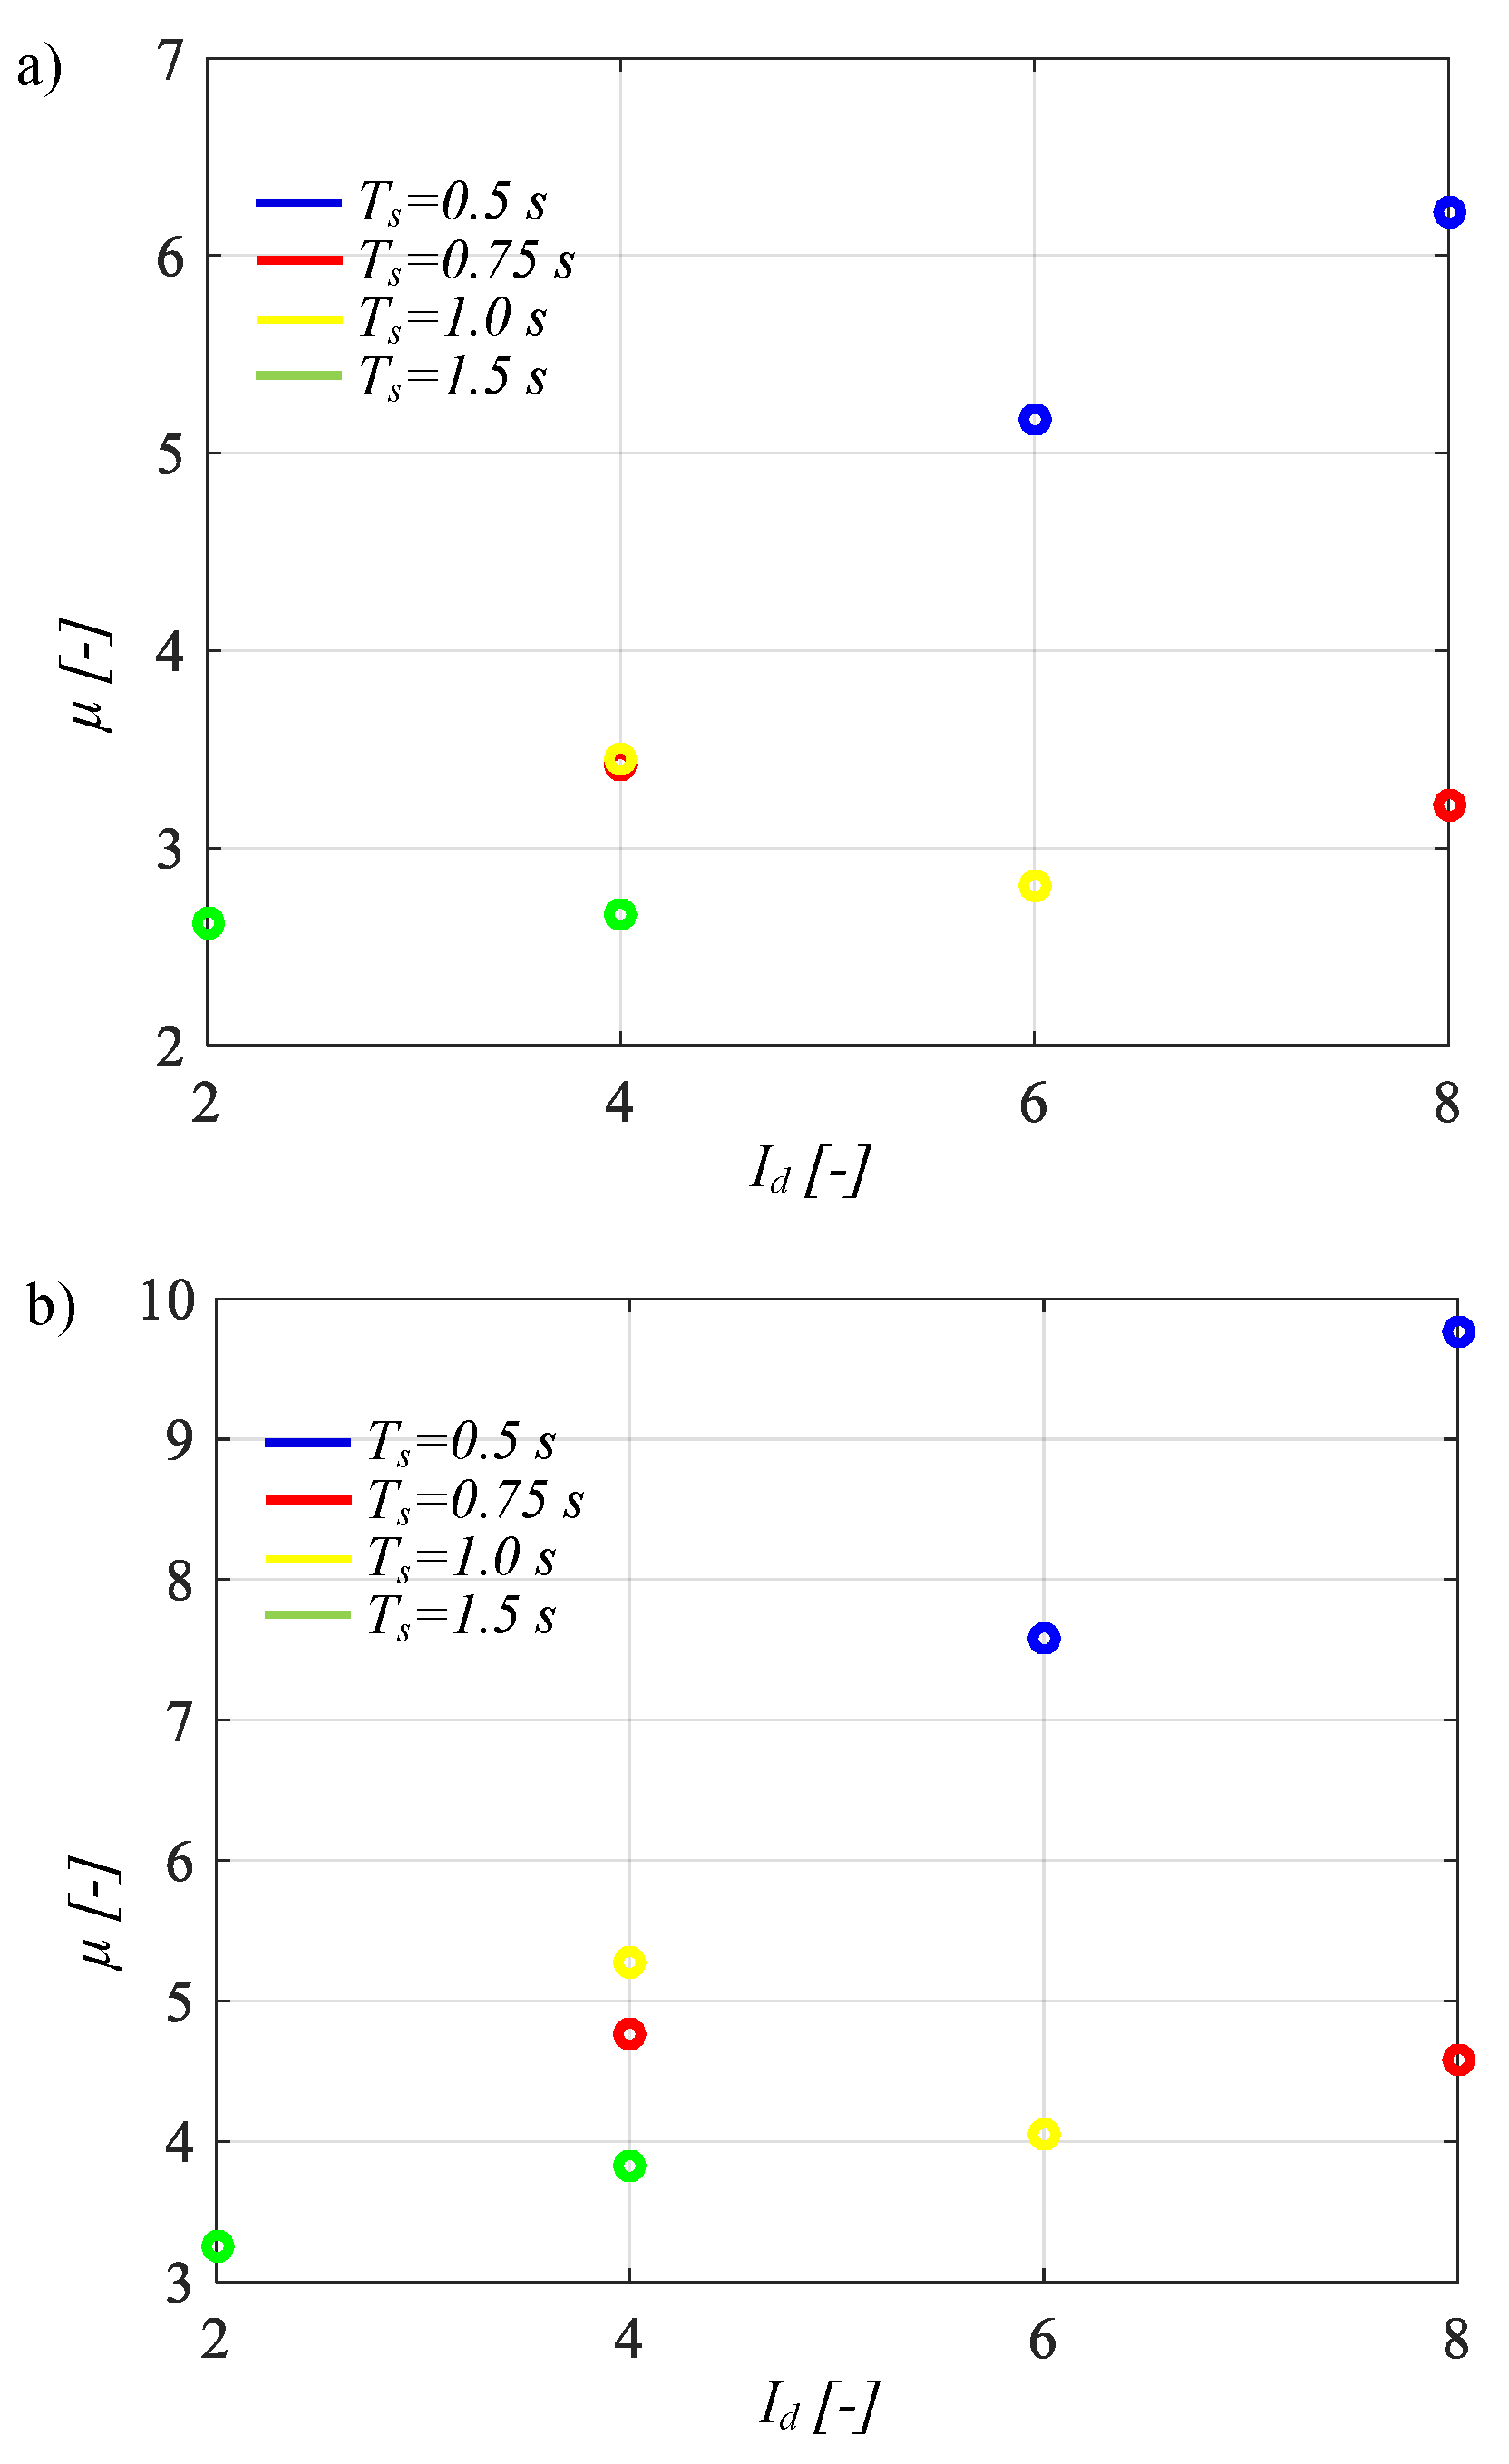
The results are consistent with the outcomes reported in [27], confirming the influence of structural properties on the displacement ductility demand of base-isolated systems located in different Italian sites with a high seismic hazard. Precisely, high values of the (ductility-dependent) strength reduction factor and of the mass ratio lead to a disproportionately large displacement ductility demand, which may cause collapse [63]. It can also be observed that lower values of Id, with fixed Tb, can reduce the displacement ductility demand as well as that with fixed Ts, higher values of Id can be useful to reduce the displacement ductility demand in some cases, as illustrated in Figure 18 for a fixed value of q = 1.5. It surely can be noted that the behavior factor of the codes is high for some structural properties.
As expected, the values of the displacement ductility demand µ obtained for the Sant’Angelo dei Lombardi site are slightly higher than the values obtained for Chiusaforte. A comparison of the seismic reliability-based results of the Sant’Angelo dei Lombardi site and the Chiusaforte site with the outcomes related to the L’Aquila site [27] shows a similarity in the values for the three different Italian sites, confirming the possibility of using SRBD as a sustainable and applicable approach. In addition, as explained in [27], these seismic reliability-based results, within the force-based approach [18,19,20,21,22], are related only to the ductility-dependent behavior because the overstrength capacities are included in the equivalent perfectly elastoplastic models.
Finally, the proposed results for the two sites suggest that the relationship between the (ductility-dependent) behavior factor q and the displacement ductility demand is linear, with a slope higher than unity and that for some parameter combinations. Especially for low isolated periods with a high isolation degree and mass ratio, a value of q lower than 1.5 should be suggested in areas with a high seismic hazard.

7. Conclusions

This study employs the seismic reliability-based design (SRBD) approach for inelastic structures isolated by friction pendulum system (FPS) isolators, comparing the results of two different Italian sites (i.e., Sant’Angelo dei Lombardi and Chiusaforte) with a high seismic hazard. The seismic reliability of these structural systems is assessed assuming different elastic and inelastic properties, different seismic intensity levels and considering the aleatory uncertainties in the friction coefficient and in the seismic inputs. Scaling natural seismic records to the seismic intensities at the life safety limit state for the two Italian sites, the yielding properties of the superstructures are properly designed for increasing (ductility-dependent) strength reduction factors. Successively, incremental dynamic analyses are carried out according to the seismic hazard of each site to assess the seismic fragility of the inelastic superstructure and of the seismic devices. In this way, considering the seismic hazard curves of the Sant’Angelo dei Lombardi site and of the Chiusaforte site (Italy), respectively, for systems isolated through FPS devices and with a reference life of 50 years, SRBD abacuses are proposed. Specifically, SRBD curves relate the dimensions in plan of the FPS bearings and the failure probability depending on the structural parameters. In addition, SRB curves are provided with the purpose of defining reliable relationships between the (ductility-dependent) strength reduction factor and the displacement ductility demand, depending also on the other structural properties. The results highlight that a slight overestimate of the (ductility-dependent) strength reduction factor may also lead to unexpected amplification phenomena (i.e., collapse). In compliance with other literature results related to the L’Aquila site (Italy), the proposed regression relationships are linear, and for some parameter combinations, show a slope strongly higher than unity. These larger slopes are achieved especially in the case of the Sant’Angelo dei Lombardi site due to its higher seismic hazard. However, the SRBD abacuses related to both the isolation level and the superstructure for based-isolated systems located in the Sant’Angelo dei Lombardi site and the Chiusaforte site are consistent with the results related to the L’Aquila site. Therefore, it is possible to use the proposed SRBD formulae as design recommendations for a reliable and preliminary design of base-isolated regular frames, located in high seismic areas. Moreover, the comparison of results between the two sites and with the outcomes related to the L’Aquila site demonstrates the applicability of the SRBD approach as a sustainable and applicable design methodology, providing a large data set useful for a reliable preliminary design of base-isolated building frames with FPS devices in any area with a similar seismic hazard.

Author Contributions

Conceptualization, P.C.; methodology, P.C.; software, P.C. and T.F.; validation, P.C. and T.F.; formal analysis, P.C. and T.F.; investigation, P.C. and T.F.; resources, P.C. and T.F.; data curation, P.C. and T.F.; writing—original draft preparation, P.C. and T.F.; writing—review and editing, P.C. and T.F.; visualization, P.C. and T.F.; supervision, P.C.; project administration, P.C.; funding acquisition, P.C. All authors have read and agreed to the published version of the manuscript.

Funding

This research received no external funding.

Conflicts of Interest

The authors declare no conflict of interest.

References

  1. Troisi, R.; Alfano, G. Towns as Safety Organizational Fields: An Institutional Framework in Times of Emergency. Sustainability 2019, 11, 7025. [Google Scholar] [CrossRef] [Green Version]
  2. Christopoulos, C.; Filiatrault, A. Principles of Passive Supplemental Damping and Seismic Isolation; IUSS Press: Pavia, Italy, 2006. [Google Scholar]
  3. Zayas, V.A.; Low, S.S.; Mahin, S.A. A simple pendulum technique for achieving seismic isolation. Earthq. Spectra 1990, 6, 317–333. [Google Scholar] [CrossRef]
  4. Su, L.; Ahmadi, G.; Tadjbakhsh, I.G. Comparative study of base isolation systems. J. Eng. Mech. 1989, 115, 1976–1992. [Google Scholar] [CrossRef]
  5. Mokha, A.; Constantinou, M.C.; Reinhorn, A.M. Teflon Bearings in Base Isolation. I: Testing. J. Struct. Eng. 1990, 116, 438–454. [Google Scholar] [CrossRef]
  6. Constantinou, M.C.; Mokha, A.; Reinhorn, A.M. Teflon Bearings in Base Isolation. II: Modeling. J. Struct. Eng. 1990, 116, 455–474. [Google Scholar] [CrossRef]
  7. Constantinou, M.C.; Whittaker, A.S.; Kalpakidis, Y.; Fenz, D.M.; Warn, G.P. Performance of Seismic Isolation Hardware Under Service and Seismic Loading. Tech. Rep. 2007. [Google Scholar] [CrossRef]
  8. Almazàn, J.L.; De la Llera, J.C. Physical model for dynamic analysis of structures with FPS isolators. Earthq. Eng. Struct. Dyn. 2003, 32, 1157–1184. [Google Scholar] [CrossRef]
  9. Ayyub, B.M.; McCuen, R.H. Probability, Statistics, and Reliability for Engineers, 2nd ed.; CRC Press: New York, NY, USA, 2002. [Google Scholar]
  10. Lin, Y.K.; Cai, G.Q. Probabilistic Structural Dynamics—Advanced Theory and Applications; McGraw-Hill: New York, NY, USA, 1995. [Google Scholar]
  11. Chen, J.; Liu, W.; Peng, Y.; Li, J. Stochastic seismic response and reliability analysis of base-isolated structures. J. Earthq. Eng. 2007, 11, 903–924. [Google Scholar] [CrossRef]
  12. Mishra, S.K.; Roy, B.K.; Chakraborty, S. Reliability-based-design-optimization of base isolated buildings considering stochastic system parameters subjected to random earthquakes. Int. J. Mech. Sci. 2013, 75, 123–133. [Google Scholar] [CrossRef]
  13. Zhao, C.; Chen, J. Numerical simulation and investigation of the base isolated NPPC building under three-directional seismic loading. Nucl. Eng. Des. 2013, 265, 484–496. [Google Scholar] [CrossRef]
  14. Barroso, L.R.; Winterstein, S. Probabilistic seismic demand analysis of controlled steel momentresisting frame structures. Earthq. Eng. Struct. Dyn. 2002, 31, 2049–2066. [Google Scholar] [CrossRef]
  15. Castaldo, P.; Palazzo, B.; Della Vecchia, P. Seismic reliability of base-isolated structures with friction pendulum bearings. Eng. Struct. 2015, 95, 80–93. [Google Scholar] [CrossRef]
  16. Castaldo, P.; Mancini, G.; Palazzo, B. Seismic reliability-based robustness assessment of three-dimensional reinforced concrete systems equipped with single-concave sliding devices. Eng. Struct. 2018, 163, 373–387. [Google Scholar] [CrossRef]
  17. Castaldo, P.; Amendola, G.; Palazzo, B. Seismic fragility and reliability of structures isolated by friction pendulum devices: Seismic reliability-based design (SRBD). Earthq. Eng. Struct. Dyn. 2017, 46, 425–446. [Google Scholar] [CrossRef]
  18. European Committee for Standardization. Eurocode 8-Design of Structures for Earthquake Resistance. Part 1: General Rules; Seismic Actions and Rules for Buildings: Brussels, Belgium, 2004. [Google Scholar]
  19. NTC08. Norme tecniche per le costruzioni. Gazzetta Ufficiale del 04.02.08, DM 14.01.08, Ministero delle Infrastrutture. Available online: https://www.google.com.hk/url?sa=t&rct=j&q=&esrc=s&source=web&cd=3&ved=2ahUKEwjwm5782aXoAhUBA4gKHSA1AYsQFjACegQIAhAB&url=https%3A%2F%2Fwww.gazzettaufficiale.it%2Feli%2Fgu%2F2018%2F02%2F20%2F42%2Fso%2F8%2Fsg%2Fpdf&usg=AOvVaw29TzUcjBXYbmWqnE47Hq8M (accessed on 28 January 2020).
  20. Structural Engineering Institute. Minimum design loads for buildings and other structures. Am. Soc. Civ. Eng. 2010, 7, 21–80. [Google Scholar]
  21. Japanese Ministry of Land, Infrastructure and Transport. Notification No. 2009–2000. Technical Standard for Structural Specifications and Calculation of Seismically Isolated Buildings. 2000. Available online: https://www.jaeic.or.jp/english/jaeic-pamphlet_e201306.pdf (accessed on 28 January 2020).
  22. Quantification of Building Seismic Performance Factors, FEMA P695/June 2009. Available online: https://www.fema.gov/media-library-data/20130726-1716-25045-9655/fema_p695.pdf (accessed on 28 January 2020).
  23. Occhiuzzi, A.; Veneziano, D.; Van Dyck, J. Seismic Design of Base Isolated Structures; Balkema: Rotterdam, The Netherlands, 1994. [Google Scholar]
  24. Vassiliou, M.F.; Tsiavos, A.; Stojadinović, B. Dynamics of inelastic base-isolated structures subjected to analytical pulse ground motions. Earthq. Eng. Struct. Dyn. 2013, 42, 2043–2060. [Google Scholar] [CrossRef]
  25. Newmark, N.M.; Hall, W.J. Seismic Design Criteria for Nuclear Reactor Facilities; Report 46; Building Practices for Disaster Mitigation; National Bureau of Standards: Gaithersburg, MD, USA, 1973.
  26. Miranda, E.; Bertero, V.V. Evaluation of strength reduction factors for earthquake-resistant design. Earthq. Spectra 1994, 10, 357–379. [Google Scholar] [CrossRef]
  27. Castaldo, P.; Palazzo, B.; Ferrentino, T. Seismic reliability-based ductility demand evaluation for inelastic base-isolated structures with friction pendulum devices. Earthq. Eng. Struct. Dyn. 2017, 46, 1245–1266. [Google Scholar] [CrossRef]
  28. Castaldo, P.; Palazzo, B.; Alfano, G.; Palumbo, M.F. Seismic reliability-based ductility demand for hardening and softening structures isolated by friction pendulum bearings. Struct. Control Health Monit. 2018, 25, e2256. [Google Scholar] [CrossRef]
  29. Mckey, M.D.; Conover, W.J.; Beckman, R.J. A comparison of three methods for selecting values of input variables in the analysis from a computer code. Technomet 1979, 21, 239–245. [Google Scholar]
  30. Vořechovský, M.; Novák, D. Correlation control in small-sample Monte Carlo type simulations I: A simulated annealing approach. Probabilistic Eng. Mech. 2009, 24, 452–462. [Google Scholar] [CrossRef]
  31. Celarec, D.; Dolšek, M. The impact of modelling uncertainties on the seismic performance assessment of reinforced concrete frame buildings. Eng. Struct. 2013, 52, 340–354. [Google Scholar] [CrossRef]
  32. Naeim, F.; Kelly, J.M. Design of Seismic Isolated Structures: From Theory to Practice; John Wiley & Sons: Hoboken, NJ, USA, 1999. [Google Scholar]
  33. Ryan, K.L.; Chopra, A.K. Estimation of Seismic Demands on Isolators Based on Nonlinear Analysis. J. Struct. Eng. 2004, 130, 392–402. [Google Scholar] [CrossRef]
  34. Palazzo, B. Seismic Behavior of Base-Isolated Buildings. Proc. Inst. Civ. Eng. Struct. Build. 1995, 110, 186–203. [Google Scholar]
  35. Fanaiea, N.; Afsar Dizaj, E. Response modification factor of the frames braced with reduced yielding segment BRB. Struct. Eng. Mech. 2014, 50, 1–17. [Google Scholar] [CrossRef]
  36. Abdollahzadeh, G.H.; Banihashemi, M.R. Response modification factor of dual moment-resistant frame with buckling restrained brace (BRB). Steel Compos. Struct. 2013, 14, 621–636. [Google Scholar] [CrossRef] [Green Version]
  37. Niroomandi, A.; Maheri, A. Upgrading the Ductility and Seismic Behavior Factor of Ordinary rc Frames Using Fiber Composite Sheets. In Proceedings of the 3rd International Conference on Concrete & Development, Tehran, Iran, 27–29 April 2009. [Google Scholar]
  38. Collins, K.R.; Stojadinovic, B. Limit States for Performance-Based Design. In Proceedings of the 12th World Conference on Earthquake Engineering, Auckland, New Zeland, 30 January–4 February 2000. [Google Scholar]
  39. Bertero, R.D.; Bertero, V.V. Performance-based seismic engineering: The need for a reliable conceptual comprehensive approach. Earthq. Eng. Struct. Dyn. 2002, 31, 627–652. [Google Scholar] [CrossRef]
  40. Aoki, Y.; Ohashi, Y.; Fujitani, H.; Saito, T.; Kanda, J.; Emoto, T.; Kohno, M. Target Seismic Performance Levels in Structural Design for Buildings. In Proceedings of the 12th World Conference on Earthquake Engineering, Auckland, New Zeland, 30 January–4 February 2000. [Google Scholar]
  41. SEAOC Vision 2000 Committee. Performance-Based Seismic Engineering; Structural Engineers Association: Sacramento, CA, USA, 1995. [Google Scholar]
  42. CEN—European Committee for Standardization. Eurocode 0: Basis of Structural Design; Final Draft; CEN—European Committee for Standardization: Brussels, Belgium, 2006. [Google Scholar]
  43. Saito, T.; Kanda, J.; Kani, N. Seismic Reliability Estimate of Building Structures Designed According to the Current Japanese Design Code. In Proceedings of the Structural Engineers World Congress, San Francisco, CA, USA, 19–23 July 1998. [Google Scholar]
  44. Cornell, C.A.; Krawinkler, H. Progress and challenges in seismic performance assessment. Peer Cent. News 2000, 4, 1–3. [Google Scholar]
  45. Aslani, H.; Miranda, E. Probability-based seismic response analysis. Eng. Struct. 2005, 27, 1151–1163. [Google Scholar] [CrossRef]
  46. Porter, K.A. An Overview of PEER’s Performance-Based Earthquake Engineering Methodology. In Proceedings of the 9th International Conference on Application of Statistics and Probability in Civil Engin, San Francisco, CA, USA, 6–9 July 2003. [Google Scholar]
  47. Castaldo, P.; Gino, D.; Mancini, G. Safety formats for non-linear finite element analysis of reinforced concrete structures: Discussion, comparison and proposals. Eng. Struct. 2019, 193, 136–153. [Google Scholar] [CrossRef]
  48. Kulkarni, J.A.; Jangid, R.S. Effects of superstructure flexibility on the response of base-isolated structures. Shock Vib. 2003, 26, 1–13. [Google Scholar] [CrossRef] [Green Version]
  49. Isolatori a Scorrimentoa Superficie. Available online: https://www.fipindustriale.it/public/S04_FIP%20FIP-D-ita.pdf (accessed on 28 January 2020).
  50. Shome, N.; Cornell, C.A.; Bazzurro, P.; Carballo, J.E. Earthquake, records, and nonlinear responses. Earthq. Spectra 1998, 14, 469–500. [Google Scholar] [CrossRef]
  51. Luco, N.; Cornell, C.A. Structure-specific scalar intensity measures for near-source and ordinary earthquake ground motions. Earthq. Spectra 2007, 23, 357–392. [Google Scholar] [CrossRef] [Green Version]
  52. ISESD, Internet-Site for European Strong-Motion Data. Available online: http://www.isesd.hi.is/ESD_Local/frameset.htm (accessed on 28 January 2020).
  53. ITACA, Italian Accelerometric Archive. Available online: http://itaca.mi.ingv.it/ItacaNet/itaca10_links.htm (accessed on 28 January 2020).
  54. PEER, Pacific Earthquake Engineering Research Center. Available online: http://peer.berkeley.edu/ (accessed on 28 January 2020).
  55. Vamvatsikos, D.; Cornell, C.A. Incremental dynamic analysis. Earthq. Eng. Struct. Dyn. 2002, 31, 491–514. [Google Scholar] [CrossRef]
  56. Math Works Inc. MATLAB-High Performance Numeric Computation and Visualization Software; User’s Guide: Natick, MA, USA, 1997. [Google Scholar]
  57. Karavasilis, T.; Seo, C. Seismic structural and non-structural performance evaluation of highly damped self-centering and conventional systems. Eng. Struct. 2011, 33, 2248–2258. [Google Scholar] [CrossRef] [Green Version]
  58. Golzio, L.E.; Troisi, R. The value of interdisciplinary research: A model of interdisciplinarity between legal research and research in organizations. J. Dev. Leadersh. 2013, 2, 23–38. [Google Scholar]
  59. Nese, A.; Troisi, R. Corruption among mayors: Evidence from Italian Court of Cassation judgments. Trends Organ. Crime 2018, 1–26. [Google Scholar] [CrossRef]
  60. Tsiavos, A.; Mackie, K.R.; Vassiliou, M.F.; Stojadinović, B. Dynamics of inelastic base-isolated structures subjected to recorded ground motions. Bull. Earthq. Eng. 2017, 15, 1807–1830. [Google Scholar] [CrossRef]
  61. Pasticier, L.; Amadio, C.; Fragiacomo, M. Non-linear seismic analysis and vulnerability evaluation of a masonry building by means of the SAP2000 V.10 code. Earthq. Eng. Struct. Dyn. 2008, 37, 467–485. [Google Scholar] [CrossRef]
  62. Fajfar, P. A Nonlinear Analysis Method for Performance Based Seismic Design. Earthq. Spectra 2000, 16, 573–592. [Google Scholar] [CrossRef]
  63. Paulay, T.; Priestley, M.J.N. Seismic Design of Reinforced Concrete and Masonry Buildings; John Wiley & Sons: Hoboken, NJ, USA, 1992. [Google Scholar]
Figure 1. 2dof system of an inelastic building frame equipped with a friction pendulum system (FPS).
Sustainability 12 02400 g001
Figure 2. Seismic hazard curves for the Sant’Angelo dei Lombardi site (a) and the Chiusaforte site (b).
Sustainability 12 02400 g002
Figure 3. Elastic response spectra in terms of pseudo-accelerations for (a) the unscaled records and for (b) the records scaled to the common seismic intensity measure SD (Tb) = 0.3376 m (Spa = 0.151 g) for a period equal to 3 s.
Sustainability 12 02400 g003
Figure 4. Incremental dynamic analysis (IDA) curves of the FPS for the Sant’Angelo dei Lombardi site (Italy), with Id = 2 and Tb = 3 s (a), Id = 2 and Tb = 6 s (b), Id = 8 and Tb = 3 s (c), and Id = 8 and Tb = 6 s (d). The arrow denotes the increasing direction of γ.
Sustainability 12 02400 g004
Figure 5. IDA curves of the FPS for the Chiusaforte site (Italy), with Id = 2 and Tb = 3 s (a), Id = 2 and Tb = 6 s (b), Id = 8 and Tb = 3 s (c), and Id = 8 and Tb = 6 s (d). The arrow denotes the increasing direction of γ.
Sustainability 12 02400 g005
Figure 6. IDA curves of the superstructure for the Sant’Angelo dei Lombardi site (Italy), with Id = 2 and Tb = 3 s (a), Id = 2 and Tb = 6 s (b), Id = 8 and Tb = 3 s (c), and Id = 8 and Tb = 6 s (d). The arrow denotes the increasing direction of γ.
Sustainability 12 02400 g006
Figure 7. IDA curves of the superstructure for the Chiusaforte site (Italy), with Id = 2 and Tb = 3 s (a), Id = 2 and Tb = 6 s (b), Id = 8 and Tb = 3 s (c), and Id = 8 and Tb = 6 s (d). The arrow denotes the increasing direction of γ.
Sustainability 12 02400 g007
Figure 8. Seismic fragility curves of the FPS for the Sant’Angelo dei Lombardi site (Italy), related to LSb,8 = 0.4 m, for Id = 2 and Tb = 3 s (a), Id = 2 and Tb = 6 s (b), Id = 8 and Tb = 3 s (c), and Id = 8 and Tb = 6 s (d).
Sustainability 12 02400 g008
Figure 9. Seismic fragility curves of the FPS for the Chiusaforte site (Italy), related to LSb,8 = 0.4 m, for Id = 2 and Tb = 3 s (a), Id = 2 and Tb = 6 s (b), Id = 8 and Tb = 3 s (c), and Id = 8 and Tb = 6 s (d).
Sustainability 12 02400 g009aSustainability 12 02400 g009b
Figure 10. Seismic fragility curves of the superstructure for the Sant’Angelo dei Lombardi site (Italy), related to LSμ,3=3, for Id = 2 and Tb = 3 s (a), Id = 2 and Tb = 6 s (b), Id = 8 and Tb = 3 s (c), and Id = 8 and Tb = 6 s (d).
Sustainability 12 02400 g010
Figure 11. Seismic fragility curves of the superstructure for the Chiusaforte site (Italy), related to LSμ,3=3, for Id = 2 and Tb = 3 s (a), Id = 2 and Tb = 6 s (b), Id = 8 and Tb = 3 s (c), and Id = 8 and Tb = 6 s (d).
Sustainability 12 02400 g011
Figure 12. FPS seismic reliability curves for the Sant’Angelo dei Lombardi site (Italy), related to Id = 2 and Tb = 3 s (a), Id = 2 and Tb = 4 s (b), Id = 8 and Tb = 3 s (c), and Id = 8 and Tb = 6 s (d).
Sustainability 12 02400 g012
Figure 13. FPS seismic reliability curves for the Chiusaforte site (Italy), related to Id = 2 and Tb = 3 s (a), Id = 2 and Tb = 6 s (b), Id = 8 and Tb = 3 s (c), and Id = 8 and Tb = 6 s (d).
Sustainability 12 02400 g013
Figure 14. Seismic reliability curves of the superstructure for the Sant’Angelo dei Lombardi site (Italy), related to Id = 2 and Tb = 3 s (a), Id = 2 and Tb = 6 s (b), Id = 8 and Tb = 3 s (c), and Id = 8 and Tb = 6 s (d).
Sustainability 12 02400 g014aSustainability 12 02400 g014b
Figure 15. Seismic reliability curves of the superstructure for the Chiusaforte site (Italy), related to Id = 2 and Tb = 3 s (a), Id = 2 and Tb = 6 s (b), Id = 8 and Tb = 3 s (c), and Id = 8 and Tb = 6 s (d).
Sustainability 12 02400 g015aSustainability 12 02400 g015b
Figure 16. Seismic reliability-based (SRB) regressions between the displacement ductility demand and strength reduction factor for the Sant’Angelo dei Lombardi site (Italy), related to Id = 2 (a), Id = 4 (b), Id = 6 (c), and Id = 8 (d).
Sustainability 12 02400 g016
Figure 17. SRB regressions between the displacement ductility demand and strength reduction factor for the Chiusaforte site (Italy), related to Id = 2 (a), Id = 4 (b), Id = 6 (c), and Id = 8 (d).
Sustainability 12 02400 g017aSustainability 12 02400 g017b
Figure 18. Displacement ductility demand for increasing Id with fixed Ts and considering γ = 0.8, q = 1.5, for the Chiusaforte site (a) and the Sant’Angelo dei Lombardi site (b).
Sustainability 12 02400 g018
Table 1. Ground motions.
#Earthquake NameYearRecording Station NameM [-]Fault TypePGA [g]Rs [km]Vs30 [m/s]
1Northridge1994Beverly Hills, Mulhol6.7Thrust0.5213.3356
2Northridge1994Canyon Country, WLC6.7Thrust0.4826.5309
3Northridge1994LA, Hollywood Stor6.7Thrust0.3622.9316
4Duzce, Turkey1999Bolu7.1Strike-slip0.8241.3326
5Hector Mine1999Hector7.1Strike-slip0.3426.5685
6Imperial Valley1979Delta6.5Strike-slip0.3533.7275
7Imperial Valley1979El Centro Array #116.5Strike-slip0.3829.4196
8Kobe, Japan1995Nishi, Akashi6.9Strike-slip0.518.7609
9Kobe, Japan1995Shin, Osaka6.9Strike-slip0.2446.0256
10Kocaeli, Turkey1999Duzce7.5Strike-slip0.3698.2276
11Kocaeli, Turkey1999Arcelik7.5Strike-slip0.2253.7523
12Landers1992Yermo Fire Station7.3Strike-slip0.2486.0354
13Landers1992Coolwater7.3Strike-slip0.4282.1271
14Loma Prieta1989Capitola6.9Strike-slip0.539.8289
15Loma Prieta1989Gilroy Array #36.9Strike-slip0.5631.4350
16Manjil, Iran1990Abbar7.4Strike-slip0.5140.4724
17Superstition Hills1987El Centro Imp. Co.6.5Strike-slip0.3635.8192
18Superstition Hills1987Poe Road (temp)6.5Strike-slip0.4511.2208
19Superstition Hills1987Westmorland Fire Stat.6.5Strike-slip0.2115.1194
20Cape Mendocino1992Rio Dell Overpass7.0Thrust0.5522.7312
21Chi-Chi, Taiwan1999CHY1017.6Thrust0.4432259
22Chi-Chi, Taiwan1999TCU0457.6Thrust0.5177.5705
23San Fernando1971LA, Hollywood Stor6.6Thrust0.2139.5316
24Friuli, Italy1976Tolmezzo6.5Thrust0.3520.2425
25Irpinia1980Bisaccia6.9 0.9421.3496
26Montenegro1979ST646.9Thrust0.1821.01083
27Umbria and Marche1997ST2386.0Normal0.1921.5n/a
28South Iceland2000ST24876.5Strike-slip0.1613n/a
29South Iceland (a.s.)2000ST25576.4Strike-slip0.1315.0n/a
30Bingol2003ST5396.3Strike-slip0.3014.0806
Table 2. Limit state thresholds for the isolation level with the associated reference failure probability in 50 years.
LSb,1LSb,2LSb,3LSb,4LSb,5LSb,6LSb,7LSb,8LSb,9LSb,10
r [m]0.050.10.150.20.250.30.350.40.450.5
Pf (50 years) = 1.5 × 10⁻³
Table 3. Limit state thresholds for the superstructure with the associated reference failure probability in 50 years.
LSμ,1LSμ,2LSμ,3LSμ,4LSμ,5LSμ,6LSμ,7LSμ,8LSμ,9LSμ,10
μ [-]12345678910
Pf (50 years) = 2.2·10−2