Article

Possibilities of Controlling the River Outlets by Weirs on the Example of Noteć Bystra River

by
Joanna Wicher-Dysarz
1,*,
Ewelina Szałkiewicz
1,
Joanna Jaskuła
2,
Tomasz Dysarz
1 and
Maksymilian Rybacki
1
1
Department of Hydraulic and Sanitary Engineering, Faculty of Environmental Engineering and Spatial Management, Poznan University of Life Sciences, 60-637 Poznan, Poland
2
Institute of Land Improvement, Environmental Development and Geodesy, Faculty of Environmental Engineering and Spatial Management, Poznan University of Life Sciences, 60-637 Poznan, Poland
*
Author to whom correspondence should be addressed.
Sustainability 2020, 12(6), 2369; https://doi.org/10.3390/su12062369
Submission received: 13 February 2020 / Revised: 9 March 2020 / Accepted: 16 March 2020 / Published: 18 March 2020
(This article belongs to the Special Issue Advances and Challenges in the Sustainable Water Management)

Abstract

:
The possibility of effective control of selected dams in the Noteć Bystra river is analyzed. Such a control is expected to permit inundation of selected arable areas, e.g., peat grasslands, to avoid flooding of the city of Czarnków and the terrains located downstream. The chosen case study is the reach of the Noteć River between the dams Pianowka–Mikolajewo–Rosko. The analysis was made on the basis of simulations of the flow and regulation of dams in flood conditions. The flow peaks of hypothetical flood waves were designed according to the directions of the ISOK project (Informatyczny System Osłony Kraju przed nadzwyczajnymi zagrożeniami—IT System of the Country’s Protection Against Extreme Hazards) as the maximum flows over 10-years (p = 10%), 100-years (p = 1%), and 500-years (p = 0.2%). The obtained results are presented as longitudinal profiles of the water surface, maps of inundated areas and maps of inundated soils. The main conclusion is that the robust control of dams reduces the peak of flow during flood wave propagation and forces inundation of the a priori selected areas. It helps to decrease the spatial range of the flood hazard and significantly reduces risk related to floods.

1. Introduction

Flood losses have become an increasingly frequent phenomena [1,2,3,4,5] and flood hazard depends on two factors. The first is the natural ability of the watershed to generate floods from precipitation deposited over the watershed area. The second is related to human activity related to the use of water and lands located along the rivers and streams [5,6,7,8,9]. It has been suggested that increasing industrialization reinforces climate change at the local and global scale. Such changes foster frequent occurrence of extreme natural phenomena such as rainfalls and floods. Additionally, changes in land use in basins and watersheds reduce water retention and accelerate the process of rainfall–runoff transformation. Increasing population density makes occurrence of flood losses more frequent and more severe. All the mentioned problems are observed, in particular, in European countries including Poland. The catastrophes affecting Europe and other countries during the last decades can be considered economy development barriers in the future [10,11,12,13]. Robust flood protection requires working out long-term strategies taking into account economic, social, and hydrological conditions in the region [14,15,16,17,18]. Billions of dollars were spent to cover flood losses in the last decade [19,20]. For this reason, robust real-time actions using existing hydro-infrastructure are needed to effectively reduce flood consequences [21,22]. Efficient decision support systems should permit analysis of weather forecasts as well as analysis of watershed outflow generation. Such a system should support determination of reservoir decision rules on the basis of all available information including reservoir capacity and current amount of water stored [23,24].
The impacts of climate change on hydrological alteration such as floods and drought pose a significant threat to floodplain environments [25,26,27]. Integrated water resources management (IWRM) is a practical approach which promotes responsible development and management of water and land resources considering the main parts of sustainability, i.e., economy, equity, and environment [28,29]. Adaptation of existing water infrastructure to climate change is becoming an important strategy for water management in floodplain areas. Karpack et al. [30] have suggested that humans have impacted on floodplain functionality by changing the physical landscape of floodplains and by altering river flows. A generally accepted solution used for flood protection is construction of reservoirs [31,32]. This study shows that the water infrastructure (weirs and dams) located in rivers could also be effectively used for water management including flood protection as well as for regulation and control of seasonal inundation at floodplain areas. Similar results have been obtained by Contreras et al. [33], who have shown that river flood manipulations by weirs and sluice gates provide water for agricultural activity without costly infrastructural and technical investigations.
Analysis of flood risk has become very important and is the basis for the EU Flood Directive that started to take effect from November 26th, 2007 [34]. The Directive obliges Poland as well as other EU countries to (1) assess the current flood hazard and flood risk stage, (2) work out the plans for flood risk reduction, and (3) prepare publicly available documents including this assessment and plans.
The assessment of flood hazard and risk is prepared in the form of maps presenting flood hazard and risk zones classified in some clearly defined way. The basic data used in the process of map preparation are digital terrain models (DTM) made on the basis of light detection and ranging (LiDAR) data. The maps were prepared with application of modern geographic information system (GIS) technologies. The GIS systems were used for visualization of the flood hazard spread. They also include tools enabling the analysis of flood risk and identification of possible catastrophes [35,36].
The dynamics of flows depend on many factors—channel geometry (depth, width, slope), riverbed material, sediment load and size, or bank vegetation [37,38,39]. One of the most extreme phenomena depending on the river flow stability are floods, which—if uncontained—can lead to material, economic, and society losses [40,41]. On the other hand, adequate flood control can be useful for agricultural purposes, especially after drought periods.
The main purpose of the presented study is to test and verify the elaborated concepts of dam management during flood, in the selected reach of the Noteć River in Poland. The reach analyzed is located between small navigational dams Pianówka–Mikołajewo–Rosko. There are a number of navigational dams with locks installed along the part of the river where the reach is located. The navigational dams enable a control of flood wave propagation along the channel as well as management of inundation areas in the terrain nearby the river. The purpose of flood control is the protection of these areas and the town of Czarnków located upstream. The main method used in the analyses is flood hazard map, prepared according to the rules defined in the EU Flood Directive. The existing maps developed for basic conditions without control of dams are compared with maps prepared for the conditions imposed by the control concepts applied

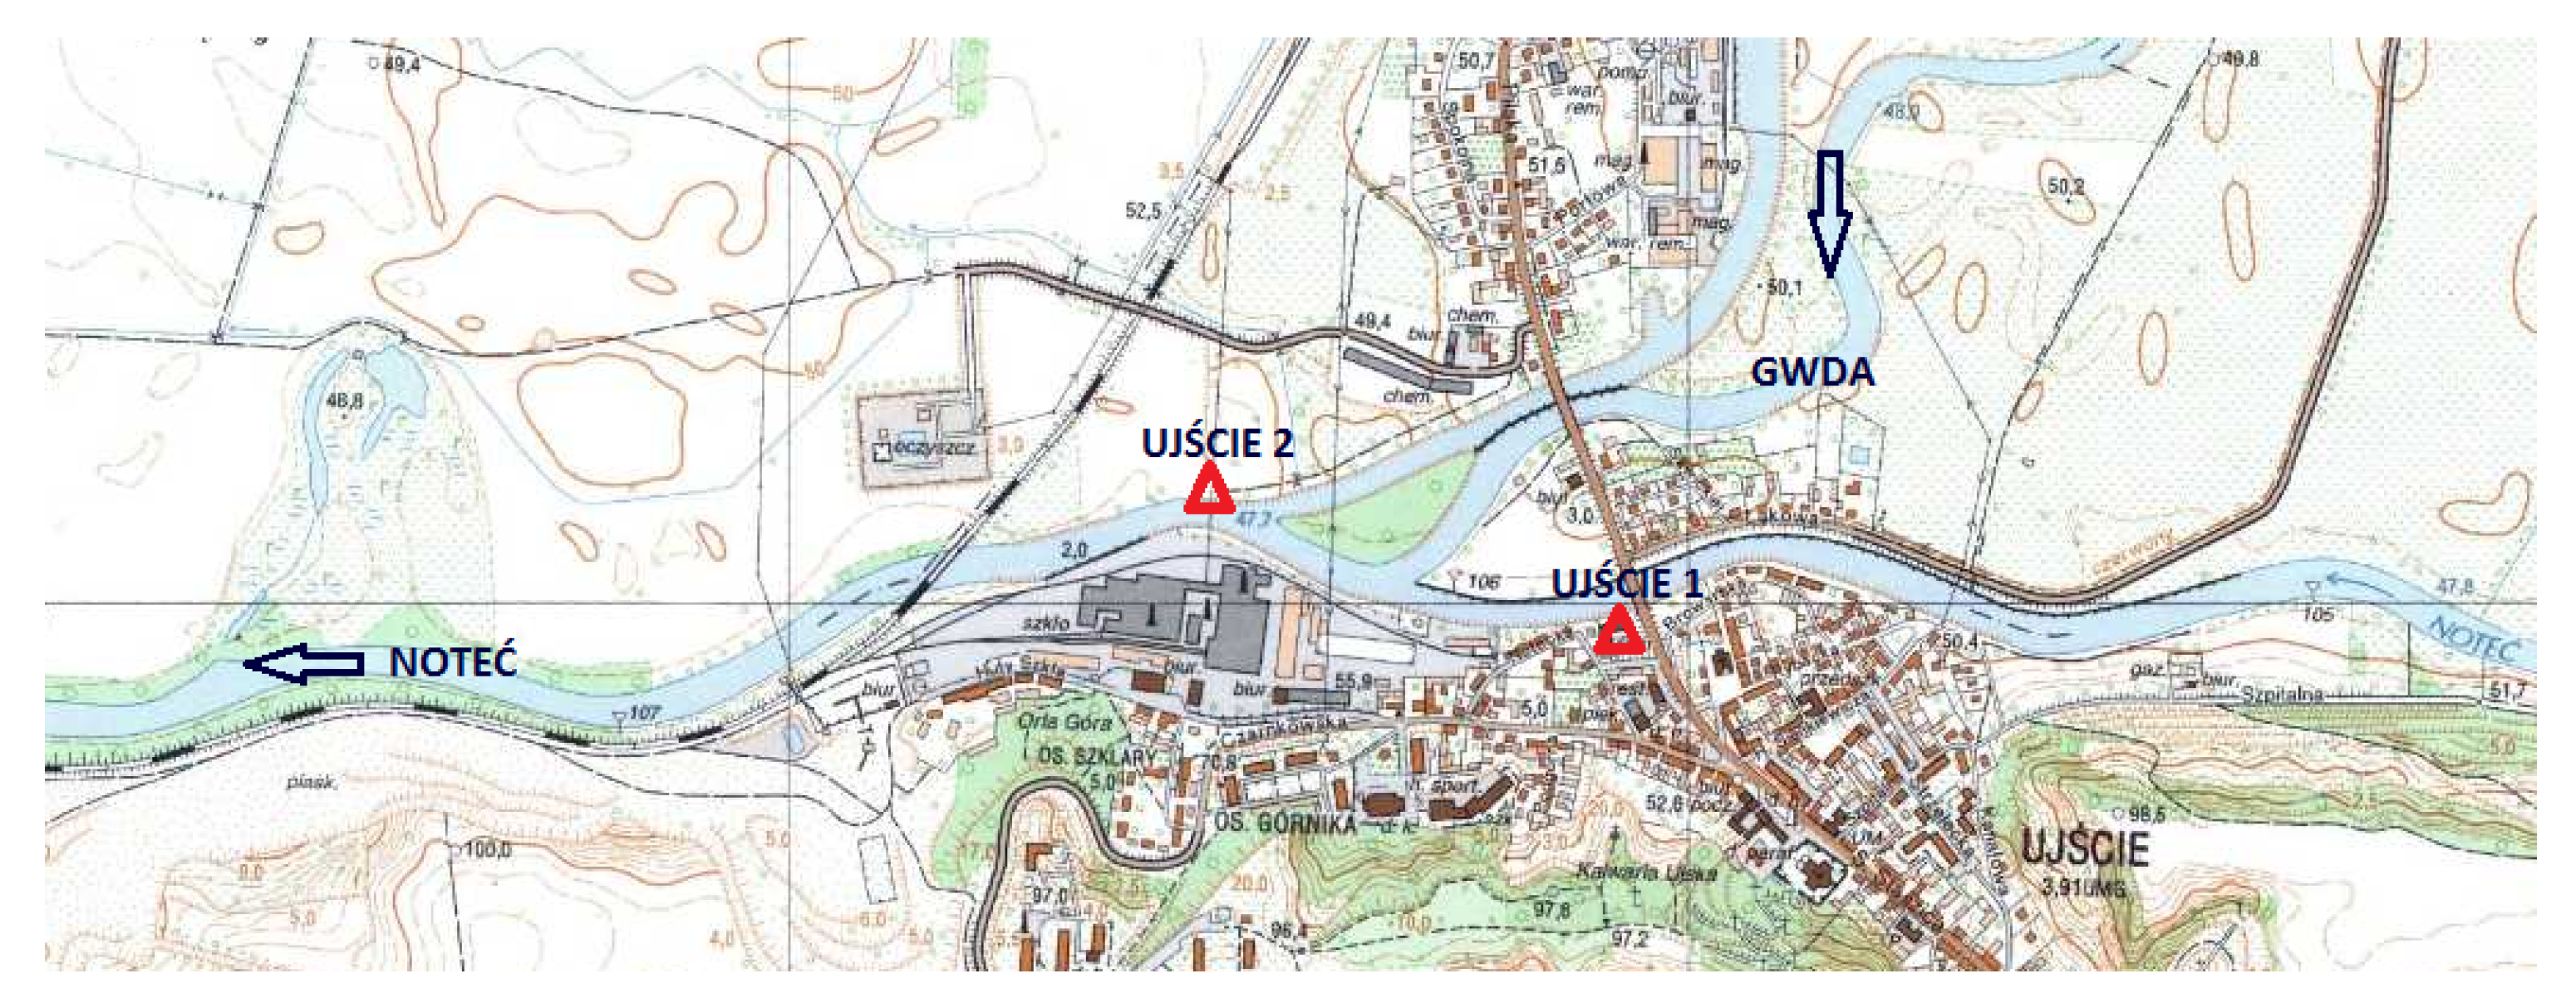
2. Chosen Study Site

The Noteć River is the longest tributary of the Warta River. The outlet of the Noteć is connected with the right bank of the Warta Channel. The springs of the Noteć are located in the Bardowskie and Modzerowskie lakes in the Kujawskie Lakeland. The river length is 361 km. It is lowland river with a catchment area of about 17,300 km2. The river is flowing through three Polish provinces, namely, Kujawsko-Pomorskie Voivodship, Wielkopolskie Voivodship, and Lubuskie Voivodship. There are two big tributaries of the Noteć. The first is the Gwda River, which connects the Noteć in the town of Ujście. The junction with the second, the Drawa River, is located in the Krzyz Wiekopolski [42]. There are two basic reaches of the river. The upstream part of the Noteć flows from springs to the town of Nakło. Its length is 174 km. The downstream part runs from Nakło to the mouth of the river in the junction with the Warta River. The length of the second part is 187 km. The downstream part flows in the glacial valley of the Warta River. It is also a part of the International Water Road E70. The course of E70 is trained with a number of local navigational dams including locks as well as fish passes.
Significantly varying slope of the river bottom is one of the criteria enabling classification of the river channel parts. Along the reach of 15 km from Nakło to the dam Gromadno, the slope of the bottom is about 0.29‰. From Gromadno to the greatest Noteć tributary, the Gwda River, the slope decreases to 0.016‰. The length of this part is about 50 km. Because the flow usually is very slow in this reach, it is called the Noteć Leniwa, which should be translated as the Lazy Noteć.
The junction of the Gwda and the Noteć is located in the town of Ujście (Figure 1, Figure 2). The watershed of the Noteć increases almost twice because of that. The discharge increases 2.5 times (Figure 3).
In the same time the slope of the bottom increases to about 0.2‰. Because the flow and flow velocity below the junction are greater, this reach is called the Noteć Bystra (Rapid Noteć). It is also the most trained part of the Noteć river. There are 11 navigational dams with locks. The dams stabilize the water surface elevation along the channel. Another name for this reach is the Noteć Skanalizowana, which is translated as Regulated Noteć. The end of this part is the navigational dam in the town of Krzyż. The length of this reach is 70.1 km.
From the Krzyż to the mouth of the river, the flow becomes slower, but the channel is still regulated. This part of the river is called Noteć Swobodnie Płynąca, which means Free Flowing Noteć. Figure 2 shows the location of selected Noteć River barrages on the reach from Ujście to Krzyż.
The reach chosen for testing the presented concepts is located between the navigational dams Pianówka–Mikołajewo–Rosko. This is part of the Noteć Bystra (Figure 2). The river valley in this region is very wide. Peat soils predominate in the area. The whole terrain is covered with drainage ditches, which dry the soils and make them useful for intensive agriculture. There are also oxbow lakes—left after the non-regulated time of the Noteć River. Upstream of the chosen reach there is the town of Czarnków with several factories. Two factories, the Steico and the Meblomor, have their buildings in the area near the Noteć Channel.

3. Materials and Methods
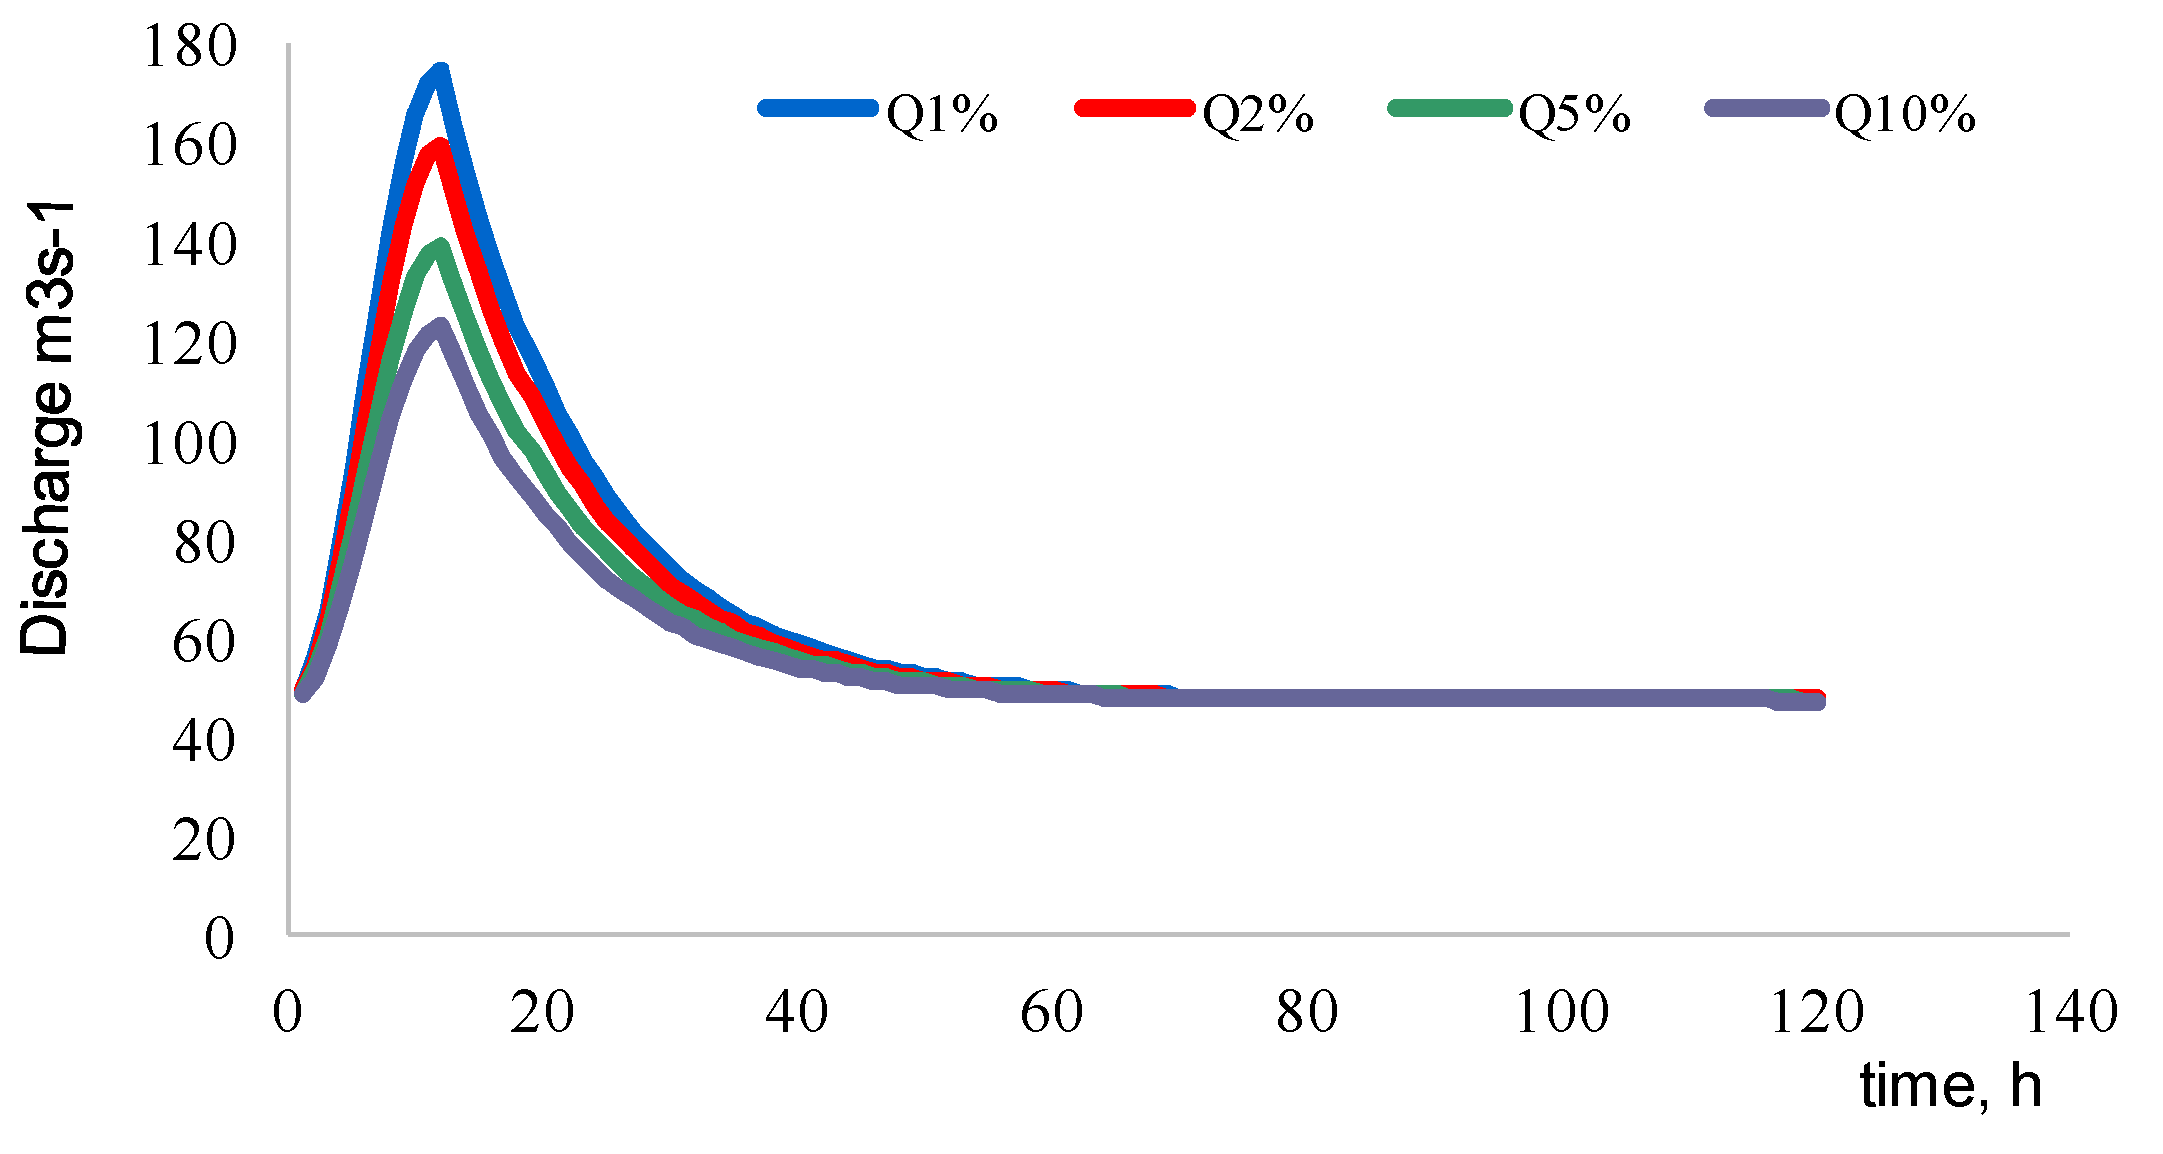
The analysis is based on six different types of data, including: (1) extreme flows, (2) measurements of river bathymetry, (3) guidelines for water management, (4) digital terrain models, (5) soil maps, and (6) specific information about hydraulic structures.
The extreme flows applied are determined on the basis of hydrological data observed and collected since 1970 in the Ujście-2 gauge station from the Institute of Meteorology and Water Management (IMGW—Polish: Instytut Meteorologii i Gospodarki Wodnej). This gauge station is located below the greatest tributary of the Noteć River called the Gwda River (Figure 1). The total watershed area of the Noteć above the Ujście-2 outlet equals 11,110 km2. The observations show that the flow magnitude varies from the total minimum of 13.20 m3s−1 (1992) to the total maximum of 146 m3s−1 (1981). The average flow is of about 47.39 m3s−1. The maximum values of the extreme flow hydrographs used in the presented test are as follows: 200.58 m3s-1 (p = 0.2%), 174.21 m3s−1 (p = 1%), and 122.92 m3s−1 (p = 10%) (Figure 3).
The measurements of the river bathymetry are available since 2012. These data were collected during the ISOK project (ISOK—Polish: Informatyczny System Osłony Kraju przed nadzwyczajnymi zagrożeniami, English: IT System of the Country’s Protection Against Extreme Hazards) (http://www.isok.gov.pl/en/) managed by the National Board for Water Management (KZGW—Polish: Krajowy Zarząd Gospodarki Wodnej) [43,44]. In the investigated reach 36 cross-sections were measured. The average distance between them was approximately 600 m. However, the distances between surveyed cross-sections are shorter near structures and may be even as close as 60 m. In such cases the maximum distance is 120 m (Figure 3).
The very useful sort of data are guidelines for water management for each small dam located in the investigated reach. These data were obtained from the local water authorities Regional Water Management Board Polish Water (RZGW, PGW WP—Polish: Regionalny Zarząd Gospodarki Wodnej, Państwowe Gospodarstwo Wodne Wody Polskie). They were analyzed and carefully applied. The most useful information taken from the guidelines are nominal water levels in the head water as well as dimensions of the weir crest and gates. The most important is the so-called normal head water (NPP—Polish: Normalny Poziom Piętrzenia). The values of NPP are applied further in the analyses presented. Normal head waters (NPP) at the three structures studied are Pianowka 40.28 m a.s.l.; Mikolajewo 38.12 m a.s.l.; Rosko 36.56 m a.s.l.
The set of data is completed with digital terrain models (DTM) obtained from the Main Centre of Geodetic and Cartographic Documentation (CODGiK—Polish: Centralny Ośrodek Dokumentacji Geodezyjnej i Kartograficznej). The DTM covers the whole Noteć river valley along the investigated reach. The area of the DTM is 7289.92 km2. The spatial resolution is 1x1 m. The vertical accuracy is about 0.15 m. The part of the studied DTM is presented in Figure 4.
The next set of data includes measurements of hydro-structures such as local weirs, sluice gates, dams, bridges, culverts, etc. All these data were collected during the ISOK project including the data describing the cross-sections. The formats of the data are ESRI shapefiles, sketches and photographs, as well as Excel worksheets (Figure 5).
The measurements included the location of structures and their basic dimensions, i.e., width, length, height, number of gates, dimensions of gates, etc. There are four structures along the analyzed reach: One bridge and three navigational dams. The average distance between structures is 5500 m. The average difference between the head and tail waters is about 1.5–2.0 m. The navigational dams consist of a weir with a few gates and a lock. The gates are controlled with basic sluices. At a few dams, small sized power plants are installed. The mentioned bridge is located in the town of Czarnków.
The last data are soil maps. Soil types in Noteć River flood areas were analyzed on the basis of agricultural soil maps in the scale 1:5000 provided by the Main Centre of Geodetic and Cartographic Documentation (CODGiK). In the first step, the agricultural soil maps were digitized from raster format into the ArcGIS 10.6 software. Next, the soil features were clipped to flooding extends for all analyzed variants using the ‘clip’ tool. In the last step, the areas occupied by particular soil types in Noteć River flood areas were calculated and dissolved using the ‘dissolve’ tool.
The data processing was focused on two important elements: (a) Preparation of geometric data, (b) preparation of hydrological data.
The measurements of the river bathymetry were used to generate the digital terrain model of the riverbed. This terrain model was inserted into the main DTM of the river valley. The cells of the bed terrain replaced the cells of missing riverbed data in the main DTM. A few kinds of basic GIS tools were applied for this purpose. The first was the specific ArcGIS plug-in called HEC-GeoRAS. The other tools were those available in the ArcToolbox of the ArcGIS software. The full DTM was used to generate the GIS layers necessary for flow modeling, e.g., river centerline, bank lines, 3D cross-sections, and flow paths. The model geometry was completed with measurements of the hydro-structures, i.e., the navigational dams with locks and the bridge.
The synthetic flood hydrographs are applied as the flood scenarios. They also play the role of the upstream boundary conditions in the flow model used. The synthetic flood hydrograph applied was based on the Reitz-Kreps formula [4] presented as Equation (1).
Q ( t ) = Q 0 + { ( Q m a x Q 0 ) sin 2 ( π t 2 t s ) t t s ( Q m a x Q 0 ) exp [ α ( t t s ) ] t t s
Two element formulae describes separately the rising and falling limbs of the flood wave. The common elements of the limbs are the baseflow Q0 and the flood magnitude Qmax. The other parameter was the time of culmination denoted as ts which is simply the length of the rising limb (Figure 6). The last element was the shape parameter of the falling limb α [45].
To properly fit the synthetic hydrograph to the real observations of the flood waves in the Ujście-2 gauge stations, the baseflow equal to the long term average flow SSQ = 47.39 m3s−1 was assumed (SSQ = average of annual average flows, Polish. Średni ze Średnich przepływów Q). The time of culmination was assumed as ts = 12 h and the shape parameter of the falling limb was α = 0.09. There were three maximum flows tested Qmax:Q10% = 122.92 m3s−1, Q1% = 174.21 m3s−1, and Q0.2% = 200.58 m3s−1. The simulations are terminated arbitrarily after 120 h (Figure 5).
Simulation of the unsteady flow was made using the model prepared in the HEC-RAS 5.0.3 package. The program includes a number of computational modules that enable simulation of flow and processes occurring in rivers, e.g., sediment transport, water quality changes. The presented analyses use the unsteady flow module. This algorithm allows analysis of time-varying longitudinal flows in the network of irregular open channels with floodplains. The basis of the methodology applied is the numerical solution of the St. Venant equations [46,47,48]. The system of St. Venant equations consists of two partial differential equations shown below.
A t + ( ϕ Q ) x c + [ ( 1 ϕ ) Q ] x f = 0
Q t + x c ( ϕ 2 Q 2 A c ) + x f [ ( 1 ϕ ) 2 Q 2 A f ] + g A c ( H x c + S f c ) + g A f ( H x f + S f f ) = 0
Equations (2) and (3) represent mass balance and momentum balance principles for flow in the open channel assuming that the conditions are gradually-varying. The time t and distance x play the role of independent variables. However, the distance is considered in a more complex way. There are separate distances measured along the channel xc and along the floodplains xf. The dependent variables are total discharge Q and water surface elevation H. Such elements as total cross-section area A, cross-section area of the main channel Ac, and cross-section area of the floodplains Af are functions of cross-section shape and the water surface elevation H. The hydraulic slopes describing the friction losses along the channel and along the floodplains are denoted as Sfc and Sff. These are function of local characteristics such as roughness and cross-section shape, but they also depend on Q and H. The coefficient ϕ is the ratio of discharge in the main channel and total discharge Q. Hence, ϕ·Q is the flow along the channel and (1−ϕ)·Q is the flow along the floodplains. The coefficient ϕ depends on the water surface elevation H and other elements of the cross-section, such as shape and roughness. g is acceleration of gravity and the standard value of this constant is 9.81 ms−2.
The detailed course of the river, banks, floodplain, and embankment routes was determined on the basis of the DTM. During this process, the orthophoto maps and topographic maps available through Geoportal-2 (https://www.geoportal.gov.pl/) were also applied. The prepared model consists of 35 cross-sections read from DTM, 237 interpolated cross-sections, three so-called inline structures modeling navigational dams, and one bridge. The average distance between the cross-sections read from DTM was about 500 m. After interpolation, the distance between computational cross-sections did not exceed 100 m. Near the structures, the location of cross-sections was densified and an average distance between them was about 50 m. The construction of all modeled structures is very similar. They consist of a three-span weir. It was assumed that the locks were not used during the flood. They belong to non-flow structures, hence they were not included in the model.
Calibration and validation of the hydrodynamic model for this reach are rather problematic. The closest upstream and downstream gauge stations are the Ujście and the Drawsko, respectively. These are located relatively far away from the investigated area. The number of structures between these two gauge stations actively impacts the transformation of flood waves along the channel and the floodplains. Although historical data for calibration may be collected, the operation of the weirs in the past is not known. Hence, the available data for typical calibration are incomplete.
The flood hazard zones were determined for the analyzed reach during the implementation of the EU Flood Directive [34]. The MIKE11 software developed by DHI (Danish Hydraulic Institute) was applied [49]. According to our knowledge, the model was calibrated only locally, but the flood flows were simulated along the entire Noteć River. Then the ArcGIS was applied to transform the results of the hydrodynamic simulation to spatially spreading inundation zones and depth maps. Such methodology differs from the method applied here. The main differences between HEC-RAS and MIKE11 include the form of the St. Venant equations, the numerical method applied, and the implementation of hydro-structures such as bridges and weirs [46,49]. Additionally, the method of flood zone generation from 1D results of flow simulation may also be different. However, the scarcity of data and difficulty of the problem lead to the conclusions that the previous results available as flood hazard maps [50] could be the proper reference for validation of the model.
For the above reasons, roughness coefficients of the bed and floodplains were estimated on the basis of available photographs. For the riverbed, the value of 0.030 sm-1/3 is applied. It is assumed the roughness of floodplains equals 0.040 sm-1/3. In selected cross-sections, the so-called ineffective flow areas were determined. In most cases, these are inlet cross-sections of the modeled dams. In the case of the bridge, the ineffective flow areas are determined in the upstream and downstream cross-sections.
To run the simulation, the initial and boundary conditions were imposed. The initial one was the reconstructed water surface profile for the base flow Q0 in the synthetic flood hydrograph in Equation (1). These initial values of hydraulic variables, such as H, A, etc., along the channel were determined under the assumption of the steady flow, i.e., constant discharge along the channel reach. The boundary conditions included the upstream (inflow) and downstream (outflow) conditions. The synthetic hydrographs representing selected flood scenarios were applied as inflow conditions. In the downstream end of the channel the free outflow condition was imposed in the form of the Manning equation for normal flow. The slope of the bottom in the downstream cross-section was 0.17‰. Three scenarios of flow hydrographs were tested for the flood waves representing Q10%, Q1%, and Q0.2% (Figure 7). It is possible to extend the developed method for the flows with different return periods. However, the first approach presented here is limited to the design flows applied in EU Flood Directive.
Five variants of strategies for the structures control were tested (Table 1). The main focus was on the role of the initial opening of the weir gates as well as the control of gate opening during flood. The variants are presented and explained in Table 1. They are denoted with Roman digits as I, II, III, IV, and V. Variant I assumes/refers to the conditions applied in the ISOK project, with all gates opened during the flood propagation and maximum opening height applied. These maximum openings equal 5.0 m in the Pianowka dam, 5.8 m in the Mikolajewo dam, and 5.9 m in the Rosko dam. These settings were applied using T.S. gate opening configured with the above-mentioned constant openings (T.S. = time series). Variant II was prepared using option elevation controlled gates. It starts with the initial gate opening. When water level assumed as 10 cm above normal head water (NPP) is achieved, gates begin to open to the maximum value of gate opening until the water level drops 50 cm below value of NPP. Then the opening is reduced to initial value. The values of initial gate openings were designed during steady flow simulations, assuming that the normal head water should be achieved for baseflow Q0. In Variant III, settings for structure Pianowka and Rosko are the same as in Variant II, but for structure Mikolajewo values of initial gate opening and water levels for gate opening and close are changed (Table 1). In Variant IV the structures Pianowka and Mikolajewo work in the same way as in Variant II, but the parameters of gate opening for the structures at Rosko are higher. The last variant (V) assumes higher damming at the structures Mikolajewo and Rosko, while the parameters at the structure Pianowka remain the same as in Variant II.

4. Results

The results of the model validation are presented first. The flood hazard zones constructed on the basis of data that are also available at the ISOK project web page [50] were compared with flood hazard zones simulated in Variant I. These comparisons are summarized in Table 2. The referenced area for each flood flow including Q10%, Q1%, and Q0.2% is calculated for the results obtained in the implementation of the EU Flood Directive. The areas subtracted represent regions that are denoted as inundated in the referenced results, but these were not inundated in Variant I. The added regions are those areas that are inundated in Variant I, but not inundated in referenced results. The part of the referenced area in percentage is determined for regions subtracted and added. This measure shows the compatibility of the obtained results with referenced results officially available as flood hazard zones [50]. The simplified example of flood zones overlay is presented in Figure 8. The results shown there were calculated for flood flow Q1%. As may be seen, the subtracted and added areas are not continuous. For these reasons the maximum area denoted for such regions is also provided in Table 2.
As it may be noticed, the flood hazard zones determined in Variant I are rather smaller than referenced results. The added areas are rather small. The subtracted regions are about 20% of the total zones. This means that compatibility is about 70%–80%. It is not perfect, but the apparent inconsistency may be easily explained with the differences between applied methodologies mentioned earlier. Taking into account the scarcity of available data and uncertainty of the referenced results, such compatibility has to be acceptable.
As mentioned above, two aspects of the applied strategies were analyzed, (1) flood protection and (2) reconstruction of seasonal inundation of areas surrounding the selected reach of the Noteć Bystra River. The presentation of results follows this classification. Figure 9 and Figure 10 present the basic graphs of flood wave propagation. The first of them shows the flow hydrographs calculated for the outlet cross-section. Each single graph represents the results for a single flood wave with cumulative flows equal to Q10%, Q1%, and Q0.2%. In a single graph we may see the outflow hydrograph for each scenario tested. The results obtained for Variant I are denoted with dark blue and continuous line. The results obtained for Variant II are marked in dark red. In each case, i.e., for the flood wave with Q10%, Q1%, and Q0.2%, the difference between these two scenarios is only the temporal shift of the peak of flow. The magnitude of the maximum flow is not reduced by application of Variant II control rules. It is even slightly greater. The results obtained for the other variants III, IV, and V are more promising. They are marked with continuous lines in green, violet, and light blue, respectively. The reductions of maximum flows obtained in these cases are also marked. In general, the scenarios with water retention and controlled inundation of the surrounding areas gave better reduction of the flow peak in the outlet.
Figure 10 presents the maximum water surface elevations and related depths along the river. These two graphs are composed of the results of simulation for 1% flood. The colors used for marking the results of particular variants are the same as those applied in Figure 9. The additional lines represent the bottom (black line) and the structures, weirs, and the bridge (orange vertical lines). Significant differences between the elevations and depths are seen in the reaches between Mikolajewo and Rosko as well as between Pianowka and Mikolajewo. The differences are the effect of the control rules applied (Table 1) and they affect the next results presented in Figure 11.
Figure 11 presents a comparison of inundation areas. These results were obtained for the simulation of 0.2% flood. The reference flood hazard zone is the one obtained in Variant I. This zone is marked in all parts of Figure 11 as the blue area. In the following maps the results of Variants II (part a), III (part c), IV (part d), and V (part e) are compared with the reference one. The colors of the lines surrounding the inundation areas are the same as previously used for each variant. Variant II gives the same or even greater inundation area than that obtained for Variant I. The other variants significantly reduce the inundation below the Rosko, but the extents of flooding upstream are greater.
The total inundation areas for each variant and each simulated flood are shown in Table 3. It is clearly seen that application of Variant II does not reduce the flooding. The other variants may also increase the total inundation area, but the important factor is the “shift” of inundation from the area protected downstream of the reach, to the terrain dedicated for seasonally flooding. This effect is seen in Figure 11.
The results of seasonal inundation are presented in Figure 11 and Table 4, Table 5 and Table 6 in the forms of maps and values describing the inundation of different soil types. Figure 11 includes five maps where the inundation zones for 0.2% flood are used to clip the vector maps of different soil types. Each map is constructed for a single variant. The soils are marked with different colors and denoted with proper symbols in the legend of Figure 12.
A comparison of flooded areas obtained as results of simulations for Variant I, with ISOK flood hazard maps is shown in Figure 9, Figure 10 and Figure 11. The flooded areas generated as a result of calculations are slightly smaller when compared to the ISOK maps. The calculations made for Variants II, III, and IV allowed a comparison of the ranges of reservoirs determined in various water stages. Figure 11 contains a comparison of flooded areas for the flow with a probability of occurrence p = 1%, while Figure 9 presents the same elements for p = 10%. On both maps, the range of the lagoon for Variant III ends near the Mikołajewo dam, where water has been simulated to flood the adjacent areas. In case of damming up on the Rosko water stage (Variant IV), the area of the lagoon is slightly larger compared to that based on the calculations made for Variant II (damming water on the NPP structures). The smallest width of flooding adjacent areas on both maps were obtained for Variant II.
On the basis of the flood wave simulation, water elevation was determined. Longitudinal profiles for Variants I and III are presented in Figure 11. In both profiles the difference between the water level ordinates for given flows is small and ranges from 8 to 26 cm. Figure 11 shows the free flow of water through individual gates of the dams. It is different in the longitudinal profile for Variant III, in which damming up takes place at all water stages.
Recent literature has been concerned with the relations between the economical or technical purposes and the environmental effects. An example of very general approach might be the paper by Shah et al. [51], who tested flood risk strategies and assessed them taking into account effectiveness and sustainability. Another interesting work is that by Alho and Silva [52], concerned with the impact of seasonal flooding on animals living in the wetlands. Even drainage systems are constructed considering sustainability requirements, e.g., Vilcan and Potter [53]. The works even closer to our research, but still quite general, are the papers by Mosner et al. [26] and Brotherton et al. [27]. In both these papers, the influence of climate change on the vegetation growing in floodplains is analyzed. In the first of them the case study is the Rhine River in Germany, in the second the Amberley Wilbrooks in southern England. However, the water supply systems in urban areas are analyzed considering sustainable development and ecological issues, e.g., Ma et al. [54]. The ideas presented in the above papers are similar to the approach applied in our study. However, in contrast to the above-mentioned papers, we also considered the linkage between flood control and seasonal soil inundation. In the system analyzed in our study, the reconstruction of natural water supply to the soils along the river contributes to sustainable development of the entire river valley.
The linkage between flood control and ecological protection is relatively difficult. For a long time these two approaches have followed contrasting priorities. In the past, the flood protection based on dikes and dammed reservoirs inevitably destroyed water conditions in river valleys. However, the approaches applied today are focused on linking these two contradicting points of view on environment functioning. In recent literature the solutions proposed are aimed at assessment or planning of flood control strategies satisfying sustainability, e.g., Lumbroso et al. [55], Meight and Barlett [56], Mishra et al. [57]. More specific research is conducted when such hydro-structures as dams and weirs are considered to be important elements of the water system, e.g., Gao et al. [58], Chen et al. [59]. This is also the idea behind the presented research. The linkage between flood control and sustainable development considering environmental issues is not only possible, but it is necessary.
However, in the presented case, the planning of a flood-protection system or assessment of its functioning is not the main aim. In our work the sophisticated methods of geoprocessing and hydrodynamic simulations are applied to develop control strategies for the existing system of weirs located along a single channel reach. Such an approach should enable effective use of hydro-structure abilities constructed for other purposes in the area of ecological prevention. Similar examples may be found in the papers by Dittman et al. [60] as well as Gogoase Nistoran et al. [61]. In the first of them the runoff model with an algorithm of multi-objective evolution strategy is applied to control the system of reservoirs in the Weisseritz River Basin, Germany. The results obtained show that it is possible to effectively save the water for future use by minimizing flood damage and risk of dam overtopping. Gogoase Nistoran et al. [61] have applied the HEC-RAS model to control the weirs in the Dambovita River, Romania. The purpose of control is flood protection, but additional care is taken about environmental issues. For this river it is shown that flood control infrastructure may be applied for prevention from or reduction of both undesired phenomena: Flood inundation and conditions threatening biota life. In the presented case of the Noteć River, it is shown that flood control can be effectively linked with the reconstruction of seasonal inundation of peat soils to avoid their degradation.

5. Conclusions

The potential influence of the Noteć River on the surrounding areas has been analyzed by hydrodynamic simulation supported with GIS tools. Flood hazard maps and longitudinal profiles of the water surface were determined for the analyzed section of the Noteć Bystra. The inline structures, such as weirs and navigational dams, could be effectively used to control flood wave propagation as well as to reconstruct seasonal inundation. Such promising results were obtained because the opening and closing of the gates was assumed to be controlled by the arrival of the flood wave. As evidenced by our calculations, the proper approach enabled reduction of the culmination of the flood wave, forcing the flood in the selected place, reduction of the total flood risk coverage and thus led to a significant reduction of flood risk.
It is worth noting that the main purpose of the paper has been achieved. The proposed concepts of dam management during flood were positively verified for the selected reach of the Noteć River in Poland. The presented variants proved that it is possible to control the flood propagation and take care about the environmental issues. In this case, the applied approach enabled reconstruction of the seasonal inundation of soils in the terrain along the river reach.
The presented approach opens some new possibilities. Promising results obtained here motivate the search for more effective methods, e.g., automatic control of gates opening with some optimization method. Although, such approaches were applied for flood control in the past, these methods were rarely used to manage flood propagation taking into account the environmental issues. However, it seems to be possible.

Author Contributions

Conceptualization, J.W.-D.; methodology, J.W.-D., E.S., T.D.; investigation E.S., J.W.-D., J.J.; software E.S.; visualization J.J., M.R.; writing—original draft preparation, J.W.-D., E.S., T.D., J.J. and M.R.; writing—reviewing and editing J.W.-D., T.D.; supervision J.W.-D., T.D.; all authors have read and agreed to the published version of the manuscript.

Funding

This research received no external funding.

Acknowledgments

This research would not be possible without the access to the data provided by such institutions as IMGW, CODGiK, RZGW, and GUGiK. The access to the free data available in the Internet, such as Geoportal 2, was also very helpful.

Conflicts of Interest

The authors declare no conflict of interest.

References

  1. Alfieri, L.; Feyen, L.; Di Baldassarre, G. Increasing flood risk under climate change: A pan-European assessment of the benefits of four adaptation strategies. Clim. Chang. 2016, 136, 507–521. [Google Scholar] [CrossRef] [Green Version]
  2. Arnell, N.W.; Gosling, S.N. The impacts of climate change on river flood risk at the global scale. Clim. Chang. 2016, 134, 387–401. [Google Scholar] [CrossRef] [Green Version]
  3. Jongman, B.; Hochrainer-Stigler, S.; Feyen, L.; Aerts, J.C.; Mechler, R.; Botzen, W.W.; Ward, P.J. Increasing stress on disaster-risk finance due to large floods. Nat. Clim. Chang. 2014, 4, 264–268. [Google Scholar] [CrossRef]
  4. Sun, P.; Wen, Q.; Zhang, Q.; Singh, V.P.; Sun, Y.; Li, J. Nonstationary evaluation of flood frequency and flood risk in the Huai River basin, China. J. Hydrol. 2018, 567, 393–404. [Google Scholar] [CrossRef]
  5. Lee, E.H.; Kim, J.H. Development of a flood-damage-based flood forecasting technique. J. Hydrol. 2018, 563, 181–194. [Google Scholar] [CrossRef]
  6. Cammerer, H.; Thieken, A.H.; Verburg, P.H. Spatio-temporal dynamics in the flood exposure due to land use changes in the alpine Lech valley in Tyrol (Austria). Nat. Hazards 2013, 68, 1243–1270. [Google Scholar] [CrossRef]
  7. Mustafa, A.; Bruwier, M.; Archambeau, P.; Erpicum, S.; Pirotton, M.; Dewals, B.; Teller, J. Effects of spatial planning on future flood risks in urban environments. J. Environ. Manag. 2018, 225, 193–204. [Google Scholar] [CrossRef]
  8. Poelmans, L.; Rompaey, A.V.; Ntegeka, V.; Willems, P. The relative impact of climate change and urban expansion on peak flows: A case study in central Belgium. Hydrol. Process. 2011, 25, 2846–2858. [Google Scholar] [CrossRef]
  9. Zhang, Q.; Gu, X.; Singh, V.P.; Xu, C.Y.; Kong, D.; Xiao, M.; Chen, X. Homogenization of precipitation and flow regimes across China: Changing properties, causes and implications. J. Hydrol. 2015, 530, 462–475. [Google Scholar] [CrossRef]
  10. Kreibich, H.; Bubeck, P. Natural Hazards: Direct Costs and Losses Due to the Disruption of Production Processes; United Nations Office for Disaster Risk Reduction: Geneva, Switzerland, 2013. [Google Scholar]
  11. Escuder-Bueno, I.; Castillo-Rodríguez, J.T.; Zechner, S.; Jöbstl, C.; Perales-Momparler, S.; Petaccia, G. A quantitative flood risk analysis methodology for urban areas with integration of social research data. Nat. Hazards Earth Syst. Sci. 2012, 12, 2843–2863. [Google Scholar] [CrossRef]
  12. Arghiuș, V.; Ozunu, A.; Samara, I.; Roșian, G. Results of the post flash-flood disaster investigations in the transylvanian depression (Romania) during the last decade (2001–2010). Nat. Hazards Earth Syst. Sci. 2014, 14, 535–544. [Google Scholar] [CrossRef] [Green Version]
  13. Wang, Q.; Wu, J.; Lei, T.; He, B.; Wu, Z.; Liu, M.; Liu, D. Temporal-spatial characteristics of severe drought events and their impact on agriculture on a global scale. Quat. Int. 2014, 349, 10–21. [Google Scholar] [CrossRef]
  14. Bachoc, A.; Thepot, R.; Merillon, Y.; Lefevre, J.; Camp’huis, N.G. A global strategy for reducing flood risks in the medium Loire valley. Houille Blanche 2000, 83–89. [Google Scholar] [CrossRef] [Green Version]
  15. Viljoen, M.F.; Du Plessis, L.A.; Booysen, H.J. Extending flood damage assessment methodology to include sociological and environmental dimensions. Water Sa 2001, 27, 517–522. [Google Scholar] [CrossRef] [Green Version]
  16. Xia, J.; Huang, G.H.; Chen, Z.; Rong, X. An integrated planning framework for managing flood-endangered regions in the Yangtze River Basin. Water Int. 2001, 26, 153–161. [Google Scholar] [CrossRef]
  17. Plate, E.J. Management strategies for the development of the upper Rhine. Water Int. 2000, 26, 51–61. [Google Scholar]
  18. Albano, R.; Crăciun, I.; Mancusi, L.; Sole, A.; Ozunu, A. Flood damage assessment and uncertainty analysis: The case study of 2006 flood in Ilisua basin in Romania. Carpathian J. Earth Environ. Sci. 2017, 12, 335–346. [Google Scholar]
  19. Barredo, J.I. Major flood disasters in Europe: 1950–2005. Nat. Hazards Earth Syst. Sci. 2006, 42, 125–148. [Google Scholar] [CrossRef]
  20. Messner, F.; PennningRowsell, E.C.; Green, C.; Meyer, V.; Tunstall, S.M.; Van der Veen, A. Evaluating Flood Damages: Guidance and Recommendations on Principles and Methods. Available online: http://www.floodsite.net/ (accessed on 17 March 2020).
  21. Agthe, D.E.; Billings, R.B.; Ince, S. Integrating market solutions into government flood control policies. Water Resour. Manag. 2000, 14, 247–256. [Google Scholar] [CrossRef]
  22. Shim, K.C.; Fontane, D.G.; Labadie, J.W. Spatial decision support system for integrated river basin flood control. J. Water Resour. Plan. Manag. 2002, 128, 190–201. [Google Scholar] [CrossRef]
  23. Cheng, C.; Chau, K.W. Fuzzy iteration methodology for reservoir flood control operation. J. Am. Water Resour. Assoc. 2001, 37, 1381–1388. [Google Scholar] [CrossRef]
  24. Cheng, C.; Chau, K.W. Three-person multi-objective conflict decision in reservoir flood control. Eur. J. Oper. Res. 2002, 142, 625–631. [Google Scholar]
  25. Sojka, M.; Jaskuła, J.; Wicher-Dysarz, J.; Dysarz, T. Analysis of selected reservoirs functioning in the Wielkopolska region. Acta Sci. Pol. Form. Circumiectus 2017, 16, 205. [Google Scholar] [CrossRef]
  26. Mosner, E.; Weber, A.; Carambia, M.; Nilson, E.; Schmitz, U.; Zelle, B.; Horchler, P. Climate change and floodplain vegetation—Future prospects for riparian habitat availability along the Rhine River. Ecol. Eng. 2015, 82, 493–511. [Google Scholar] [CrossRef]
  27. Brotherton, S.J.; Joyce, C.B.; Berg, M.J.; Awcock, G.J. Immediate and lag effects of hydrological change on floodplain grassland plants. Plant Ecol. 2019, 220, 345–359. [Google Scholar] [CrossRef]
  28. Giupponi, C.; Gain, A.K. Integrated spatial assessment of the water, energy and food dimensions of the sustainable development goals. Reg. Environ. Chang. 2017, 17, 1881–1893. [Google Scholar] [CrossRef]
  29. Gain, A.; Mondal, M.; Rahman, R. From flood control to water management: A journey of Bangladesh towards integrated water resources management. Water 2017, 9, 55. [Google Scholar] [CrossRef] [Green Version]
  30. Karpack, M.N.; Morrison, R.R.; McManamay, R.A. Quantitative assessment of floodplain functionality using an index of integrity. Ecol. Indic. 2020, 111, 106051. [Google Scholar] [CrossRef] [Green Version]
  31. Dąbrowska, J.; Kaczmarek, H.; Markowska, J.; Tyszkowski, S.; Kempa, O.; Gałęza, M.; Kucharczyk-Moryl, E.; Moryl, A. Shore zone in protection of water quality in agricultural landscape—The Mściwojów Reservoir, southwestern Poland. Environ. Monit. Assess. 2016, 188, 467. [Google Scholar] [CrossRef]
  32. Jaskuła, J.; Sojka, M.; Wicher-Dysarz, J. Analysis of selected physicochemical parameters and degradation process assessment in a two-stage reservoir jezioro kowalskie using field and remote sensing data. Annu. Set Environ. Prot. 2019, 21, 439–455. [Google Scholar]
  33. Contreras, D.A.; Robin, V.; Gonda, R.; Hodara, R.; Dal Corso, M.; Makarewicz, C. (Before and) After the Flood: A multiproxy approach to past floodplain usage in the middle Wadi el-Hasa, Jordan. J. Arid Environ. 2014, 110, 30–43. [Google Scholar] [CrossRef]
  34. The European Parliament and the Council of the European Union. Directive 2007/60/EC of the European Parliament and the Council of 23 October 2007 on the Assessment and Management of Flood Risks. Available online: https://eur-lex.europa.eu/legal-content/EN/TXT/?uri=CELEX:32007L0060 (accessed on 5 June 2015).
  35. Dysarz, T.; Wicher-Dysarz, J.; Sojka, M. Assessment of the impact of new investments on flood hazard-study case: The bridge on the Warta River near wronki. Water 2015, 7, 5752–5767. [Google Scholar] [CrossRef] [Green Version]
  36. Wu, Y.; Zhong, P.; Zhang, Y.; Xu, B.; Ma, B.; Yan, K. Integrated flood risk assessment and zonation method: A case study in Huaihe River basin, China. Nat. Hazards 2015, 78, 635–651. [Google Scholar] [CrossRef]
  37. Brierley, G.J.; Fryirs, K.A. Geomorphology and River Management: Applications of the River Styles Framework; John Wiley & Sons: Hoboken, NJ, USA, 2013. [Google Scholar]
  38. Gurnell, A.M.; Grabowski, R.C. Vegetation–hydrogeomorphology interactions in a low energy, human impacted river. River Res. Appl. 2016, 32, 202–215. [Google Scholar] [CrossRef]
  39. Kujanová, K.; Matoušková, M.; Hošek, Z. The relationship between river types and land cover in riparian zones. Limnologica 2018, 71, 29–43. [Google Scholar] [CrossRef]
  40. Hu, P.; Zhang, Q.; Shi, P.; Chen, B.; Fang, J. Flood-induced mortality across the globe: Spatiotemporal pattern and influencing factors. Sci. Total Environ. 2018, 643, 171–182. [Google Scholar] [CrossRef]
  41. Zischg, A.P.; Hofer, P.; Mosimann, M.; Röthlisberger, V.; Ramirez, J.A.; Keiler, M.; Weingartner, R. Flood risk (d) evolution: Disentangling key drivers of flood risk change with a retro-model experiment. Sci. Total Environ. 2018, 639, 195–207. [Google Scholar] [CrossRef]
  42. Płaczek, J.; Dysarz, T.; Wicher-Dysarz, J. Analysis of selected dams operation in the reach of the NotećNoteć Bystra during the flood hazard conditions. Acta. Sci. Pol. Form. Circumiectus 2016, 15, 295–307. (In Polish) [Google Scholar]
  43. Krajowy Zarząd Gospodarki Wodnej. ISOK Project. Cross-Sections Measured for Implementation of EU Flood Directive. Available online: http://www.isok.gov.pl/pl (accessed on 9 March 2020). (In Polish)
  44. IMGW O/Kraków. Metodyka opracowania planów zarządzania ryzykiem powodziowym dla obszarów dorzeczy i regionów wodnych; KZGW: Warszawa, Poland, 2013. (In Polish) [Google Scholar]
  45. Reitz, W.; Kreps, H. Näherungsverfahren zur Berechnung des erforderlichen Struraumes für Zwecke des Hochwasserschutzes; Deutsche Wasserwirtschaft: Hennef, Germany, 1945. [Google Scholar]
  46. Brunner, G. HEC-RAS River Analysis System. Available online: https://www.hec.usace.army.mil/software/hec-ras/documentation/HEC-RAS%205.0%20Reference%20Manual.pdf (accessed on 17 March 2020).
  47. Dysarz, T. Basic of river flow modeling. In Open Channel Hydraulics. River Hydraulics Structures and Fluvial Geomorphology; Radecki-Pawlik, A., Hradecky, J., Pagliara, S., Hendrickson, E., Eds.; Taylor & Francis Group: Abingdon, UK, 2017; pp. 168–180. [Google Scholar]
  48. Dysarz, T. Development of RiverBox—An ArcGIS toolbox for river bathymetry reconstruction. Water 2018, 10, 1382. [Google Scholar] [CrossRef] [Green Version]
  49. DHI. MIKE 11—A Modeling System for Rivers and Channels User Guide, DHI Software. 2017. Available online: https://manuals.mikepoweredbydhi.help/2017/Water_Resources/MIKE11_UserManual.pdf (accessed on 17 March 2020 ).
  50. ISOK. IT System of the Country’s Protection against Extreme Hazards. 2015. Available online: http://www.isok.gov.pl/en/ (accessed on 10 June 2015).
  51. Shah, M.A.R.; Rahman, A.; Chowdhury, S.H. Challenges for achieving sustainable flood risk management. J. Flood Risk Manag. 2018, 11, S352–S358. [Google Scholar] [CrossRef] [Green Version]
  52. Alho, C.J.R.; Silva, J.S.V. Effects of severe floods and droughts on wildlife of the pantanal wetland (Brazil)—A review. Animals 2012, 2, 591–610. [Google Scholar] [CrossRef] [PubMed] [Green Version]
  53. Vilcan, T.; Potter, K. Delivering sustainable drainage systems through the English planning system: A proposed case of institutional void. J. Flood Risk Manag. 2020, 13, e12591. [Google Scholar] [CrossRef]
  54. Ma, X.; Xue, X.; González-Mejía, A.; Jay Garland, J.; Cashdollar, J. Sustainable water systems for the city of tomorrow—A conceptual framework. Sustainability 2015, 7, 12071–12105. [Google Scholar] [CrossRef] [Green Version]
  55. Lumbroso, D.; Ramsbottom, D.; Spaliveiro, M. Sustainable flood risk management strategies to reduce rural communities’ vulnerability to flooding in Mozambique. J. Flood Risk Manag. 2008, 1, 34–42. [Google Scholar] [CrossRef]
  56. Meigh, J.D.; Bartlett, J.M. Integrated river basin management in Southeast Asia. J. Flood Risk Manag. 2010, 3, 201–209. [Google Scholar] [CrossRef]
  57. Mishra, B.K.; Rafiei Emam, A.; Masago, Y.; Kumar, P.; Regmi, R.K.; Fukushi, K. Assessment of future flood inundations under climate and land use change scenarios in the Ciliwung River Basin, Jakarta. J. Flood Risk Manag. 2018, 11, S1105–S1115. [Google Scholar] [CrossRef]
  58. Gao, C.; Liu, J.; Wang, Z. An ecological flood control system in Phoenix Island of Huzhou, China: A case study. Water 2013, 5, 1457–1471. [Google Scholar] [CrossRef] [Green Version]
  59. Chen, A.; Wu, M.; McClain, M.E. Classifying dams for environmental flow implementation in China. Sustainability 2020, 12, 107. [Google Scholar] [CrossRef] [Green Version]
  60. Dittmann, R.; Froehlich, F.; Pohl, R.; Ostrowski, M. Optimum multi-objective reservoir operation with emphasis on flood control and ecology. Nat. Hazards Earth Syst. Sci. 2009, 9, 1973–1980. [Google Scholar] [CrossRef]
  61. Gogoase Nistoran, D.E.; Ionescu, C.S.; Georgescu, M.; David, D.S. Hydraulic model for water management along Dâmbovița River through Bucharest City, Romania. In Proceedings of the E3S Web of Conferences, Dnipro, Ukraine, 25–27 June 2019; Volume 85. [Google Scholar]
Figure 1. Location of Ujście-2 gauge station (source: maps.geoportal.gov.pl).
Sustainability 12 02369 g001
Figure 2. The part of the Noteć Bystra with selected navigational dams.
Sustainability 12 02369 g002
Figure 3. Variation in discharge at the Ujście-2 gauge station, over the period 1970–2018.
Sustainability 12 02369 g003
Figure 4. The part of the digital terrain model (DTM) for the analyzed reach of the Noteć river with generated cross-sections (source: Authors’ analysis based on available data).
Sustainability 12 02369 g004
Figure 5. Exemplary measurements of hydro-structures and real object—Rosko (source: Authors’ analysis based on available data).
Sustainability 12 02369 g005
Figure 6. Flow hydrograms with different magnitudes of flow peak calculated on the basis of Reitz-Kreps formula.
Sustainability 12 02369 g006
Figure 7. Scheme of data flow and results of the applied method.
Sustainability 12 02369 g007
Figure 8. Simplified overlay of flood hazard zones determined for Q1%.
Sustainability 12 02369 g008
Figure 9. Flood hydrographs at the outflow location of the modeled reach for tested variants: (a) Probability of exceedance 10%; (b) probability of exceedance 1%; (c) probability of exceedance 0.2%.
Sustainability 12 02369 g009aSustainability 12 02369 g009b
Figure 10. Exemplary results obtained for extreme flood flows with the probability of occurrence p = 1%: (a) Maximum water surface elevation, (b) the distribution of depth along the channel related to the above results.
Sustainability 12 02369 g010
Figure 11. Comparison of the flood extent obtained as a result of calculations for all variants for flows with a probability of occurrence of 0.2%: (a) comparison of reference zones (variant I) with zones generated in variant II, (b) comparison of reference zones (variant I) with zones generated in variant III, (c) comparison of reference zones (variant I) with zones generated in variant IV, (d) comparison of reference zones (variant I) with zones generated in variant V, (source: Author’s calculation based on available data).
Sustainability 12 02369 g011
Figure 12. Estimated inundation of soil types in the surroundings of Noteć River during flood Q0.2%: (a) Variant I, (b) Variant II, (c) Variant III, (d) Variant IV, (e) Variant V.
Sustainability 12 02369 g012aSustainability 12 02369 g012b
Table 1. The applied variants of the weir control.
StructureVariants
IIIIIIIVV
Formatname
location
normal head water (NPP) (m a.s.l.)
max gate opening (m)initial gate openings (m)
max WS elevation at which gate open (m a.s.l.)
WS elevation at which gate close (m a.s.l.)
(WS = water surface)
DataPianowka
km 136 + 240
40.28
5.00.97
40.38
39.88
0.97
40.38
39.88
0.97
40.38
39.88
0.97
40.48
39.88
Mikolajewo
km 143 + 140
38.12
5.80.56
38.22
37.72
0.35
40.00
39.00
0.56
38.22
37.72
0.35
40.00
39.00
Rosko
km 148 + 840
36.56
5.90.89
36.66
36.16
0.89
36.66
36.16
0.35
38.50
37.50
0.35
38.50
37.50
Table 2. Comparisons of flood hazard zones.
ZoneRegionAreaPart of ReferencedMax Single Region
km2%km2
Q10%referenced27.41
subtracted6.13221.35
added2.2480.26
Q1%referenced34.94
subtracted6.57191.23
added1.0330.09
Q0.2%referenced36.68
subtracted7.94221.89
added0.7720.04
Table 3. Flooded area in the Noteć River catchment obtained from calculations for all five variants. (source: Author’s calculation based on available data).
DischargeFlooded Area [ha]
Variant IVariant IIVariant IIIVariant IVVariant V
Q 10%2392.283053.311958.252725.702533.33
Q 1%2928.023360.772137.722911.872762.59
Q 0.2%3112.503432.742239.943032.202851.31
Table 4. Estimated inundation of particular soils and other land cover (water, built-up areas) types expressed as percentage of the total inundation area. The results obtained for extreme flow Q0.2%. (source: Author’s calculation based on available data).
Soil TypesSymbolArea [%]
VIVIIVIIIVIVVV
CambisolsBw0.160.210.240.570.39
Haplic PhaeozemsD0.010.020.090.020.08
Phaeozems and UmbrisolsDz0.050.050.020.060.06
Histic GleysolsEmt6.085.712.592.742.74
Limnic HistosolsEtm8.047.6210.398.939.43
FluvisolsF33.8033.1028.5828.9229.52
ForestsLs0.100.090.020.010.01
Histic GleysolsM5.386.346.816.306.10
Fallow landsN1.201.170.900.970.85
Non-agriculturalRN0.270.250.120.100.10
Murshic HistosolsT35.8535.3438.3539.4338.22
Built-up areasTz0.020.030.030.030.03
Waterwn9.0510.0811.8611.9312.47
Table 5. Percentage of soil types in the Noteć River flood area obtained from the calculations for all variants of flow with a probability of occurrence 1%. (source: Author’s calculation based on available data).
Soil TypesSymbolArea [%]
VIVIIVIIIVIVVV
CambisolsBw0.130.190.210.530.35
Haplic PhaeozemsD0.000.020.080.010.07
Phaeozems and UmbrisolsDz0.050.050.020.060.06
Histic GleysolsEmt6.265.752.622.792.79
Limnic HistosolsEtm8.107.6610.469.049.49
FluvisolsF34.3133.5229.1929.5730.08
ForestsLs0.100.090.010.010.01
Histic GleysolsM5.326.306.686.265.98
Fallow landsN1.221.170.900.900.86
Non-agriculturalRN0.270.250.110.100.10
Murshic HistosolsT35.3234.9037.8038.7137.69
Built-up areasTz0.020.020.030.030.02
Waterwn8.9010.0911.8811.9812.49
Table 6. Percentage of soil types in the Noteć River flood area obtained from the calculations for all variants of flow with a probability of occurrence 10%. (source: Author’s calculation based on available data).
Soil TypesSymbolArea [%]
VIVIIVIIIVIVVV
CambisolsBw0.090.180.210.480.34
Haplic PhaeozemsD0.000.010.070.010.06
Phaeozems and UmbrisolsDz0.050.050.020.070.06
Histic GleysolsEmt6.735.872.752.912.92
Limnic HistosolsEtm7.507.6810.439.289.45
FluvisolsF36.0034.0830.5930.9531.36
ForestsLs0.110.090.010.010.00
Histic GleysolsM5.476.206.446.195.75
Fallow landsN1.281.140.910.900.86
Non-agriculturalRN0.290.250.110.100.09
Murshic HistosolsT34.0434.1736.4236.9736.43
Built-up areasTz0.020.020.020.020.02
Waterwn8.4210.2512.0212.1212.64

