Grass–Legume Forage Systems Effect on Phosphorus Removal from a Grassland Historically Irrigated with Reclaimed Wastewater


1
Department of Natural Resources & Environmental Science, University of Nevada, Reno, 1664 N. Virginia Street, Reno, NV 89557, USA
2
Department of Agriculture, Veterinary & Rangeland Sciences, University of Nevada, Reno, 1664 N. Virginia Street, Reno, NV 89557, USA
3
Extension, College of Agriculture, Biotechnology & Natural Resources, University of Nevada Cooperative Extension, 111 Sheckler Road, Fallon, NV 89406, USA
*
Author to whom correspondence should be addressed.
Sustainability 2020, 12(6), 2256; https://doi.org/10.3390/su12062256
Submission received: 21 February 2020
/
Revised: 9 March 2020
/
Accepted: 11 March 2020
/
Published: 13 March 2020
(This article belongs to the Section Sustainable Agriculture)
Abstract
:The utilization of reclaimed wastewater is a suitable and sustainable approach to agriculture production in water-scarce regions. However, even though the wastewater is treated to reduce nutrient concentration such as phosphorus, the 10,600 to 14,006 m3 of water applied ha−1 year−1 on grass and alfalfa hay crops in Nevada can lead to soil phosphorus buildup over an extended period. This study evaluated the effectiveness of forage systems (FS) of monoculture grass, monoculture legume, and their mixtures on herbage accumulation, tissue phosphorus concentration, and quantity of phosphorus removed from a grassland under wastewater irrigation. The study was carried out at the Main Station Field laboratory in Reno, Nevada, USA. A total of 23 FS using tall fescue (Schedonorus arundinaceus (Schreb.) Dumort), alfalfa (Medicago sativa L.), red clover (Trifolium pratense L.) and white clover (Trifolium repens L.) in monocultures or grass–legume mixtures (25:75, 50:50, and 75:25) based on seeding rate were used. The response variables were herbage accumulation (HA), tissue phosphorus concentration, and phosphorus removal. Forage systems means were considered different P ≤ 0.05. Herbage accumulation, tissue phosphorus concentration, and phosphorus removal differed among FS and year. Herbage accumulation was similar for the grass monocultures (10.5 Mg ha−1; SE = 1.1) and the majority of the grass–legume mixtures (9.0 Mg ha−1; SE = 1.1) but both systems had greater HA than legumes monoculture (4.3 Mg ha−1; SE = 1.1). The legume monocultures of alfalfa and white clover had the greatest phosphorus concentrations (10.9 g kg−1 dry matter; SE = 0.44) among all FS. Total phosphorus removed was least among legume monocultures (34.0 kg P ha−1; SE = 6.2) in this study and generally similar for grass monocultures (67.4 kg P ha−1; SE = 6.2) and grass–legume mixtures of 75:25 (61.7 kg P ha−1; SE = 6.2). Based on the response variables, agronomic, and environmental considerations a grass–legume mixture that includes 75:25 or even a 50:50 seeding rate ratio will be suitable options for phosphorus removal from phosphorus enriched grasslands in semiarid ecosystems that utilized wastewater for irrigation.
1. Introduction
Agricultural production in semiarid and arid regions of the world is constrained by water scarcity and nutrient-poor soils [1]. These agronomic impediments limit the capacity of these regions to provide agricultural products for human and animal consumption. In water-scarce agroecosystems, crop production agriculture is heavily reliant on irrigation as the sporadic precipitation that accrued annually is insufficient to maximize crop growth and yield. This scarcity in water for agricultural production in these regions is further exacerbated by climate change and the associated events of frequent and intensive droughts that cause a reduction in water resources in semiarid and arid regions [2,3]. Therefore, alternative approaches must be sought and incorporated into traditional water management practices to ensure sustainable agricultural production from these water-scarce environments. One suitable and sustainable approach to agricultural production in water-scarce regions is the utilization of alternative water resources in the form of the large quantity of wastewater generated from municipalities [3,4,5,6,7,8,9]. The benefits of utilizing reclaimed wastewater are multiple, in that it provides a reliable year-round source of water for crop production [3], crop yield optimization through the provision of nutrients such as N, P, and K [9,10,11], reduced demand on fossil fuel for synthetic fertilizer production, minimize fertilizer input cost [3], increase crop farm profit margins [12], and enhance environmental conservation due to a reduction in synthetic fertilizer use [13].
However, even though reclaimed wastewater is treated at many water treatment plants to reduce the concentration of biogenic compounds such as P and N, the sheer volume of wastewater applied to croplands (10,600 to 14,006 m3 of water applied ha−1 year−1) resulted in agronomic surpluses. This inevitably leads to soil P built-up, increased movement of P below the plow layer, and subsequently leaching into surface and groundwater [14,15,16,17]. This culminates in water quality impairment and eutrophication of aquatic ecosystems [18,19,20]. Soil P built-up on agricultural landscapes is commonly a result of the soil P levels exceeding the quantity removed by harvested crops, and this exacerbates the potential of P to negatively influence environmental quality [18,21]. Approaches to sustainable agricultural practices are morphed in a multiplicity of strategies, and in this regard, environmentally friendly strategies must be developed to mitigate this impending threat of utilizing reclaimed wastewater on agricultural landscapes in water-scarce environments.
Forage crops have long been proposed and tested as an environmentally friendly ecosystem-based phytoremediation approach to mitigate P loading into aquatic ecosystems off agricultural landscapes [22,23]. However, because of the differences in biomass production and nutrient P acquisition among cool- or warm-season forage crops, the effectiveness of their use is dependent on the species used [24,25]. Several studies have examined P and other nutrients extractive potential of various warm-season forage species such as bahiagrass (Paspalum notatum Flügge), bermudagrass (Cynodon dactylon (L.) Pers.), corn (Zea mays L.), crabgrass (Digitaria ciliaris (Retz). Koel.), digitgrass (Digitaria eriantha Steud.), elephantgrass (Pennisetum purpureum Schumach), guineagrass (Panicum maximum Jacq.), limpograss (Hemarthria altissima (Poir.) Stapf and Hubb), sorghum-sudangrass (Sorghum bicolor (L.) Moench), stargrass (Cynodon nlemfuensis Vanderyst), sugarcane (Saccharum spp.), and switchgrass (Panicum virgatum L.) under varying environmental and agronomic conditions [26,27,28,29,30,31,32]. Moreover, examined were several cool-season forages such as annual ryegrass (Lolium multiflorum Lam.), oat (Avena sativa L.), perennial ryegrass (Lolium perenne L.), rye (Secale cereal L.), triticale (x Tricticosecale Wittmack), wheat (Triticum aestivum L.), legumes of the Trifolium genera (e.g., ball clover, Trifolium nigrescens Viv.; red clover, Trifolium pratense L.; and white clover, Trifolium repens L.), caley pea (Lathyrus hirsutus L.), winter pea (Pisum sativum var. arvense (L.) Poir.), and hairy vetch (Vicia villosa Roth) on their P or other nutrient acquisition potential [27,33,34,35,36]. The overarching conclusion is that the different forage species differed in their P acquisition and biomass production potential, thus differing rates of P removal.
In semiarid Nevada, the predominant forage production system used is monocultures of alfalfa (Medicago sativa L.), orchardgrass (Dactylis glomerata L.), and timothy (Phleum pratense L.) hay crops because of market demand. However, in water-scarce environments, single species cultivation of forage crops may pose a threat to the longevity of crop stand, and thus, forage species mixtures are deemed a more reliable choice [37]. Cultivating mixtures of forage species have been shown to increase overall forage biomass production and nutrient content compared to monocultures [38,39,40] as a result of niche complementarity [41]. For example, root morphological traits differ among forage species, and in mixed swards, it allows for an increase in nutrient uptake from different soil nutrient pools compared to monocultures because of complementary root distribution [42]. Further, legumes incorporation in mixed swards (grass–legume) reduced the dependency on inorganic N fertilizer input due to N fixation by legumes and thus reduce the risk of N leaching into surface water. Additionally, the potential root exudation of H+ ions or organic acids by some forages may increase the availability of P bound in soils that are typical of semiarid and arid regions for plant uptake [43,44]. There is limited information available on utilizing forage mixtures of the more current cultivars of grasses and legumes and the proportion of species in the mixture on P removal from croplands irrigated with wastewater. This study evaluated the effectiveness of forage systems of monoculture grass, monoculture legume, and their mixtures on herbage accumulation, tissue phosphorus concentration, and quantity of phosphorus removed from a grassland under wastewater irrigation.
2. Materials and Methods
2.1. Description of the Study Area
The study was carried out at the Main Station Field Laboratory, Reno, NV (39° 30′ N, 119°44′ W; 1,339 m altitude) from the spring of 2017 and remained established for a two-year (2017 and 2018) growing period. The soil at the experimental area is a Truckee silt loam (a fine- loamy, mixed, superactive, mesic Fluvaquentic Haploxerolls). Before plot establishment, the site was primarily managed as a hayfield dominated by the perennial grass tall fescue (Schedonorus arundinaceus (Schreb.) Dumort) with a lesser composition of Kentucky bluegrass (Poa pratensis L.). The Truckee Meadows Water Reclamation Chalk Bluff Facility, Reno, NV was the sole source of irrigated wastewater for the past two decades. Before seeding, mean soil pH was 7.7, 57 g kg−1 soil organic matter, and CEC of 24.1 meq 100g−1. Olsen extractable P, K, Mg, Ca, Na, and S concentrations were 31, 712, 532, 3427, 192, and 10 mg kg−1 respectively. The study area is semiarid and weather data retrieved from the Western Regional Climate Center, Desert Research Institute Weather Station showed the 30-year mean temperature of 24 °C and long-term average annual precipitation of 15 mm (Figure 1). The most pronounced difference between the study period and the 30-year averages was the relatively higher average precipitation in 2017 (29 mm) compared to 2018 (19 mm) (Figure 1). Across growing periods of the two years (April–October, 2017 and 2018) and the dormant months of November–March, the mean monthly accumulated precipitation differed between the two years and 30-year average (Figure 1). Apart from June and August, accumulated monthly evapotranspiration was greater during 2017 than in 2018 (Figure 1). During the two years of this study and the 30-year average, the mean monthly air temperature was similar (Figure 1).
2.2. Treatments and Experimental Design
Treatments (hereafter called forage systems; FS) were monocultures of tall fescue (Schedonorus arundinaceus (Schreb.) Dumort) cultivars “BarOptima Plus E34” and “Fawn”, the legumes alfalfa (Medicago sativa L.) cultivar “Ameristand 403T Plus”, red clover (Trifolium pratense L.) cultivar “Freedom”, and white clover (Trifolium repens L.) cultivar “Barblanca” and mixtures of 25:75, 50:50, and 75:25 grass–legume percent based on recommended seeding rate for each species (Table 1, forage systems). The seeding rates used in this study on a pure live seed (PLS) basis for tall fescue, alfalfa, red clover, and white clover were 15, 20, 12, and 5 kg ha−1, respectively. The seeding rates used are traditionally utilized by forage producers in Nevada. A total of 23 forage systems (five monocultures and 18 grass–legume mixtures) were laid out in a randomized complete block design with four replicates of each forage system. The early released endophyte-free tall fescue cultivar Fawn was selected as the standard to compare with the newer BarOptima Plus E34. The cultivar of each forage legume species was selected based on their ability to persist and production potential under semiarid environments.
2.3. Plot Establishment and Management
Before the preparation of seedbed, the study site was sprayed with glyphosate [N-(phosphonomethyl) glycine] at a rate of 1.12 kg a.i. ha−1. After this, the area was disked and rototilled for a uniform seedbed. The size of each plot was 13.9 m2 (7.62 × 1.83 m). Plots were separated by 1.5-m wide alleys while blocks were spaced 5-m apart. Plots were seeded mid-April of 2017 at the prescribed seeding rate (Table 1) for each forage system using an XL plot seeder (Wintersteiger AG., Salt Lake City, Utah, USA) with eight rows and each 20.3 cm apart. From establishment throughout the growing periods in each year of the study, supplemental irrigation was provided through a solid-set sprinkler irrigation system using treated wastewater. Grass-reference evapotranspiration data from a weather station located near (1000 m) the study site was used to guide the application of supplemental irrigation once each week. Seasonal irrigation supplied was 954 mm in 2017 and 1045 mm in 2018 (Figure 1). The wastewater used was analyzed monthly from March through October of 2017 and 2018 to determine its phosphorus concentration. The monthly average concentrations were orthophosphate 0.2 ± 0.17 mg l−1 P and total phosphate of 0.34 ± 0.18 mg l−1. In this study, only the grass monoculture plots were fertilized with N at a rate of 80 kg ha−1 using urea fertilizer material in a single application each year. Potassium fertilizer was not applied based on soil test results, and because of the historical P buildup in the soil, no additional P fertilizer was applied to plots. Broadleaf weeds were controlled during each growing season using the herbicide Butyrac 2,4-DB, 4-(2, 4-dichlorophenoxy) butyric acid at a rate of 0.84 kg active ingredient ha−1. For grass weeds, control in monoculture legume plots, the post-emergence herbicide Clethodim (E)-2-[1-[[(3-chloro-2-propenyl) oxy] imino] propyl]-5-[2-(ethylthio) propyl]-3-hydroxy-2-cyclohexen-1-one (Intensive) was sprayed at a rate of 0.84 kg active ingredient ha−1 to control annual and perennial grasses within the alfalfa and clover plots.
2.4. Data Collection
Plots were harvested twice (a common practice among local hay growers) each growing season to determine annual herbage accumulation from an area of 5.4 m2, excluding border rows from each plot. Plots were harvested early-August and early-October of each growing season. Separation of each species component in the grass–legume mixtures was done by harvesting two 0.25 m2 quadrats placed randomly in each plot before harvest and hand sorted into grass, legume, and weeds. Species composition was quantified on a dry matter basis. A Flail Forage Harvester (Carter Mfg., Brookston, IN) was used to harvest plots to a residual stubble height of 10.14-cm. The weight was recorded for forage harvested from each plot, and an average of 500 g subsample was collected in cloth bags from each plot for dry matter (DM) determination. Samples were placed in an oven and dried for 72 h at a temperature of 60 °C. Forage dry matter was determined from each subsample to compute the annual herbage accumulation of each forage system. Total annual herbage accumulation was determined by summing the two harvests each year. The same forage subsample from each plot was ground to pass a 1-mm screen in a Wiley mill (Model 4, Thomas Scientific, Swedesboro, NJ). Microwave-assisted digestion using nitric acid (HNO3) was used to determine total tissue P content followed by the digests analysis using an inductive coupled plasma atomic emission spectroscopy. The concentration of tissue P was calculated based on the weighted sum of the matching DM for each harvest in both years. Annual P removal from each forage system was calculated as the product of herbage accumulation and forage tissue P concentration for each plot at harvest period. Total P removed after two years was the sum of each annual P removal for each forage system.
2.5. Statistical Analysis
The PROC MIXED procedure in SAS version 9.4 [45] was used to determine the significance of annual herbage accumulation, botanical composition, forage tissue P concentration, annual and total P removal in this study. Forage system and year (discernment of year-to-year trend) were considered fixed effects with replicates and their interactions as random effects. Year was analyzed as repeated measurement, and the covariance structure selected based on the ‘smaller is better’ Bayesian Information Criterion value [46]. When significant differences were detected (P ≤ 0.05), forage systems means were separated using the PDIFF test of the LSMEANS procedure. All means reported are least square means. Contrasts were performed to compare the differences of the response variables between the grouped forage systems (i.e., grass monoculture, legume monoculture, and grass–legume mixtures of 25:75, 50:50, and 75:25) and for each group between years. The PROC CORR procedure of SAS [45] was used to performed Pearson’s correlation analysis among herbage accumulation, tissue P concentration, and P removal.
3. Results
3.1. Herbage Accumulation
There was a significant year × forage system interaction effect (P < 0.001) on annual herbage accumulation (Table 2). During 2017, both cultivars of tall fescue monoculture grass had greater herbage accumulation than the three monoculture legumes, and the grass–legume mixtures 3, 4, 6, 7, 10, 12, 14, and 15 (Table 2). Moreover, the grass–legume mixture 13 had greater annual herbage accumulation than the monocultures of alfalfa and white clover, and grass–legume mixtures 6, 10, 12, and 14 (Table 2). Further, grass–legume mixtures 16, 17, and 18 had greater annual herbage accumulation than the legume monoculture of white clover and grass–legume mixture 12 (Table 2). In 2018, annual herbage accumulation was greater for grass–legume mixture 6, and both cultivars of tall fescue monocultures than the monoculture legumes, and grass–legume mixtures 1, 2, and 11 (Table 2). The three monoculture legumes had the least annual herbage accumulation among all forage systems in 2018 (Table 2). Except for red and white clover monocultures, and grass–legume mixtures 2, 11, and 13, all other forage systems had greater annual herbage accumulation in 2018 than the establishment year of 2017 (Table 2).
Pertaining to the contrasts among the grouped forage systems, year × forage system interaction effect (P = 0.002) influenced annual herbage accumulation. During 2017, annual herbage accumulation was greater for the grass monoculture than legume monoculture, the 25:75, and 50:50 grass–legume mixtures (Table 3). In 2018, the grass monoculture produced greater annual herbage accumulation than legume monoculture and 25:75 grass–legume mixture (Table 3). Moreover, during 2018 the 75:25 grass–legume mixture produced greater herbage accumulation than 25:75 grass–legume mixture, and the legume monoculture had the lowest herbage accumulation (Table 3). For each grouped forage system, only legume monoculture did not differ between years but the four other grouped forage systems produced greater herbage accumulation in the second year (2018) compared to the establishment year of 2017 in this study (Table 3). Forage system did not affect the botanical composition of each species component in the grass–legume mixture (P > 0.05). However, there was a year effect for the grass and legume components (P < 0.05). The proportion of grass in the mixed sward was less in 2017 (77.0%, SE = 1.7) than 2018 (98.8%, SE = 1.7). For the legumes, the proportion of legume in the sward was greater in 2017 (18.6%, SE = 1.6) relative to 2018 (0.5%, SE = 1.6). While for the weed component, greater in 2017 (3.7%, SE = 0.7) than 2018 (0.63%, SE = 0.7).
3.2. Forage Tissue Phosphorus Concentration
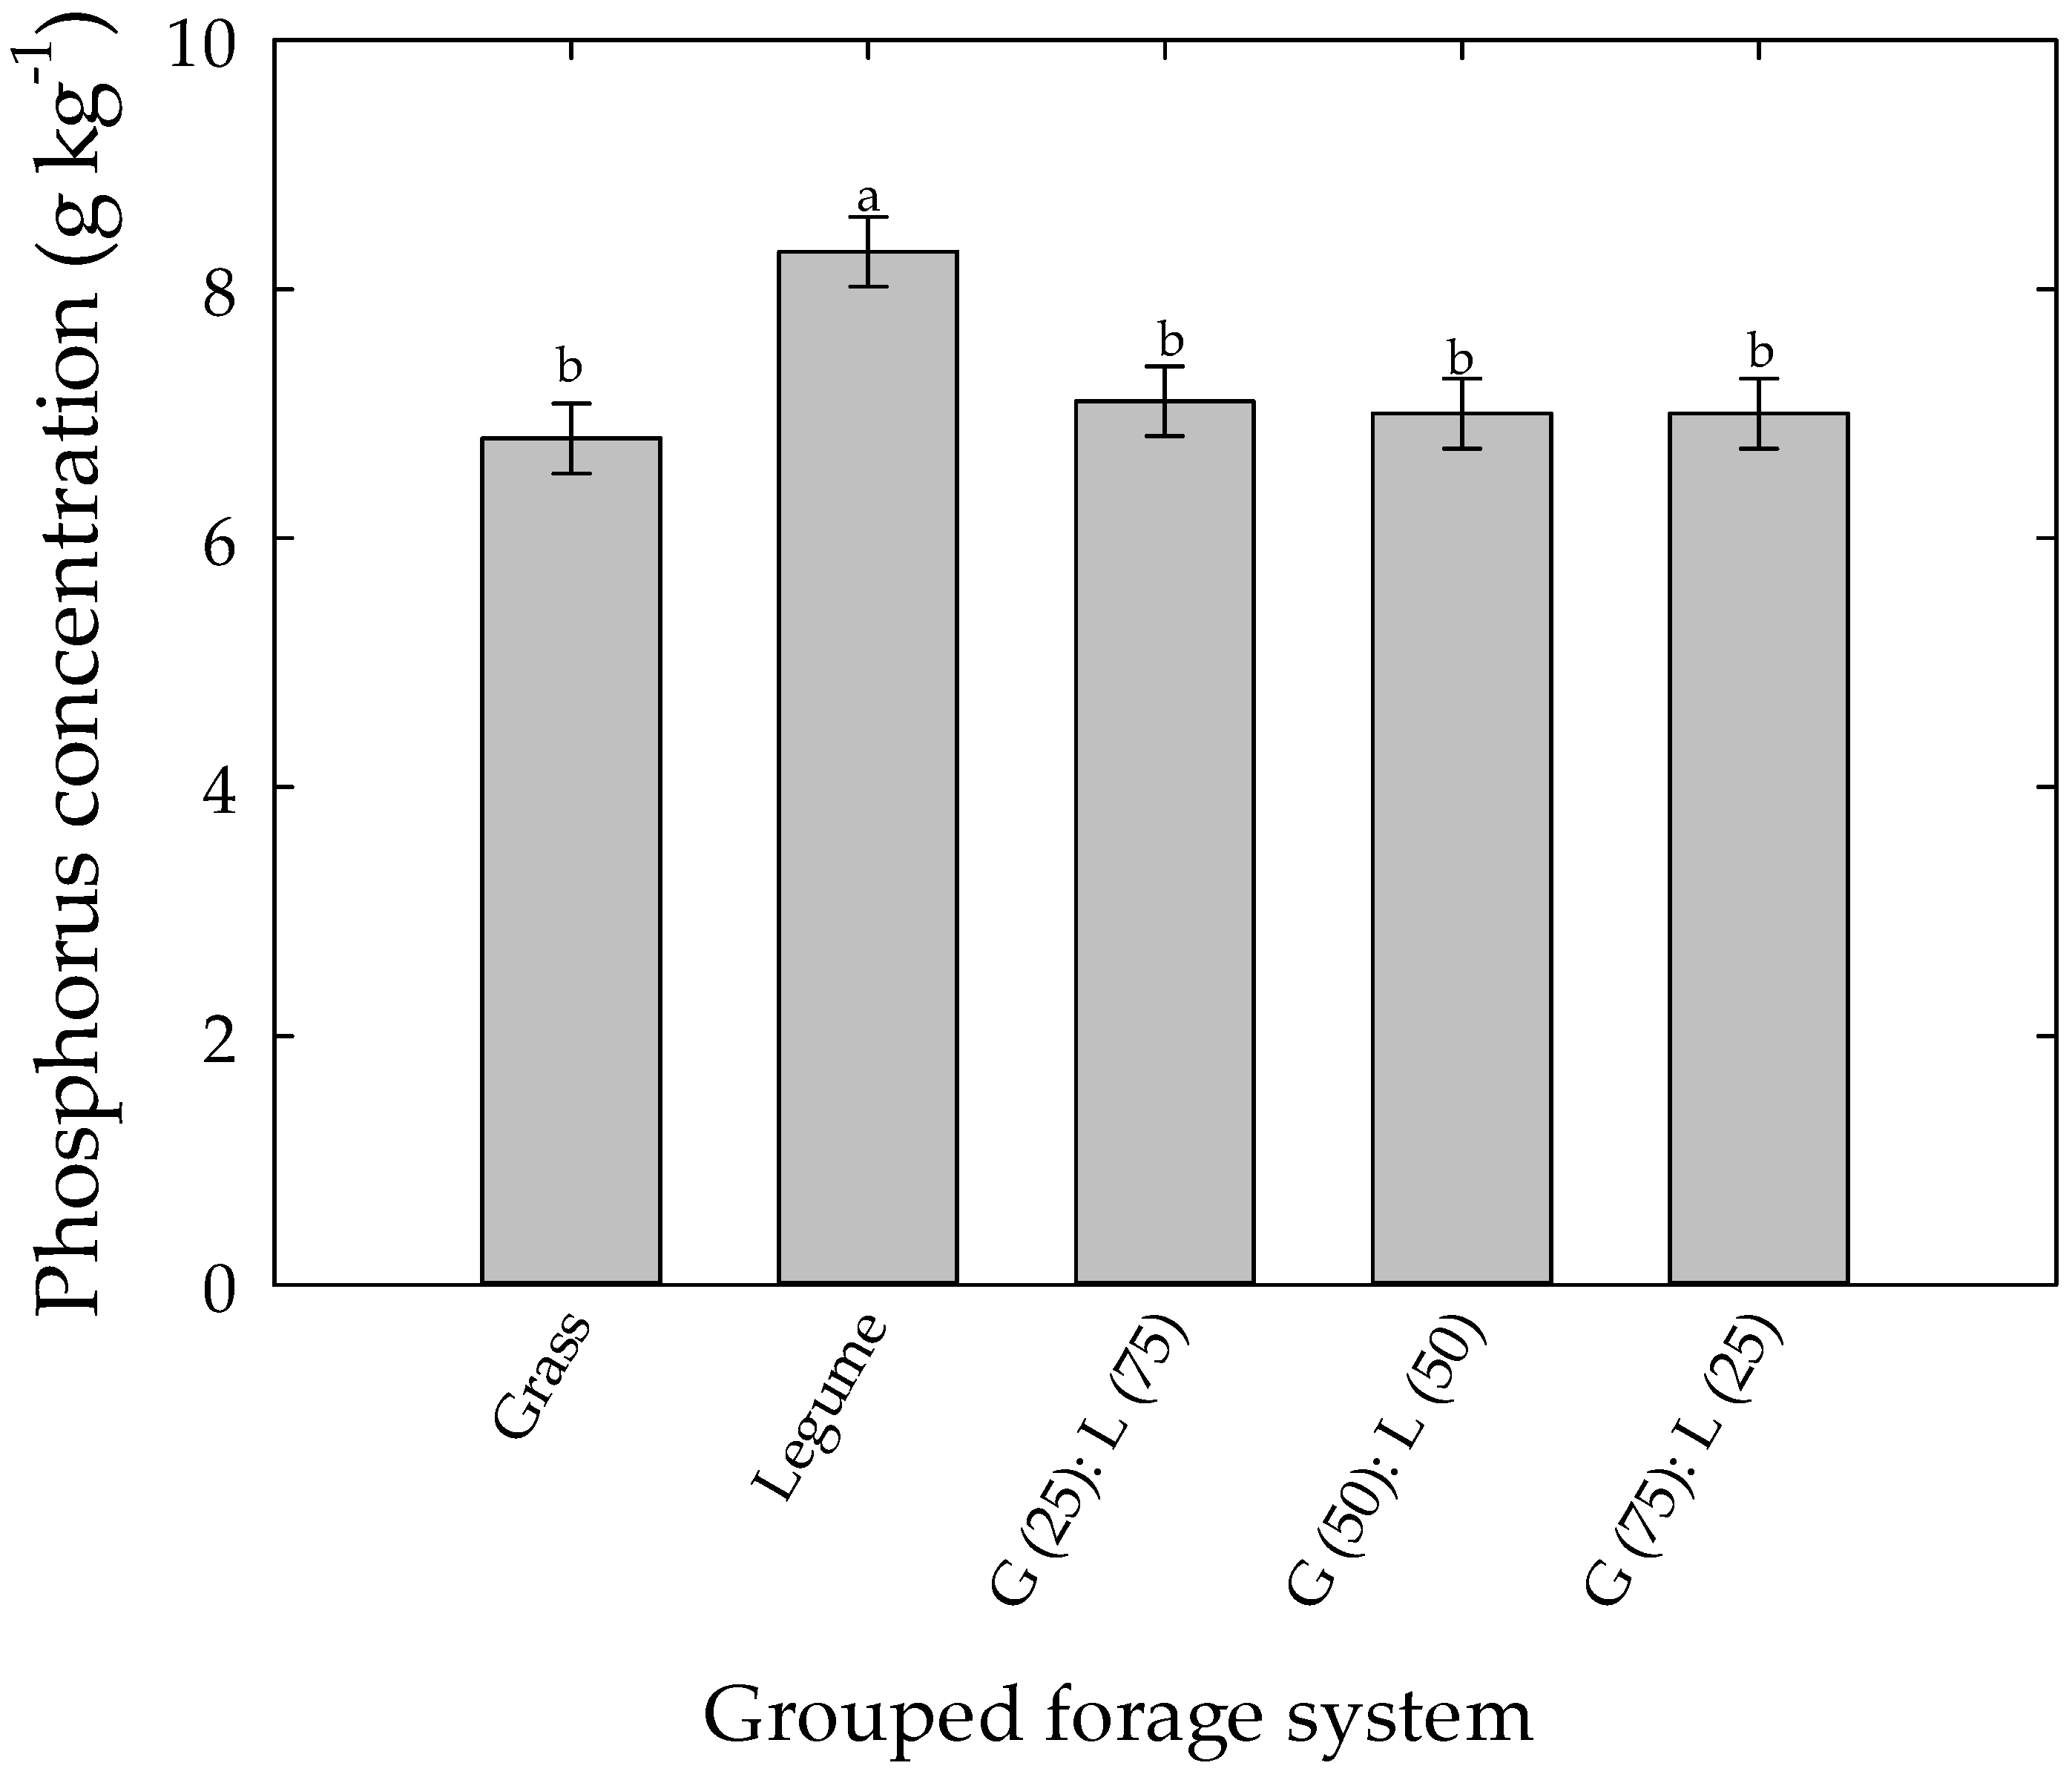
Forage tissue P concentration was affected by year × forage system interaction (P = 0.014). In 2017, the legume monocultures of alfalfa and white clover had the greatest tissue P concentration among all forage systems (Table 4). The grass–legume mixture 4 had greater tissue P concentration than the two tall fescue monocultures, grass–legume mixtures 6, 7, 11, 13, 14, 16, and 18 (Table 4). The grass–legume mixtures 6, 11, 14, and 16 had lower tissue P concentration than the red clover monoculture and grass–legume mixtures 1, 8, and 10 (Table 4). During 2018, the red clover monoculture had greater tissue P concentration than both cultivars of tall fescue monoculture and all grass–legume mixtures except 8 and 17 (Table 4). White clover monoculture tissue P concentration was greater than the tall fescue cultivar BarOptima Plus E34 monoculture, and the grass–legume mixtures 2, 5, 6, 12, 16, and 18 (Table 4). However, during 2018, alfalfa monoculture did not differ in tissue P concentration compared to all other forage systems (Table 4). For each forage system, tissue P concentration was greater in 2017 than in 2018 of this study (Table 4). For the contrast among grouped forage systems, tissue P concentration differed (P < 0.001) among groups. The grouped legume monoculture had greater tissue P concentration than all other grouped forage systems (Figure 2).
3.3. Forage System Phosphorus Removal
In this study, P removal was significantly affected by a year × forage system interaction effect (P = 0.002). During 2017, annual P removal of the two cultivars of tall fescue monocultures was greater than red and white clover monocultures, and the grass–legume mixtures 3, 6, 7, 10, 11, 12, and 14 (Table 5). The grass–legume mixture 13 removed a greater quantity of P than red clover monoculture, and the grass–legume mixtures 6, 10, 12, and 14 (Table 5). Further, grass–legume mixture 6 removed a lower quantity of P than grass–legume mixtures 1, 2, 5, 8, 16, 17, and 18 (Table 5). During 2018, the grass–legume mixture 8, removed a greater amount of P than red and white clover monocultures, and grass–legume mixtures 1, 2, 10, 11, 12, 13, 16, and 18 (Table 5). The monocultures of red and white clover removed the least amount of P during 2018 (Table 5). Between years, red clover monoculture removed a greater quantity of P in 2017 than 2018 (Table 5). However, the grass–legume mixtures 6, 7, 8, 12, and 14 removed a greater quantity of P in the second year (2018) relative to the first year (2017) of this study (Table 5).
For the contrast among the grouped forage systems, there was a significant Year × forage system interaction effect (P = 0.009) on P removal. During 2017, grass monoculture removed a greater amount of P than the legume monoculture, the 25:75, and 50:50 grass–legume mixtures (Table 6). The legume monoculture removed a lower quantity of P in 2018 than 2017, but for the 50:50 grass–legume mixture, a greater amount of P was removed in 2018 than 2017 in this study (Table 6).
The total P removed after two years was different among forage systems (P < 0.001) in this study. The two cultivars of tall fescue grass monoculture removed a greater quantity of P after two years than the grass–legume mixtures 1, 3, 6, 10, 11, 12, 13, 14, 16, 17, and the three monoculture legumes (Table 5). Additionally, grass–legume mixtures 8 and 17 removed a greater quantity of P after two years than grass–legume mixtures 3, 10, 11, 12, 14, 18, and all three monoculture legumes (Table 5). Apart from grass–legume mixtures 11 and 12, all other mixtures removed greater total P after two years than the three monoculture legumes (Table 5). Contrasts among the grouped forage system were significant (P < 0.05) for total P removed after two years. The monoculture grass and the mixtures removed greater total P than the monoculture legume (Table 6).
4. Discussion
4.1. Herbage Accumulation
Our study focused on the potential of perennial forage crops in different forage systems as an effective strategy to remove surplus soil P off agricultural landscapes. Two critical characteristics of forage crops in ameliorating P loading are their P uptake potential based on root volume and biomass production [30,35,47]. These characteristics are complemented with agronomic cropping systems approaches that are suitable for the maximization of phosphorus uptake and biomass production. For example, intercropping systems have the potential to increase phosphorus uptake due to interspecific mutualism (e.g., the larger root system of one plant species over another or differential release of organic exudates for phosphorus mobilization) that increases soluble phosphorus in the rhizosphere [48].
Our study revealed that a year × forage system interaction affected herbage accumulation of the different forage systems tested. Similar to the results of our study, herbage accumulation differences among forage treatments were more pronounced in the establishment year compared to the succeeding production year [37,49]. For the legume monocultures, that lack of year effect on herbage accumulation was in complete contrast to the grass monocultures and grass–legume mixtures that favored greater herbage accumulation in the second year. Hence, we surmised that the legumes had a faster rate of establishment and stability in this study environment compared to the grass monocultures and the grass–legume mixtures similar to the observation made by Aponte et al. [37]. However, contrary to our assumption of the legumes in this study, Bork et al. [50] reported that legumes (alfalfa and clover) were slow to reach maximum biomass production relative to the grasses. While the production environment (year) is a critical factor in forage growth and productivity, the short duration of this study makes it difficult to truly gauge the impact of year on herbage accumulation of the different forage systems. In supporting evidence of our view, Bork et al. [50] reported that the maximum yield of grass–legume mixtures was obtained two to three years after seeding. Therefore, our discussion revolves more greatly around the differences in forage accumulation, tissue P concentration, and P removal among forage systems tested.
Overall, with just a few exceptions, herbage accumulation for the grass monocultures and grass–legume mixtures were mostly similar in this study. The fact that the grass monocultures were fertilized with N and did not differ from most of the grass–legume mixtures supports the use of grass–legume mixtures [51,52]. A similar observation was reported for alfalfa-tall fescue 50:50 seed rate mixture relative to the fully fertilized tall fescue treatment [52]. The benefits to be derived from the grass–legume mixtures are not only from an economic standpoint of the elimination of inorganic N input cost into the grass–legume mixtures but also from an environmental perspective of lowering N leaching into aquatic systems [51,52,53]. Even though we did not examine the harvest period effect on herbage accumulation, the midsummer forage deficit is a known physiological hindrance of cool-season grasses [28]. Thus, the inclusion of legumes that are more productive during the summer months will serve a complementary role in herbage production stability [54,55]. Phosphorus removal is heavily dependent on herbage accumulation, and therefore, the sole use of monoculture legumes may not be a highly effective ameliorator of phosphorus from high P soils in water-limited environments. Bélanger et al. [56] reported that alfalfa grown in mixtures with at least one forage grass species had greater herbage accumulation than alfalfa grown alone, and their results were in concurrence with the results of this study. Further, the seeding rate ratio played a key role in herbage accumulation differences among the grass monocultures, and grass–legume mixtures in this study, and a similar observation was made by Adjesiwor et al. [57]. Therefore, the inclusion of the grass component at only 25% of its full seeding rate oftentimes had lower herbage accumulation in reference to grass monoculture and other grass–legume mixtures. This observation was confirmed by the contrast among grouped forage systems based on herbage accumulation. Therefore, it was quite evident that the mixed forage systems that include 75% or even 50% of the full grass seeding rate in this study, will be suitable options to utilize under water-scarce environments. Based on the botanical composition, the greatest portion of herbage accumulation was from the grass component (88%) and indicated the dominance of the grass in mixed forage systems. The dominance of grass is a common occurrence in grass–legume mixtures irrespective of the number of species used [58,59]. From a cultivar perspective, the similar herbage accumulation between the two tall fescue cultivars suggests that both can be integrated into forage systems aimed at P removal in water-scarce environments.
For this study relative to the literature, herbage accumulation values for tall fescue cultivars BarOptima Plus E34 and Fawn were within the range of 3.1 to 15.6 Mg ha−1 reported in several studies [37,52,60]. However, alfalfa herbage accumulation in this study was lower than the four years average of 9.4 Mg ha−1 reported by Aponte et al. [37]. Varietal trials in Nevada by Davison et al. [61] reported greater annual herbage accumulation for alfalfa relative to this study and indicates the erratic nature of alfalfa responses under water-scarce environments. White et al. [62] reported annual herbage accumulation of 9.1 and 5.9 Mg ha−1 for red and white clover respectively, and again, these values were greater than those in our study. However, white clover herbage accumulation values in our study were greater than the range of 1.3 to 2.3 Mg ha−1 reported by Springer and Aiken [63]. Herbage accumulation for the grass–legume mixtures in our study falls within the 4.8 to 15 Mg ha−1 range reported in the literature [37,64,65]. Our study revealed that the grass–legume mixtures did not improve annual herbage accumulation over the grass monoculture, and concurred with the results reported by Minneé et al. [65] but differs from those of Berdahl et al. [66] and Cox et al. [52]. Some possible reasons for the observed trends in our study could be the utilization of a two-cut system that can reduce either the grass or legume component in the sward due to shading as against more frequent harvest [40]. Additionally, the duration of the study did not allow the grass component in the sward to fully utilized the N fixed by the legume component, which may have been hampered by the mineralization process.
4.2. Forage Tissue Phosphorus Concentration
Forage species differ in their ability to take up P and ultimately, tissue phosphorus concentration [22,35,67]. The greater P concentration of legumes monocultures relative to the majority of the other forage systems was not unexpected in this study. Forage systems P concentration rankings in our study were generally consistent with earlier studies out of the southeastern state of Mississippi [33,35]. Further, the differences in tissue P concentrations among the different forage systems could be attributed to the dilution effect based on the negative relationship between P concentration and herbage accumulation (P < 0.001; r = −0.60) in this study. The greater P concentration of legumes provides additional credence for its inclusion in mixed forage systems to enhance forage P removal from high P grasslands. Notably, only two grass–legume mixtures in the first year had greater P concentration than the grass monocultures, and both include alfalfa at either 50% or 75% of its full seeding rate. This adds further support to the herbage accumulation results that legumes should be included at a minimum of 50% of its full seeding rate in the mixture with grass. However, the results were inconsistent in the second year that showed no grass–legume mixtures had greater P concentration than grass monoculture. The similar P concentration among the grass monocultures and mixed forage systems can be attributed to the dramatic decline in the legume component from 18% in 2017 to 0.5% in 2018. This may be attributed to the two-cut harvest system utilized in this study, instead of a greater frequency of harvest of grass–legume mixtures [68]. Unlike the lack of difference in P concentration between the two tall fescue cultivars, Bélanger et al. [67] reported differences in tissue P concentration among genotypes of timothy (Phleum pratense L.).
4.3. Phosphorus Removal
Given the duration of the study, we focus our discussion on the total P removed over two years. Phosphorus removal is a product of herbage accumulation and tissue P concentration [30], and both are instrumental in the rate at which P is removed from the soil. Our study indicated that legumes grown as a monoculture, and to a lesser extent, when the grass component included was only 25% of its full seeding rate will not be suitable options for P removal from P enriched grasslands. Phosphorus removal was strongly linked to herbage accumulation (P < 0.001; r = 0.82) but not P concentration (P = 0.309; r = −0.07) in this study. In several studies reviewed in the literature, the quantity of P removed from the soil was strongly correlated with herbage accumulation [32,32,69,70]. The ranges of P removal are also dependent on the type of forage species and agronomic management practices utilized. For example, Ketterings et al. [69], Brink et al. [70], Silveira et al. [30], and Read et al. [32] reported a range of 8–189 kg P ha−1 for different warm-season grasses and cool-season grasses and legumes, approximately 4–45 kg P ha−1 [33,36]. Phosphorus removal in our study falls well within the cool-, warm-season grasses, and legumes ranges reported.
To ensure sustainability, a judicious integrated system approach for phosphorus removal off grasslands enriched with phosphorus and management thereafter will be complementary to maintaining environmental quality. For studies like ours, utilizing forages to remediate soils high in phosphorus has to be followed by a system of careful removal of forage materials off the grassland as baled hay or greenchop for ruminant livestock (e.g., beef or dairy cattle) feeding. This approach is relevant as it avoids animal grazing, which facilitates the constant recycling of the phosphorus removed by forages through its return to the soil via defecation and urine [71]. Secondly, under confined feeding operations (e.g., dairy or feedlot) it allows for sound management decisions of phosphorus regulations in effluents to minimize non-point source phosphorus impact on environmental quality [72,73]. Manure or slurry from these operations can be recycled in crop fields (e.g., corn, small grains, or perennial forages) that required phosphorus application [72,73]. Even in fields that require P input for crop growth, spatial heterogeneity of soil phosphorus can lead to phosphorus pollution of ground and surface water when a uniform approach of P application is practiced. Therefore, an agronomically sound approach can be the adoption of variable rate manure or slurry application using sensor-based technologies to mitigate the negative impacts of phosphorus on the environment [72,73]. Other approaches to reduce phosphorus flows and losses can include dietary manipulation of animals that increase the digestibility of phosphorus and reduce its excretion in urine and defecation [74]. Further, the utilization of biogas digester with lagoons can stem the flow of phosphorus into the environment after animal utilization of the harvested forage [75].
5. Conclusions
Reclaimed wastewater utilization provides us an opportunity to conserve water resources, but this must be carried out in a way that safeguards the environment. Based on the response variables, agronomic, and environmental considerations a grass–legume mixture that includes 75:25 or even a 50:50 seeding rate ratios will be suitable options for phosphorus removal from phosphorus enriched grasslands in semiarid ecosystems that utilized wastewater for irrigation.
Author Contributions
Conceptualization, J.K.Q.S. and E.M.; methodology, E.M., and J.K.Q.S.; validation, E.M., J.K.Q.S. and J.D.; formal analysis, J.K.Q.S. and E.M.; investigation, E.M.; resources, J.K.Q.S. and J.D.; data curation, E.M.; writing—original draft preparation, E.M.; writing—review and editing, J.K.Q.S.; visualization, J.K.Q.S.; supervision, J.K.Q.S.; project administration, J.K.Q.S.; funding acquisition, J.K.Q.S. All authors have read and agreed to the published version of the manuscript.
Funding
This research was funded by the USDA National Institute of Food and Agriculture, Hatch project NEV00756.
Acknowledgments
We are thankful for the dedicated assistance of Mr. Tom Lawry throughout the project. The authors would also like to express sincere thanks to James Nagle and Sarah Kidd who helped greatly with fieldwork. This publication is a contribution of the Nevada Agricultural Experiment Station.
Conflicts of Interest
The authors declare no conflict of interest. The funders had no role in the design of the study; in the collection, analyses, or interpretation of data; in the writing of the manuscript, or in the decision to publish the results.
References
- Maaß, O.; Grundmann, P. Added-value from linking the value chains of wastewater treatment, crop production and bioenergy production: A case study on reusing wastewater and sludge in crop production in Braunschweig (Germany). Resour. Conserv. Recycl. 2016, 107, 195–211. [Google Scholar] [CrossRef]
- Craig, C.A.; Feng, S.; Gilbertz, S. Water crisis, drought, and climate change in the southeast United States. Land Use Policy 2019, 88, 104110. [Google Scholar] [CrossRef]
- Khanpae, M.; Karami, E.; Maleksaeidi, H.; Keshavarz, M. Farmers’ attitude towards using treated wastewater for irrigation: The question of sustainability. J. Clean. Prod. 2020, 243, 118541. [Google Scholar] [CrossRef]
- Zvomuya, F.; Gupta, S.C.; Rosen, C.J. Phosphorus Leaching in Sandy Outwash Soils following Potato-Processing Wastewater Application. J. Environ. Qual. 2005, 34, 1277. [Google Scholar] [CrossRef] [PubMed]
- Keremane, G.B.; McKay, J. Successful wastewater reuse scheme and sustainable development: A case study in Adelaide. Water Environ. J. 2007, 21, 83–91. [Google Scholar] [CrossRef]
- Garcia, X.; Pargament, D. Reusing wastewater to cope with water scarcity: Economic, social and environmental considerations for decision-making. Resour. Conserv. Recycl. 2015, 101, 154–166. [Google Scholar] [CrossRef]
- Tran, Q.K.; Jassby, D.; Schwabe, K.A. The implications of drought and water conservation on the reuse of municipal wastewater: Recognizing impacts and identifying mitigation possibilities. Water Res. 2017, 124, 472–481. [Google Scholar] [CrossRef]
- Akhoundi, A.; Nazif, S. Sustainability assessment of wastewater reuse alternatives using the evidential reasoning approach. J. Clean. Prod. 2018, 195, 1350–1376. [Google Scholar] [CrossRef]
- Libutti, A.; Gatta, G.; Gagliardi, A.; Vergine, P.; Pollice, A.; Beneduce, L.; Disciglio, G.; Tarantino, E. Agro-industrial wastewater reuse for irrigation of a vegetable crop succession under Mediterranean conditions. Agric. Water Manag. 2018, 196, 1–14. [Google Scholar] [CrossRef]
- Becerra-Castro, C.; Lopes, A.R.; Vaz-Moreira, I.; Silva, E.F.; Manaia, C.M.; Nunes, O.C. Wastewater reuse in irrigation: A microbiological perspective on implications in soil fertility and human and environmental health. Environ. Int. 2015, 75, 117–135. [Google Scholar] [CrossRef] [Green Version]
- Intriago, J.C.; López-Gálvez, F.; Allende, A.; Vivaldi, G.A.; Camposeo, S.; Nicolás Nicolás, E.; Alarcón, J.J.; Pedrero Salcedo, F. Agricultural reuse of municipal wastewater through an integral water reclamation management. J. Environ. Manag. 2018, 213, 135–141. [Google Scholar] [CrossRef] [PubMed]
- Murray, A.; Ray, I. Wastewater for agriculture: A reuse-oriented planning model and its application in peri-urban China. Water Res. 2010, 44, 1667–1679. [Google Scholar] [CrossRef] [PubMed]
- Angelakis, A.; Marecos Do Monte, M.H.; Bontoux, L.; Asano, T. The status of wastewater reuse practice in the Mediterranean basin: Need for guidelines. Water Res. 1999, 33, 2201–2217. [Google Scholar] [CrossRef]
- Moura, D.R.; Silveira, M.L.; O’Connor, G.A.; Wise, W.R. Long-term reclaimed water application effects on phosphorus leaching potential in rapid infiltration basins. J. Environ. Monit. 2011, 13, 2457. [Google Scholar] [CrossRef] [PubMed]
- Solovchenko, A.; Verschoor, A.M.; Jablonowski, N.D.; Nedbal, L. Phosphorus from wastewater to crops: An alternative path involving microalgae. Biotechnol. Adv. 2016, 34, 550–564. [Google Scholar] [CrossRef] [PubMed]
- Jalali, M.; Jalali, M. Assessment risk of phosphorus leaching from calcareous soils using soil test phosphorus. Chemosphere 2017, 171, 106–117. [Google Scholar] [CrossRef]
- Liu, X.-P.; Bi, Q.-F.; Qiu, L.-L.; Li, K.-J.; Yang, X.-R.; Lin, X.-Y. Increased risk of phosphorus and metal leaching from paddy soils after excessive manure application: Insights from a mesocosm study. Sci. Total Environ. 2019, 666, 778–785. [Google Scholar] [CrossRef]
- MacDonald, G.K.; Bennett, E.M.; Potter, P.A.; Ramankutty, N. Agronomic phosphorus imbalances across the world’s croplands. Proc. Natl. Acad. Sci. USA 2011, 108, 3086–3091. [Google Scholar] [CrossRef] [Green Version]
- Sharpley, A. Managing agricultural phosphorus to minimize water quality impacts. Sci. Agric. 2016, 73, 1–8. [Google Scholar] [CrossRef]
- Motew, M.; Chen, X.; Booth, E.G.; Carpenter, S.R.; Pinkas, P.; Zipper, S.C.; Loheide, S.P.; Donner, S.D.; Tsuruta, K.; Vadas, P.A.; et al. The Influence of Legacy P on Lake Water Quality in a Midwestern Agricultural Watershed. Ecosystems 2017, 20, 1468–1482. [Google Scholar] [CrossRef]
- Jaiswal, D.; Elliott, H.A. Long-Term Phosphorus Fertility in Wastewater-Irrigated Cropland. J. Environ. Qual. 2011, 40, 214. [Google Scholar] [CrossRef] [PubMed]
- Pant, H.K.; Adjei, M.B.; Scholberg, J.M.S.; Chambliss, C.G.; Rechcigl, J.E. Forage production and phosphorus phytoremediation in manure-impacted soils. Agron. J. 2004, 96, 1780–1786. [Google Scholar] [CrossRef] [Green Version]
- Read, J.J.; Sistani, K.R.; Oldham, J.L.; Brink, G.E. Double-cropping annual ryegrass and bermudagrass to reduce phosphorus levels in soil with history of poultry litter application. Nutr. Cycl. Agroecosystems 2009, 84, 93–104. [Google Scholar] [CrossRef]
- Abe, K.; Ozaki, Y. Comparison of useful terrestrial and aquatic plant species for removal of nitrogen and phosphorus from domestic wastewater. Soil Sci. Plant Nutr. 1998, 44, 599–607. [Google Scholar] [CrossRef]
- Vervoort, R.W.; Radcliffe, D.E.; Cabrera, M.L.; Latimore, M. Field-Scale Nitrogen and Phosphorus Losses from Hayfields Receiving Fresh and Composted Broiler Litter. J. Environ. Qual. 1998, 27, 1246. [Google Scholar] [CrossRef]
- Brink, G.E.; Rowe, D.E.; Sistani, K.R. Broiler Litter Application Effects on Yield and Nutrient Uptake of ‘Alicia’ Bermudagrass. Agron. J. 2002, 94, 911. [Google Scholar] [CrossRef] [Green Version]
- Brown, B.D. Winter Cereal–Corn Double Crop Forage Production and Phosphorus Removal. Soil Sci. Soc. Am. J. 2006, 70, 1951. [Google Scholar] [CrossRef] [Green Version]
- Sleugh, B.B.; Gilfillen, R.A.; Willian, W.T.; Henderson, H.D. Nutritive Value and Nutrient Uptake of Sorghum–Sudangrass under Different Broiler Litter Fertility Programs. Agron. J. 2006, 98, 1594. [Google Scholar] [CrossRef] [Green Version]
- Newman, Y.C.; Agyin-Birikorang, S.; Adjei, M.B.; Scholberg, J.M.; Silveira, M.L.; Vendramini, J.M.B.; Rechcigl, J.E.; Sollenberger, L.E.; Chrysostome, M. Enhancing Phosphorus Phytoremedation Potential of Two Warm-Season Perennial Grasses with Nitrogen Fertilization. Agron. J. 2009, 101, 1345. [Google Scholar] [CrossRef]
- Silveira, M.L.; Vendramini, J.M.B.; Sui, X.; Sollenberger, L.E.; O’Connor, G.A. Use of Warm-Season Grasses Managed as Bioenergy Crops for Phytoremediation of Excess Soil Phosphorus. Agron. J. 2013, 105, 95–100. [Google Scholar] [CrossRef]
- Gotcher, M.J.; Zhang, H.; Schroder, J.L.; Payton, M.E. Phytoremediation of soil phosphorus with crabgrass. Agron. J. 2014, 106, 528–536. [Google Scholar] [CrossRef] [Green Version]
- Read, J.J.; Lang, D.J.; Adeli, A.; Jenkins, J.N. Harvest Management Effects on ‘Tifton 44’ Bermudagrass Phosphorus Removal and Nutritive Value. Agron. J. 2018, 110, 879. [Google Scholar] [CrossRef]
- Brink, G.E.; Pederson, G.A.; Sistani, K.R.; Fairbrother, T.E. Uptake of Selected Nutrients by Temperate Grasses and Legumes. Agron. J. 2001, 93, 887–890. [Google Scholar] [CrossRef]
- Evers, G.W. Ryegrass-bermudagrass production and nutrient uptake when combining nitrogen fertilizer with broiler litter. Agron. J. 2002, 94, 905–910. [Google Scholar] [CrossRef]
- Pederson, G.A.; Brink, G.E.; Fairbrother, T.E. Nutrient Uptake in Plant Parts of Sixteen Forages Fertilized with Poultry Litter. Agron. J. 2002, 94, 895. [Google Scholar]
- Timmermans, B.G.H.; van Eekeren, N. Phytoextraction of soil phosphorus by potassium-fertilized grass-clover swards. J. Environ. Qual. 2016, 45, 701–708. [Google Scholar] [CrossRef] [Green Version]
- Aponte, A.; Samarappuli, D.; Berti, M.T. Alfalfa–Grass Mixtures in Comparison to Grass and Alfalfa Monocultures. Agron. J. 2019, 111, 628. [Google Scholar] [CrossRef]
- Cardinale, B.J.; Wright, J.P.; Cadotte, M.W.; Carroll, I.T.; Hector, A.; Srivastava, D.S.; Loreau, M.; Weis, J.J. Impacts of plant diversity on biomass production increase through time because of species complementarity. Proc. Natl. Acad. Sci. USA 2007, 104, 18123–18128. [Google Scholar] [CrossRef] [Green Version]
- Bélanger, G.; Castonguay, Y.; Lajeunesse, J. Benefits of mixing timothy with alfalfa for forage yield, nutritive value, and weed suppression in northern environments. Can. J. Plant Sci. 2014, 94, 51–60. [Google Scholar] [CrossRef] [Green Version]
- Foster, A.; Biligetu, B.; Darambazar, E. Forage Accumulation, Nutritive Value, and Botanical Composition of Grass–Cicer Milkvetch Mixtures under Two Harvest Managements. Crop Sci. 2019, 59, 2876–2885. [Google Scholar] [CrossRef]
- Finn, J.A.; Kirwan, L.; Connolly, J.; Sebastià, M.T.; Helgadottir, A.; Baadshaug, O.H.; Bélanger, G.; Black, A.; Brophy, C.; Collins, R.P.; et al. Ecosystem function enhanced by combining four functional types of plant species in intensively managed grassland mixtures: A 3-year continental-scale field experiment. J. Appl. Ecol. 2013, 50, 365–375. [Google Scholar] [CrossRef] [Green Version]
- Mao, L.; Zhang, L.; Li, W.; van der Werf, W.; Sun, J.; Spiertz, H.; Li, L. Yield advantage and water saving in maize/pea intercrop. F. Crop. Res. 2012, 138, 11–20. [Google Scholar] [CrossRef]
- Zhang, F.; Shen, J.; Zhang, J.; Zuo, Y.; Li, L.; Chen, X. Rhizosphere Processes and Management for Improving Nutrient Use Efficiency and Crop Productivity. In Advances in Agronomy; Academic Press: Cambridge, MA, USA, 2010; pp. 1–32. [Google Scholar]
- Shen, J.; Yuan, L.; Zhang, J.; Li, H.; Bai, Z.; Chen, X.; Zhang, W.; Zhang, F. Phosphorus Dynamics: From Soil to Plant. Plant Physiol. 2011, 156, 997–1005. [Google Scholar] [CrossRef] [PubMed] [Green Version]
- SAS Institute The SAS system for Windows 9.4; SAS Institute Inc.: Cary, NC, USA, 2015.
- Littell, R.C.; Milliken, G.A.; Stroup, W.W.; Wolfinger, R.D. Analysis of repeated measures data. In SAS Systems for Mixed Models; SAS Institute Inc.: Cary, NC, USA, 1996. [Google Scholar]
- Obour, A.K.; Vendramini, J.M.B.; Silveira, M.L.; Sollenberger, L.E.; O’Connor, G.A.; Jawitz, J.W. Phosphorus Fertilization Responses on Bahiagrass Pastures: Forage Production and Water Quality. Agron. J. 2011, 103, 324–330. [Google Scholar] [CrossRef]
- Hasan, M.M.; Hasan, M.M.; Teixeira da Silva, J.A.; Li, X. Regulation of phosphorus uptake and utilization: Transitioning from current knowledge to practical strategies. Cell. Mol. Biol. Lett. 2016, 21, 7. [Google Scholar] [CrossRef] [PubMed] [Green Version]
- Cayuela, M.L.; van Zwieten, L.; Singh, B.P.; Jeffery, S.; Roig, A.; Sánchez-Monedero, M.A. Biochar’s role in mitigating soil nitrous oxide emissions: A review and meta-analysis. Agric. Ecosyst. Environ. 2014, 191, 5–16. [Google Scholar] [CrossRef]
- Bork, E.W.; Gabruck, D.T.; McLeod, E.M.; Hall, L.M. Five-Year Forage Dynamics Arising from Four Legume-Grass Seed Mixes. Agron. J. 2017, 109, 2789–2799. [Google Scholar] [CrossRef]
- Solomon, J.K.Q.; Macoon, B.; Lang, D.J.; Parish, J.A.; Vann, R.C. A novel approach to grass–legume management. Crop Sci. 2011, 51, 1865–1876. [Google Scholar] [CrossRef]
- Cox, S.; Peel, M.D.; Creech, J.E.; Waldron, B.L.; Eun, J.S.; Zobell, D.R.; Miller, R.L.; Snyder, D.L. Forage production of grass–legume binary mixtures on intermountain western USA irrigated pastures. Crop Sci. 2017, 57, 1742–1753. [Google Scholar] [CrossRef]
- Andrews, J.S.; Sanders, Z.P.; Cabrera, M.L.; Hill, N.S.; Radcliffe, D.E. Simulated nitrate leaching in annually cover cropped and perennial living mulch corn production systems. J. Soil Water Conserv. 2020, 75, 91–102. [Google Scholar] [CrossRef] [Green Version]
- Sleugh, B.; Moore, K.J.; George, J.R.; Brummer, E.C. Binary Legume-Grass Mixtures Improve Forage Yield, Quality, and Seasonal Distribution. Agron. J. 2000, 92, 24–29. [Google Scholar] [CrossRef]
- Leep, R.; Jeranyama, P.; Min, D.-H.; Dietz, T.; Bughrara, S.; Isleib, J. Grazing Effects on Herbage Mass and Composition in Grass-Birdsfoot Trefoil Mixtures. Agron. J. 2002, 94, 1257–1262. [Google Scholar] [CrossRef]
- Bélanger, G.; Tremblay, G.F.; Seguin, P.; Lajeunesse, J.; Bittman, S.; Hunt, D. Cutting management of alfalfa-based mixtures in contrasting agroclimatic regions. Agron. J. 2020. [Google Scholar] [CrossRef]
- Adjesiwor, A.T.; Islam, M.A.; Zheljazkov, V.D.; Ritten, J.P.; Garcia y Garcia, A. Grass–legume Seed Mass Ratios and Nitrogen Rates Affect Forage Accumulation, Nutritive Value, and Profitability. Crop Sci. 2017, 57, 2852–2864. [Google Scholar] [CrossRef]
- Sanderson, M.A.; Brink, G.; Stout, R.; Ruth, L. Grass–Legume Proportions in Forage Seed Mixtures and Effects on Herbage Yield and Weed Abundance. Agron. J. 2013, 105, 1289–1297. [Google Scholar] [CrossRef] [Green Version]
- Tracy, B.F.; Sanderson, M.A. Productivity and Stability Relationships in Mowed Pasture Communities of Varying Species Composition. Crop Sci. 2004, 44, 2180–2186. [Google Scholar] [CrossRef]
- Orloff, S.B.; Brummer, E.C.; Shrestha, A.; Putnam, D.H. Cool-Season Perennial Grasses Differ in Tolerance to Partial-Season Irrigation Deficits. Agron. J. 2016, 108, 692–700. [Google Scholar] [CrossRef]
- Davison, J.; Solomon, J.K.; Lawry, T. Alfalfa Variety Trial in Western Nevada, Initial Results; University of University of Nevada, Reno, Extension: Reno, NV, USA, 2016. [Google Scholar]
- White, J.; Lemus, R.; Saunders, J.R.; Rivera, D.; Brett, R. Mississippi Perennial Cool-Season Forage Crop Variety Trials, 2016; MAFES Information Bulletin 522: Mississippi, MA, USA, 2017. [Google Scholar]
- Springer, T.L.; Aiken, G.E. Harvest frequency effects on white clover forage biomass, quality, and theoretical ethanol yield. Biomass Bioenergy 2015, 78, 1–5. [Google Scholar] [CrossRef]
- Tracy, B.F.; Albrecht, K.; Flores, J.; Hall, M.; Islam, A.; Jones, G.; Lamp, W.; MacAdam, J.W.; Skinner, H.; Teutsch, C. Evaluation of Alfalfa-Tall Fescue Mixtures across Multiple Environments. Crop Sci. 2016, 56, 2026–2034. [Google Scholar] [CrossRef]
- Minneé, E.M.K.; McCready, T.B.; Woodward, S.L. Herbage production, botanical composition and survival of perennial ryegrass- and tall fescue-based swards in simple and diverse species mixtures in a dryland environment. Anim. Prod. Sci. 2017, 57, 1405. [Google Scholar] [CrossRef]
- Berdahl, J.D.; Karn, J.F.; Hendrickson, J.R. Dry Matter Yields of Cool-Season Grass Monocultures and Grass-Alfalfa Binary Mixtures. Agron. J. 2001, 93, 463–467. [Google Scholar] [CrossRef] [Green Version]
- Bélanger, G.; Brégard, A.; Michaud, R. Phosphorous Uptake and Concentration of Timothy Genotypes under Varying N Applications. Crop Sci. 2002, 42, 2044–2048. [Google Scholar] [CrossRef]
- Foster, A.; Vera, C.L.; Malhi, S.S.; Clarke, F.R. Forage yield of simple and complex grass–legume mixtures under two management strategies. Can. J. Plant Sci. 2014, 94, 41–50. [Google Scholar] [CrossRef]
- Ketterings, Q.M.; Godwin, G.; Kilcer, T.F.; Barney, P.; Hunter, M.; Cherney, J.H.; Beer, S. Nitrogen, phosphorus, potassium, magnesium and calcium removal by brown midrib sorghum sudangrass in the northeastern USA. J. Agron. Crop Sci. 2006, 192, 408–416. [Google Scholar] [CrossRef] [Green Version]
- Brink, G.E.; Sistani, K.R.; Oldham, J.L.; Kingery, W.E.; Johnson, B. Broiler Litter Application Rate Effects on Bermudagrass Nutrient Uptake and Phosphorus Level of Soils Differing in Application History. J. Sustain. Agric. 2008, 31, 79–94. [Google Scholar] [CrossRef]
- Dubeux, J.C.B.; Sollenberger, L.E.; Mathews, B.W.; Scholberg, J.M.; Santos, H.Q. Nutrient Cycling in Warm-Climate Grasslands. Crop Sci. 2007, 47, 915–928. [Google Scholar] [CrossRef]
- Dou, Z.; Galligan, D.T.; Ramberg, C.F.; Meadows, C.; Ferguson, J.D. A Survey of Dairy Farming in Pennsylvania: Nutrient Management Practices and Implications. J. Dairy Sci. 2001, 84, 966–973. [Google Scholar] [CrossRef]
- Higgins, S.; Schellberg, J.; Bailey, J.S. Improving productivity and increasing the efficiency of soil nutrient management on grassland farms in the UK and Ireland using precision agriculture technology. Eur. J. Agron. 2019, 106, 67–74. [Google Scholar] [CrossRef]
- Guo, Y.Q.; Tong, B.X.; Wu, Z.G.; Ma, W.Q.; Ma, L. Dietary manipulation to reduce nitrogen and phosphorus excretion by dairy cows. Livest. Sci. 2019, 228, 61–66. [Google Scholar] [CrossRef]
- Wei, S.; Bai, Z.H.; Qin, W.; Wu, Z.G.; Jiang, R.F.; Ma, L. Nutrient use efficiencies, losses, and abatement strategies for peri-urban dairy production systems. J. Environ. Manag. 2018, 228, 232–238. [Google Scholar] [CrossRef]
Figure 1.
Annual monthly weather data and 30-year average at University of Nevada, Reno, Main Station Field Laboratory, Reno NV, USA.
Figure 1.
Annual monthly weather data and 30-year average at University of Nevada, Reno, Main Station Field Laboratory, Reno NV, USA.
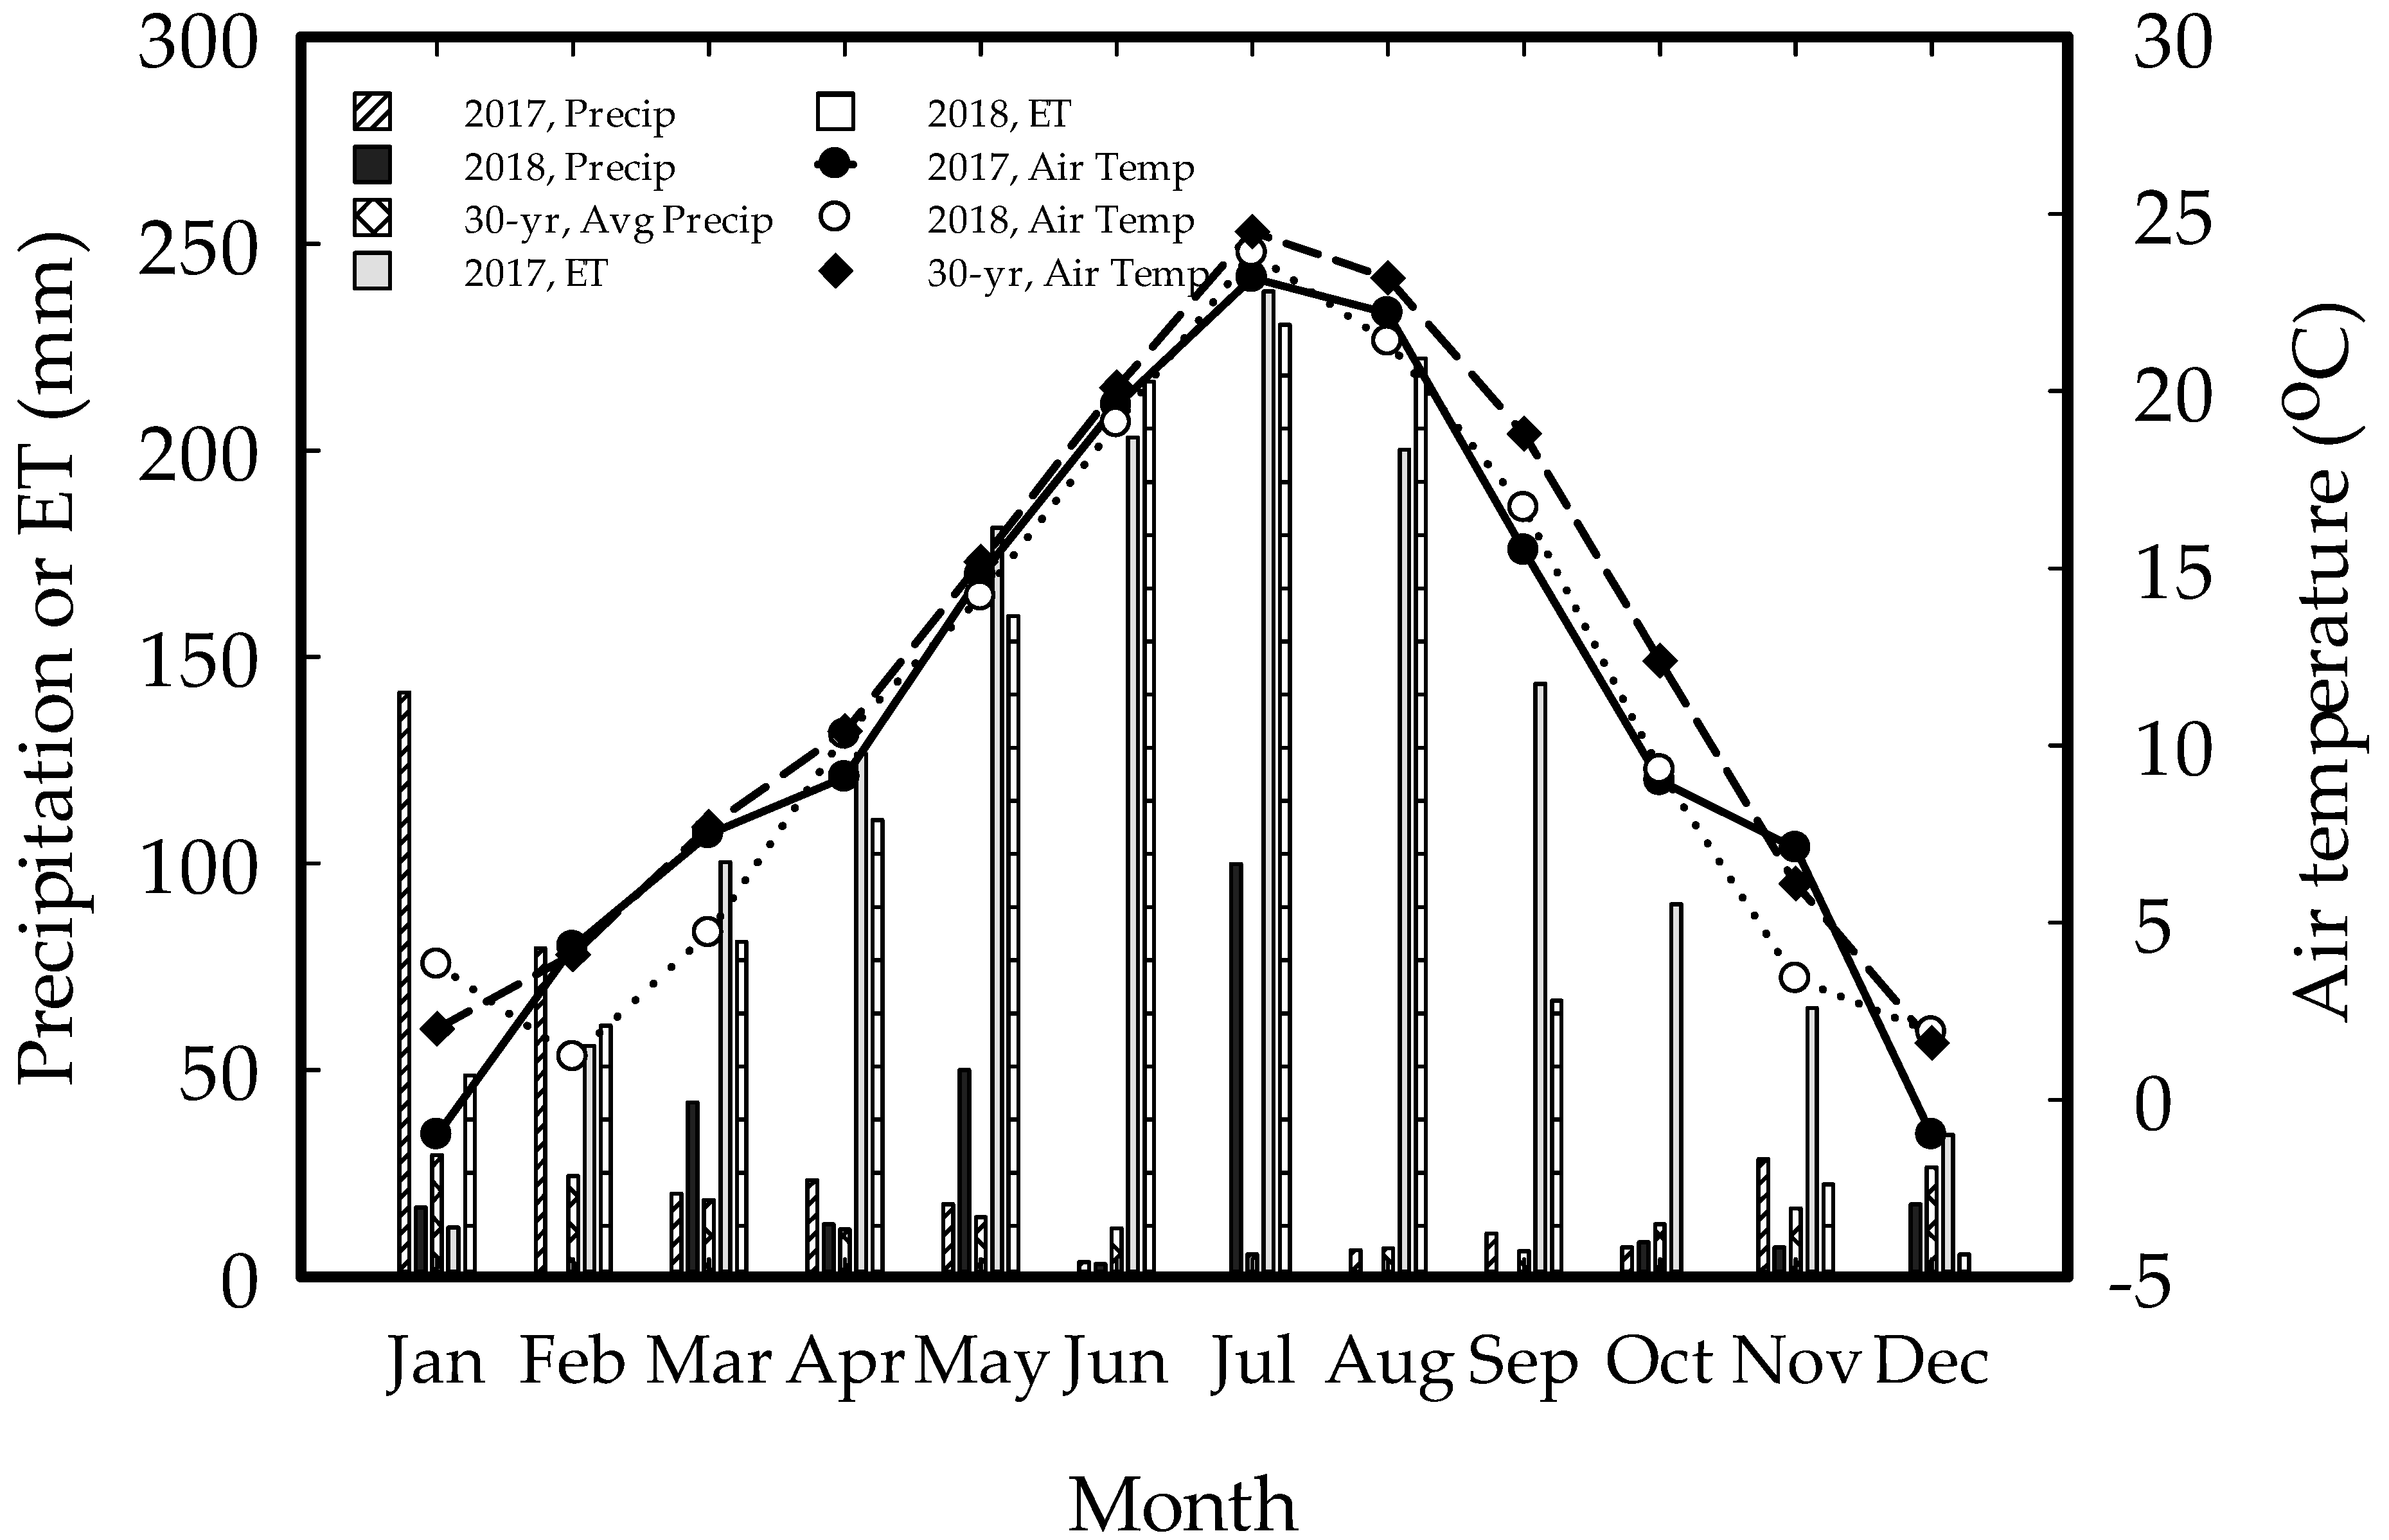
Figure 2.
Tissue phosphorus concentration as affected by grouped forage system at the Main Station Field Laboratory Reno, NV (2017 and 2018). Bars with the same lowercase letter are not different (P > 0.05).
Figure 2.
Tissue phosphorus concentration as affected by grouped forage system at the Main Station Field Laboratory Reno, NV (2017 and 2018). Bars with the same lowercase letter are not different (P > 0.05).

Table 1.
Forage system seeding rates.
| Forage System | Seeding Rate (PLS †) kg ha−1 | |
|---|---|---|
| Grass monoculture | ||
| Tall Fescue ‘BarOptima Plus E34’ | 15.0 15.0 | |
| Tall Fescue ‘Fawn’ | ||
| Legume monoculture | ||
| Alfalfa ‘AmeriStand 403T Plus’ | 20.0 12.0 5.0 | |
| Red clover ‘Freedom’ | ||
| White clover ‘Barblanca’ | ||
| Grass–legume mixtures | Grass (25%) | Legumes (75%) |
| 1) Tall Fescue ‘BarOptima Plus E34’ + Alfalfa ‘Ameristand 403T Plus’ | 5.0 | 11.3 |
| 2) Tall Fescue ‘BarOptima Plus E34’ + Red clover ‘Freedom’ | 5.0 | 9 |
| 3) Tall Fescue ‘BarOptima Plus E34’ + White clover ‘Barblanca’ | 5.0 | 3.8 |
| Grass (50%) | Legumes (50%) | |
| 4) Tall Fescue ‘BarOptima Plus E34’ + Alfalfa ‘Ameristand 403T Plus’ | 7.5 | 10.0 |
| 5) Tall Fescue ‘BarOptima Plus E34’ + Red clover ‘Freedom’ | 7.5 | 6.0 |
| 6) Tall Fescue ‘BarOptima Plus E34’ + White clover ‘Barblanca’ | 7.5 | 2.5 |
| Grass (75%) | Legumes (25%) | |
| 7) Tall Fescue ‘BarOptima Plus E34’ + Alfalfa ‘Ameristand 403T Plus’ | 11.3 | 5.0 |
| 8) Tall Fescue ‘BarOptima Plus E34’ + Red clover ‘Freedom’ | 11.3 | 3.0 |
| 9) Tall Fescue ‘BarOptima Plus E34’ + White clover ‘Barblanca’ | 11.3 | 1.3 |
| Grass (25%) | Legumes (75%) | |
| 10) Tall Fescue ‘Fawn’ + Alfalfa ‘Ameristand 403T Plus’ | 5.0 | 11.3 |
| 11) Tall Fescue ‘Fawn’ + Red clover ‘Freedom’ | 5.0 | 9 |
| 12) Tall Fescue Fawn + White clover ‘Barblanca’ | 5.0 | 3.8 |
| Grass (50%) | Legumes (50%) | |
| 13) Tall Fescue ‘Fawn’ + Alfalfa ‘Ameristand 403T Plus’ | 7.5 | 10.0 |
| 14) Tall Fescue ‘Fawn’ + Red clover ‘Freedom’ | 7.5 | 6.0 |
| 15) Tall Fescue’ Fawn’ + White clover ‘Barblanca’ | 7.5 | 2.5 |
| Grass (75%) | Legumes (25%) | |
| 16) Tall Fescue ‘Fawn’ + Alfalfa ‘Ameristand 403T Plus’ | 11.3 | 5.0 |
| 17) Tall Fescue’ Fawn’ + Red clover ‘Freedom’ | 11.3 | 3.0 |
| 18) Tall Fescue ‘Fawn’ + White clover ‘Barblanca’ | 11.3 | 1.3 |
† Pure Live Seed.
Table 2.
Annual herbage accumulation of different forage systems evaluated at the University of Nevada, Reno Main Station Field Laboratory during the 2017 and 2018 spring–summer growing season.
Table 2.
Annual herbage accumulation of different forage systems evaluated at the University of Nevada, Reno Main Station Field Laboratory during the 2017 and 2018 spring–summer growing season.
| Forage System | Year | SE | P-Value ‡ | |
|---|---|---|---|---|
| 2017 | 2018 | |||
| Grass monoculture | -----Mg DM ha−1--- | |||
| Tall fescue cv. BarOptima Plus E34 | 8.4a † | 12.6ab | 1.1 | 0.001 |
| Tall fescue cv. Fawn | 8.4a | 12.2abc | 1.1 | 0.004 |
| Legume monoculture | ||||
| Alfalfa cv. Ameristand 403T Plus | 5.1cde | 3.0g | 1.1 | 0.163 |
| Red clover cv. Freedom | 5.5bcde | 3.7g | 1.1 | 0.179 |
| White clover cv. Barblanca | 4.0e | 4.5g | 1.1 | 0.721 |
| Grass–legume mixtures | ||||
| 1) Tall fescue cv. BarOptima Plus E34 (25) Alfalfa cv. Ameristand 403T Plus (75) § | 7.0abcd | 9.4ef | 1.1 | 0.061 |
| 2) Tall fescue cv. BarOptima Plus E34 (25) Red clover cv. Freedom (75) | 7.4abc | 9.6def | 1.1 | 0.105 |
| 3) Tall fescue cv. BarOptima Plus E34 (25) White clover cv. Barblanca (75) | 5.6bcde | 10.4bcdef | 1.1 | 0.001 |
| 4) Tall fescue cv. BarOptima Plus E34 (50) Alfalfa cv. Ameristand 403T Plus (50) | 5.5bcde | 10.6bcdef | 1.1 | 0.001 |
| 5) Tall fescue cv. BarOptima Plus E34 (50) Red clover cv. Freedom(50) | 6.9abcd | 11.9abcde | 1.1 | 0.001 |
| 6) Tall fescue cv. BarOptima Plus E34 (50) White clover cv. Barblanca (50) | 5.2cde | 13.2a | 1.1 | <0.001 |
| 7) Tall fescue cv. BarOptima Plus E34 (75) Alfalfa cv. Ameristand 403T Plus (25) | 5.6bcde | 11.5abcde | 1.1 | <0.001 |
| 8) Tall fescue cv. BarOptima Plus E34 (75) Red clover cv. Freedom (25) | 6.6abcde | 12.1abcd | 1.1 | <0.001 |
| 9) Tall fescue cv. BarOptima Plus E34 (75) White clover cv. Barblanca (25) | 6.4abcde | 11.1abcdef | 1.1 | 0.001 |
| 10) Tall fescue cv. Fawn (25) Alfalfa cv. Ameristand 403T Plus (75) | 5.2cde | 10.5bcdef | 1.1 | <0.001 |
| 11) Tall fescue cv. Fawn (25) Red clover cv. Freedom (75) | 6.6abcde | 8.8f | 1.1 | 0.097 |
| 12) Tall fescue cv. Fawn (25) White clover cv. Barblanca (75) | 4.5de | 11.4abcde | 1.1 | <0.001 |
| 13) Tall fescue cv. Fawn (50) Alfalfa cv. Ameristand 403T Plus (50) | 8.1ab | 10.2bcdef | 1.1 | 0.135 |
| 14) Tall fescue cv. Fawn (50) Red clover cv. Freedom (50) | 5.1cde | 11.1abcdef | 1.1 | <0.001 |
| 15) Tall fescue cv. Fawn (50) White clover cv. Barblanca (50) | 6.0bcde | 11.7abcde | 1.1 | <0.001 |
| 16) Tall fescue cv. Fawn (75) Alfalfa cv. Ameristand 403T Plus (25) | 7.5abc | 10.7abcdef | 1.1 | 0.012 |
| 17) Tall fescue cv. Fawn (75) Red clover cv. Freedom (25) | 7.4abc | 12.0abcde | 1.1 | 0.001 |
| 18) Tall fescue cv. Fawn (75) White clover cv. Barblanca (25) | 7.3abc | 9.8cdef | 1.1 | 0.048 |
† Means with the same lowercase letter superscripts within each column are not different (P > 0.05). ‡ Within rows, P-value signifies differences between years. § Number in parentheses indicates the percent of forage species based on its full seeding rate in the grass–legume mixtures.
Table 3.
Annual herbage accumulation of grouped forage systems evaluated at the University of Nevada, Reno Main Station Field Laboratory during the 2017 and 2018 spring-summer growing season.
Table 3.
Annual herbage accumulation of grouped forage systems evaluated at the University of Nevada, Reno Main Station Field Laboratory during the 2017 and 2018 spring-summer growing season.
| Grouped Forage Systems | Year | SE | P-Value ‡ | |
|---|---|---|---|---|
| 2017 | 2018 | |||
| --------Mg DM ha−1------- | ||||
| Grass | 8.6a † | 12.7a | 0.8 | 0.003 |
| Legume | 5.0b | 3.8c | 0.8 | 0.312 |
| Grass (25) Legume (75) § | 6.1b | 10.1b | 0.8 | <0.001 |
| Grass (50) Legume (50) | 6.1b | 11.5ab | 0.8 | <0.001 |
| Grass (75) Legume (25) | 6.8ab | 12.7a | 0.8 | <0.001 |
† Means with the same lowercase letter superscripts within each column are not different (P > 0.05). ‡ Within rows, P-value signifies differences between years. § Number in parentheses indicates the percent of forage species based on its full seeding rate in the grass–legume mixtures.
Table 4.
Tissue phosphorus concentration as affected by forage system and year at the Main Station Field Laboratory, Reno, NV.
Table 4.
Tissue phosphorus concentration as affected by forage system and year at the Main Station Field Laboratory, Reno, NV.
| Forage System | Year | SE | P-Value ‡ | |
|---|---|---|---|---|
| 2017 | 2018 | |||
| Grass monoculture | ------P g kg−1------ | |||
| Tall fescue cv. BarOptima Plus E34 | 8.5cdef † | 5.3c | 0.44 | <0.001 |
| Tall fescue cv. Fawn | 8.1def | 5.4bc | 0.44 | <0.002 |
| Legume monoculture | ||||
| Alfalfa cv. Ameristand 403T Plus | 10.9a | 5.9abc | 0.44 | <0.002 |
| Red clover cv. Freedom | 9.0bcd | 6.9a | 0.44 | <0.002 |
| White clover cv. Barblanca | 11.3a | 6.3ab | 0.44 | <0.002 |
| Grass–legume mixtures | ||||
| 1) Tall fescue cv. BarOptima Plus E34 (25) Alfalfa cv. Ameristand 403T Plus (75)§ | 9.0bcd | 5.6bc | 0.44 | <0.002 |
| 2) Tall fescue cv. BarOptima Plus E34 (25) Red clover cv. Freedom (75) | 8.9bcde | 5.2c | 0.44 | <0.002 |
| 3) Tall fescue cv. BarOptima Plus E34 (25) White clover cv. Barblanca (75) | 8.8bcdef | 5.5bc | 0.44 | <0.002 |
| 4) Tall fescue cv. BarOptima Plus E34 (50) Alfalfa cv. Ameristand 403T Plus (50) | 9.6b | 5.7bc | 0.44 | <0.002 |
| 5) Tall fescue cv. BarOptima Plus E34 (50) Red clover cv. Freedom(50) | 8.6cdef | 5.1c | 0.44 | <0.002 |
| 6) Tall fescue cv. BarOptima Plus E34 (50) White clover cv. Barblanca (50) | 7.8f | 5.3c | 0.44 | <0.002 |
| 7) Tall fescue cv. BarOptima Plus E34 (75) Alfalfa cv. Ameristand 403T Plus (25) | 8.5cdef | 5.7bc | 0.44 | <0.002 |
| 8) Tall fescue cv. BarOptima Plus E34 (75) Red clover cv. Freedom (25) | 9.0bcd | 5.9abc | 0.44 | <0.002 |
| 9) Tall fescue cv. BarOptima Plus E34 (75) White clover cv. Barblanca (25) | 8.9bcde | 5.5bc | 0.44 | <0.002 |
| 10) Tall fescue cv. Fawn (25) Alfalfa cv. Ameristand 403T Plus (75) | 9.3bc | 5.4bc | 0.44 | <0.002 |
| 11) Tall fescue cv. Fawn (25) Red clover cv. Freedom (75) | 7.9ef | 5.4bc | 0.44 | <0.002 |
| 12) Tall fescue cv. Fawn (25) White clover cv. Barblanca (75) | 8.7bcdef | 5.0c | 0.44 | <0.002 |
| 13) Tall fescue cv. Fawn (50) Alfalfa cv. Ameristand 403T Plus (50) | 8.2def | 5.6bc | 0.44 | <0.002 |
| 14) Tall fescue cv. Fawn (50) Red clover cv. Freedom (50) | 8.0ef | 5.6bc | 0.44 | <0.002 |
| 15) Tall fescue cv. Fawn (50) White clover cv. Barblanca (50) | 8.9bcde | 5.4bc | 0.44 | <0.002 |
| 16) Tall fescue cv. Fawn (75) Alfalfa cv. Ameristand 403T Plus (25) | 7.9ef | 5.1c | 0.44 | <0.002 |
| 17) Tall fescue cv. Fawn (75) Red clover cv. Freedom (25) | 8.9bcde | 5.8abc | 0.44 | <0.002 |
| 18) Tall fescue cv. Fawn (75) White clover cv. Barblanca (25) | 8.1def | 5.2c | 0.44 | <0.002 |
† Means followed by the same lowercase letter superscripts are not different within columns (P > 0.0). ‡ Within rows, P-value signifies differences between years. § Number in parentheses indicates the percent of forage species based on its full seeding rate in the grass–legume mixtures.
Table 5.
Annual phosphorus removal by different forage systems at the Main Station Field Laboratory Reno, NV.
Table 5.
Annual phosphorus removal by different forage systems at the Main Station Field Laboratory Reno, NV.
| Forage System | Year | SE | P-Value ‡ | Total | |
|---|---|---|---|---|---|
| 2017 | 2018 | ||||
| Grass monoculture | ---------kg P ha−1---- | ||||
| Tall fescue cv. BarOptima Plus E34 | 33.2a † | 34.2abc | 3.7 | 0.829 | 67.4a |
| Tall fescue cv. Fawn | 32.9a | 34.4abc | 3.7 | 0.737 | 67.4a |
| Legume monoculture | |||||
| Alfalfa cv. Ameristand 403T Plus | 25.1abcdef | 7.9e | 3.7 | 0.001 | 32.7e |
| Red clover cv. Freedom | 21.8cdef | 12.5e | 3.7 | 0.035 | 34.3e |
| White clover cv. Barblanca | 22.4bcdef | 13.9e | 3.7 | 0.075 | 35.1de |
| Grass–legume mixtures | |||||
| 1) Tall fescue cv. BarOptima Plus E34 (25) Alfalfa cv. Ameristand 403T Plus (75) § | 27.8abcd | 27.1bcd | 3.7 | 0.887 | 54.9bc |
| 2) Tall fescue cv. BarOptima Plus E34 (25) Red clover cv. Freedom (75) | 30.2abc | 25.8cd | 3.7 | 0.349 | 57.2abc |
| 3) Tall fescue cv. BarOptima Plus E34 (25) White clover cv. Barblanca (75) | 23.3bcdef | 28.8abcd | 3.7 | 0.251 | 49.4c |
| 4) Tall fescue cv. BarOptima Plus E34 (50) Alfalfa cv. Ameristand 403T Plus (50) | 26.2abcdef | 31.3abcd | 3.7 | 0.247 | 57.5abc |
| 5) Tall fescue cv. BarOptima Plus E34 (50) Red clover cv. Freedom(50) | 27.6abcde | 31.0abcd | 3.7 | 0.443 | 58.5abc |
| 6) Tall fescue cv. BarOptima Plus E34 (50) White clover cv. Barblanca (50) | 18.7f | 35.6ab | 3.7 | 0.001 | 54.3bc |
| 7) Tall fescue cv. BarOptima Plus E34 (75) Alfalfa cv. Ameristand 403T Plus (25) | 22.9bcdef | 33.8abc | 3.7 | 0.015 | 56.7abc |
| 8) Tall fescue cv. BarOptima Plus E34 (75) Red clover cv. Freedom (25) | 28.7abc | 37.4a | 3.7 | 0.048 | 66.1ab |
| 9) Tall fescue cv. BarOptima Plus E34 (75) White clover cv. Barblanca (25) | 27.4abcdef | 31.4abcd | 3.7 | 0.360 | 58.7abc |
| 10) Tall fescue cv. Fawn (25) Alfalfa cv. Ameristand 403T Plus (75) | 21.6cdef | 28.2bcd | 3.7 | 0.135 | 49.9c |
| 11) Tall fescue cv. Fawn (25) Red clover cv. Freedom (75) | 24.0bcdef | 23.9d | 3.7 | 0.968 | 47.9cd |
| 12) Tall fescue cv. Fawn (25) White clover cv. Barblanca (75) | 19.0ef | 28.7bcd | 3.7 | 0.030 | 47.7cd |
| 13) Tall fescue cv. Fawn (50) Alfalfa cv. Ameristand 403T Plus (50) | 32.0ab | 28.7cd | 3.7 | 0.476 | 56.2bc |
| 14) Tall fescue cv. Fawn (50) Red clover cv. Freedom (50) | 19.9def | 32.4abcd | 3.7 | 0.005 | 52.2c |
| 15) Tall fescue cv. Fawn (50) White clover cv. Barblanca (50) | 25.2abcdef | 32.3abcd | 3.7 | 0.111 | 57.5abc |
| 16) Tall fescue cv. Fawn (75) Alfalfa cv. Ameristand 403T Plus (25) | 28.0abcd | 27.4bcd | 3.7 | 0.891 | 55.3bc |
| 17) Tall fescue cv. Fawn (75) Red clover cv. Freedom (25) | 30.8ab | 34.4abc | 3.7 | 0.407 | 65.1ab |
| 18) Tall fescue cv. Fawn (75) White clover cv. Barblanca (25) | 27.8abcd | 26.4cd | 3.7 | 0.754 | 54.3c |
| SEM | 6.2 | ||||
† Means followed by the same lowercase letter superscripts within columns are not different (P > 0.05). ‡ Within rows, P-value signifies differences between years. § Number in parentheses indicates the percent of forage species based on its full seeding rate in the grass–legume mixtures.
Table 6.
Annual phosphorus removal by grouped forage systems at the Main Station Field Laboratory Reno, NV.
Table 6.
Annual phosphorus removal by grouped forage systems at the Main Station Field Laboratory Reno, NV.
| Grouped Forage Systems | Year | SE | P-Value ‡ | Total | |
|---|---|---|---|---|---|
| 2017 | 2018 | ||||
| -----kg P ha−1---- | kg P ha−1 | ||||
| Grass | 34.5a † | 35.4a | 2.8 | 0.856 | 67.4a |
| Legume | 23.5b | 11.8c | 2.8 | 0.006 | 34.0c |
| Grass (25) Legume (75) § | 24.2b | 27.2b | 2.8 | 0.326 | 51.0b |
| Grass (50) Legume (50) | 24.6b | 31.8ab | 2.8 | 0.019 | 56.0ab |
| Grass (75) Legume (25) | 27.7ab | 31.3ab | 2.8 | 0.856 | 59.4ab |
| SEM | 4.7 | ||||
† Means followed by the same lowercase letter superscripts within columns are not different (P > 0.05). ‡ Within rows, P-value signifies differences between years. § Number in parentheses indicates the percent of forage species based on its full seeding rate in the grass–legume mixtures.
© 2020 by the authors. Licensee MDPI, Basel, Switzerland. This article is an open access article distributed under the terms and conditions of the Creative Commons Attribution (CC BY) license (http://creativecommons.org/licenses/by/4.0/).
Share and Cite
MDPI and ACS Style
Mclennon, E.; Solomon, J.K.Q.; Davison, J. Grass–Legume Forage Systems Effect on Phosphorus Removal from a Grassland Historically Irrigated with Reclaimed Wastewater. Sustainability 2020, 12, 2256. https://doi.org/10.3390/su12062256
AMA Style
Mclennon E, Solomon JKQ, Davison J. Grass–Legume Forage Systems Effect on Phosphorus Removal from a Grassland Historically Irrigated with Reclaimed Wastewater. Sustainability. 2020; 12(6):2256. https://doi.org/10.3390/su12062256
Chicago/Turabian StyleMclennon, Everald, Juan K. Q. Solomon, and Jason Davison. 2020. "Grass–Legume Forage Systems Effect on Phosphorus Removal from a Grassland Historically Irrigated with Reclaimed Wastewater" Sustainability 12, no. 6: 2256. https://doi.org/10.3390/su12062256
Note that from the first issue of 2016, this journal uses article numbers instead of page numbers. See further details here.