Determination of the Peak Hour Ridership of Metro Stations in Xi’an, China Using Geographically-Weighted Regression

Abstract
1. Introduction
2. Literature Review
3. Data Sources and Variables
3.1. Data Sources
3.2. Dependent Variable
3.3. Independent Variable Selection
3.3.1. Built Environment
3.3.2. Distance to the City Center
3.3.3. Betweenness Centrality
3.4. Summary of Variables
4. Methodology
5. Results and Discussion
5.1. Spatial Autocorrelation and Local Collinearity Test
5.2. Results
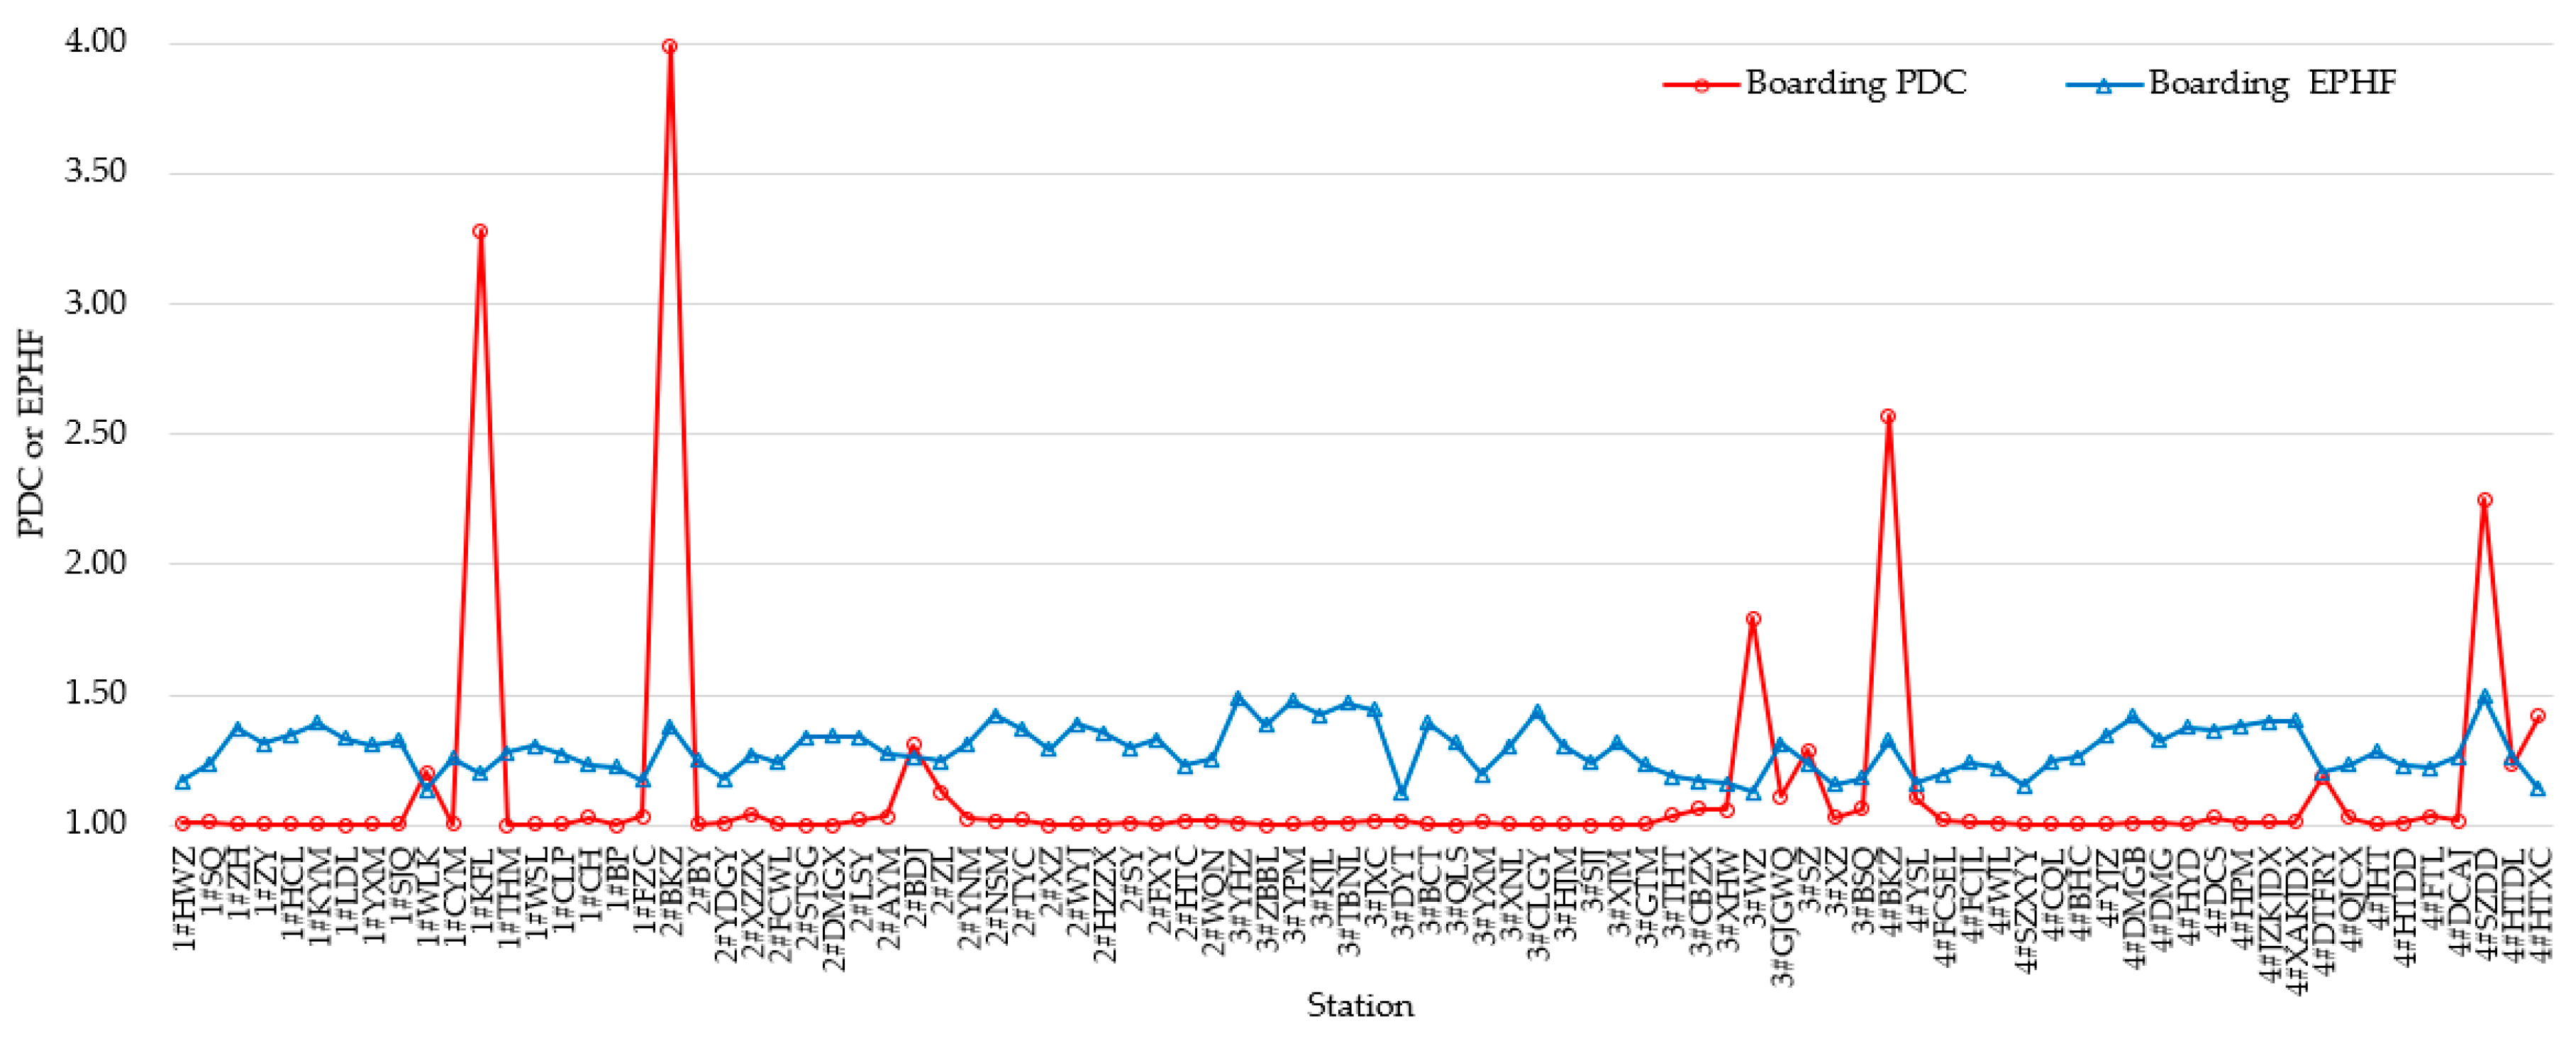
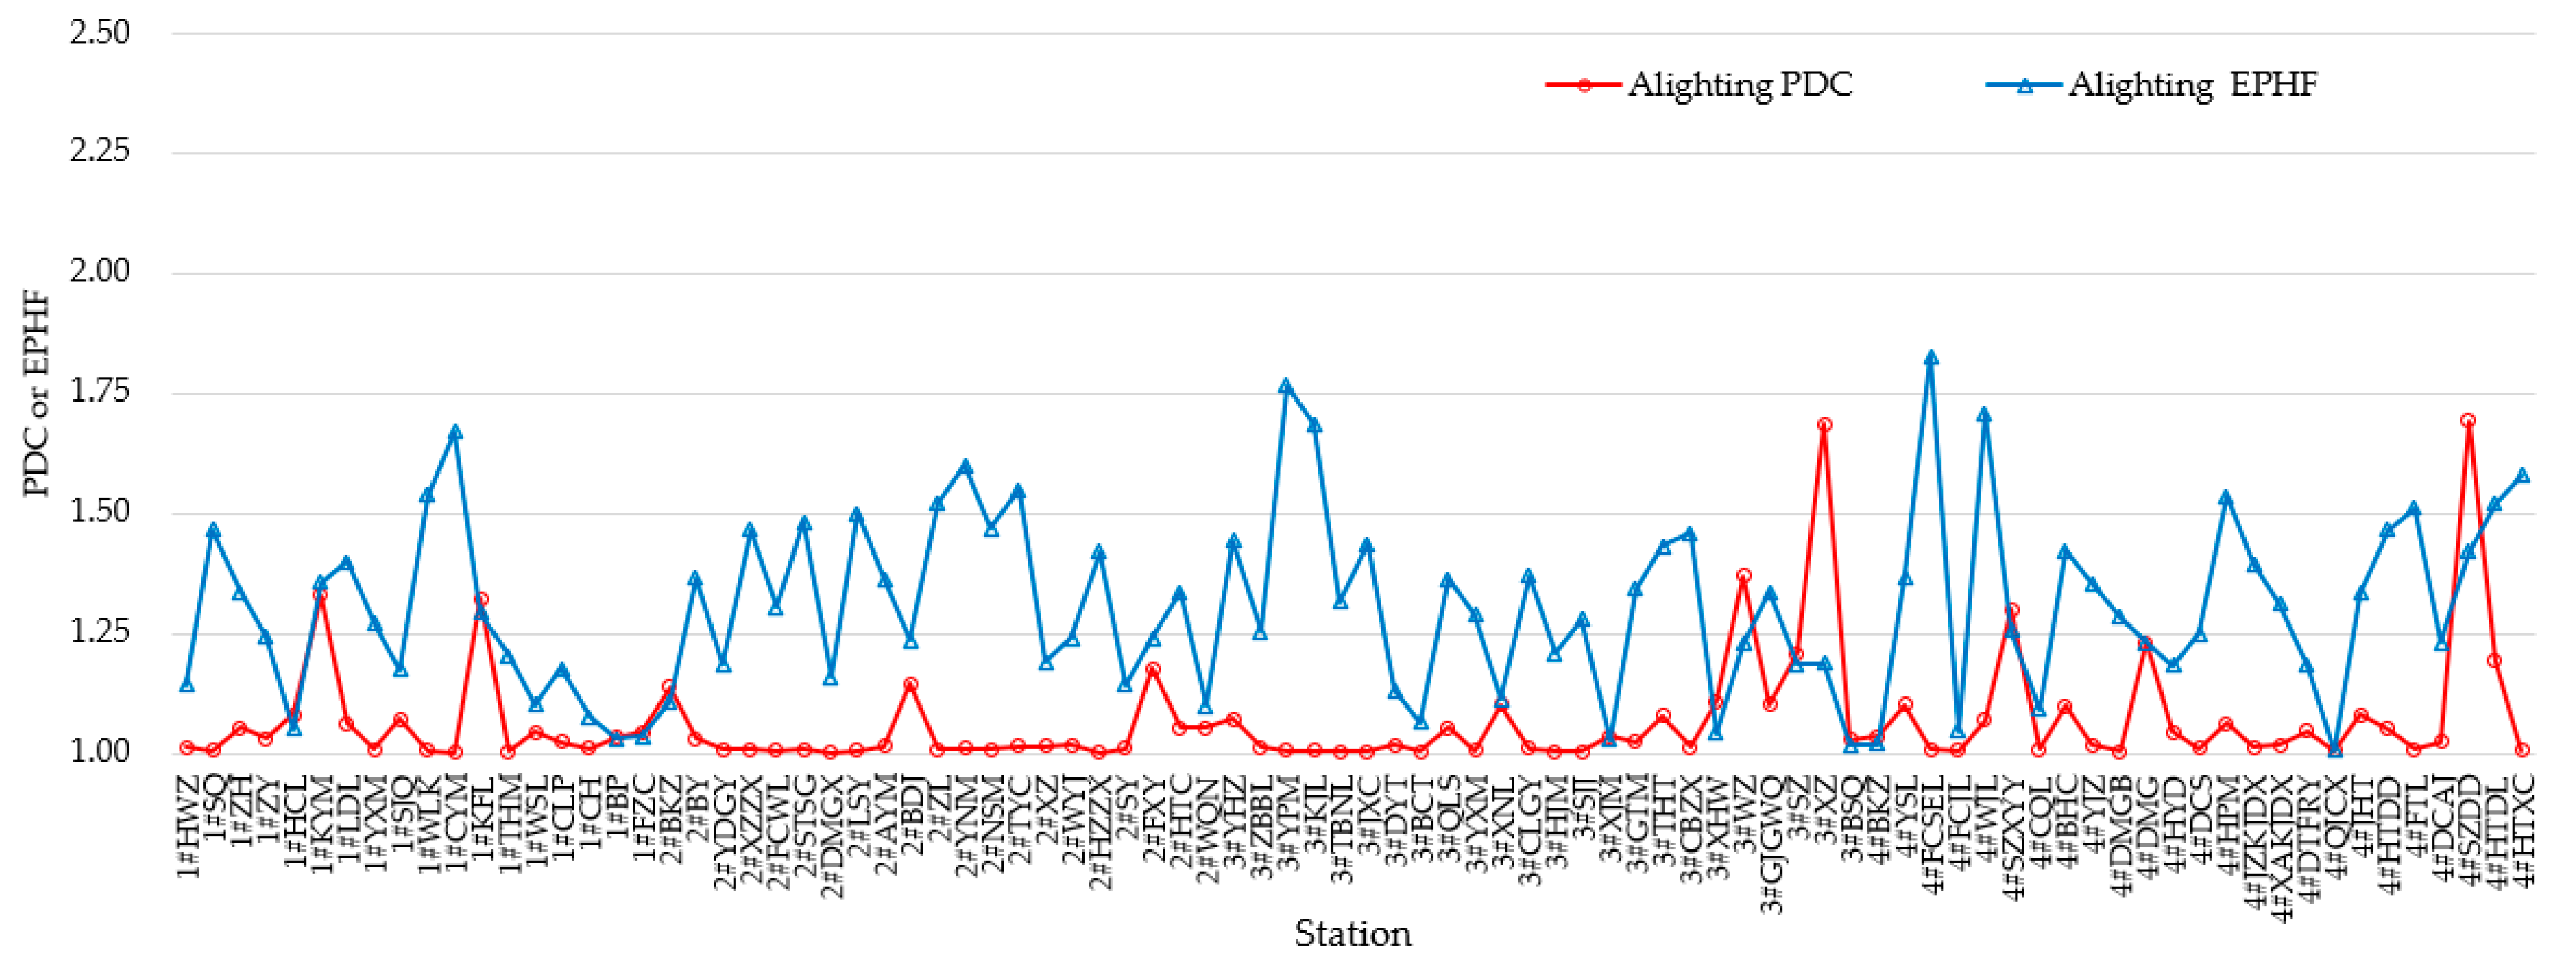
5.2.1. Summary Statistics
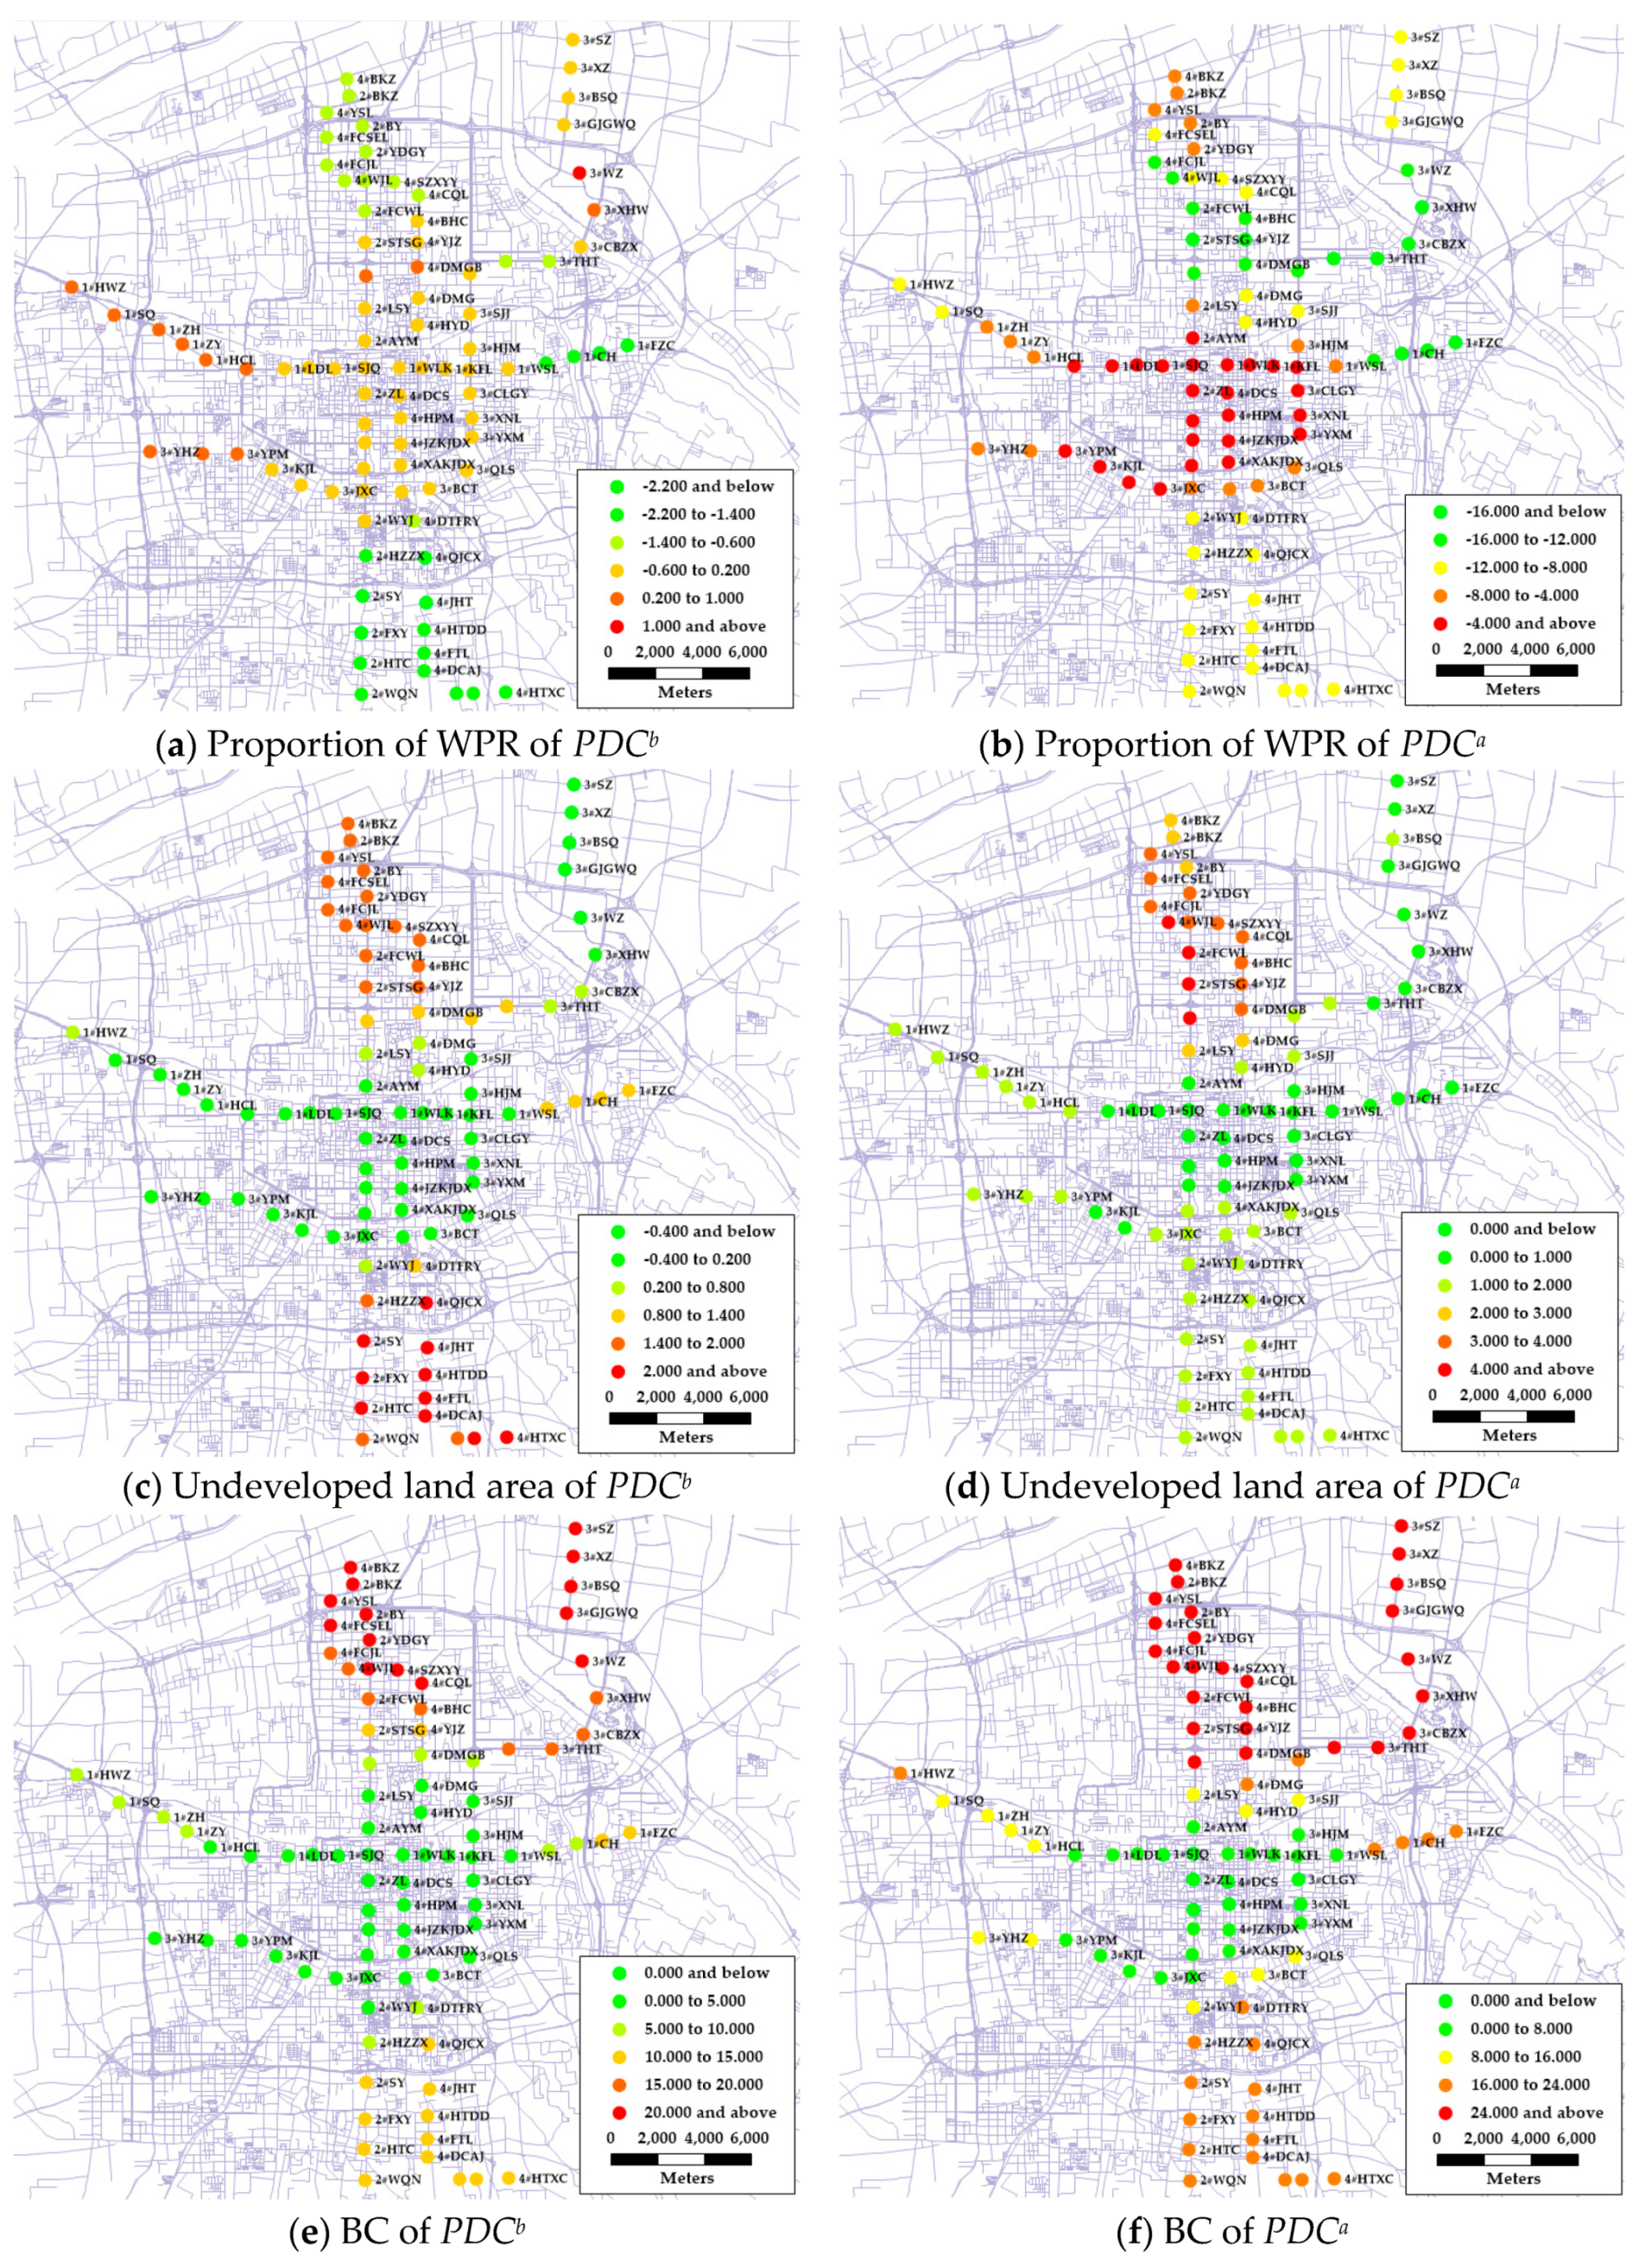
5.2.2. Spatial Distributions of the Coefficients
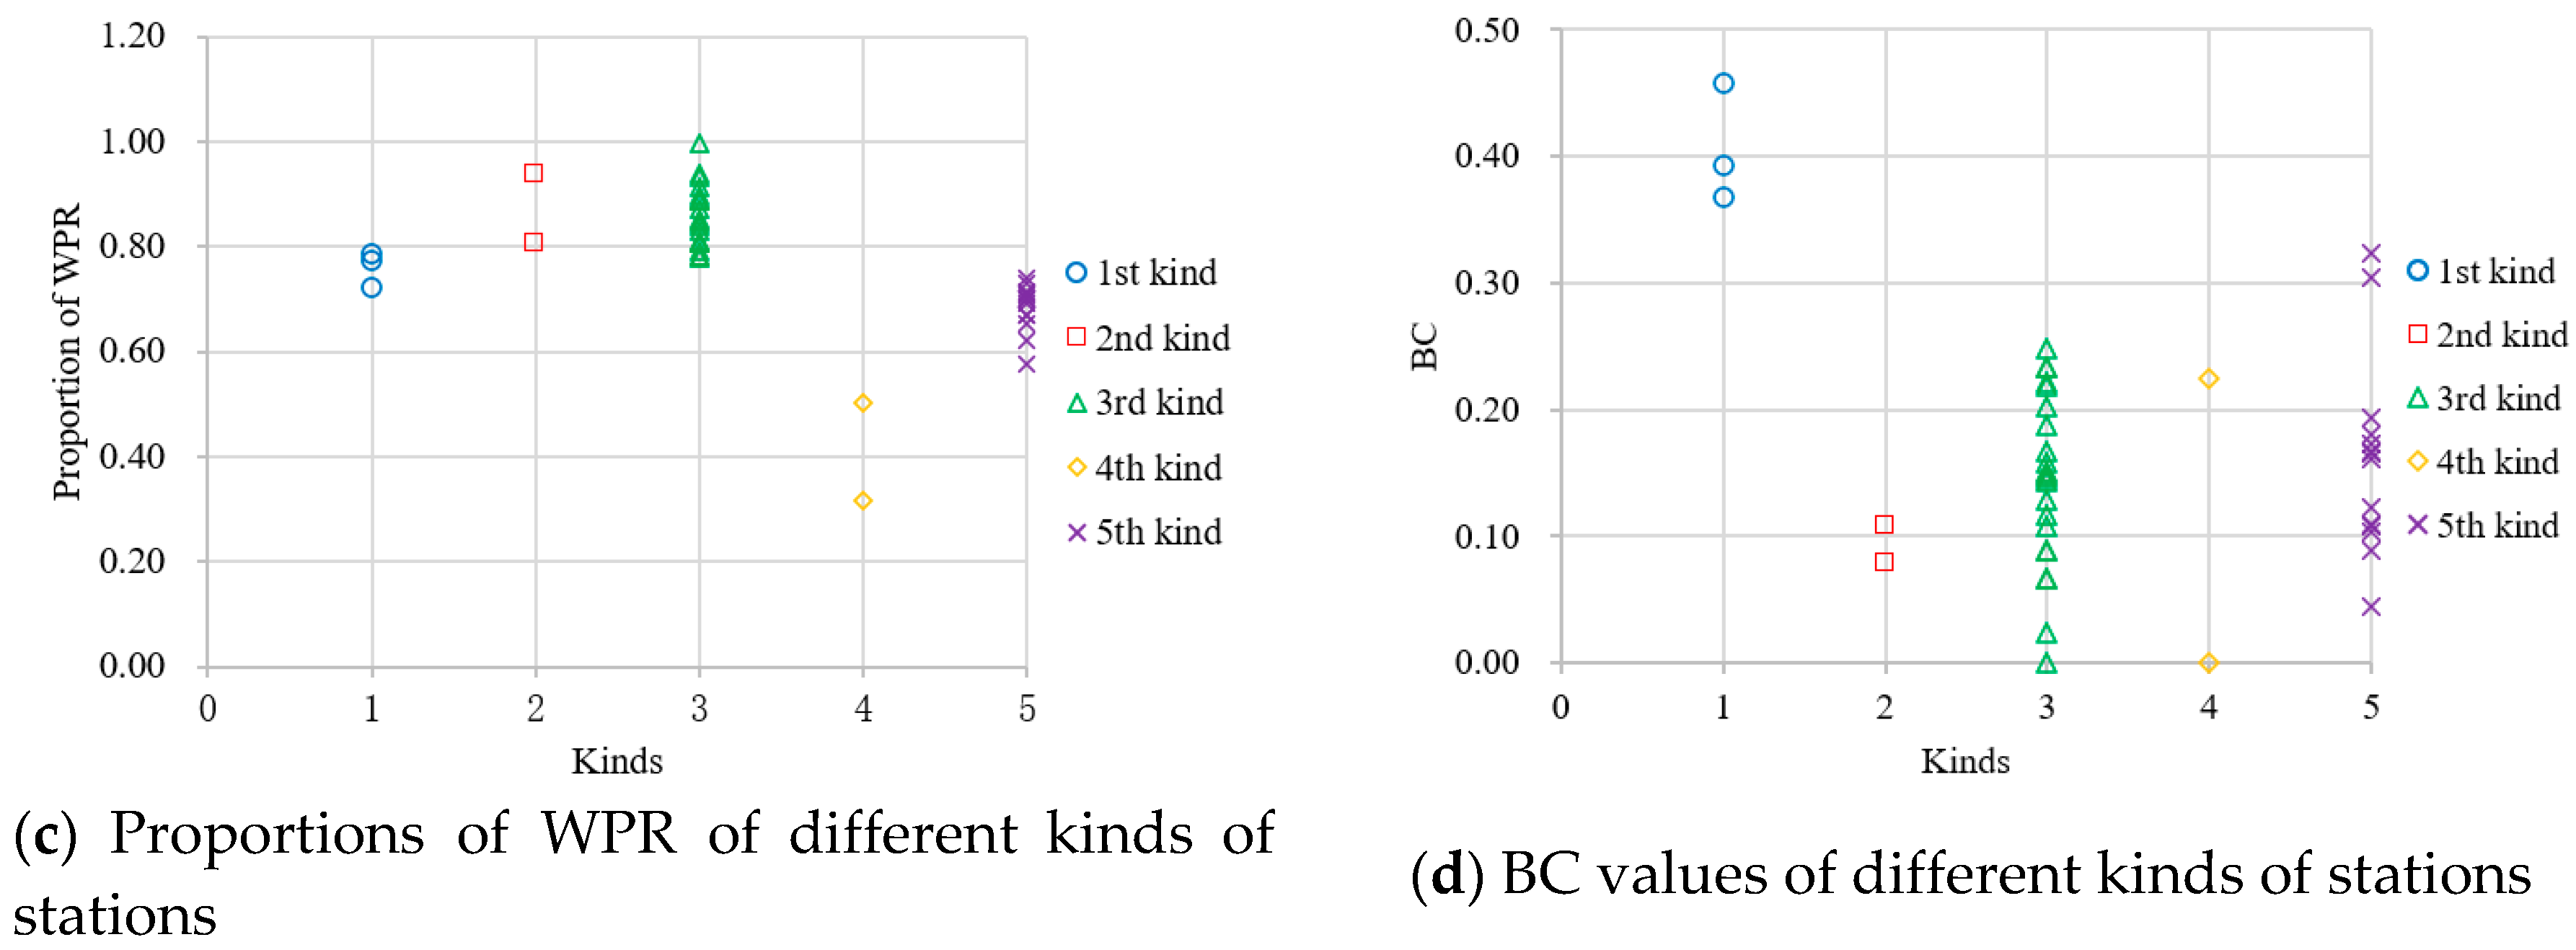
5.2.3. Station Classification
5.3. Discussion—Future Station Design and Policy
6. Conclusion
Author Contributions
Funding
Acknowledgments
Conflicts of Interest
References
- Kittelson, J. Associates, Parsons Brinckerhoff, KFH Group. Transit Capacity and Quality of Service Manual, 3rd ed.; Transportation Research Board: Washington, DC, USA, 2013. [Google Scholar]
- GB50157-2013. Code for Design of Metro. Available online: http://www.jianbiaoku.com/webarbs/book/1027/1073295.shtml (accessed on 13 February 2020).
- Ma, C.Q.; Wang, Y.P. Traffic volume forecast for xi’an urban rapid rail transit. Urban Rapid Rail Transit 2006, 19, 24–28. [Google Scholar]
- Mwakalonge, J.L. Econometric Modeling of Total Urban Travel Demand Using Data Collected in Single and Repeated Cross-Sectional Surveys. Ph.D. Thesis, Tennessee Technological University, Cookeville, TN, USA, May 2010. [Google Scholar]
- Cardozo, O.D.; Garcia-Palomares, J.C.; Gutierrez, J. Application of geographically weighted regression to the direct forecasting of transit ridership at station-level. Appl. Geogr. 2012, 34, 548–558. [Google Scholar] [CrossRef]
- Michael, G.M. The Four Step Model. In Handbook of Transport Modeling; Emerald Group Publishing Limited: Bingley, UK, 2007. [Google Scholar]
- Cui, Z.J. On Scale of Subway Station Platform. J. Southwest Jiaotong Univ. 1993, 3, 76–80. [Google Scholar]
- Gu, L.P.; Ye, X.F. Study on the in and out passenger flow during peak hours of the rail transit station in Osaka. Compr. Transp. 2014, 2, 57–61. [Google Scholar]
- GB/T51150-2016. Code for Prediction of Urban Rail Transit Ridership. Available online: http://www.zzguifan.com/webarbs/book/92970/3172164.shtml (accessed on 13 February 2020).
- Tobin, R.L.; Friesz, T.L. Sensitivity analysis for equilibrium network flow. Transp. Sci. 1988, 22, 100–105. [Google Scholar] [CrossRef]
- Vovsha, P. Application of cross-nested logit model to mode choice in Tel Aviv, Israel, metropolitan area. Transp. Res. Rec. 1997, 1607, 6–15. [Google Scholar] [CrossRef]
- Sun, X.; Wilmot, C.G.; Kasturi, T. Household travel, household characteristics, and land use: An empirical study from the 1994 Portland activity-based travel survey. Transp. Res. Rec. 1998, 1617, 10–17. [Google Scholar] [CrossRef]
- Yam, R.C.M.; Whitfield, R.C.; Chung, R.W.F. Forecasting traffic generation in public housing estates. J. Transp. Eng. 2000, 126, 358–361. [Google Scholar] [CrossRef]
- Rezaeestakhruie, H. Analytical error propagation in four-step transportation demand models. Comput. Sci. 2017. [Google Scholar] [CrossRef]
- Sanko, N.; Morikawa, T.; Nagamatsu, Y. Post-project evaluation of travel demand forecasts: Implications from the case of a Japanese railway. Transp. Policy 2013, 27, 209–218. [Google Scholar] [CrossRef]
- Ryu, S.; Chen, A.; Zhang, H.M. Path flow estimator for planning applications in small communities. Transp. Res. Part A Policy Pract. 2014, 69, 212–242. [Google Scholar] [CrossRef]
- Cervero, R.; Murakami, J.; Miller, M. Direct ridership model of bus rapid transit in Los Angeles County, California. Transp. Res. Rec. 2010, 2145, 1–7. [Google Scholar] [CrossRef]
- Feng, X.; Sun, Q.; Liu, J. Time Characteristic of Input Passenger in Urban Rail Transit Stations Among High Density Residential Areas. In Proceedings of the Chinese Control Conference, Beijing, China, 29–31 July 2010. [Google Scholar]
- Dend, J.; Xu, M. Characteristics of subway station ridership with surrounding land use: A case study in Beijing. In Proceedings of the 2015 International Conference on Transportation Information and Safety (ICTIS), Wuhan, China, 25–28 June 2015. [Google Scholar]
- Chen, C.; Chen, J.; Barry, J. Diurnal pattern of transit ridership: A case study of the New York City subway system. J. Transp. Geogr. 2009, 17, 176–186. [Google Scholar] [CrossRef]
- Chan, S.; Miranda-Moreno, L. A station-level ridership model for the metro network in Montreal, Quebec. Can. J. Civ. Eng. 2013, 40, 254–262. [Google Scholar] [CrossRef]
- Choi, J.; Lee, Y.J.; Kim, T. An analysis of Metro ridership at the station-to-station level in Seoul. Transportation 2012, 39, 705–722. [Google Scholar] [CrossRef]
- Sung, H.; Oh, J.T. Transit-oriented development in a high-density city: Identifying its association with transit ridership in Seoul, Korea. Cities 2011, 28, 70–82. [Google Scholar] [CrossRef]
- He, Y.X.; Zhao, Y.; Tsui, K.L. Modeling and analyzing spatiotemporal factors influencing metro station ridership in taipei: An approach based on general estimating equation. arXiv 2019, arXiv:1904.01280. [Google Scholar]
- Roos, J.; Bonnevay, S.; Gavin, G. Short-Term Urban Rail Passenger Flow Forecasting: A Dynamic Bayesian Network Approach. In Proceedings of the 2016 15th IEEE International Conference on Machine Learning and Applications (ICMLA), Anaheim, CA, USA, 18–20 December 2016. [Google Scholar]
- Haire, A.R. A methodology for incorporating fuel price impacts into short-term transit ridership forecasts. Ph.D. Thesis, The University of Texas at Austin, Austin, TX, UAS, May 2009. [Google Scholar]
- Ma, X.L.; Zhang, J.Y.; Du, B. Parallel Architecture of Convolutional Bi-Directional LSTM Neural Networks for Network-Wide Metro Ridership Prediction. IEEE Trans. Intell. Transp. Syst. 2018, 99, 1–11. [Google Scholar] [CrossRef]
- Li, B. Research on the Computer Algorithm Application in Urban Rail Transit Holiday Passenger Flow Prediction. In Proceedings of the 2016 International Conference on Network and Information Systems for Computers, Wuhan, China, 15–17 April 2016. [Google Scholar]
- Yang, R.; Wu, B. Short-term passenger flow forecast of urban rail transit based on BP neural network. In Proceedings of the Intelligent Control & Automation, Jinan, China, 7–9 July 2010. [Google Scholar]
- Shen, J.Y. Simplified calculation for the width of on and off region of station platform. Urban Rapid Rail Transit 2008, 05, 9–12. [Google Scholar]
- Chen, K.M.; Yu, L.J.; Ma, C.Q. Differentiated peak hours at urban rail transit stations in Xi’an. Urban Transp. China 2018, 16, 51–58. [Google Scholar]
- Ping, S.H. Characteristics of temporal passenger flow distribution at different stations on shenzhen metro line 1. Urban Mass Transit 2018, 21, 85–87. [Google Scholar]
- Brunsdon, C.; Fotheringham, A.S.; Charlton, M.E. Geographically weighted regression: A method for exploring spatial non stationarity. Geogr. Anal. 1996, 28, 281–298. [Google Scholar] [CrossRef]
- Chen, E.; Ye, Z.; Wang, C. Discovering the spatio-temporal impacts of built environment on metro ridership using smart card data. Cities 2019, 95, 102359. [Google Scholar] [CrossRef]
- Hadayeghi, A.; Shalaby, A.S.; Persaud, B.N. Development of planning level transportation safety tools using geographically weighted poisson regression. Accid. Anal. Prev. 2010, 42, 676–688. [Google Scholar] [CrossRef] [PubMed]
- Clark, S.D. Estimating local car ownership models. J. Transp. Geogr. 2007, 15, 184–197. [Google Scholar] [CrossRef]
- Zhao, F.; Park, N. Using geographically weighted regression models to estimate annual average daily traffic. J. Transp. Res. Board 2004, 1879, 99–107. [Google Scholar] [CrossRef]
- Qian, X.; Ukkusuri, S.V. Spatial variation of the urban taxi ridership using GPS data. Appl. Geogr. 2015, 59, 31–42. [Google Scholar] [CrossRef]
- Paez, A. Exploring contextual variations in land use and transport analysis using a probit model with geographical weights. J. Transp. Geogr. 2006, 14, 167–176. [Google Scholar] [CrossRef]
- Blainey, S.P.; Preston, J.M. A geographically weighted regression based analysis of rail commuting around Cardiff, South Wales. In Proceedings of the 12th World Conference on Transportation Research, Lisbon, Portugal, 11–15 July 2010. [Google Scholar]
- Yu, L.; Chen, Q.; Chen, K. Deviation of peak hours for urban rail transit stations: A case study in Xi’an, China. Sustainability 2019, 11, 2733. [Google Scholar] [CrossRef]
- Kong, X.; Yang, J. A new method for forecasting station-level transit ridership from land-use perspective: The case of shenzhen city. Sci. Geogr. Sin. 2018, 38, 2074–2083. [Google Scholar] [CrossRef]
- Zhao, J.; Deng, W.; Song, Y. Analysis of Metro ridership at station level and station-to-station level in Nanjing: An approach based on direct demand models. Transportation 2014, 41, 133–155. [Google Scholar] [CrossRef]
- Zhu, Y.; Chen, F.; Wang, Z. Spatio-temporal analysis of rail station ridership determinants in the built environment. Transportation 2019, 46, 2269–2289. [Google Scholar] [CrossRef]
- Sung, H.; Choi, K.; Lee, S. Exploring the impacts of land use by service coverage and station-level accessibility on rail transit ridership. J. Transp. Geogr. 2014, 36, 134–140. [Google Scholar] [CrossRef]
- García, P.A. Several determinant factors of the secondhand housing price: An application of the hedonic methodology. Rev. Estud. Reg. 2008, 82, 135–158. [Google Scholar]
- Gutiérrez, J.; Cardozo, O.-D.; García-Palomares, J.-C. Transit ridership forecasting at station level: An approach based on distance-decay weighted regression. J. Transp. Geogr. 2011, 19, 1081–1092. [Google Scholar] [CrossRef]
- Report 16 Transit and Urban Form. Available online: http://onlinepubs.trb.org/onlinepubs/tcrp/tcrp_rpt_16-2.pdf (accessed on 13 February 2020).
- Fotheringham, A.S.; Brunsdon, C.; Charlton, M.E. Geographically Weighted Regression: The Analysis of Spatially Varying Relationships; Wiley: Hoboken, NJ, USA, 2002. [Google Scholar]
- Brunsdon, C.; Fotheringham, A.S.; Charlton, M. Geographically weighted summary statistics-a framework for localised exploratory data analysis. Comput. Environ. Urban Syst. 2002, 26, 501–524. [Google Scholar] [CrossRef]
- Hanham, R.; Hoch, R.J.; Spiker, J.S. The Spatially Varying Relationship Between Local Land-Use Policies and Urban Growth: A Geographically Weighted Regression Analysis. In Planning and Socioeconomic Applications; Springer: Berlin/Heidelberg, Germany, 2009. [Google Scholar]
- Wang, Y.; Wen, L.; Chen, M.F. Mathematical Dictionary; Science Press: Beijing, China, 2010. [Google Scholar]
- Zhao, X.F.; Tong, X.J. Characteristic analysis of temporal and spatial distributions of passengers on zhengzhou metro line 1. Urban Mass Transit 2017, 20, 75–79. [Google Scholar]
- Ma, X.; Liu, C.; Wen, H.; Wang, Y.; Wu, Y.J. Understanding commuting pattern using transit smart card data. J. Transp. Geogr. 2017, 58, 135–145. [Google Scholar] [CrossRef]
- Bassan, S. Modeling of peak hour factor on highways and arterials. KSCE J. Civ. Eng. 2013, 17, 224–232. [Google Scholar] [CrossRef]
- Jin, Y. Characteristics of peak hour passenger flow at rail transit stations in shanghai. Urban Transp. China 2019, 17, 50–57. [Google Scholar]
- He, J. Study on the configuration quantity of automatic ticket checker in urban rail transit. Railw. Signal. Commun. 2008, 44, 14–17. [Google Scholar]


| Range | Morning PDC | Evening PDC | ||
|---|---|---|---|---|
| Data | Ratio | Data | Ratio | |
| (1.00, 1.10) | 37 | 71.15% | 34 | 65.38% |
| (1.10, 1.20) | 11 | 21.15% | 11 | 21.15% |
| (1.20, 1.30) | 3 | 5.77% | 2 | 3.85% |
| (1.30, 1.40) | 0 | 0.00% | 1 | 1.92% |
| (1.40, +∞) | 1 | 1.92% | 4 | 7.69% |
| Variable | Explanation | Value | ||
|---|---|---|---|---|
| Mean | Max | Min | ||
| PDCb | Dimensionless continuous values | 1.134 | 3.990 | 1.000 |
| PDCa | Dimensionless continuous values | 1.068 | 1.693 | 1.000 |
| Proportion of WPR | Dimensionless continuous values | 0.764 | 0.995 | 0.062 |
| Undeveloped land | Unit: 104 km2 | 22.778 | 76.516 | 0.000 |
| Distance to the city center | Continuous values, unit: km | 7.561 | 17.800 | 0.200 |
| BC | Dimensionless continuous values | 0.113 | 0.457 | 0.000 |
| Eigenvalue | Condition Index | Variance ratio | |||
|---|---|---|---|---|---|
| Proportion of WPR | Distance to City Center | Undeveloped Land Area | BC | ||
| 0.03 | 11.58 | 0.17 | 0.86 | 0.23 | 0.50 |
| 0.10 | 5.40 | 0.29 | - | 0.41 | 0.46 |
| Variable | Moran I | Expectation Index | Mean Value | Z-score | P-value |
|---|---|---|---|---|---|
| Proportion of WPR | 0.099 | −0.012 | −0.011 | 1.788 | 0.044 |
| Undeveloped land area | 0.548 | −0.012 | −0.010 | 8.476 | 0.001 |
| BC | 0.523 | −0.012 | −0.008 | 6.610 | 0.001 |
| Model | Dependent Variable | Corrected Akaike Information Criterion (AICc) | Adjusted R2 | Proportion of WPR | Undeveloped Land Area | BC |
|---|---|---|---|---|---|---|
| Ordinary least square (OLS) | PDCb | 700.068 | 0.522 | −0.777 | 1.433 | 14.038 |
| PDCa | 643.217 | 0.750 | −14.110 | 2.013 | 23.630 | |
| Geographically weighted regression (GWR) | PDCb | 607.986 | 0.860 | −0.611 | 0.752 | 8.955 |
| PDCa | 575.484 | 0.900 | −8.184 | 1.419 | 15.182 |
| Variables | 1st Kind | 2nd Kind | 3rd Kind | 4th Kind | 5th Kind | |
|---|---|---|---|---|---|---|
| PDCb | Mean | 1.171 | 1.006 | 1.010 | 3.635 | 1.036 |
| Max | 1.309 | 1.008 | 1.034 | 3.990 | 1.186 | |
| Min | 1.001 | 1.004 | 1.001 | 3.281 | 1.000 | |
| PDCa | Mean | 1.051 | 1.280 | 1.025 | 1.230 | 1.014 |
| Max | 1.143 | 1.328 | 1.101 | 1.323 | 1.047 | |
| Min | 1.004 | 1.232 | 1.000 | 1.137 | 1.004 | |
| Proportion of WPR | Mean | 0.759 | 0.871 | 0.854 | 0.410 | 0.685 |
| Max | 0.786 | 0.936 | 0.995 | 0.503 | 0.739 | |
| Min | 0.721 | 0.805 | 0.777 | 0.317 | 0.575 | |
| BC | Mean | 0.405 | 0.094 | 0.143 | 0.113 | 0.160 |
| Max | 0.457 | 0.108 | 0.248 | 0.225 | 0.323 | |
| Min | 0.367 | 0.079 | 0.000 | 0.000 | 0.045 | |
© 2020 by the authors. Licensee MDPI, Basel, Switzerland. This article is an open access article distributed under the terms and conditions of the Creative Commons Attribution (CC BY) license (http://creativecommons.org/licenses/by/4.0/).
Share and Cite
Yu, L.; Cong, Y.; Chen, K. Determination of the Peak Hour Ridership of Metro Stations in Xi’an, China Using Geographically-Weighted Regression. Sustainability 2020, 12, 2255. https://doi.org/10.3390/su12062255
Yu L, Cong Y, Chen K. Determination of the Peak Hour Ridership of Metro Stations in Xi’an, China Using Geographically-Weighted Regression. Sustainability. 2020; 12(6):2255. https://doi.org/10.3390/su12062255
Chicago/Turabian StyleYu, Lijie, Yarong Cong, and Kuanmin Chen. 2020. "Determination of the Peak Hour Ridership of Metro Stations in Xi’an, China Using Geographically-Weighted Regression" Sustainability 12, no. 6: 2255. https://doi.org/10.3390/su12062255
APA StyleYu, L., Cong, Y., & Chen, K. (2020). Determination of the Peak Hour Ridership of Metro Stations in Xi’an, China Using Geographically-Weighted Regression. Sustainability, 12(6), 2255. https://doi.org/10.3390/su12062255