Article

Probabilistic Generation Model of Solar Irradiance for Grid Connected Photovoltaic Systems Using Weibull Distribution

1
O&M Division, KOENERGY Korea for Gulpur Hydro Power Project, Islamabad 44000, Pakistan
2
Department of Electrical Engineering, University of Engineering and Technology Taxila, Taxila 47050, Pakistan
3
Department of Electrical Engineering, College of Engineering, Majmaah University, Almajmaah 15341, Saudi Arabia
4
Department of Electrical Engineering, Government College University Faisalabad, Faisalabad 38000, Pakistan
5
Department of Electrical and Computer Engineering, Missouri University of Science and Technology, Rolla, MO 65409, USA
6
Department of mathematics, College of Arts and Sciences of Tabrjal, Jouf University, Sakaka 72341, Saudi Arabia
7
Department for Management of Science and Technology Development, Ton Duc Thang University, Ho Chi Minh City 758307, Vietnam
8
Faculty of Applied Sciences, Ton Duc Thang University, Ho Chi Minh City 758307, Vietnam
*
Author to whom correspondence should be addressed.
Sustainability 2020, 12(6), 2241; https://doi.org/10.3390/su12062241
Submission received: 31 December 2019 / Revised: 6 March 2020 / Accepted: 11 March 2020 / Published: 13 March 2020
(This article belongs to the Special Issue Large-Scale Solar Electricity Networks and the Energy Transition)

Abstract

:
Around the world, countries are integrating photovoltaic generating systems to the grid to support climate change initiatives. However, solar power generation is highly uncertain due to variations in solar irradiance level during different hours of the day. Inaccurate modelling of this variability can lead to non-optimal dispatch of system resources. Therefore, accurate characterization of solar irradiance patterns is essential for effective management of renewable energy resources in an electrical power grid. In this paper, the Weibull distribution based probabilistic model is presented for characterization of solar irradiance patterns. Firstly, Weibull distribution is utilized to model inter-temporal variations associated with reference solar irradiance data through moving window averaging technique, and then the proposed model is used for irradiance pattern generation. To achieve continuity of discrete Weibull distribution parameters calculated at different steps of moving window, Generalized Regression Neural Network (GRNN) is employed. Goodness of Fit (GOF) techniques are used to calculate the error between mean and standard deviation of generated and reference patterns. The comparison of GOF results with the literature shows that the proposed model has improved performance. The presented model can be used for power system planning studies where the uncertainty of different resources such as generation, load, network, etc., needs to be considered for their better management.

1. Introduction

1.1. Background

Energy has become part and parcel of our daily life and the dream of a sustainable society is unrealizable without sustainable energy solutions. Environmental and cost concerns associated with fossil fuels have also tracked the attention of relevant stakeholders on green energy resources to achieve sustainable and green policy objectives. Solar energy is a promising Renewable Energy Resource (RER) and an economical alternative to fossil fuels that can play a critical role in achieving green policy objectives and resolving energy crisis issues [1]. Recently, solar Photovoltaic (PV) generation systems are getting more worldwide adoption due to wider availability of solar energy, improvement in panel efficiency, extended life time [2], declining costs, and supporting policies for energy exchange and net metering [3]. The importance of solar energy is marked by the fact that the current global installed capacity of solar PV generation is around 505 GW [4]. Further expansion is possible if governments and policy makers announce more incentives on the purchase of solar panels [5] and related auxiliaries such as power electronic converters and energy storages, etc., for their effective utilization [6]. Higher Education Institutes (HEIs) can also play a significant role in this regard by motivating large segments of society towards decarbonization objectives [7]. Another strategy to engage consumers in green energy programs is to declare a penalty cost for CO2 emissions and a continuous increment in its value with the passage of time to achieve goals targeted in various environmental protocols signed by the international stakeholders [8].
Integration of huge PV installations with the progression of global economy is posing certain challenges as well. Some of the associated challenges are optimal placement and sizing of PV installations [9,10], time coupled accurate energy prediction [11], the requirements of extended demand flexibility in power system [12], and their recycling [2], etc. Most of the integration challenges are associated with power system operation [13,14]. The uncertainties associated with renewable generation and variations of electrical load demand may create mismatch between demand and supply that badly affects the reliability of power systems [11]. Moreover, other problems like power quality, stability, and voltage fluctuations may arise due to the intermittent and unpredictable nature of renewable generation [15,16]. Probabilistic modelling and characterization of solar irradiance can help to manage many challenges associated with the uncertain varying nature of grid connected PV systems. It extracts useful information from the irradiance data and can therefore be used as a supporting tool in the decision making process [17].

1.2. Literature Review

Integration of RERs into an electrical power system is a key research challenge for power system engineers. Solar PV systems are one of the prominent renewable energy systems for energy production in electrical power grids. Solar radiation directly affects the performance of PV systems, therefore accurate modeling of solar radiation data is essential for design and optimization of solar PV systems, and inaccurate modelling may result in inefficient resource allocation and asset management in electrical power systems. In conjunction, some literature specifically used solar irradiance data to calculate the output power generated from a solar PV system, where solar irradiance is the instantaneous value of solar radiation received at the surface of the unit area (W/m2). When we integrate this solar irradiance in a specified time duration then it is referred to as solar irradiation (Wh/m2). Modelling of solar irradiance variability is a key factor for different power system studies, e.g., power system analysis and its medium-term and long-term planning.
There are different works in the literature related to the modelling of solar radiation but most of the literature normally focuses on the modelling of mean solar radiation for a particular time horizon in comparison with its time coupled uncertainty. The review of the literature reveals that approximately 75% of publications pertaining to solar radiation estimation and modelling have been done in the last five years [18] and most of them are based on statistical, physical, hybrid, and Artificial Intelligence (AI) techniques. Several linear and nonlinear models for solar energy modelling are reviewed in [19,20,21]. These models mainly associate solar radiation with other metrological variables for its modelling. Statistical methods are applied to analyze variations of hourly data of solar radiation at various geographical locations with different climatic conditions [14]. Some studies have used empirical models for estimating monthly solar radiation at specific locations [22,23].
In the literature, Beta distribution has been utilized for solar irradiance modelling. In [9], solar irradiance was modelled in independent time segments by ignoring inter-temporal correlation but, in practice, there may exist some week or reasonable correlaion in the change in irradiance behaviour among time segments. Authors of [24] presented a Beta distribution based probabilistic generation model for solar irradiance uncertainty modelling that is often employed in planning studies related to PV systems such as their penetration level [25], allocation, sizing [9,10], and estimation of output power [26] for better resource allocation. Inter-temporal uncertainity for changes in irradiance level was not focused on in these papers.
Apart from solar irradiance data, probabilistic distributions can also be employed for characterizing time series data of other variables. Suitability of a distribution for a specific data depends upon the nature of the variable. Normal distribution is generally used for stochastic modelling of Plug-in Electric Vehicles (PEVs) [27], while Weibull distribution is employed for modelling wind speed [28,29]. Weibull, Gamma, lognormal, and Rayleigh distribution have been employed in [30] for estimating the electricity consumption of various residential houses. Outcomes of the work showed that the Weibull distribution has produced better estimations.
Artificial Intelligence (AI) techniques have emerged as an alternative to conventional modelling techniques. Among different AI techniques, Artificial Neural Networks (ANN) have become an attractive choice for solar radiation modelling due to their computational efficiency. Different ANN techniques (such as recurrent, wavelet, Bayesian neural network, and diagonal recurrent wavelet) have been exploited to improve the estimation of solar radiation [31,32]. Some researchers have also applied Fuzzy Logic (FL) for solar radiation estimation [33]. Results show that FL produces better estimation results in situations when available data for estimation is vague and ambiguous.
Probabilistic modelling/characterization of solar irradiance to provide its expected variability and uncertainty have been performed in various works. Such modelling of solar irradiance can be useful for energy managers, power planners, system operators, and power system researchers in diverse applications. Based on historical observations, authors of [34] constructed day-ahead probabilistic scenarios to calculate the output power of PV systems where each scenario represents the possible behavior of solar power with an associated probability. Some research works have performed probabilistic modelling of solar irradiance data for economical operation and optimal management of power grids [35,36,37].

1.3. Contributions

It is evident from the literature review that Beta distribution is generally utilized for solar irradiance modelling. Even though Weibull distribution has produced better results with other time series-based data sets (such as wind speed modelling), it has not been applied to irradiance modelling. Therefore, in this paper, Weibull distribution has been proposed to generate time-coupled solar irradiance patterns from reference data for the computation of hourly power output from PV generation systems. Moving window average based technique is used to obtain the inter-temporal irradiance patterns. Weibull distribution parameters (i.e., shape and scale) are estimated for each time step, which provide a complete relationship among the reference and generated irradiance patterns. The proposed model is validated using well-known Goodness of Fit (GOF) indicators such as Mean Absolute Percentage Error (MAPE), Variance of Mean Absolute Percentage Error (MAPEvar.), and auto correlation between reference and generated irradiance patterns. The significant contributions of this paper are as follows:
  • Design of a methodology based on Weibull distribution to effectively model uncertainties associated with solar irradiance data,
  • Use of Generalized Regression Neural Network (GRNN) instead of Piecewise Cubic Hermite Interpolation Polynomial (PCHIP) to achieve continuity of Weibull distribution parameters calculated at discrete steps,
  • Ability to create different scenarios of solar generation that are beneficial for operational planning of power systems.
The rest of this paper is organized as follows: Section 2 discusses the data arrangement and its mathematical formulation. The calculation of Weibull distribution shape and scale parameters with the generation of irradiance patterns are also discussed in the same section. The case study and results are presented in Section 3. Conclusions and future work are described in Section 4.

2. Data Arrangement and Probabilistic Model Formulation

The four years of data of hourly solar irradiance (W/m2) collected from a PV power plant is used as reference data for the probabilistic model. To have uniformity between days of the year, hourly solar irradiance, data stamped at local standard time from 6:00 am to 7:00 pm of each day for the complete period, is considered. In this paper, this data is termed as reference solar irradiance data and is shown in Figure 1. This data is saved in the data matrix, S, presented in Expression (1), where D represents number of days and H represents number of hours.
S = [ s 11 s 12 s 1 H s 21 s 22 s 2 H s D 1 s D 2 s D H ]

2.1. Formulation of Probabilistic Model

Formulation of the probabilistic model for the generation of solar patterns consists of two main steps:
(1)
At each time step, probabilistic distribution parameters are estimated using reference irradiance data patterns present in the next time step,
(2)
Solar irradiance patterns are generated using estimated probability distribution parameters.
Important features to be considered for the formulation of a probabilistic model of solar generation patterns are:
(1)
Probabilistic representation of generated irradiance patterns should be analogous to the probabilistic representation of reference solar patterns,
(2)
Deviations of generated solar patterns from one-time step to the next one should be analogous to the reference solar pattern deviations.
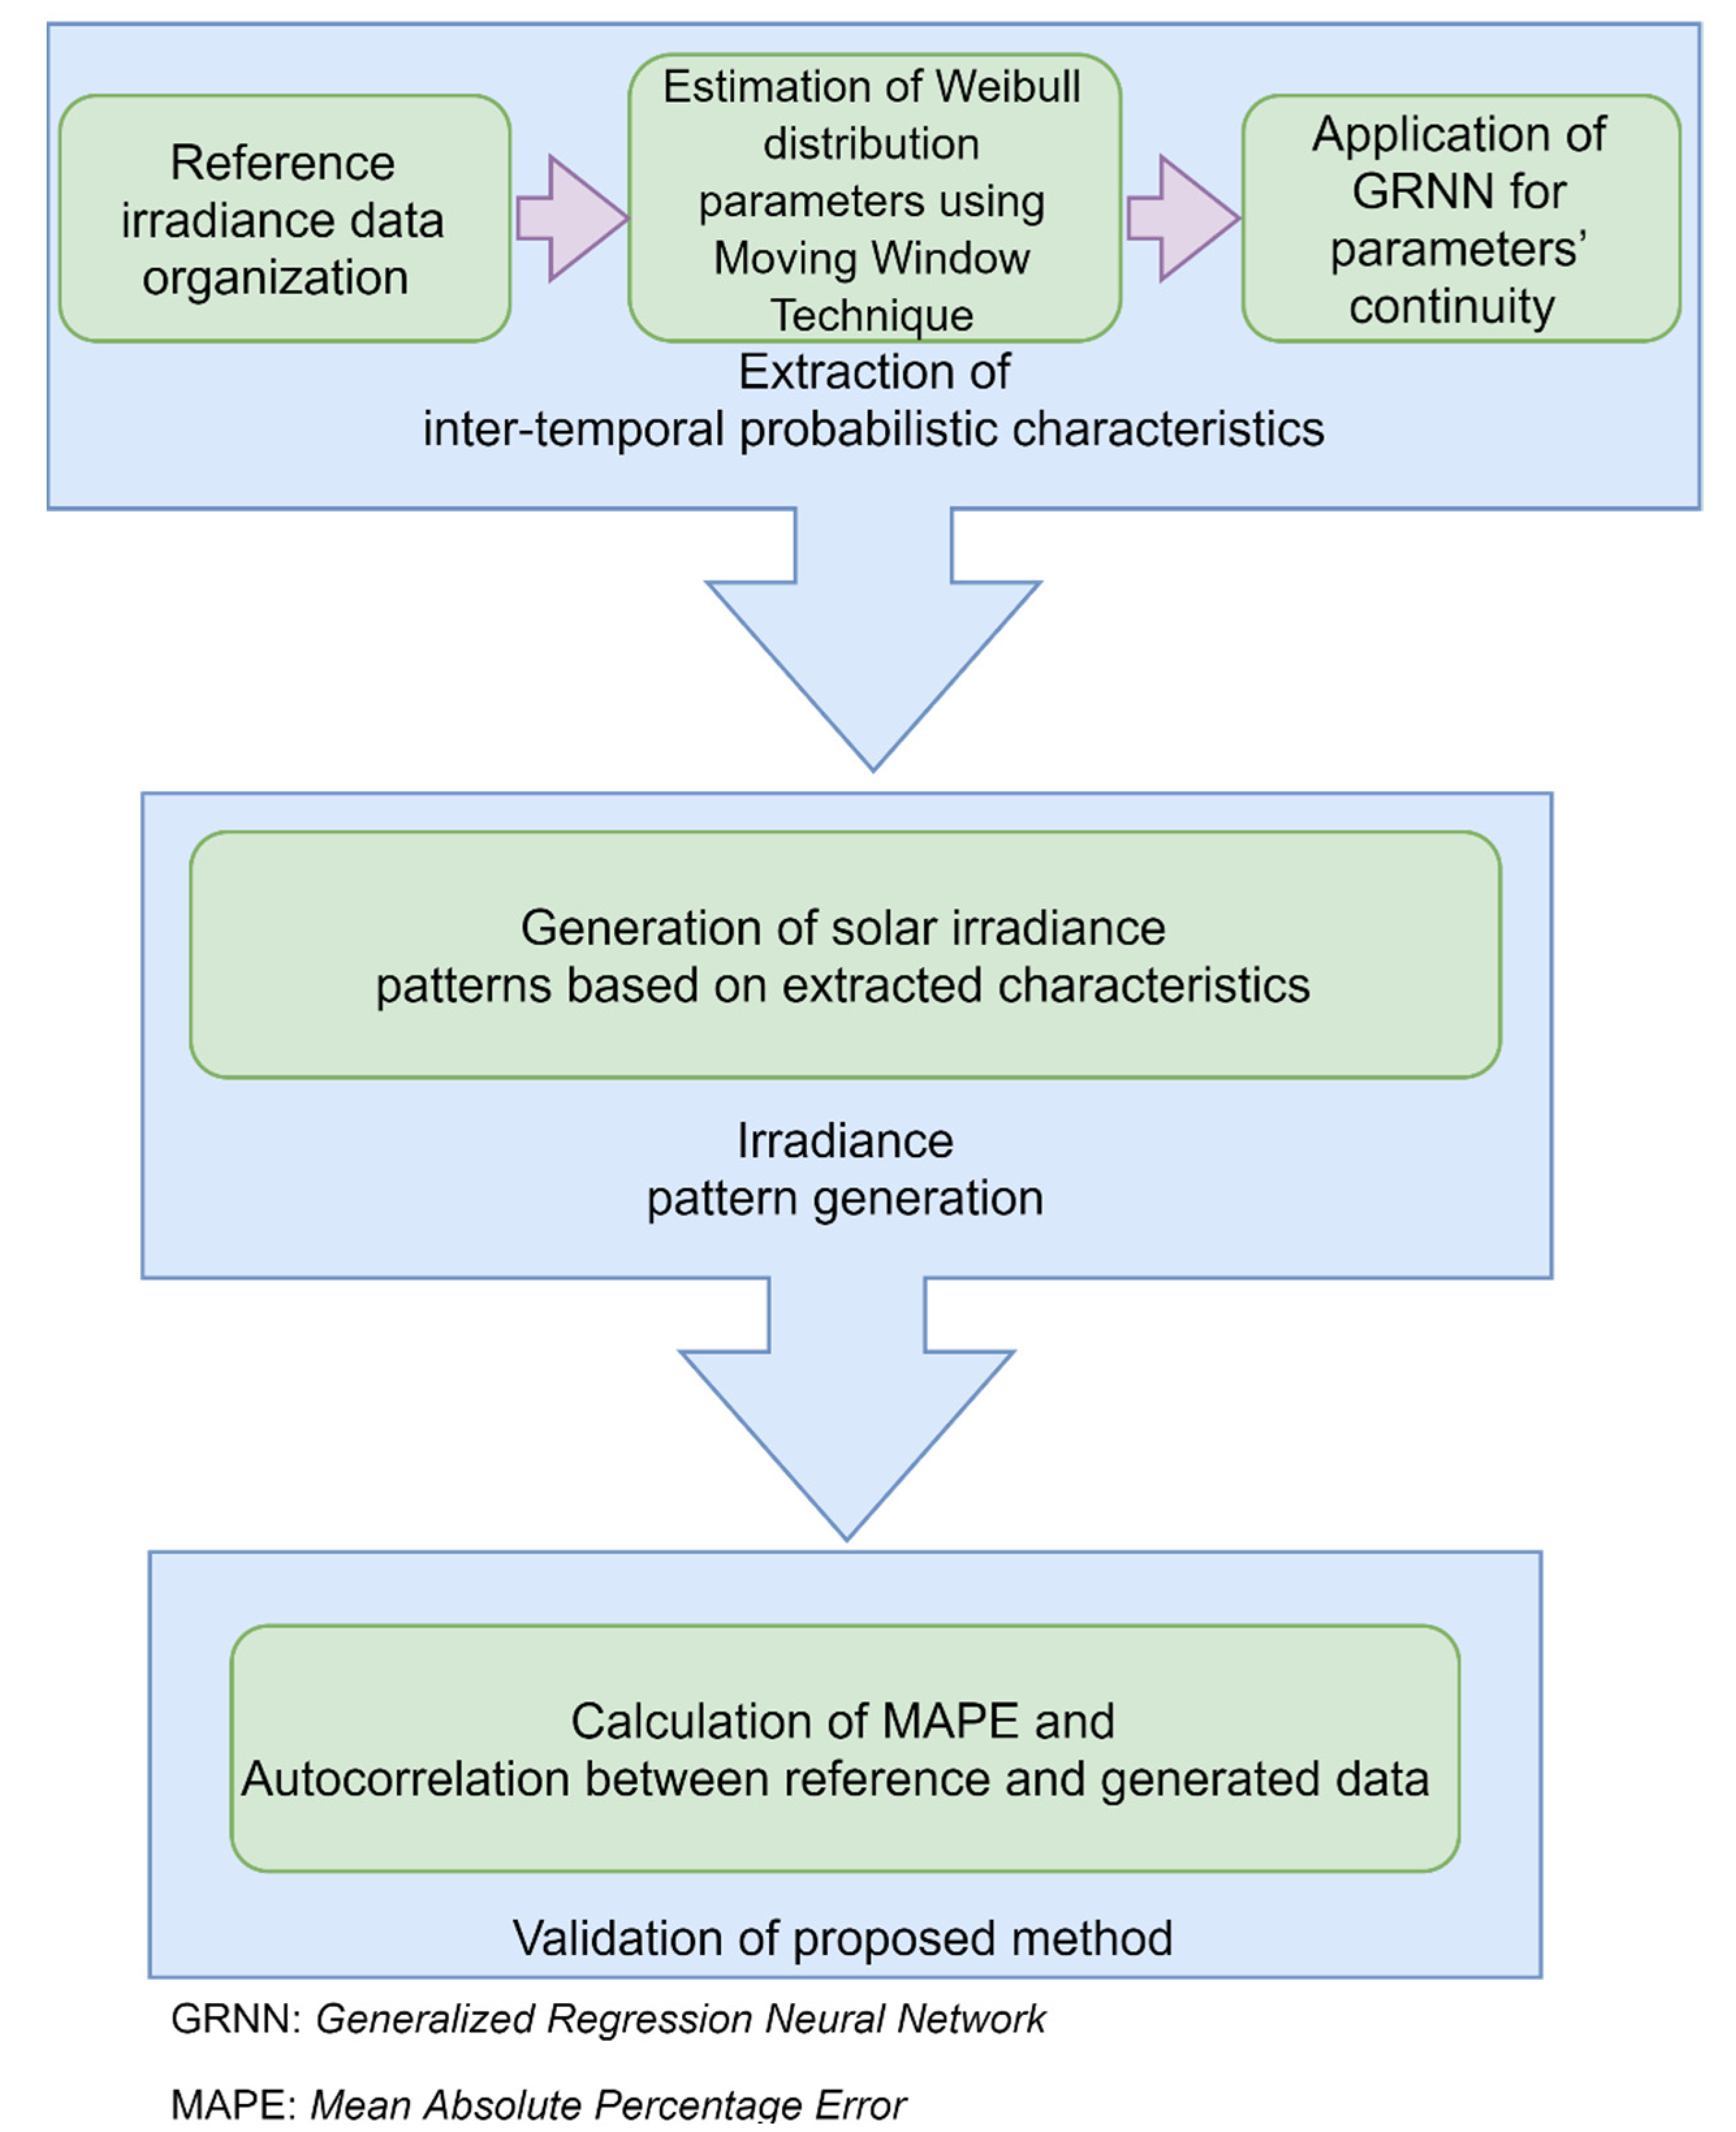
The block diagram of the proposed model for the characterization and generation of solar irradiance patterns is shown in Figure 2. Each part of the block diagram is explained in the following sub-sections.

2.2. Extraction of Solar Irradiance Data Patterns

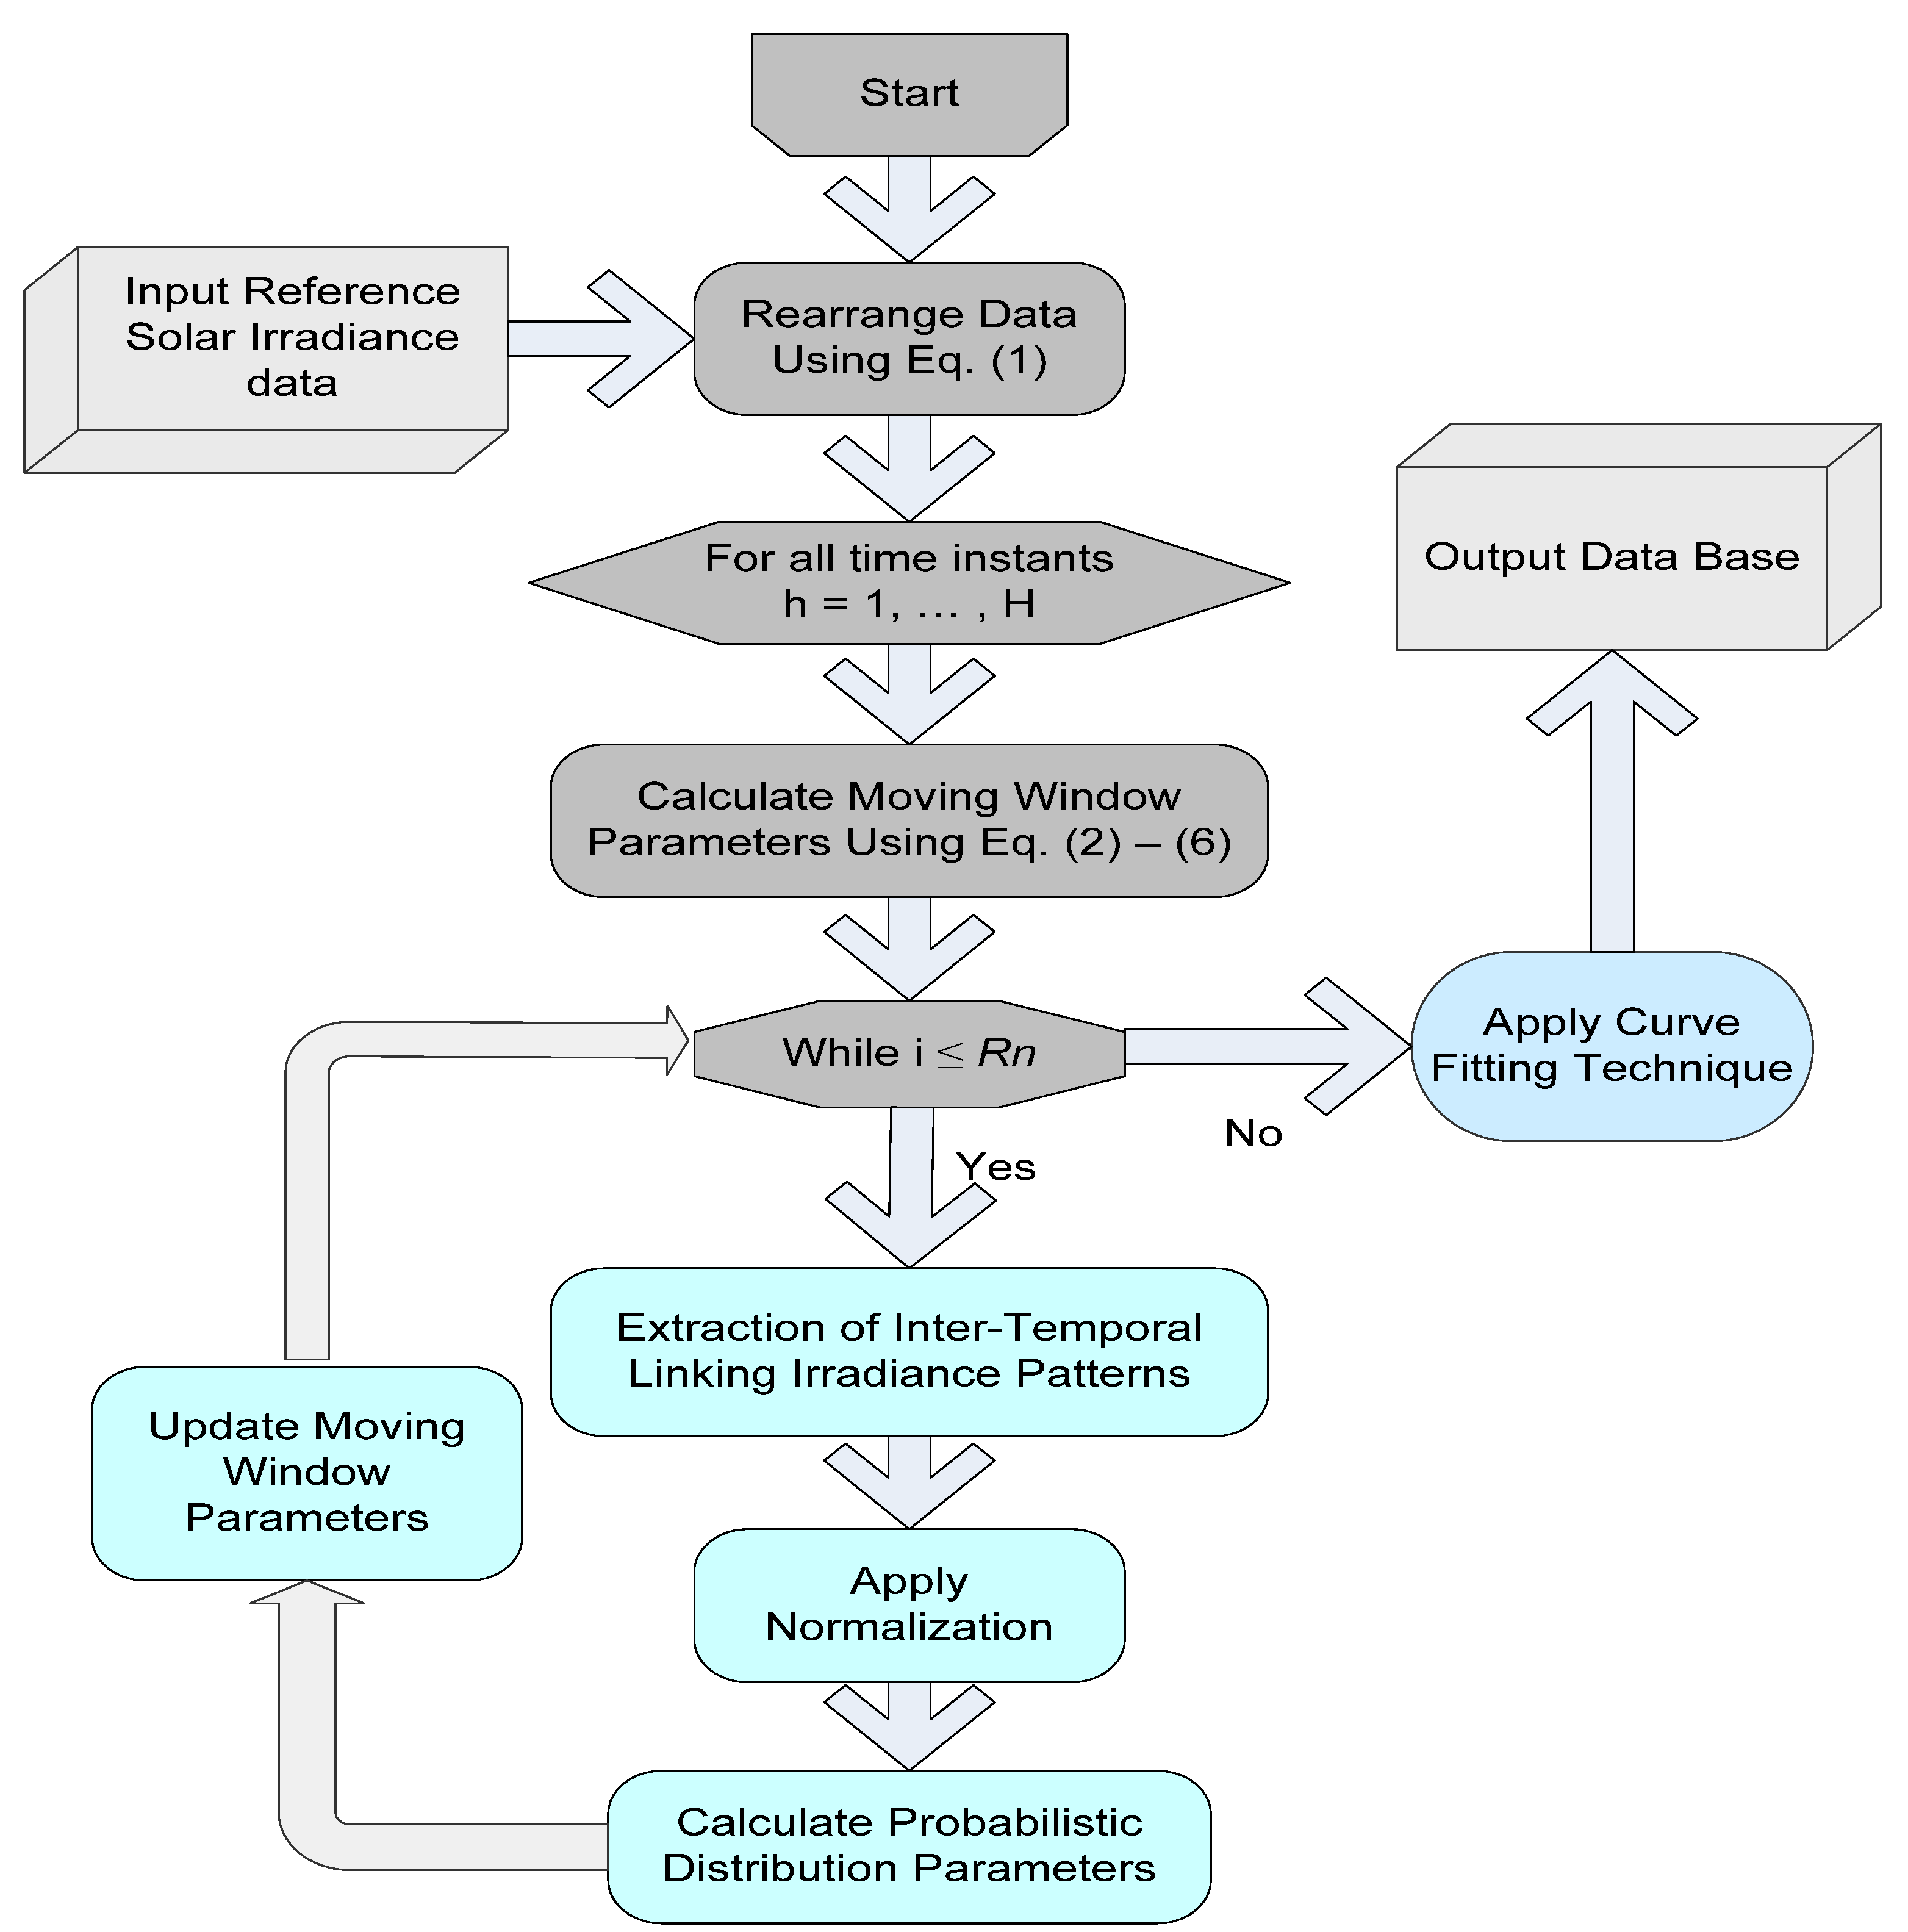
The probabilistic generation model developed in this paper characterizes reference solar irradiance data for each time step through Weibull distribution parameters. The basic algorithm for extraction of inter-temporal irradiance patterns is shown in Figure 3.
The upper bound and lower bound of the reference solar irradiance data is identified with a 95% confidence interval to filter out outliers or bad data. At each time step (hour) h = 1 … H, the upper and lower bound is spotted by applying a 95% confidence interval to eradicate irrelevant data and is assembled in the vector form as:
m l = [ m l 1 m l 2 m l H ]
m u = [ m u 1 m u 2 m u H ]  
where, m u and m l represent the upper and lower bound of data at each time step.
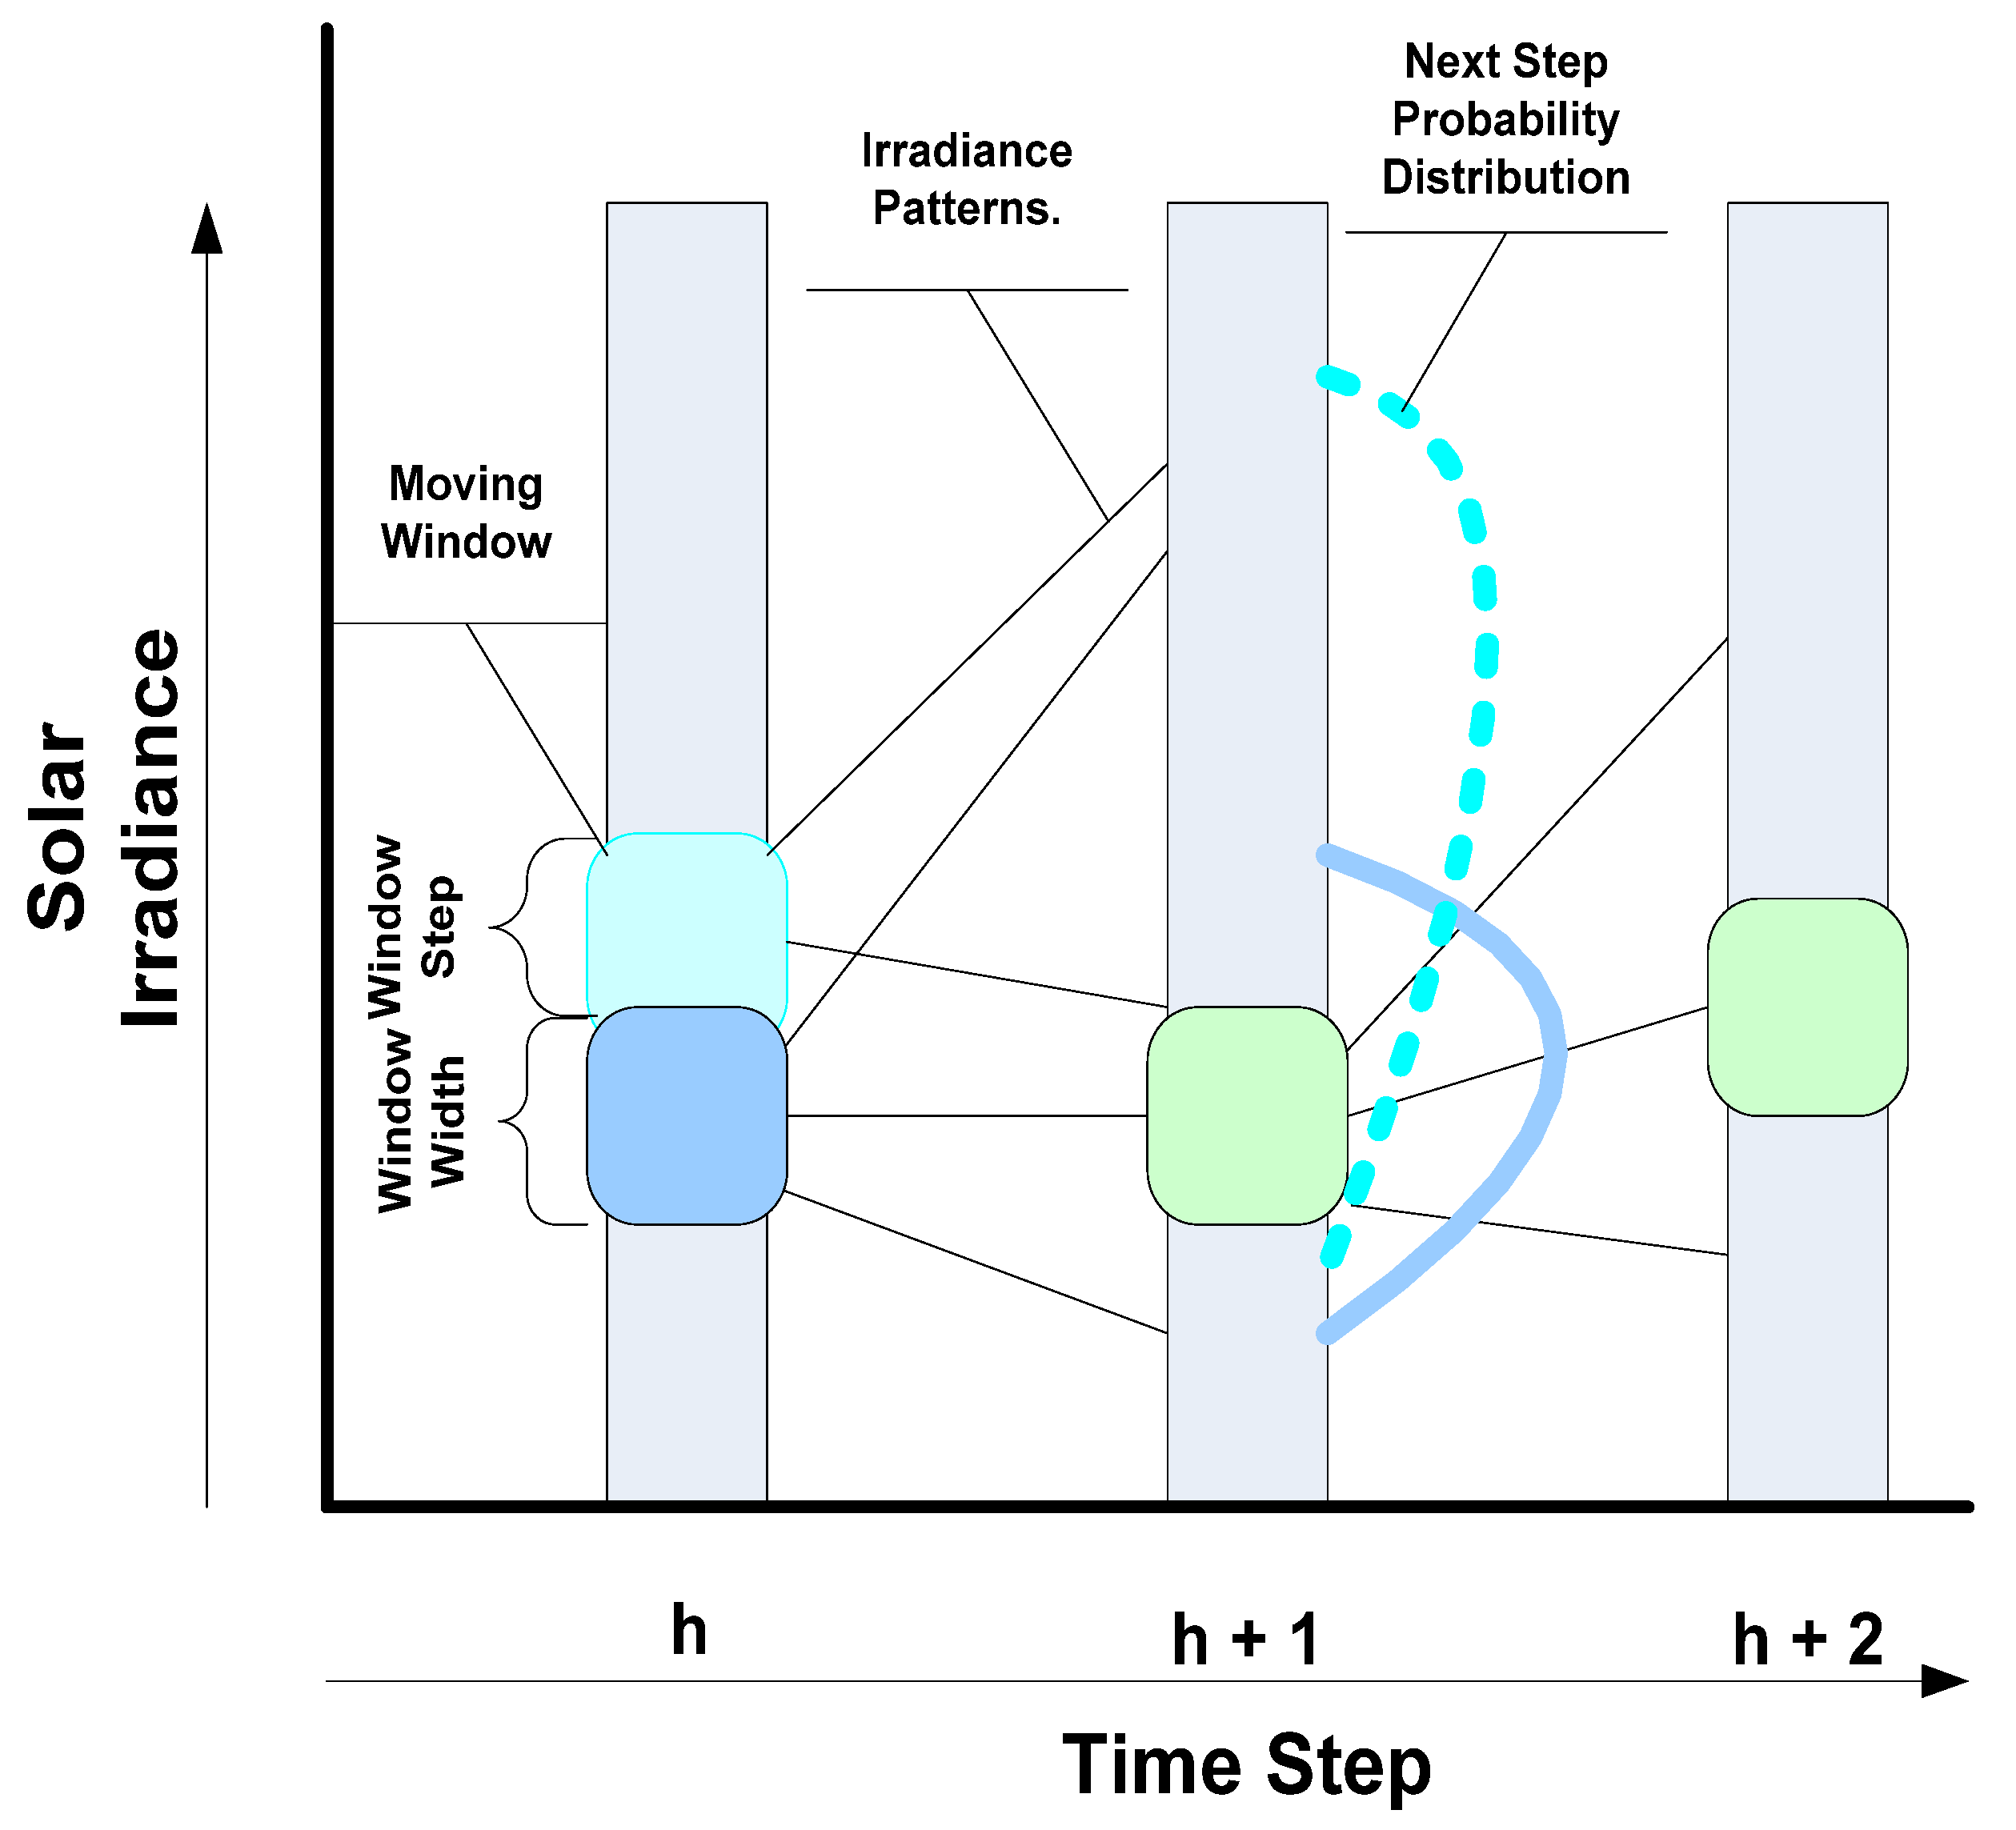
The range of reference irradiance data ( r 95 % ) considered for probabilistic modelling is determined by using (4). This range is used to scan the irradiance patterns using moving window technique as presented in Figure 4.
r 95 % =   m u m l
To extract reference irradiance patterns lying inside the selected range, a suitable size of moving window is required. For this purpose, the size of the moving window is variable and regulated by following the user-defined parameter:
w s =       r 95 % u s = ( Δ r h , h = 1 H )
An appropriate size of the moving window is required for each time step so that it contains a significant number of data points for the formulation of the probabilistic distribution model. However, the size of the moving window should not be too large, otherwise data points with relatively different irradiance values will become part of the same moving window, and this must be avoided. The values of basic parameters used in the probabilistic model are presented in Table 1.
The probability distribution of the solar irradiance that occurs at consecutive time steps can be accomplished through the moving window, which attempts to achieve this initially by considering any point lying inside the window (all these points are considered as the same starting point). The moving window moves upward in the vertical direction for the extraction of other data points present in the same time step, and linking irradiance points lie in the next time step, which is used to build the probabilistic distribution parameters of the respective window. To achieve smoothness and effectiveness of probabilistic distribution parameters, the moving window includes some portion of amplitude of the previous window for the next step. The vertical step of the moving window is determined as:
w s h i f t =   r 95 % R n 1
where R n is the number of moving windows used for the collection of data points, which should be greater than   u s . Firstly, the starting point of the moving window lies below the lower limit of time step ‘h’, such that the central point of the window meets with lower limit of the relevant time step and the data points available inside the region d h l w s 2 to d h l + w s 2 . Data points placed at the next time step, ‘h+1’, which are associated with the obtained data points of time step ‘h’, are extracted and stored in set S h for a moving window. The window is moved upwards at the same time step, ‘h’, by using (6) and the above procedure is repeated for extraction of irradiance data points. The extracted data points are stored in set S h for this window. This procedure is repeated for the entire movement of the window for each time step. For the next time step, ‘h+1’, window size, w s , and shifting step, w s h i f t , are calculated using (5) and (6). However, the central point for starting the moving window corresponds with the lower margin of time step, ‘h+1’. The data points lying inside the window are used to extract the associated points at the next time step, ‘h+2’. Then these points are stored in set   S h + 1 . This process is repeated for all moving windows at each time step, i.e., h = (1, 2 …, H).

2.3. Calculation of Weibull Distribution Parameters

In this paper, the Weibull distribution based probabilistic model is used for characterization of solar irradiance patterns. The detailed procedure used for the extraction of irradiance patterns and estimation of Weibull distribution parameters is shown in Figure 3.
Reference irradiance patterns obtained at time step ‘h+1’, associated with the data points of previous time, ‘h’, lying inside the moving window, ‘i’, are extracted and stored in set S h , i . The data points present inside set S h , i are normalized between (0, 1) to determine the Weibull distribution shape and scale parameters.
š h , i = s h , i   m l m u   m l
After normalization, the parameters of Weibull distribution are calculated for the entire moving window corresponding to each time step, ‘h’.

2.4. Smoothness and Continuity of Weibull Distribution Parameters

The Weibull distribution parameters estimated at each time step, ‘h’, depend on the solar irradiance data points inside the moving window. The number of data points inside the moving window may vary. At times, the number of data points are somewhat less, therefore it becomes difficult to determine the Weibull distribution parameters that could lead to high values. The estimated Weibull distribution parameters are in discrete form. To convert these parameters from discrete to continuous form, curve fitting is required. Different curve fitting techniques, such as polynomial fitting, interpolation, regression, and artificial neural networks have been implemented in the literature to find the best fit curve for the series data points. Artificial neural networks (ANNs) have been used as a curve fitting on a discrete data input available for the plot of Weibull probability density function. Results demonstrate that Weibull plot by using ANNs is very accurate as compared to the actual plot of Weibull probability density function [38]. In [39], an ANN is adopted as a curve fitting on a discrete data, and results reveal that it is a much more effective and quicker technique for the application of curve fitting on discrete data. Based on its effective properties discussed in [38,40], a Generalized Regression Neural Network (GRNN) curve fitting technique is employed in this paper. This technique preserves the shape of the estimated Weibull distribution parameters by reducing the variations associated with them. The basic formula of GRNN is:
E ( y | X ) =   y f ( x , y ) d y f ( x , y ) d y
where ‘y’ represents estimator output, ‘x’ represents input data, and E ( y | X ) is the joint probability function (also called regression) of ‘x’ and ‘y’ [41].

2.5. Generation of Solar Irradiance Patterns

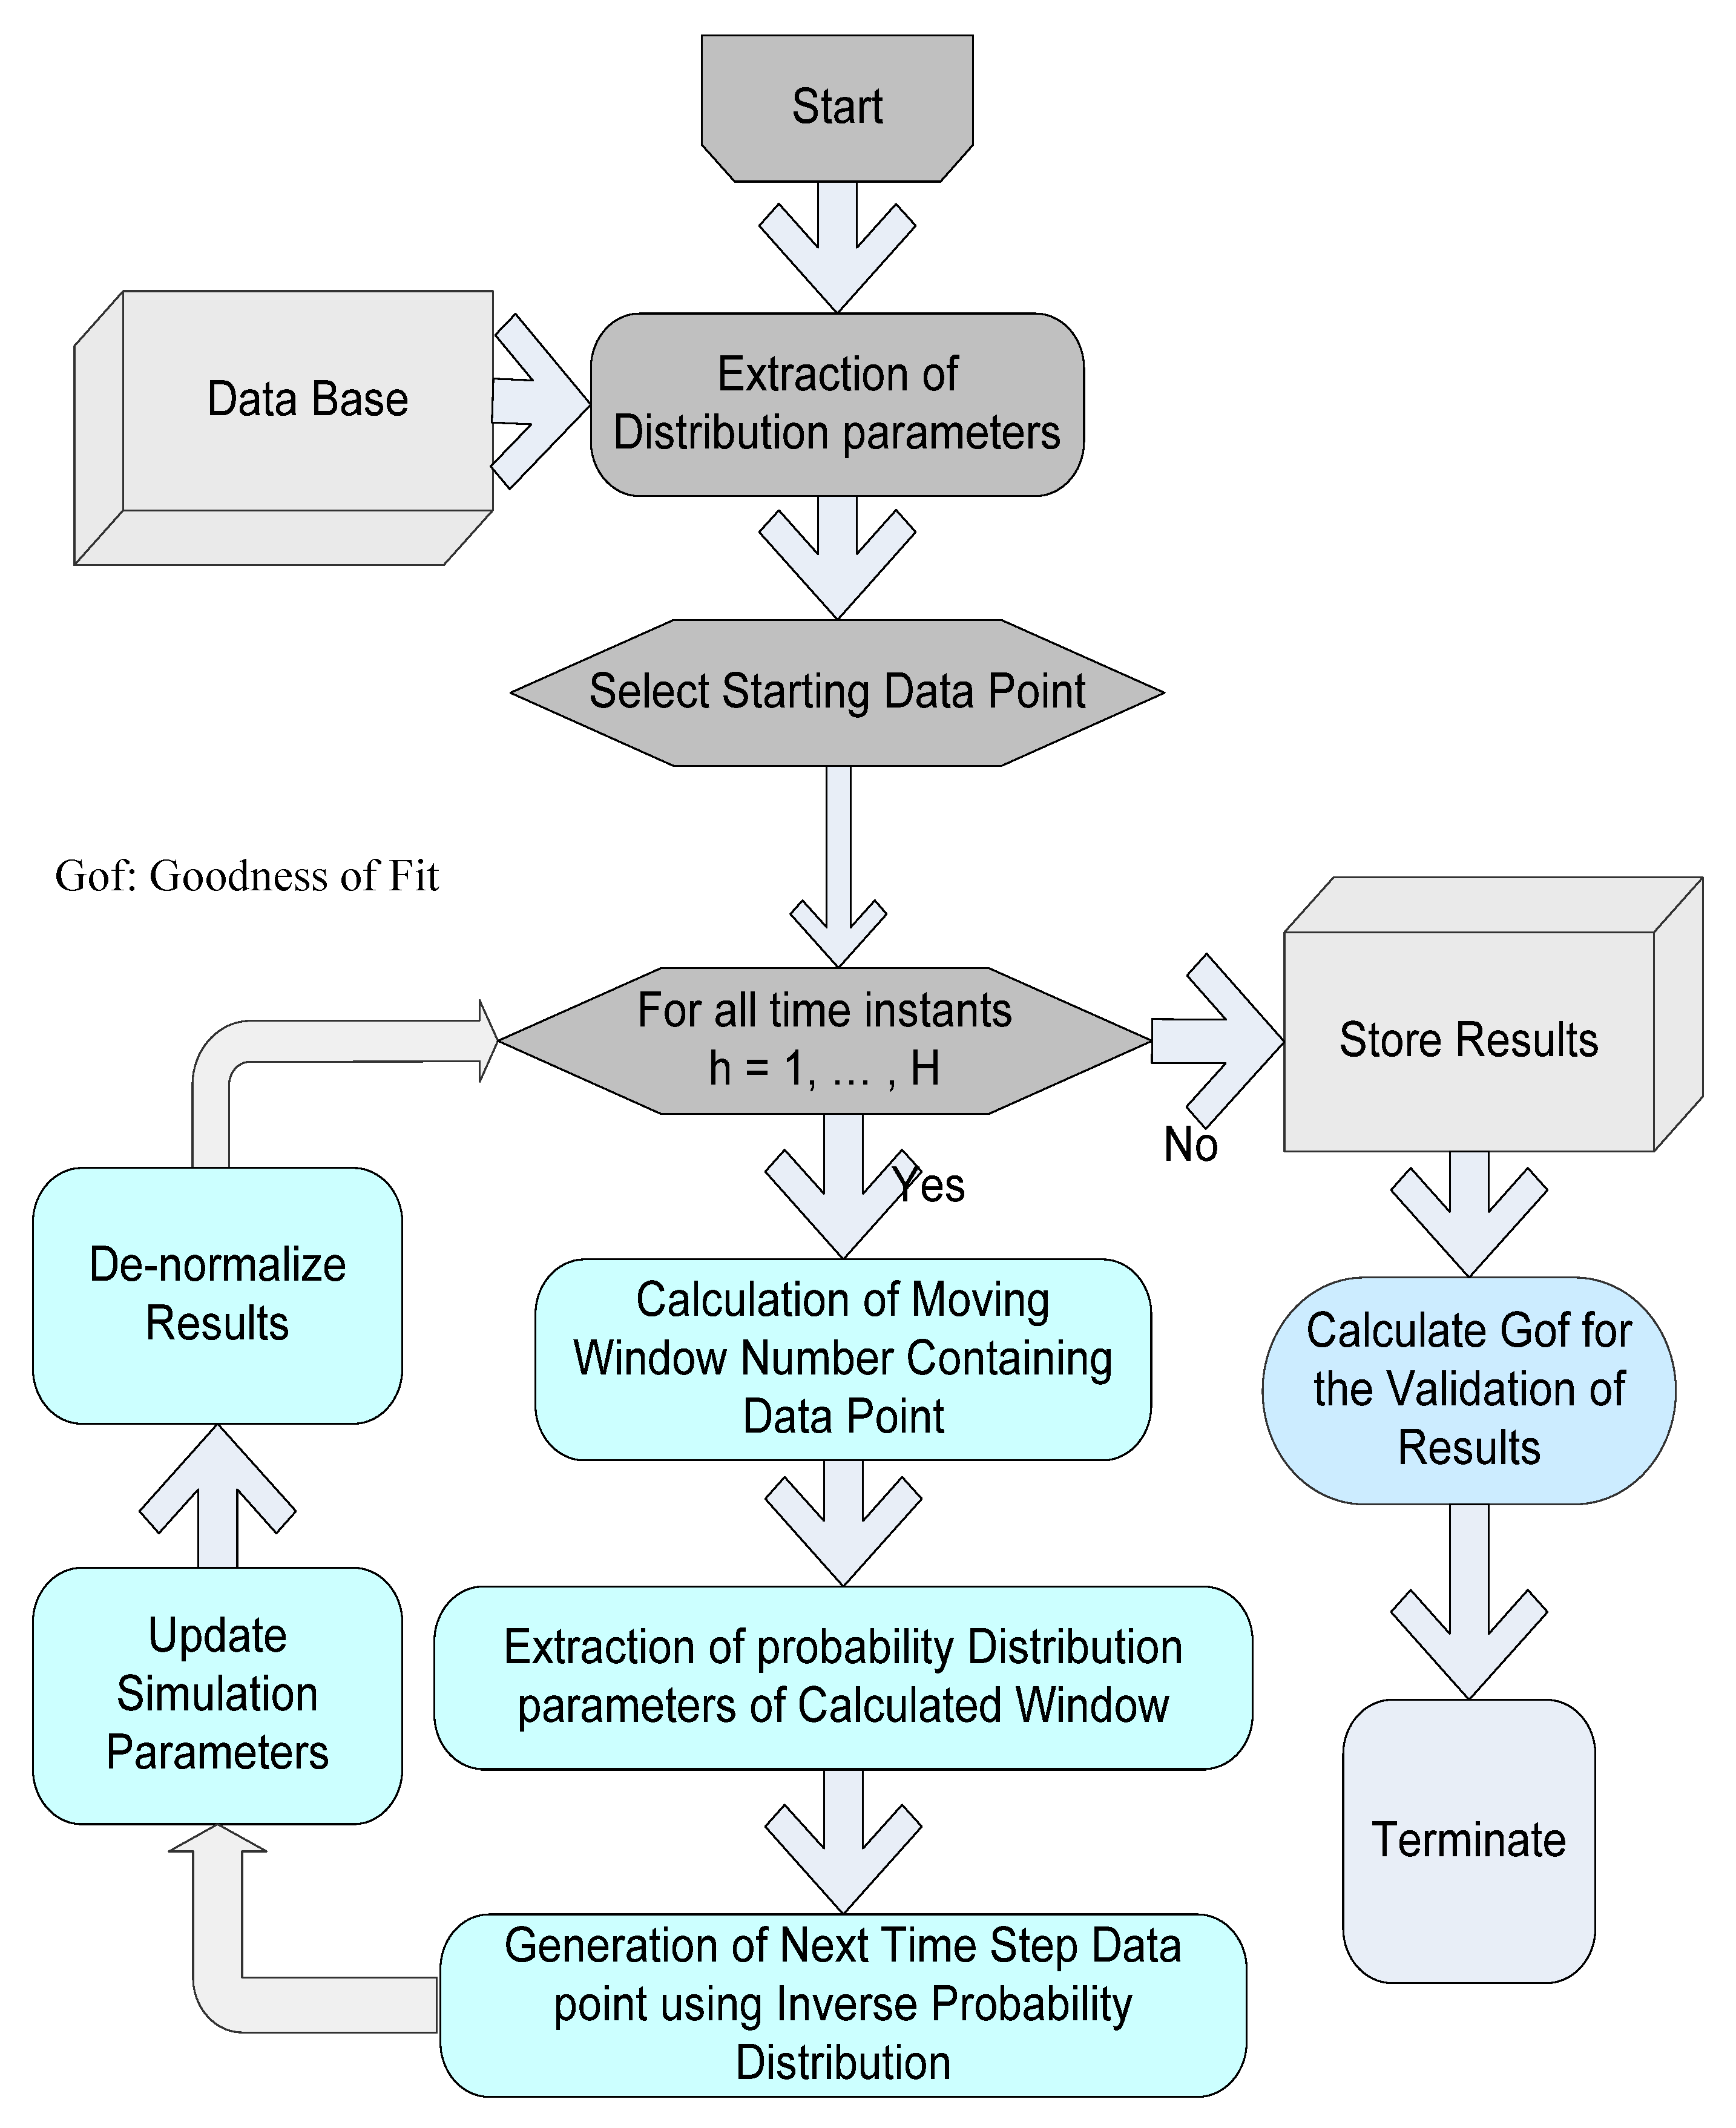
The calculations in previous sections provide probability distribution parameters at each time step and probabilistic connection among these time steps. The estimated parameters are used for generation of solar irradiance patterns that are beneficial for scenario analysis of PV based Distributed Generator (DG) integrated in electrical power systems. This requires representation of appropriately identified random patterns for the irradiance level of a specified number of days. Initially, a random starting point is chosen at time step ‘h’ for irradiance pattern generation. Subsequently, the Weibull distribution parameters of respective window numbers are estimated through GRNN. Figure 5 shows the irradiance pattern generation algorithm.
Let β i h and   η i h be the Weibull distribution shape and scale parameter of starting data point   i h . The shape and scale parameter provide a possible outcome of the data point at the next time step, ‘h +1’. Inverse Weibull cumulative distribution function (CDF) is used for the generation of normalized data point   i ¯ h + 1 at the next time step, ‘h+1’, and its mathematical formulation is as follows:
i - h + 1 = F 1 ( p h + 1 | α i h , β i h ) = {   i - h + 1 : F ( i - h + 1 | α i h , β i h ) = p h + 1 }  
The generated solar irradiance data point, i - h + 1 , is denormalized using the following equation:
i h + 1 = [   ( i - h + 1 )   ( m u h m l h ) ] + m l h
The window number at time step ‘h+1’, in which the generated data point occurs, is then calculated. The estimated Weibull distribution parameters of respective windows are extracted, and inverse Weibull distribution for the calculation of the data points at time step ‘h + 2’ is applied. The same procedure is repeated to generate irradiance data points for all time step, h = (1, 2, … H). Since there are ‘ D ’ irradiance patterns in the reference data set, a fixed number of irradiance patterns are generated. The irradiance patterns of the generated data set can be represented by the following equation:
I = [ i 11 i 12 i 1 H i 21 i 22 i 2 H i D 1 i D 2 i D H ]
The solar irradiance patterns of any desired number of days can also be generated for offline testing and scenario analysis.

3. Case Study Application

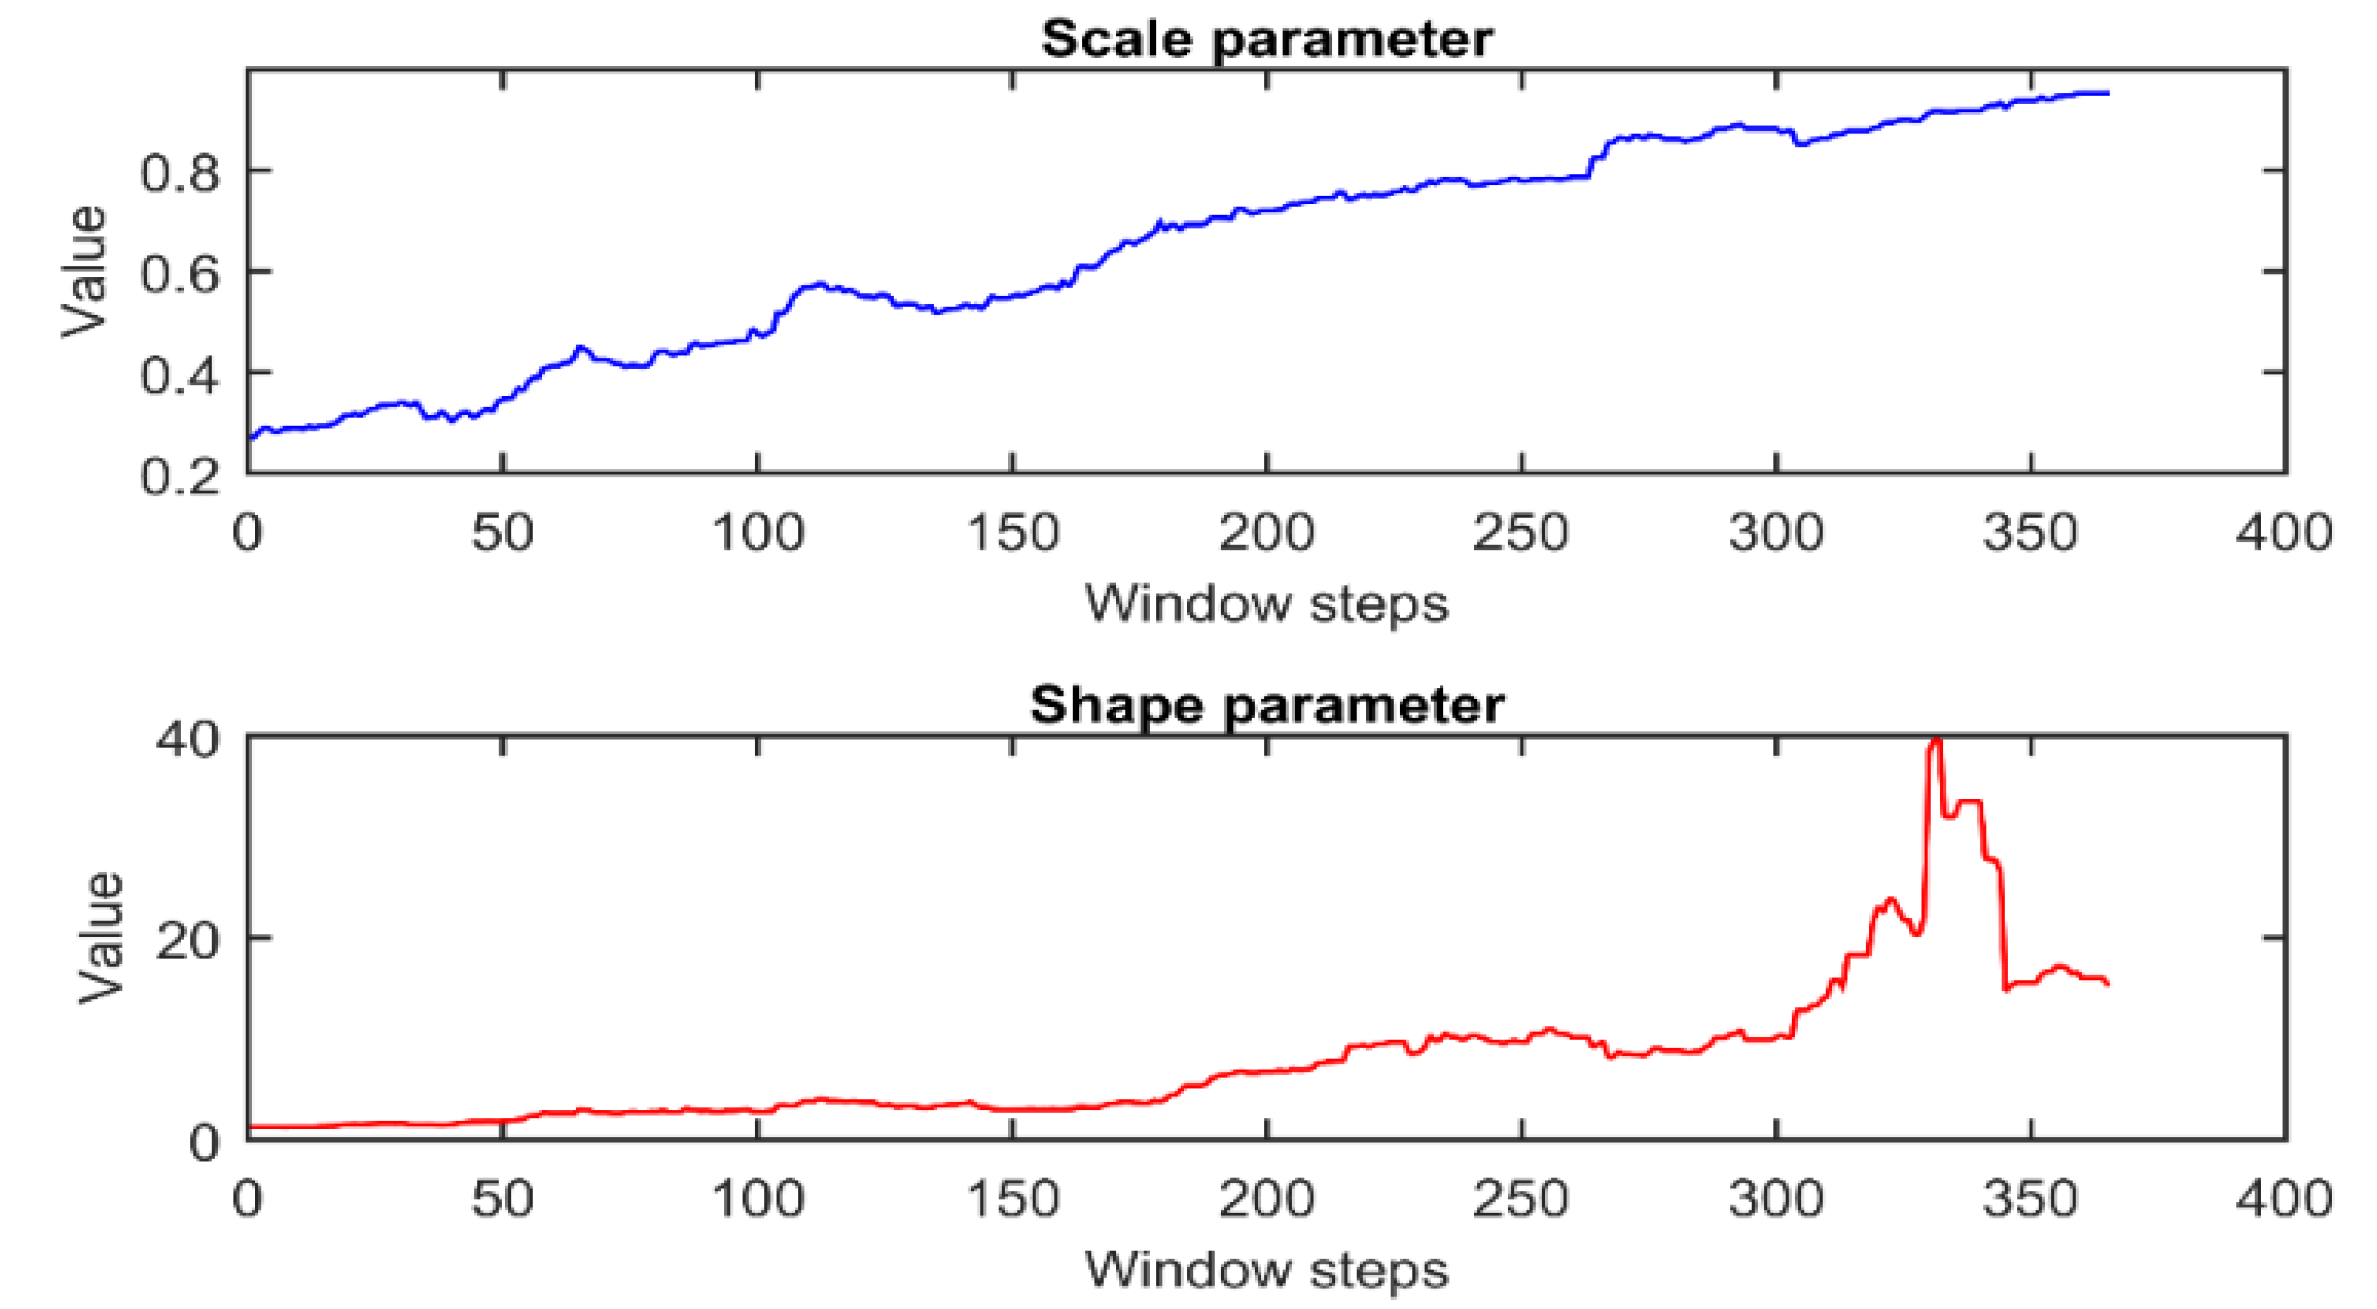
The performance of the proposed irradiance pattern generation model is investigated by utilizing four years of hourly solar irradiance data of a site located in Islamabad, Pakistan, located in time zone UTC+5. The Weibull distribution parameters of all moving windows for each hour is calculated using the procedure presented in Figure 3. The discrete Weibull distribution parameters are converted into a continuous form to achieve continuity by employing a GRNN curve fitting technique. The scale and shape parameters of Weibull distribution used for calculation of irradiance pattern at 9:00 am of all moving windows are shown in Figure 6. A flowchart for the generation of solar irradiance patterns is shown in Figure 5.

3.1. Assessment using Goodness-of-Fit Test

The proposed probabilistic generation model is validated using different Goodness of Fit (GOF) indicators. These indicators are determined by using the values of mean and standard deviation of reference and generated solar irradiance patterns. The comparison of the proposed modelling approach with the Beta distribution based probabilistic generation model presented in previous work [10] is performed based on GOF indicators. For this purpose, the values of GOF indicators for the Beta distribution based probabilistic model [10] are also computed in this work.

3.1.1. Mean Absolute Percentage Error (MAPE)

MAPE calculates the percentage error between the mean and standard deviation of reference and generated irradiance data patterns [42].
M A P E = 1 H ( i = h H [ | I h S h | ( 1 H i = h H S h ) ] )   × 100
where   I h and S h are the reference and generated sets of solar irradiance patterns at each hour (h) of the day, respectively.
a.
Mean
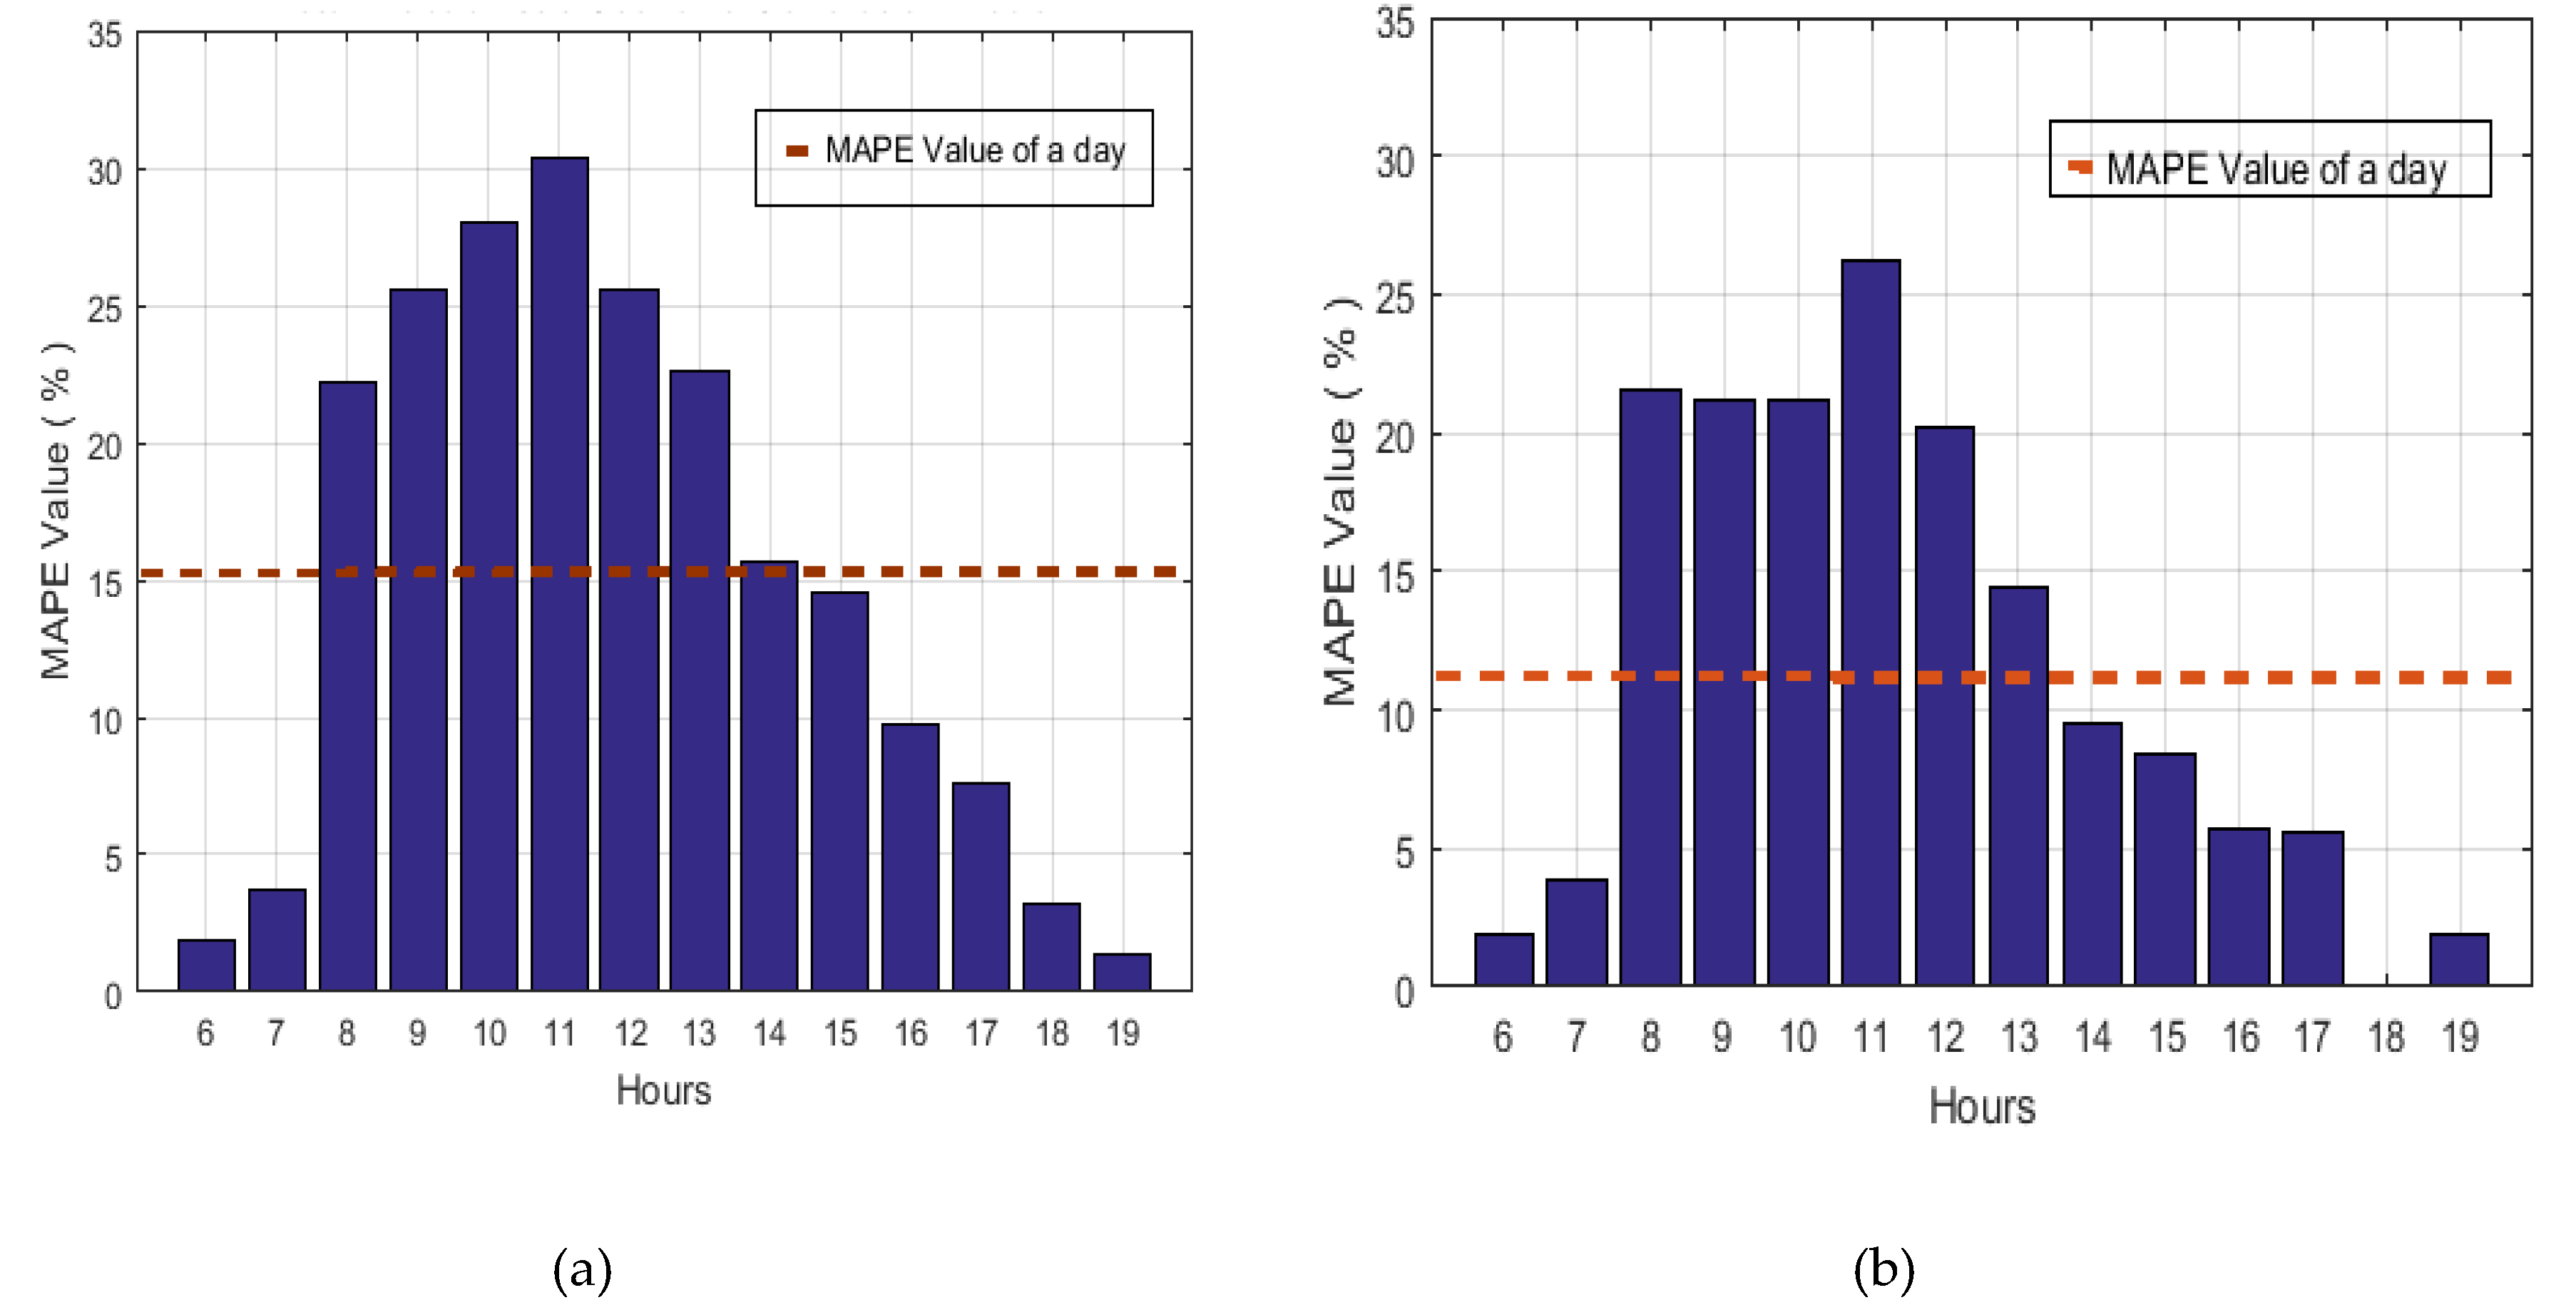
M A P E m e a n   determines the percentage error between the mean values of the reference and generated irradiance values. The maximum, minimum and average value of M A P E m e a n for both Beta and Weibull distribution based probabilistic generation models are presented in Table 2. Moreover, the M A P E m e a n value for each hour of the day are shown in Figure 7. This figure demonstrates that, for the Beta probabilistic model, M A P E m e a n has the maximum value of 30.36%, while it is 26.25% for the Weibull distribution based model. Similarly, the minimum value of M A P E m e a n for both Beta and Weibull distribution based models is 1.36% and 0.0825%, respectively. Furthermore, it can be seen from Table 2 and Figure 7 that the daily average M A P E m e a n calculated for both the Beta and Weibull distribution probabilistic generation models is 15.15% and 11.57%, respectively, which demonstrates a percentage improvement of 23.62% in the case of the Weibull distribution probabilistic model.
b.
Standard Deviation
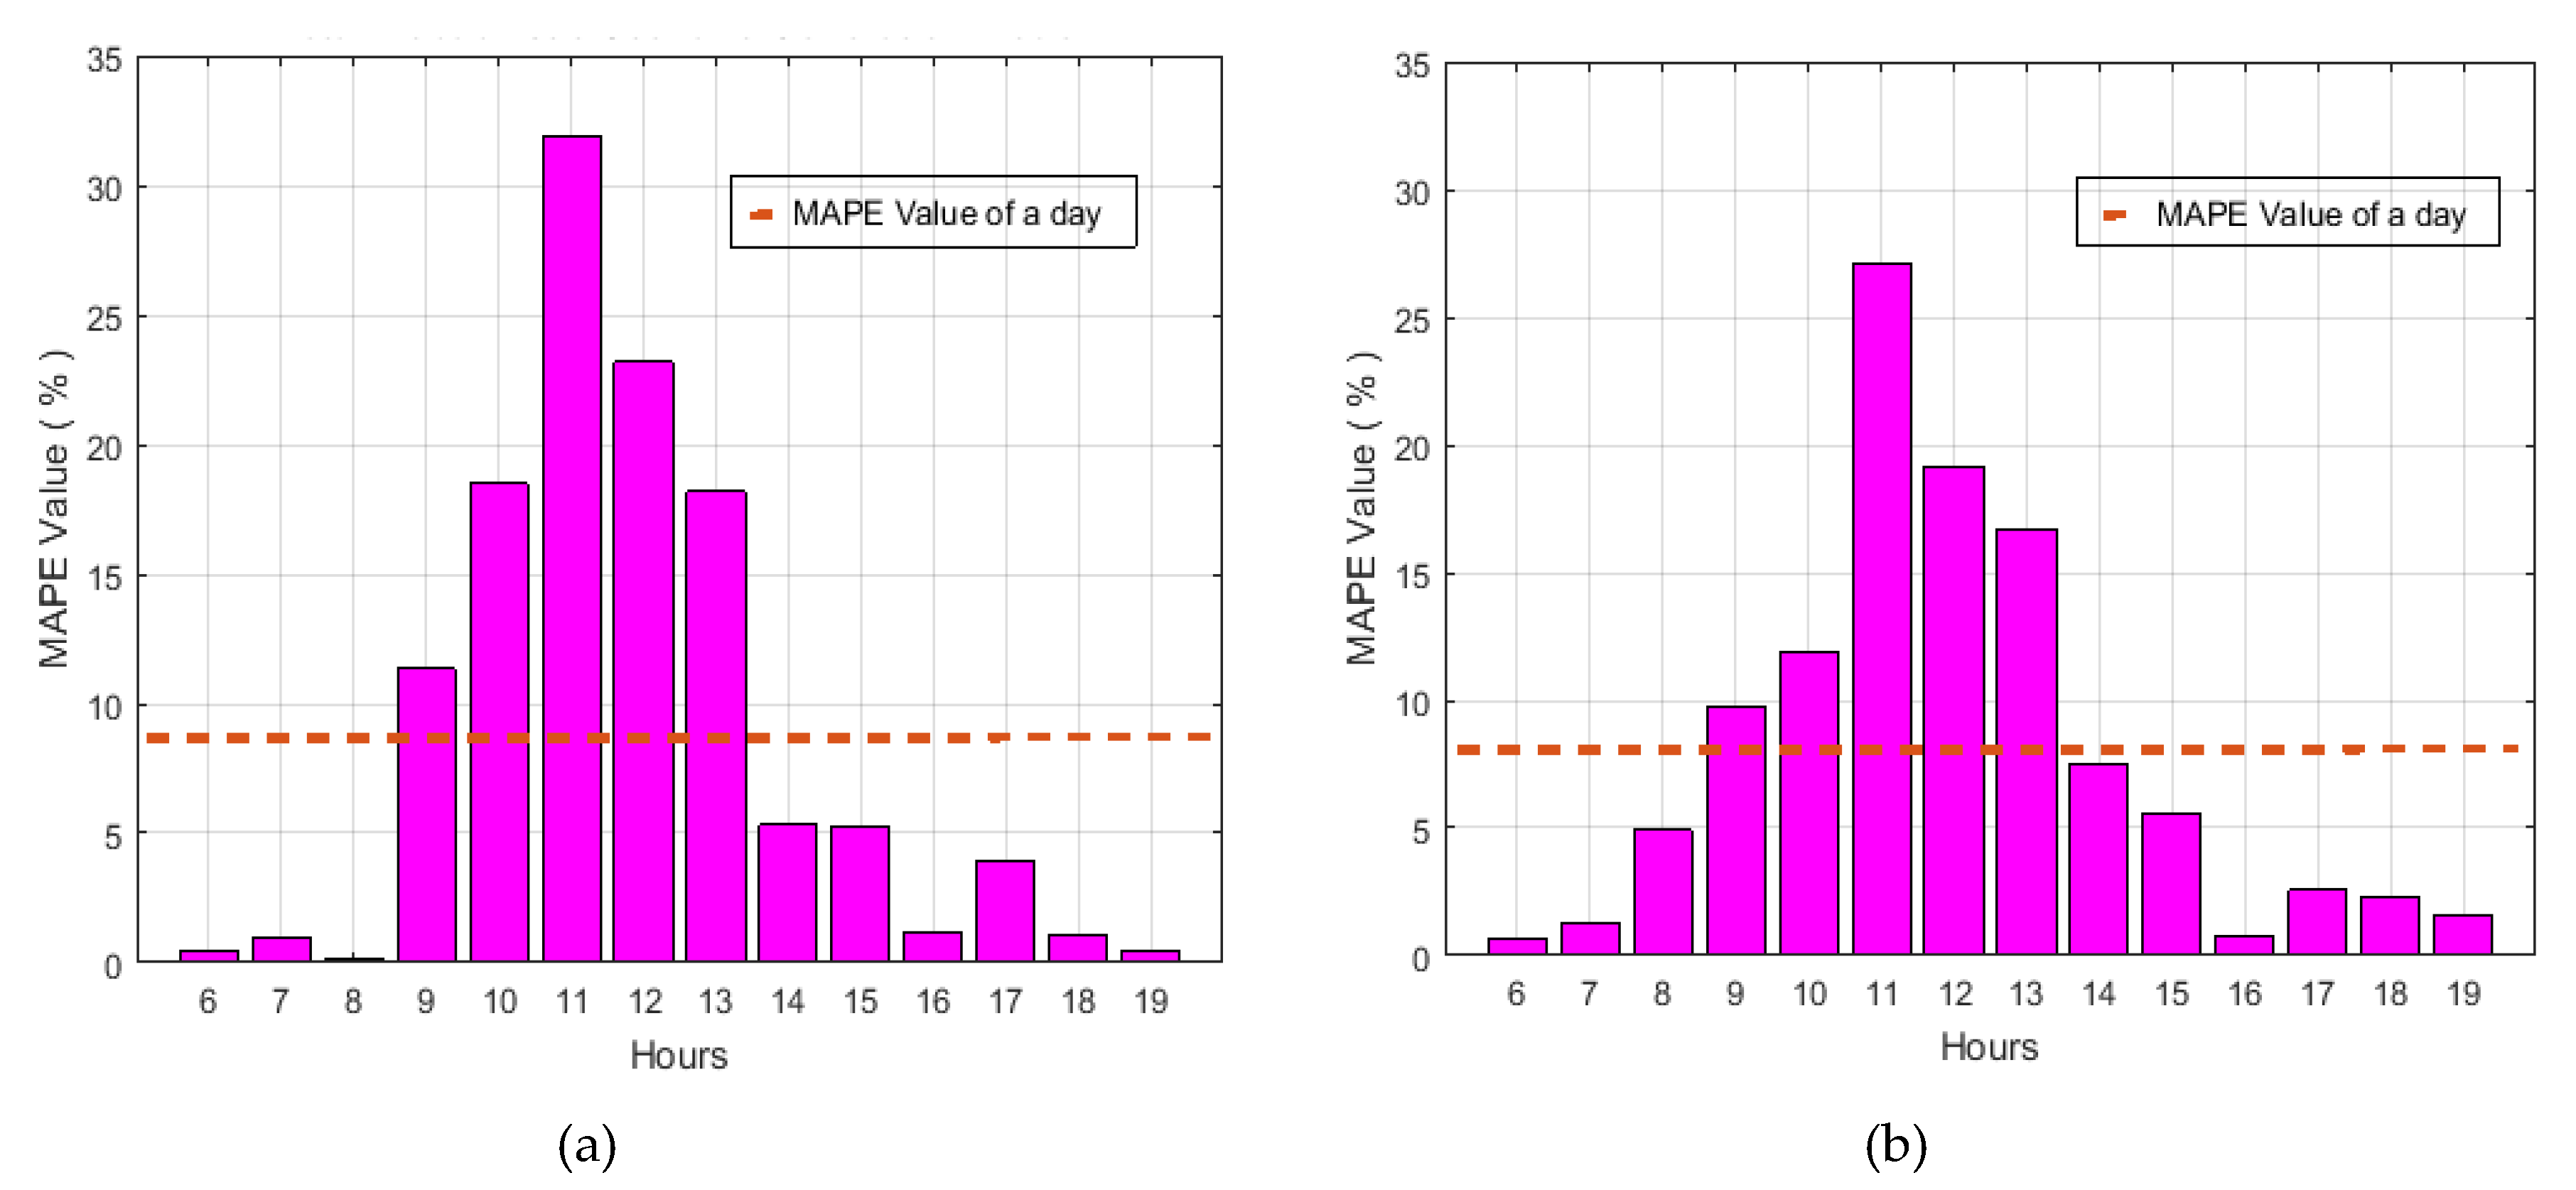
M A P E S T D determines the percentage error between the standard deviation values of the reference and generated irradiance values. The maximum, minimum, and average value of M A P E S T D for both the Beta and Weibull distribution based probabilistic generation models are presented in Table 3. Moreover, the M A P E S T D value for each hour of the day are shown in Figure 8, which demonstrates that, for the Beta probabilistic model, M A P E S T D has the maximum value of 31.89%, while it is 27.12% for Weibull distribution based model. Similarly, the minimum value of M A P E S T D for both the Beta and Weibull distribution based models is 0.2026% and 0.6366%, respectively. Furthermore, it can be seen from Table 3 and Figure 8 that the daily average M A P E S T D calculated for both the Beta and Weibull distribution probabilistic generation models is 8.72% and 7.98%, respectively, which demonstrates a percentage improvement of 8.5% in the case of the Weibull distribution probabilistic model. The percentage improvement of the daily average M A P E S T D demonstrates that solar irradiance patterns generated through the Weibull distribution probabilistic model are more accurate and in accordance with the reference patterns as compared to the Beta distribution model presented in [10].

3.1.2. Variance of Mean Absolute Percentage Error (MAPEvar)

M A P E v a r is used to calculate the variance and uncertainty of the proposed scenario generation model and is expressed with the following mathematical formulation.
M A P E v a r = 1 H ( i = h H [ | I h S h | ( 1 H i = h H S h ) M A P E 100 ] 2 ) × 100
a.
Mean
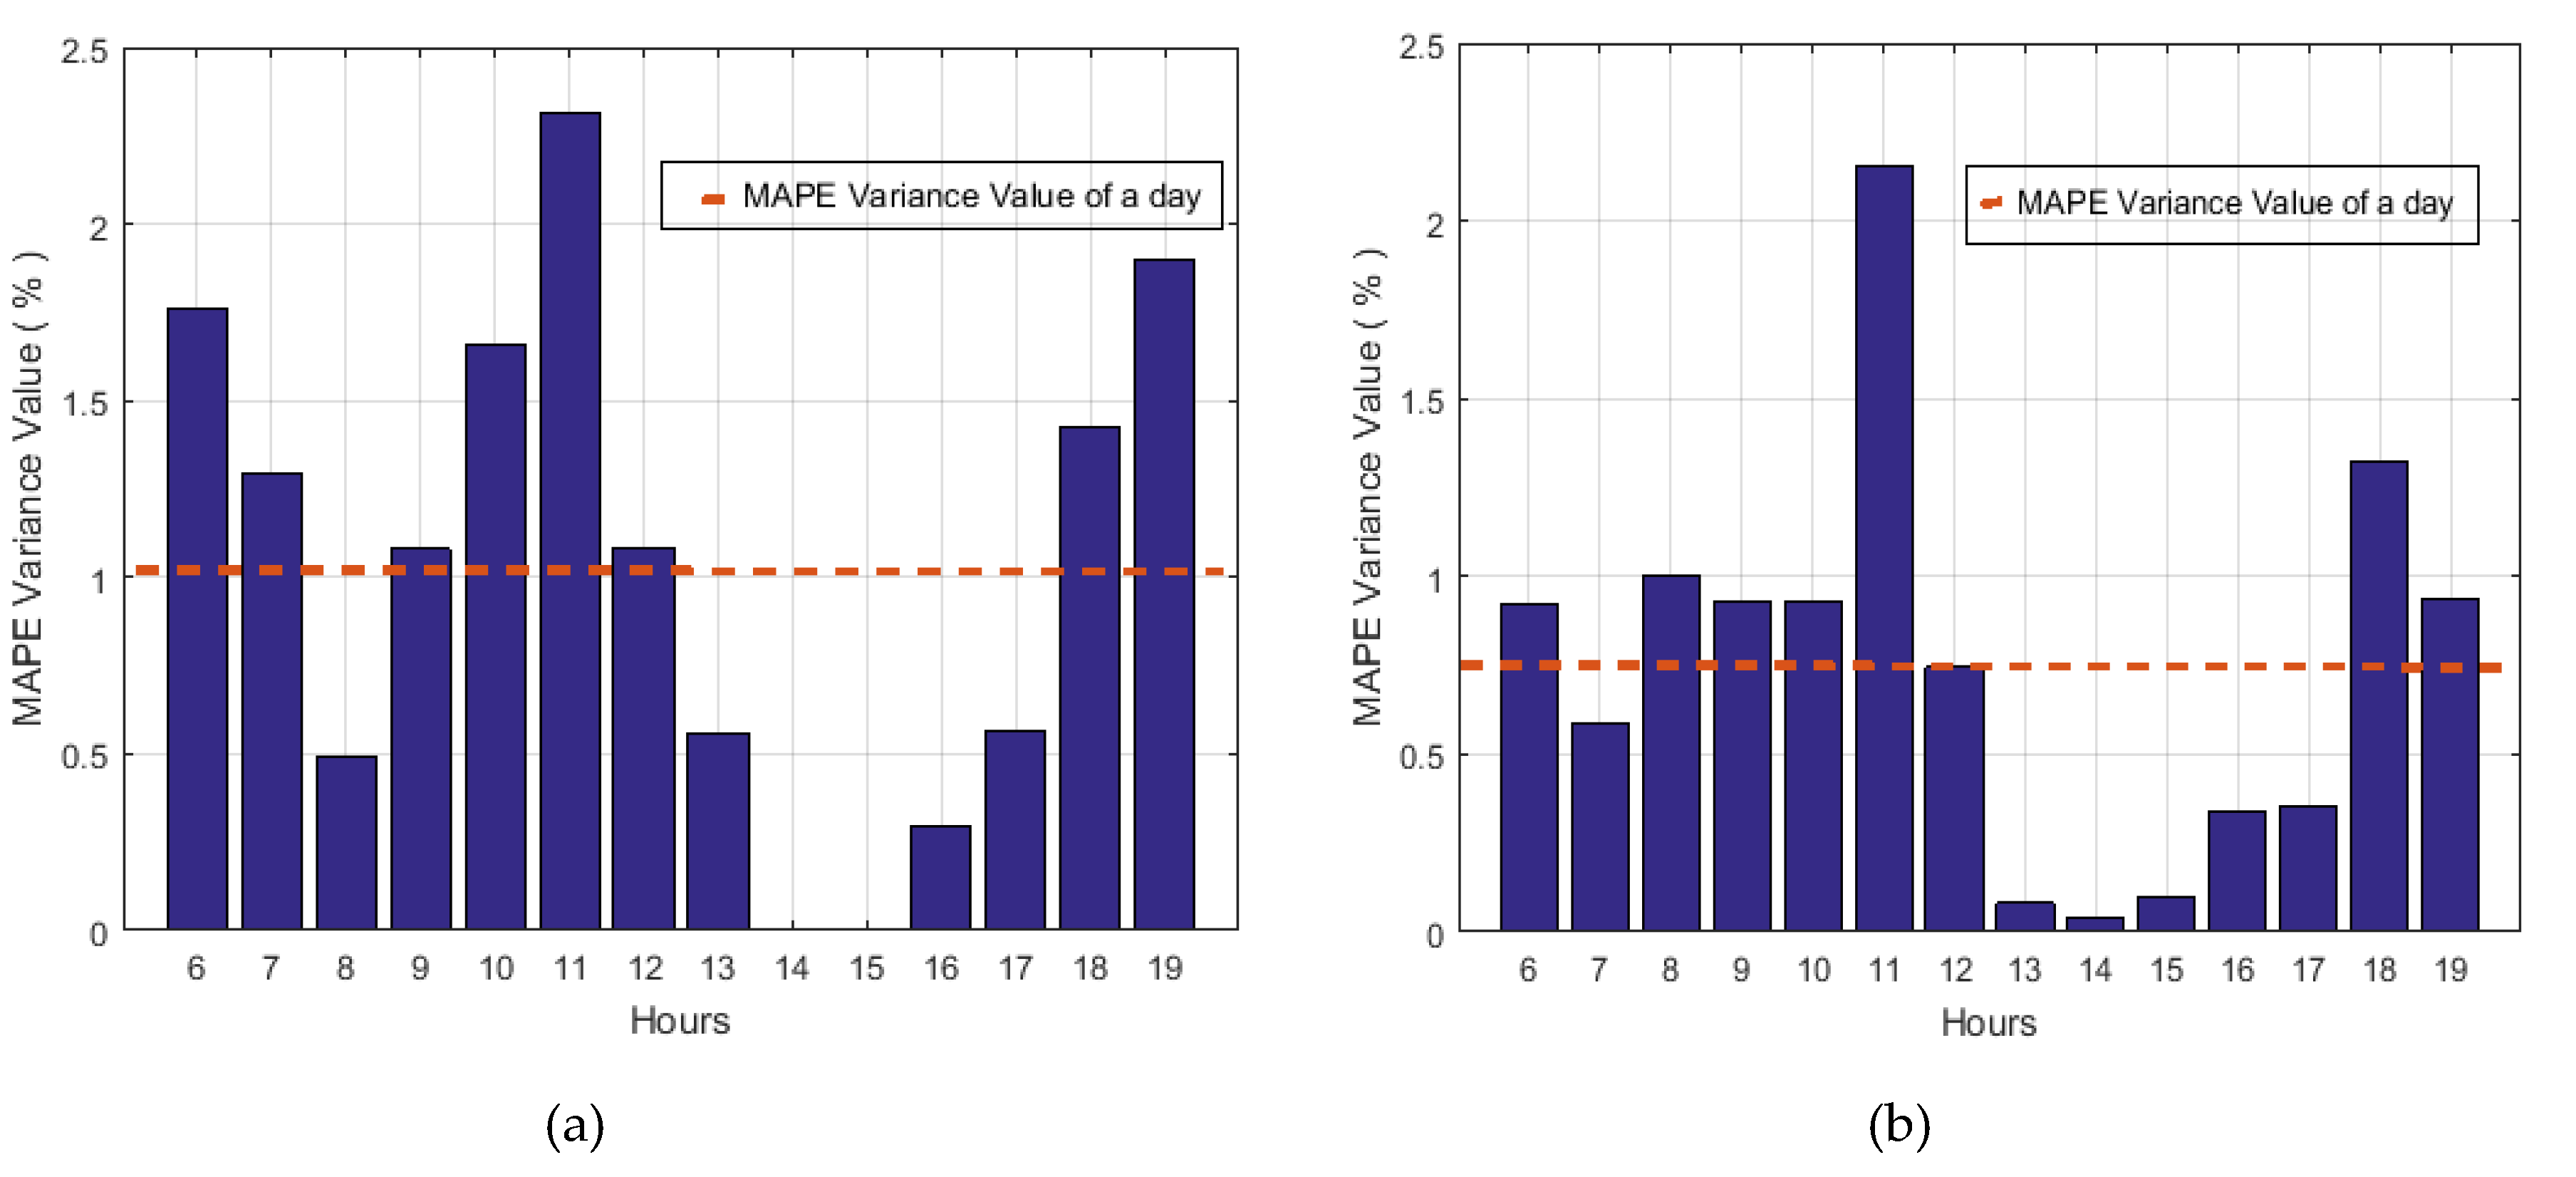
( M A P E v a r ) a v g determines the percentage error between the mean values of the reference and generated irradiance values. The maximum, minimum, and average value of ( M A P E v a r ) a v g for both the Beta and Weibull distribution based probabilistic generation models are presented in Table 4. Moreover, ( M A P E v a r ) a v g value for each hour of the day are shown in Figure 9, which demonstrates that for the Beta probabilistic model, ( M A P E v a r ) a v g has the maximum value of 2.41% while it is 2.1% for the Weibull distribution based model. Similarly, the minimum value of ( M A P E v a r ) a v g for both the Beta and Weibull distribution based models is 0.0012% and 0.0062%, respectively. Furthermore, it can be seen from Table 4 and Figure 9 that the daily average ( M A P E v a r ) a v g calculated for both the Beta and Weibull distribution probabilistic generation models is 1.053% and 0.7754%, respectively, which demonstrates a percentage improvement of 28.29% in the case of the Weibull distribution probabilistic model.
b.
Standard deviation
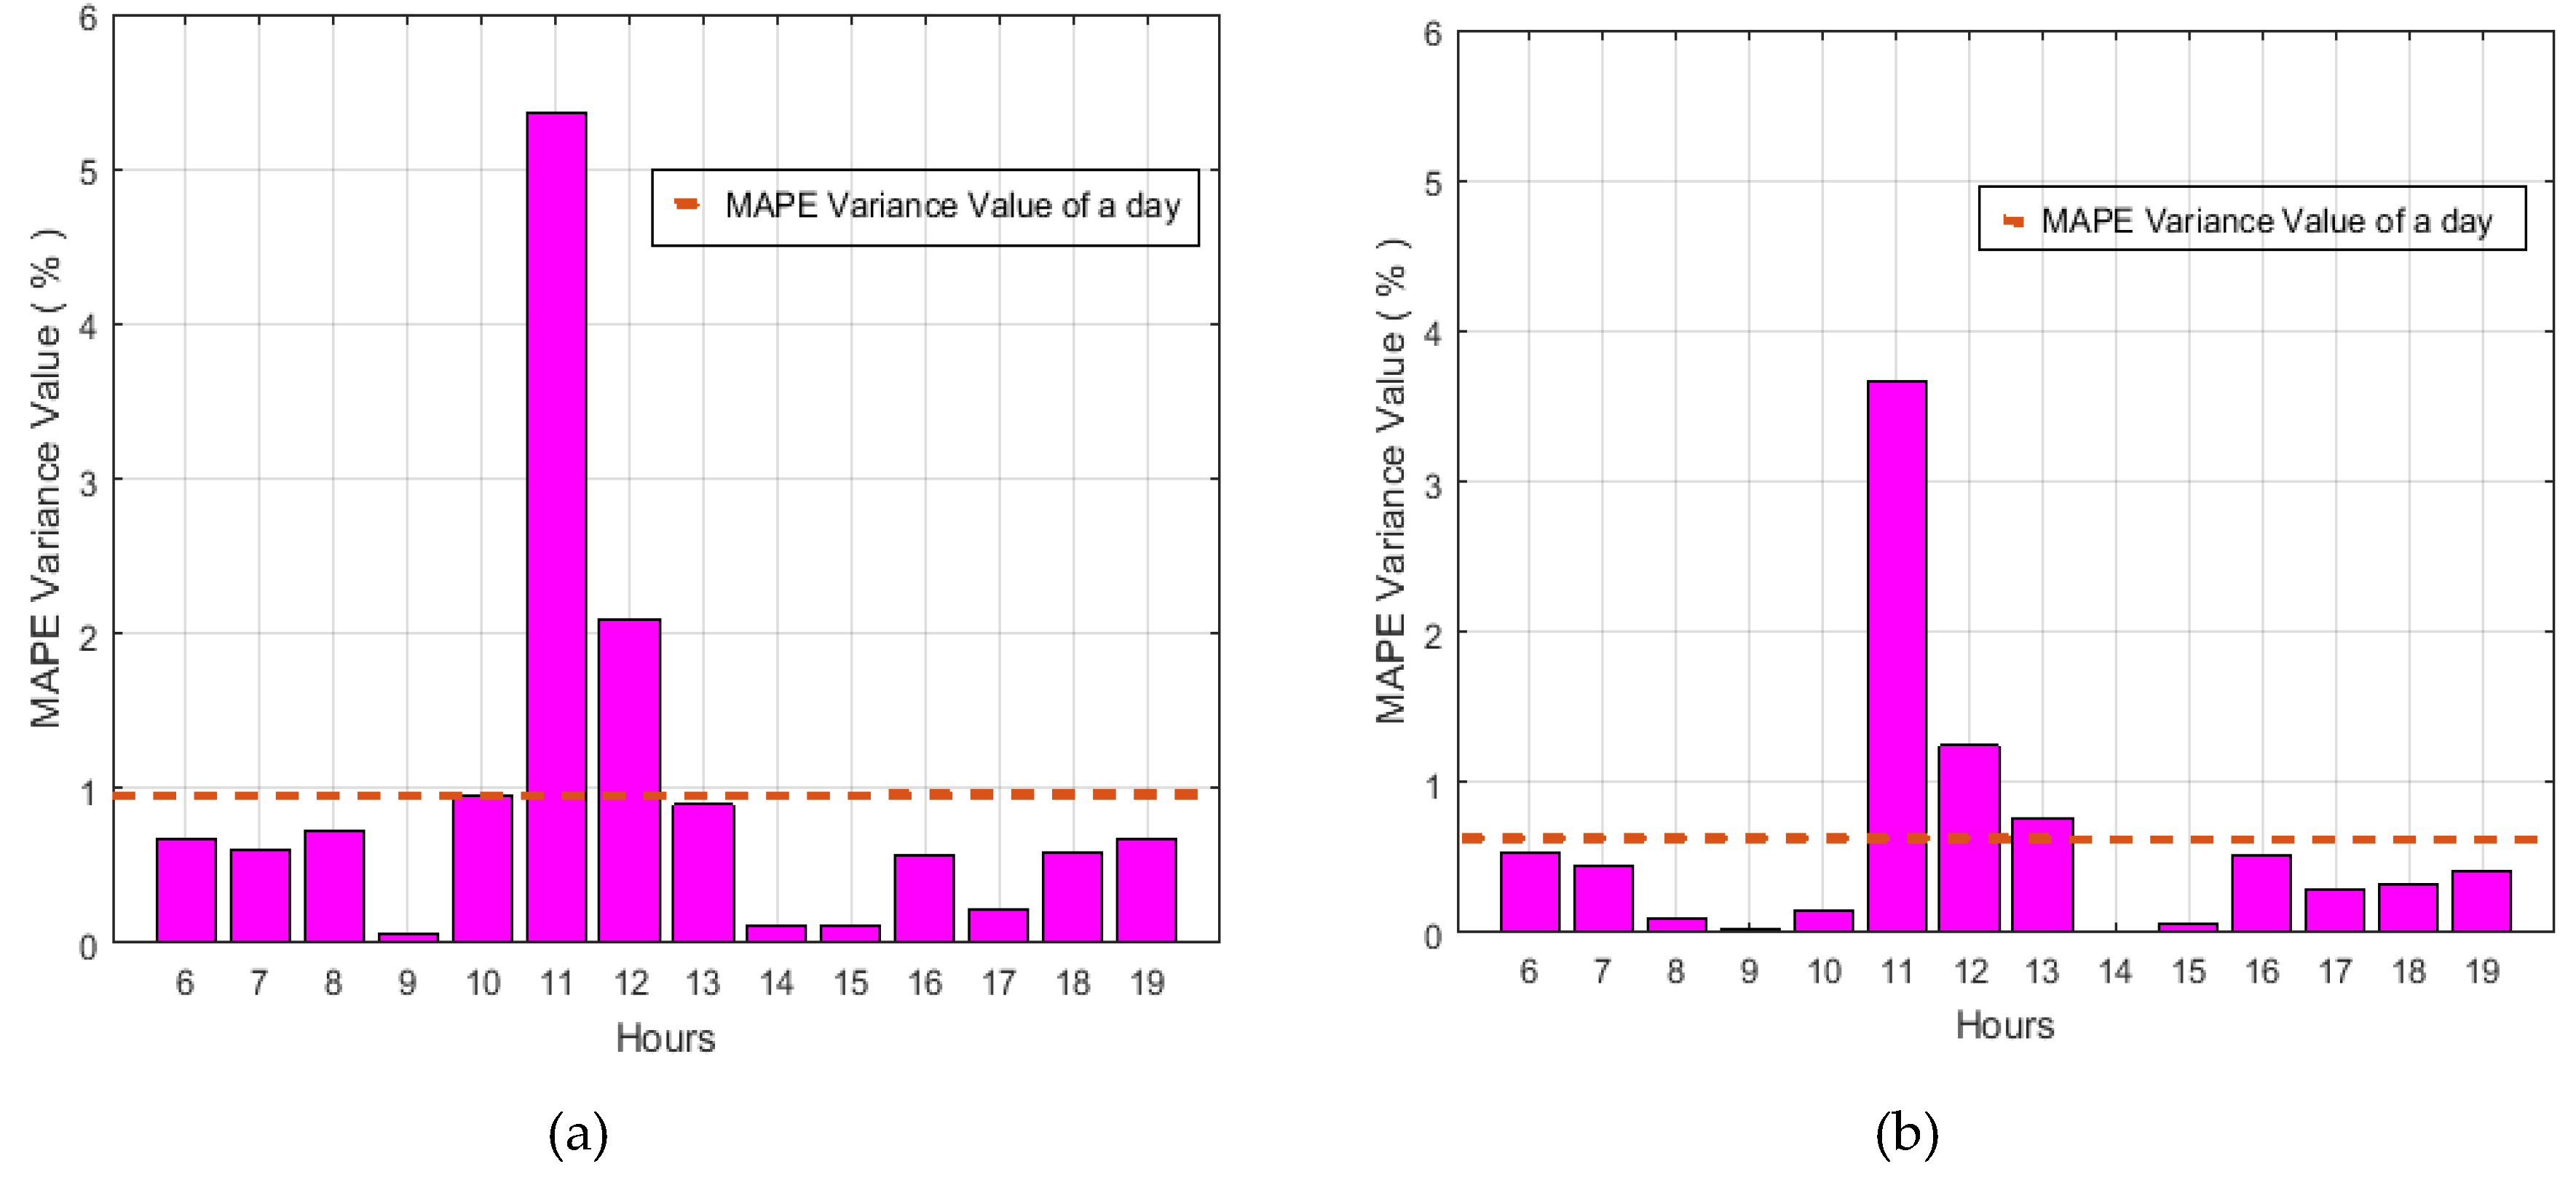
( M A P E v a r ) S T D determines the percentage error between the standard deviation values of the reference and generated irradiance values. The maximum, minimum, and average value of ( M A P E v a r ) S T D for both the Beta and Weibull distribution based probabilistic generation models are presented in Table 5. Moreover, ( M A P E v a r ) S T D value for each hour of the day are shown in Figure 10, which demonstrates that for the Beta probabilistic model, ( M A P E v a r ) S T D has the maximum value of 5.3686% while it is 3.6669% for the Weibull distribution based model. Similarly, the minimum value of ( M A P E v a r ) S T D for both the Beta and Weibull distribution based models is 0.0679% and 0.0019%, respectively. Furthermore, it can be seen from Table 5 and Figure 10 that the daily average ( M A P E v a r ) S T D calculated for the Beta and Weibull distribution probabilistic generation models is 0.9760% and 0.6101%, respectively, which demonstrates a percentage improvement of 37.48% in the case of the Weibull distribution probabilistic model.

3.2. Autocorrelation between Reference and Generated Irradiance Patterns

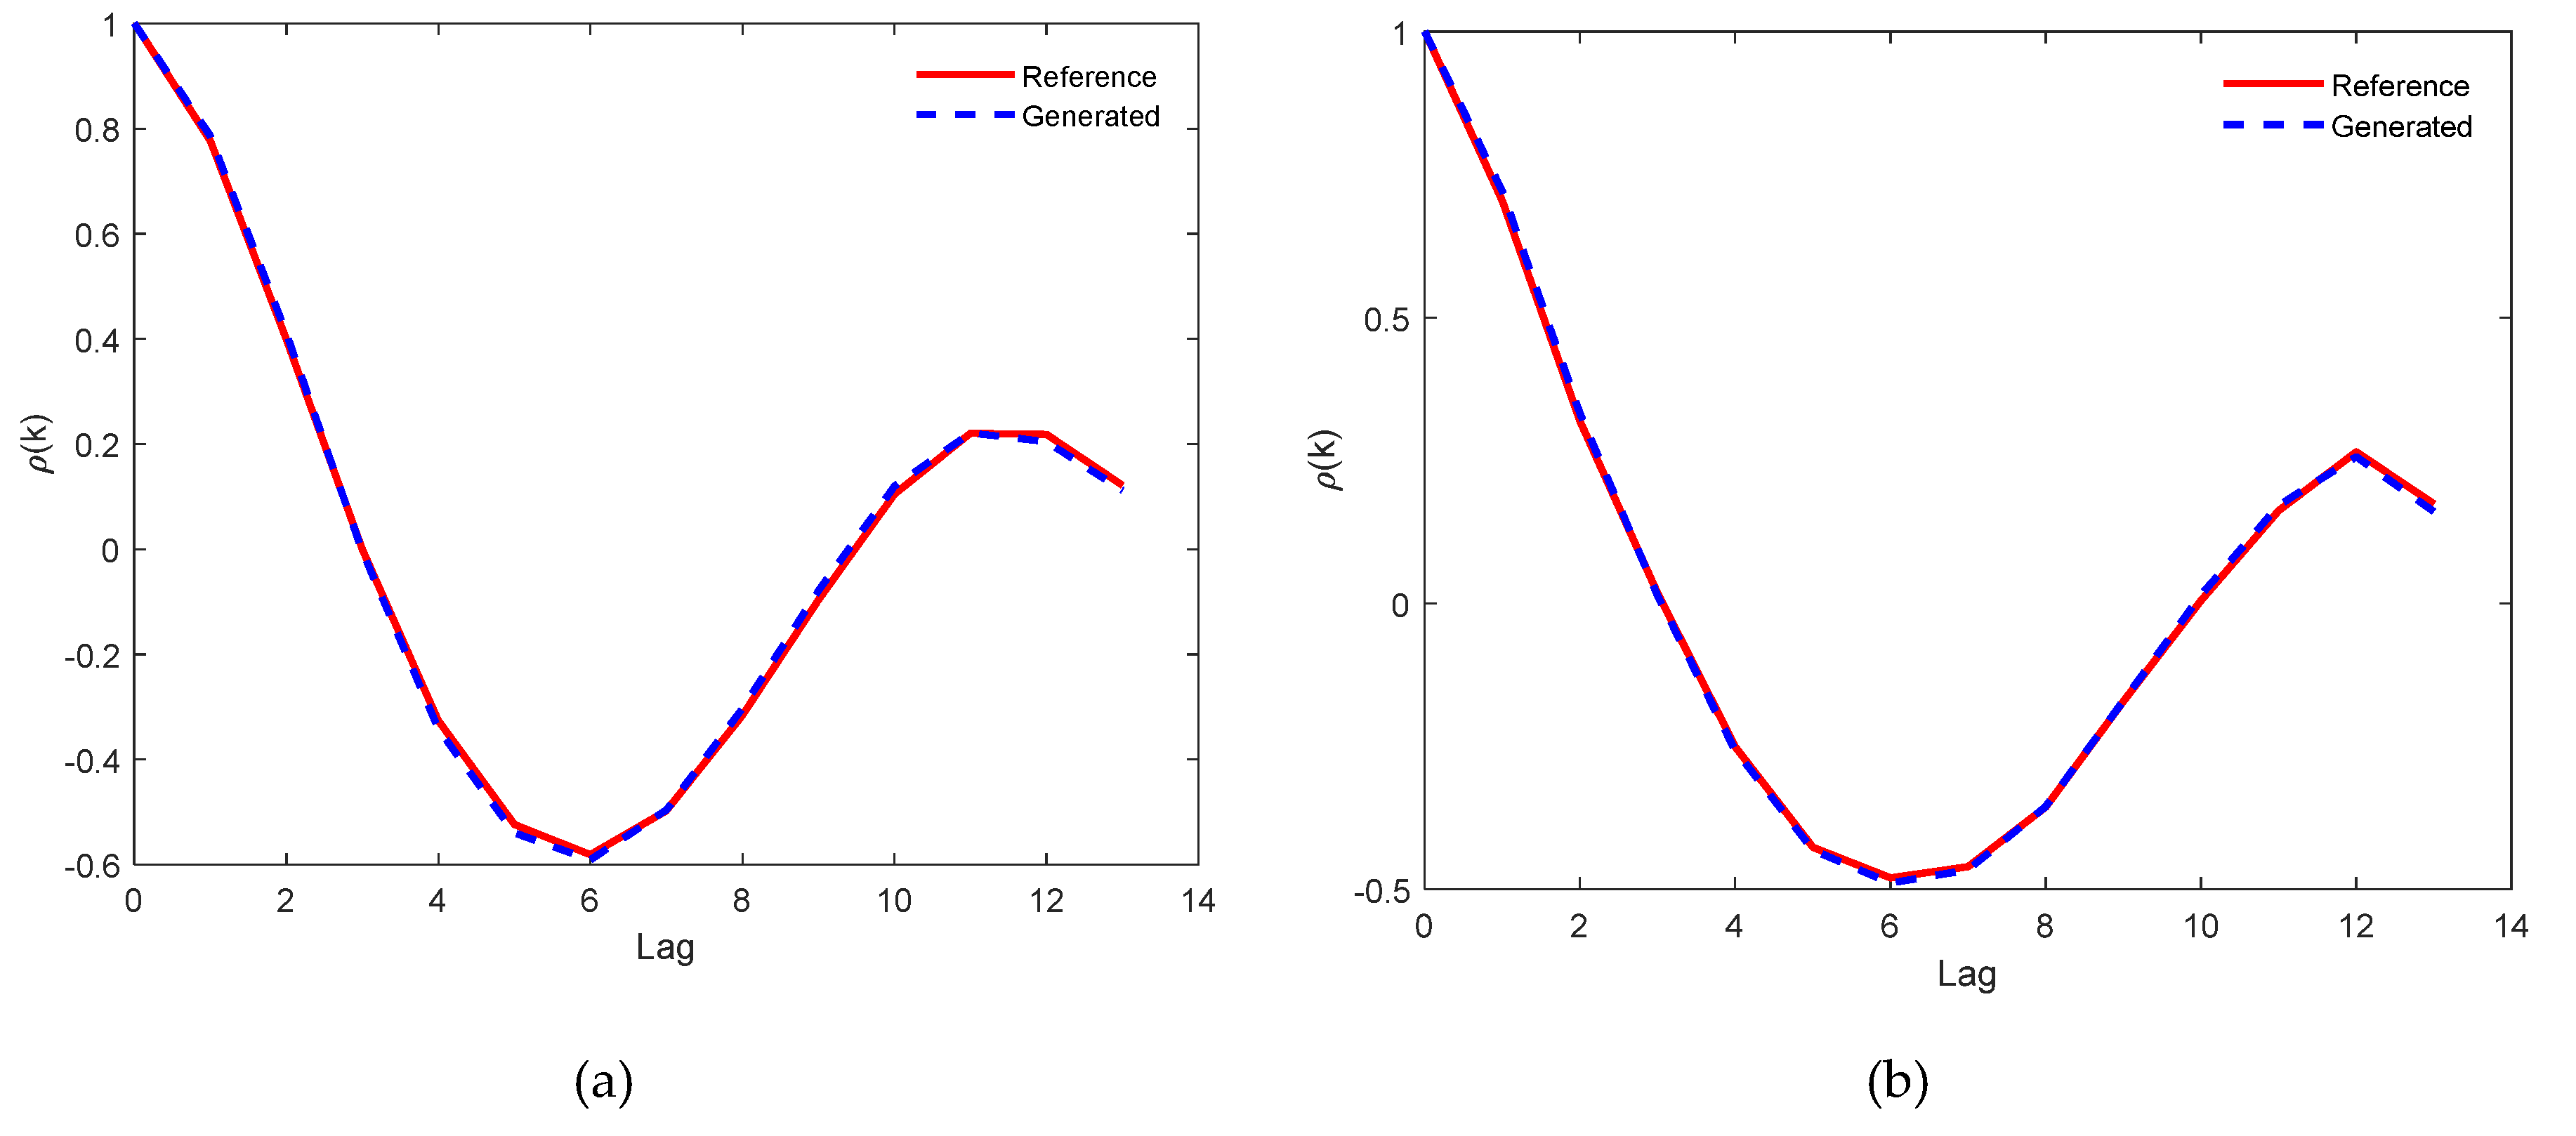
Autocorrelation is a reliable GOF indicator to find out time coupling between the values at different instants. It is calculated for the mean and standard deviation of the reference and generated solar irradiance patterns. Figure 11a,b presents correlation with respect to different time lags. It is observed that the behavior of autocorrelation is almost similar for both irradiance patterns. In addition, autocorrelation of the proposed method has considerable improvement in comparison with the results presented in [43], and it demonstrates the effectiveness of the proposed approach.

4. Conclusions and Future Work

A probabilistic technique based on Weibull distribution for the generation of solar irradiance patterns has been presented. GOF indicators, MAPE, and autocorrelation are used for validation of the proposed model. Results generated through the Weibull distribution based probabilistic model are compared with the results of the Beta probabilistic distribution model. MAPE and autocorrelation results show validity of the proposed model. In comparison with the Beta distribution model, percentage improvements in MAPE for mean and standard deviation of the reference and generated irradiance patterns are 23.62% and 8.505%, respectively.
The performance of the presented technique can further be improved by introducing other exogenous variable (temperature, cloud cover, humidity, etc.) into the modeling process in future. In addition, testing of this technique for online applications needs to be assessed and verified.
The proposed method can be used to generate multiple solar generation patterns for scenario analysis in different power system studies, such as offline testing and construction and planning of power system. The proposed probabilistic technique can further be adopted for the construction of wind, thermal, and hydro power generation patterns. Furthermore, the principles adopted in this research may be used to model uncertainties associated with transmission or distribution system losses (generation and load differences) if reference data is available.

Author Contributions

Conceptualization, M.U.A., I.A.S., and I.T.; methodology, M.U.A., I.A.S., and M.F.N.K.; software, M.U.A., I.A.S., W.H. and M.F.N.K.; validation, W.u.R., S.S.H., A.R.B., and S.A.; writing—original draft preparation, I.A.S., M.F.N.K., K.N.P., I.T., W.H., and A.B.A.; writing—review and editing, I.A.S., A.B.A. and R.L.; supervision, I.A.S.; project administration, I.T., I.A.S., M.Z., A.B.A., and W.H.; funding acquisition, I.T., M.Z., W.H., and A.B.A. All authors have read and agreed to the published version of the manuscript.

Funding

This research is supported by the Deanship of Scientific Research, Majmaah University, Saudi Arabia under the contract number RPG-2019-21.

Conflicts of Interest

The authors declare no conflict of interest.

References

  1. Farivar, G.; Asaei, B. A new approach for solar module temperature estimation using the simple diode model. IEEE Trans. Energy Convers. 2011, 26, 1118–1126. [Google Scholar] [CrossRef]
  2. Deng, R.; Chang, N.L.; Ouyang, Z.; Chong, C.M. A techno-economic review of silicon photovoltaic module recycling. Renew. Sustain. Energy Rev. 2019, 109, 532–550. [Google Scholar] [CrossRef]
  3. Pereira da Silva, P.; Dantas, G.; Pereira, G.I.; Câmara, L.; De Castro, N.J. Photovoltaic distributed generation—An international review on diffusion, support policies, and electricity sector regulatory adaptation. Renew. Sustain. Energy Rev. 2019, 103, 30–39. [Google Scholar] [CrossRef]
  4. Sawin, J.L.; Martinot, E.; Sonntag-O’Brien, V.; McCrone, A.; Roussell, J.; Barnes, D.; Flavin, C.; Mastny, L.; Kraft, D.; Wang, S. Renewables 2010-Global Status Report. 2010. Available online: http://www.ren21.net/Portals/0/documents/activities/gsr/REN21_GSR_2010_full_revised%20Sept2010.pdf (accessed on 4 December 2019).
  5. D’Adamo, I. The profitability of residential photovoltaic systems. A new scheme of subsidies based on the price of CO2 in a developed PV market. Soc. Sci. 2018, 7, 148. [Google Scholar]
  6. Jo, B.-K.; Jang, G. An Evaluation of the Effect on the Expansion of Photovoltaic Power Generation According to Renewable Energy Certificates on Energy Storage Systems: A Case Study of the Korean Renewable Energy Market. Sustainability 2019, 11, 4337. [Google Scholar] [CrossRef] [Green Version]
  7. Horan, W.; Shawe, R.; O’Regan, B. Ireland’s transition towards a low carbon society: The leadership role of higher education institutions in solar photovoltaic niche development. Sustainability 2019, 11, 558. [Google Scholar] [CrossRef] [Green Version]
  8. Choudhary, P.; Srivastava, R.K. Sustainability perspectives—A review for solar photovoltaic trends and growth opportunities. J. Clean. Product. 2019, 227, 589–612. [Google Scholar] [CrossRef]
  9. Khatod, D.K.; Pant, V.; Sharma, J. Evolutionary programming based optimal placement of renewable distributed generators. Ieee Trans. Power Syst. 2012, 28, 683–695. [Google Scholar] [CrossRef]
  10. Khan, M.F.N.; Malik, T.N. Probablistic generation model for optimal allocation of PV DG in distribution system with time-varying load models. J. Renew. Sustain. Energy 2017, 9, 065503. [Google Scholar] [CrossRef]
  11. Lara-Fanego, V.; Ruiz-Arias, J.; Pozo-Vázquez, D.; Santos-Alamillos, F.; Tovar-Pescador, J. Evaluation of the WRF model solar irradiance forecasts in Andalusia (southern Spain). Sol. Energy 2012, 86, 2200–2217. [Google Scholar] [CrossRef]
  12. Gottwalt, S.; Garttner, J.; Schmeck, H.; Weinhardt, C. Modeling and Valuation of Residential Demand Flexibility for Renewable Energy Integration. IEEE Trans. Smart Grid 2017, 8, 2565–2574. [Google Scholar] [CrossRef]
  13. Tan, Z.; Zhang, H.; Xu, J.; Wang, J.; Yu, C.; Zhang, J. Photovoltaic power generation in China: Development potential, benefits of energy conservation and emission reduction. J. Energy Eng. 2011, 138, 73–86. [Google Scholar] [CrossRef]
  14. Aguiar, R.; Collares-Pereira, M. Statistical properties of hourly global radiation. Sol. Energy 1992, 48, 157–167. [Google Scholar] [CrossRef]
  15. Moreno-Munoz, A.; De la Rosa, J.; Posadillo, R.; Bellido, F. Very short term forecasting of solar radiation. In Proceedings of the 2008 33rd IEEE Photovoltaic Specialists Conference, San Diego, CA, USA, 11–16 May 2008; pp. 1–5. [Google Scholar]
  16. Anderson, D.; Leach, M. Harvesting and redistributing renewable energy: On the role of gas and electricity grids to overcome intermittency through the generation and storage of hydrogen. Energy Policy 2004, 32, 1603–1614. [Google Scholar] [CrossRef]
  17. Caruso, G.; Gattone, S.A.; Balzanella, A.; Di Battista, T. Cluster analysis: An application to a real mixed-type data set. In Models and Theories in Social Systems; Springer: New York, NY, USA, 2019; pp. 525–533. [Google Scholar]
  18. Teke, A.; Yıldırım, H.B.; Çelik, Ö. Evaluation and performance comparison of different models for the estimation of solar radiation. Renew. Sustain. Energy Rev. 2015, 50, 1097–1107. [Google Scholar] [CrossRef]
  19. Khatib, T.; Mohamed, A.; Sopian, K. A review of solar energy modeling techniques. Renew. Sustain. Energy Rev. 2012, 16, 2864–2869. [Google Scholar] [CrossRef]
  20. Yorukoglu, M.; Celik, A.N. A critical review on the estimation of daily global solar radiation from sunshine duration. Energy Convers. Manag. 2006, 47, 2441–2450. [Google Scholar] [CrossRef]
  21. Besharat, F.; Dehghan, A.A.; Faghih, A.R. Empirical models for estimating global solar radiation: A review and case study. Renew. Sustain. Energy Rev. 2013, 21, 798–821. [Google Scholar] [CrossRef]
  22. Duzen, H.; Aydin, H. Sunshine-based estimation of global solar radiation on horizontal surface at Lake Van region (Turkey). Energy Convers. Manag. 2012, 58, 35–46. [Google Scholar] [CrossRef]
  23. Teke, A.; Yıldırım, H.B. Estimating the monthly global solar radiation for Eastern Mediterranean Region. Energy Convers. Manag. 2014, 87, 628–635. [Google Scholar] [CrossRef]
  24. Salameh, Z.M.; Borowy, B.S.; Amin, A.R. Photovoltaic module-site matching based on the capacity factors. IEEE Trans. Energy Convers. 1995, 10, 326–332. [Google Scholar] [CrossRef]
  25. Hung, D.Q.; Mithulananthan, N.; Lee, K.Y. Determining PV penetration for distribution systems with time-varying load models. IEEE Trans. Power Syst. 2014, 29, 3048–3057. [Google Scholar] [CrossRef]
  26. Hagan, K.E.; Oyebanjo, O.O.; Masaud, T.M.; Challoo, R. A probabilistic forecasting model for accurate estimation of PV solar and wind power generation. In Proceedings of the 2016 IEEE Power and Energy Conference at Illinois (PECI), Urbana, IL, USA, 19–20 February 2016; pp. 1–5. [Google Scholar]
  27. Ashtari, A.; Bibeau, E.; Shahidinejad, S.; Molinski, T. PEV charging profile prediction and analysis based on vehicle usage data. IEEE Trans. Smart Grid 2011, 3, 341–350. [Google Scholar] [CrossRef]
  28. Ali, S.; Lee, S.-M.; Jang, C.-M. Statistical analysis of wind characteristics using Weibull and Rayleigh distributions in Deokjeok-do Island–Incheon, South Korea. Renew. Energy 2018, 123, 652–663. [Google Scholar] [CrossRef]
  29. Shoaib, M.; Siddiqui, I.; Amir, Y.M.; Rehman, S.U. Evaluation of wind power potential in Baburband (Pakistan) using Weibull distribution function. Renew. Sustain. Energy Rev. 2017, 70, 1343–1351. [Google Scholar] [CrossRef]
  30. Labeeuw, W.; Deconinck, G. Customer sampling in a smart grid pilot. In Proceedings of the 2012 IEEE Power and Energy Society General Meeting, San Diego, CA, USA, 22–26 July 2012; pp. 1–7. [Google Scholar]
  31. Elminir, H.K.; Azzam, Y.A.; Younes, F.I. Prediction of hourly and daily diffuse fraction using neural network, as compared to linear regression models. Energy 2007, 32, 1513–1523. [Google Scholar] [CrossRef]
  32. Rahimikhoob, A. Estimating global solar radiation using artificial neural network and air temperature data in a semi-arid environment. Renew. Energy 2010, 35, 2131–2135. [Google Scholar] [CrossRef]
  33. Korachagaon, I. Estimating Global Solar Radiation Potential for Brazil by Iranna-Bapat’s Regression Models. Int. J. Emerg. Technol. Adv. Eng. 2012, 2, 178–186. [Google Scholar]
  34. Woodruff, D.L.; Deride, J.; Staid, A.; Watson, J.-P.; Slevogt, G.; Silva-Monroy, C. Constructing probabilistic scenarios for wide-area solar power generation. Sol. Energy 2018, 160, 153–167. [Google Scholar] [CrossRef]
  35. Hammer, A.; Heinemann, D.; Lorenz, E.; Lückehe, B. Short-term forecasting of solar radiation: A statistical approach using satellite data. Sol. Energy 1999, 67, 139–150. [Google Scholar] [CrossRef]
  36. Lorenz, E.; Remund, J.; Müller, S.C.; Traunmüller, W.; Steinmaurer, G.; Pozo, D.; Ruiz-Arias, J.A.; Fanego, V.L.; Ramirez, L.; Romeo, M.G. Benchmarking of different approaches to forecast solar irradiance. In Proceedings of the 24th European Photovoltaic Solar Energy Conference, Hamburg, Germany, 21–25 September 2009; pp. 21–25. [Google Scholar]
  37. Buizza, R. The value of probabilistic prediction. Atmos. Sci. Lett. 2008, 9, 36–42. [Google Scholar] [CrossRef]
  38. Balasubramanyam, C.; Ajay, M.; Spandana, K.; Shetty, A.B.; Seetharamu, K. Curve fitting for coarse data using artificial neural network. WSEAS Trans. Math. 2014, 13, 406–415. [Google Scholar]
  39. Bekker, P.A.; Bouwman, K.E. Arbitrage smoothing in fitting a sequence of yield curves. Int. J. Theor. Appl. Financ. 2009, 12, 577–588. [Google Scholar] [CrossRef]
  40. Bishop, C.M.; Roach, C. Fast curve fitting using neural networks. Rev. Sci. Instrum. 1992, 63, 4450–4456. [Google Scholar] [CrossRef] [Green Version]
  41. Feng, Y.; Peng, Y.; Cui, N.; Gong, D.; Zhang, K. Modeling reference evapotranspiration using extreme learning machine and generalized regression neural network only with temperature data. Comput. Electron. Agric. 2017, 136, 71–78. [Google Scholar] [CrossRef]
  42. Del Carmen Bas, M.; Ortiz, J.; Ballesteros, L.; Martorell, S. Forecasting 7BE concentrations in surface air using time series analysis. Atmos. Environ. 2017, 155, 154–161. [Google Scholar]
  43. Sajjad, I.A.; Chicco, G.; Napoli, R. Probabilistic generation of time-coupled aggregate residential demand patterns. IET Gener. Transm. Distrib. 2015, 9, 789–797. [Google Scholar] [CrossRef]
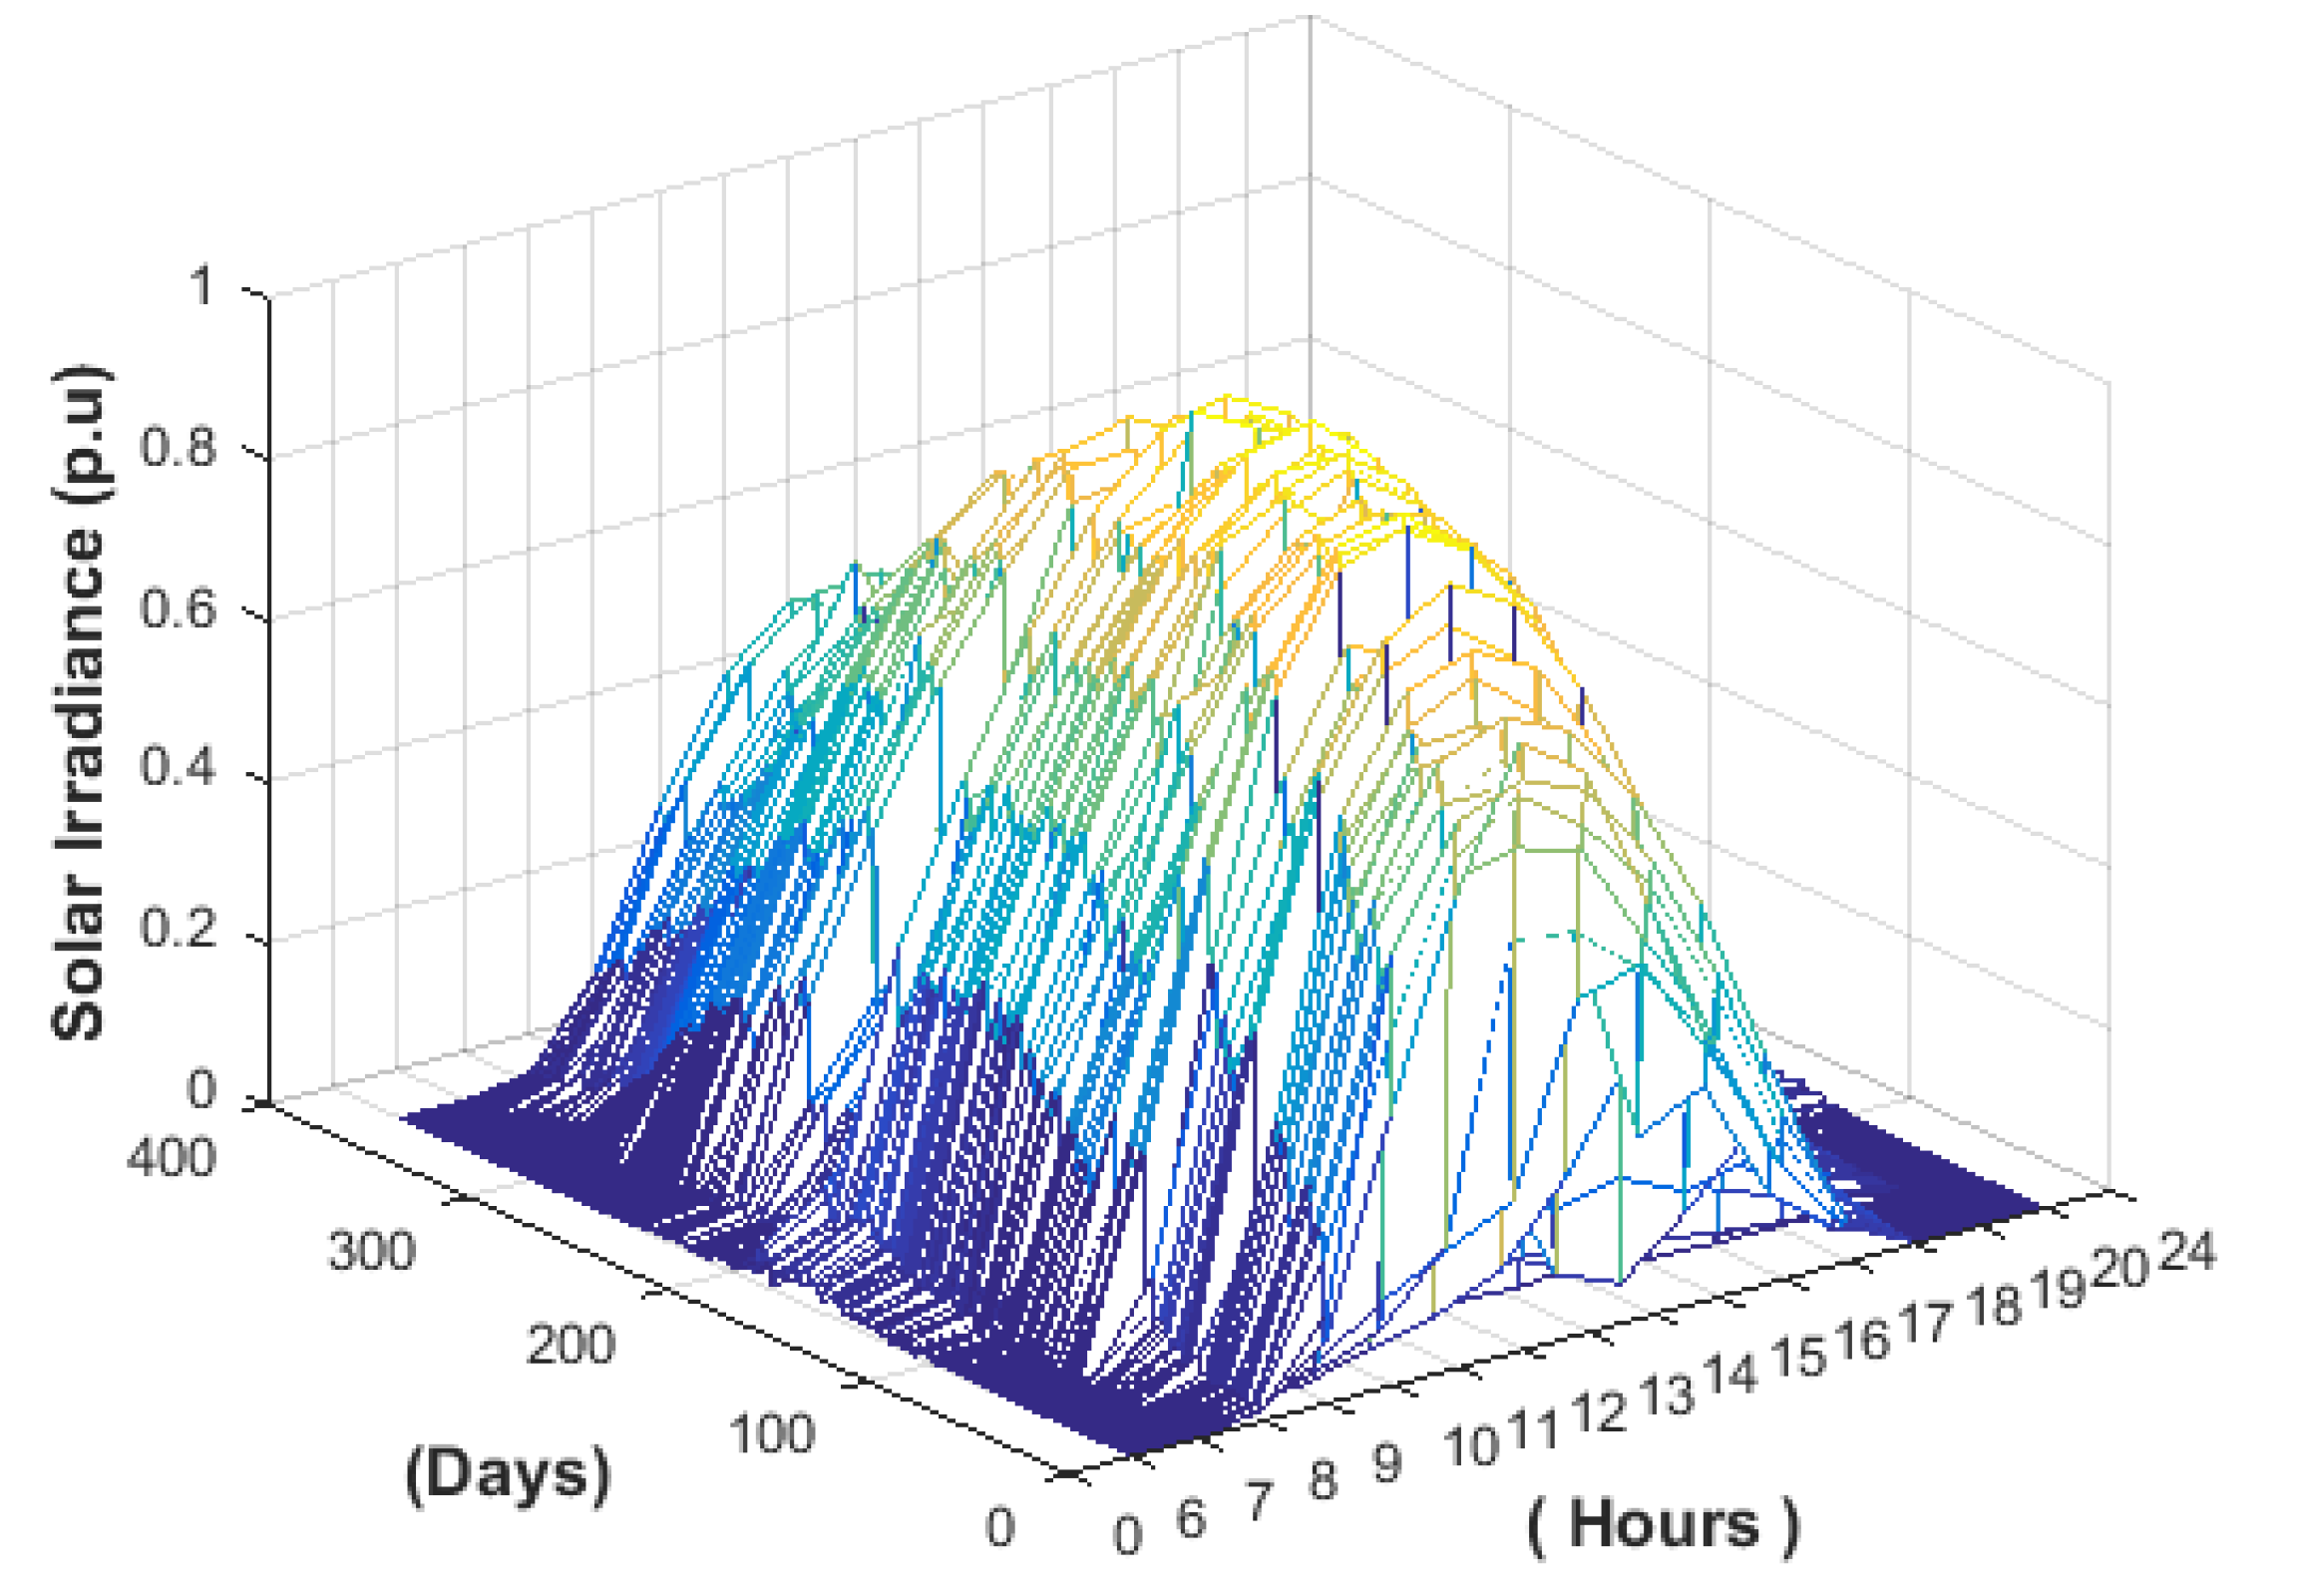
Figure 1. Solar irradiance reference patterns for one year.
Sustainability 12 02241 g001
Figure 2. Block diagram of proposed method for generation of solar irradiance patterns.
Sustainability 12 02241 g002
Figure 3. Algorithm for the extraction of probability distribution parameters.
Sustainability 12 02241 g003
Figure 4. Detailed method for the extraction of Weibull distribution parameters.
Sustainability 12 02241 g004
Figure 5. Algorithm for the generation of solar irradiance patterns.
Sustainability 12 02241 g005
Figure 6. Weibull distribution scale and shape parameters after applying generalized regression neural network technique.
Sustainability 12 02241 g006
Figure 7. Hourly M A P E m e a n for (a) Beta and (b) Weibull distribution models.
Sustainability 12 02241 g007
Figure 8. Hourly M A P E S T D for (a) Beta and (b) Weibull distribution models.
Sustainability 12 02241 g008
Figure 9. Hourly ( M A P E v a r ) a v g for (a) Beta and (b) Weibull distribution models.
Sustainability 12 02241 g009
Figure 10. Hourly ( M A P E v a r ) S T D for (a) Beta and (b) Weibull distribution models.
Sustainability 12 02241 g010
Figure 11. Autocorrelation between reference and generated irradiance patterns for (a) mean and (b) standard deviation.
Sustainability 12 02241 g011
Table 1. Parameters of irradiance scenario generation model.
Sr. noParameterValues
1No of irradiance patterns365 days
2Time Step1 hour
3No of moving windows365
4Window size10
Table 2. Comparison of   M A P E m e a n for Beta and Weibull probabilistic distribution models.
Probabilistic ModelIndex ValuePercentage Improvement (%)
MaximumMinimumAverage
Beta30.36581.363815.152723.62
Weibull26.25900.082511.5732
Table 3. Comparison of M A P E S T D   for Beta and Weibull probabilistic distribution models.
Probabilistic ModelIndex ValuePercentage Improvement (%)
MaximumMinimumAverage
Beta31.89190.20268.72168.505
Weibull27.12910.63667.9798
Table 4. Comparison of ( M A P E v a r ) a v g for Beta and Weibull probabilistic distribution models.
Probabilistic ModelMaximumMinimum AveragePercentage Improvement (%)
Beta2.41030.00121.053428.29
Weibull2.10210.00620.7554
Table 5. Comparison of ( M A P E v a r ) S T D   for Beta and Weibull probabilistic distribution models.
Probabilistic ModelIndex ValuePercentage Improvement (%)
MaximumMinimumAverage
Beta5.36860.06790.976037.48
Weibull3.66690.00190.6101