Article

Spatial and Temporal Characteristics and Driving Forces of Vegetation Changes in the Huaihe River Basin from 2003 to 2018

1
College of Environment and Planning, Henan University, Kaifeng 475004, China
2
Laboratory of Geospatial Technology for the Middle and Lower Yellow River Regions, Ministry of Education, Henan University, Kaifeng 475004, China
3
Henan Industrial Technology Academy of Spatio-Temporal Big Data, Henan University, Kaifeng 475004, China
*
Author to whom correspondence should be addressed.
Sustainability 2020, 12(6), 2198; https://doi.org/10.3390/su12062198
Submission received: 19 December 2019 / Revised: 2 March 2020 / Accepted: 9 March 2020 / Published: 12 March 2020
(This article belongs to the Section Environmental Sustainability and Applications)

Abstract

:
In this study, MODIS normalized difference vegetation index (NDVI), TRMM3B43 precipitation, and MOD11A2 land-surface temperature (LST) data were used as data sources in an analysis of temporal and spatial characteristics of vegetation changes and ecological environmental quality in the Huaihe River basin, China, from 2003 to 2018. The Mann–Kendall (MK) non-parametric test and the Theil–Sen slope test were combined for this analysis; then, when combined with the results of the MK mutation test and two introduced indexes, the kurtosis coefficient (KU) and skewness (SK) and correlations between NDVI, precipitation (TRMM), and land-surface temperature (LST) in different time scales were revealed. The results illustrate that the mean NDVI in the Huaihe River basin was 0.54. The annual NDVImax curve fluctuations for different land cover types were almost the same. The main reasons for the decrease in or disappearance of vegetation cover in the Huaihe River basin were the expansion of towns and impact of human activities. Furthermore, vegetation cover around water areas was obviously degraded and wetland protections need to be strengthened urgently. On the same time scale, change trends of NDVI, TRMM, and LST after abrupt changes became consistent within a short time period. Vegetation growth was favored when the KU and SK of TRMM had a close to normal distribution within one year. Monthly TRMM and LST can better reflect NDVI fluctuations compared with seasonal and annual scales. When the precipitation (TRMM) is less than 767 mm, the average annual NDVI of different land cover types is not ideal. Compared with other land cover types, dry land has stronger adaptability to changes in the LST when the LST is between 19 and 22.6 °C. These trends can serve as scientific reference for protecting and managing the ecological environment in the Huaihe River basin.

1. Introduction

Vegetation has obvious characteristics of interannual and seasonal variations and is the natural link connecting the atmosphere, water, and soil. It plays very important roles in maintaining soil, regulating the atmosphere, and maintaining ecosystem stability [1,2]. The normalized difference vegetation index (NDVI) has a strong correlation with vegetation biomass and is an important indicator of regional vegetation growth and coverage [3]. Therefore, spatiotemporal variation characteristics of the NDVI in the study area can be used to monitor and evaluate vegetation growth and the regional ecological environment [4,5]. It is worth noting that the influences of precipitation and temperature on vegetation growth is particularly prominent, which has been verified by many scholars in China and abroad [6,7,8]. At present, the commonly used NDVI products for studying vegetation change are mainly SPOT-VGT NDVI, GIMMS NDVI3g, and MODIS NDVI data sources. Compared with the other two products, MODIS NDVI products have higher temporal and spatial resolution, wide-coverage, and easy access, and are important data sources for scholars to study vegetation cover changes over long time series’ and monitor vegetation growth [9,10]. In addition, the grid data of precipitation and temperature, which are often the driving factors of vegetation change, mostly come from interpolation results based on meteorological station data. Since the results of spatial interpolation methods in different regions are uncertain [11,12], the rigor of the results should be considered. In addition, different vegetation types are important factors that affect the spatial distribution of the NDVI [13,14].
In recent years, due to the influence of climate change, studies on vegetation changes and driving forces in ecologically sensitive areas have gained much attention. For example, Chen et al. conducted a study in the Yellow River basin and showed quite different net primary productivity (NPP) changes in different vegetation types, and that the influences of precipitation and temperature on NPP changes of vegetation are highly correlated on the monthly scale [13]. Qu et al. showed that the influence of temperature on vegetation changes in the Yangtze River basin between 1982 and 2015 was greater than that of precipitation [15]. Zhou et al. conducted a study on the Shule River basin and showed that precipitation change is the main factor driving climate, leading to the aggravation or alleviation of vegetation degradation in the Shule River basin, and that the mechanism of the effect of temperature is relatively complex [16]. Therefore, among the many natural factors that affect the change in vegetation cover, temperature and precipitation are the most critical.
The Huaihe River basin is located in the transition zone between northern and southern China. Precipitation fluctuates greatly and is easily affected by extreme weather such as droughts and floods [17,18,19]. Under the influences of climate change and human activities, the ecological environment of the Huaihe River basin is also changing [20]. Therefore, it is urgent to monitor and evaluate the ecological environment change in the basin. At present, with the continuous maturity of remote sensing technology, various sensors provide rich data sources for long-term regional vegetation change monitoring and driver analysis. In this study, a MODIS NDVI product (MOD13Q1 and MYD13Q1) with spatial resolution of 250 m and temporal resolution of 8 d was adopted. Previous studies on the spatiotemporal characteristics and driving factors of regional vegetation cover considered a single MODIS NDVI product; in contrast, the combination of MOD13Q1 and MYD13Q1 is more advantageous for the accurate determination of the NDVI pixel values for the corresponding position. We selected TRMM_3B43 precipitation data and remote sensing MOD11A2 land-surface temperature data as the main driving factors of vegetation changes, instead of the commonly used meteorological site spatial interpolation of precipitation and temperature data, so that the applicability of instability problems in regional spatial interpolation methods could be avoided [21,22]. Further, we combined the Mann–Kendall (MK) trend test and the Theil–Sen slope, which can enhance the reliability of the results of analyzing spatial and temporal characteristics and differences in the quality of the ecological environment of the NDVI in the Huaihe River basin from 2003 to 2018 [3]. The MK mutation test was used to reveal differences and relationships among NDVI, precipitation, and land-surface temperature in different time scales. Two indexes, kurtosis coefficient and skewness, were introduced to analyze the monthly matching relationship of NDVI, precipitation, and land-surface temperature, as well as the fluctuation characteristics of the interannual curve, so as to provide a scientific reference for the protection and management of the ecological environment in the Huaihe River basin.

2. Materials and Methods
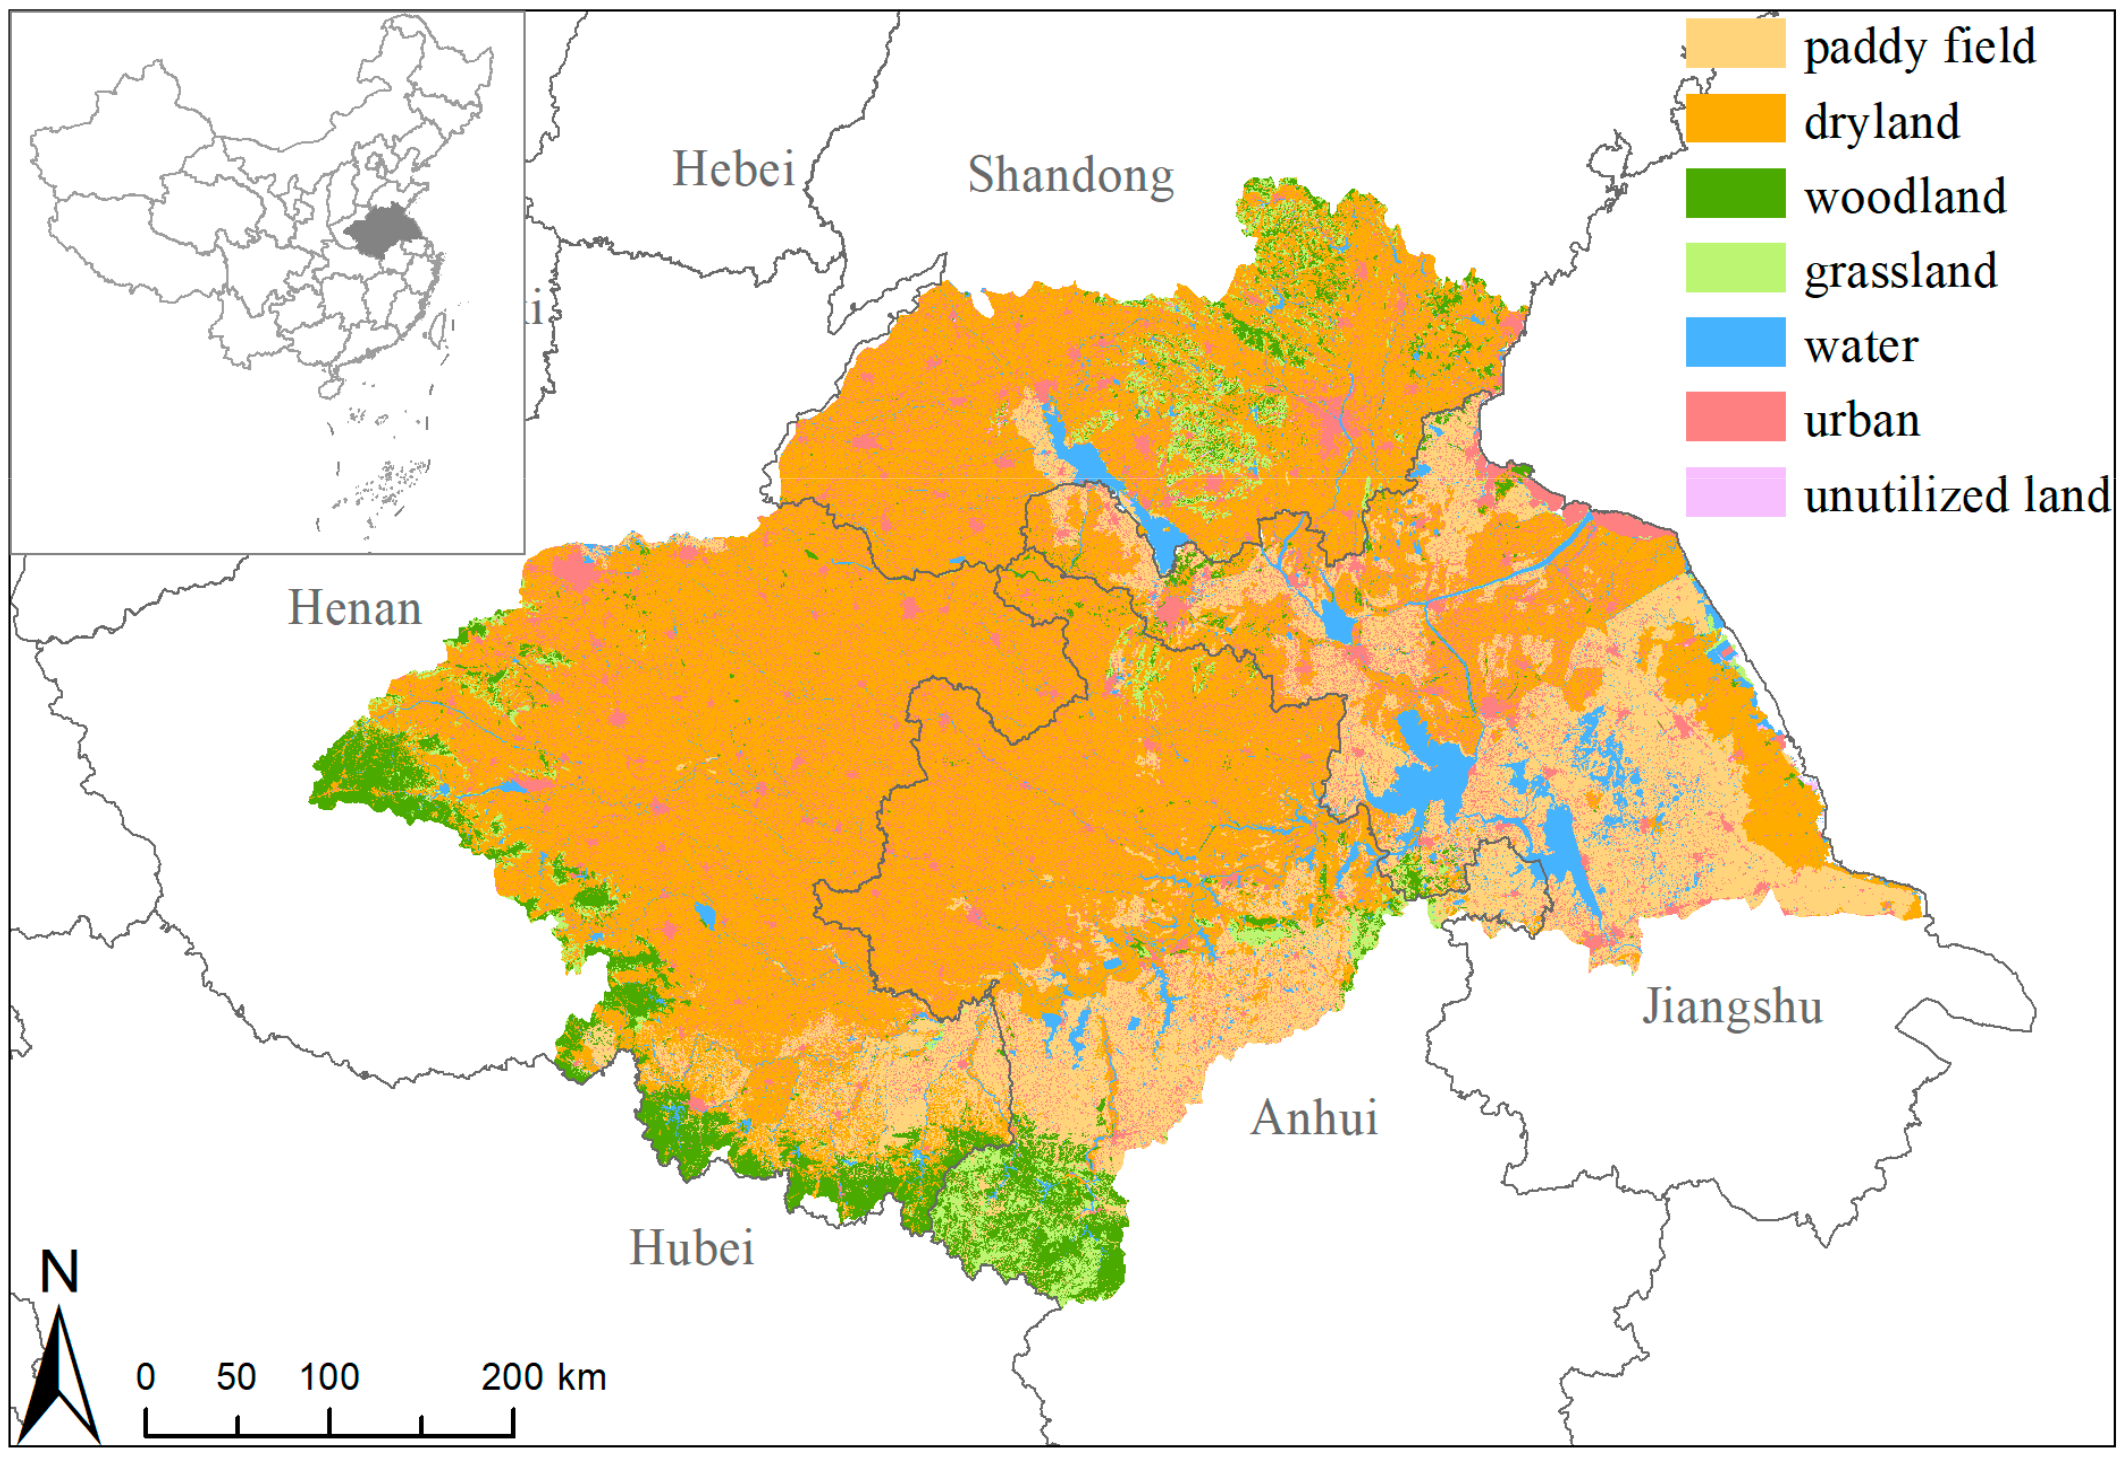
2.1. Study Area

The Huaihe River basin is one of seven major river basins in China, which includes Jiangsu, Shandong, Henan, Anhui, and Hubei Provinces. It is located at 111°55′ E–121°25′ E and 30°55′ N–36°36′ N. The basin area is approximately 270,000 km2, with cultivated land accounting for 49.37% of the area. The main crops are wheat, rice, corn, potato, soybean, cotton, and rape. In 1997, grain output of the Huaihe River basin accounted for 17.3% of China’s total grain output [23]. The landscape of the Huaihe River basin is dominated by plains, and the hilly area accounts for only one-third of the total area. The western part of the basin contains Funiu mountain and Tongbai mountain, the southern part contains Dabie mountain, and the northeastern part contains Yimeng mountain. According to 2010 land cover data released by the Data Center of Lower Yellow River Regions, the proportions of paddy field, dryland, woodland, grassland, water, urban, and unutilized land in the Huaihe River basin were 17.42%, 52.48%, 6.64%, 3.1%, 5.08%, 15.2%, and 0.08%, respectively. The spatial distribution of various land cover types in 2010 is shown in Figure 1.

2.2. Data and Processing

2.2.1. NDVI Data

The NDVI data were MOD13Q1 and MYD13Q1 products obtained from NASA’s Level 1 Atmosphere Archive and Distribution System Distributed Active Archive Center, LAADS DAAC. The combination of the two products (MOD13Q1 and MYD13Q1) can improve the time resolution of NDVI products from 16 to 8 d. The spatial resolution is 250 m and the time span is 20030101~20181231, with a total of 1472 scenes. After preprocessing (e.g., format conversion, mosaic, projection, and shear), NDVI time series images of the study area were obtained, with a total of 736 scenes; The Albert Conical Equal Area was used for projection. Finally, Maximum Value Composite Syntheses (MVC) was used to obtain the monthly NDVI, which can further eliminate the influences of extreme values and the atmosphere. The annual NDVI was obtained by calculating the mean value of the monthly NDVI [14,24].

2.2.2. LST and TRMM Data

Land-surface temperature (LST) and precipitation data (TRMM) were obtained from LAADS DAAC. The LST data were collected from a MOD11A2 data set with a time resolution of 8 d and a spatial resolution of 1 km. Compared with the interpolation results of the station precipitation data, TRMM data have a higher accuracy [25]. Therefore, the precipitation product used in this study was the TRMM_3B43 data set with a time resolution of one month. The TRMM_3B43 data set was the precipitation product retrieved jointly by the TRMM satellite, other satellites, and ground observation, the spatial resolution is 0.25° × 0.25°, and the unit is mm. In this study, LST data were adopted to replace the commonly used air temperature data, because they can most directly reflect the change in vegetation coverage, which is one of the factors worth considering in the study of vegetation change [26,27,28], and can overcome the influence of the error caused by the spatial interpolation of meteorological station data. For this study, TRMM_3B43 precipitation is referred to as TRMM.

2.3. Methods

2.3.1. Mann-Kendall Non-Parametric Significance Test and Theil-Sen Slope Test

In this study, the MK method [29] was used to test the significant level, change direction, and trend inclination of NDVI, precipitation (TRMM), and LST in the Huaihe River basin on different time scales. This method is not affected by the pattern of sample distribution or disturbed by a few outliers; it is an effective way to test the trend of a time series [30,31,32]. The time series is set as {xi}, i=1,2,3,…,n, and the calculation formulas are as follows; the Z test statistic is defined as:
Z = S 1 var ( S ) , S > 0 0 , S = 0 S + 1 var ( S ) , S < 0
S = i = 1 n 1 j = i + 1 n sgn ( x j x i )
sgn ( x j x i ) = 1 ,       x j x i > 0 0 ,       x j x i = 0 1 , x j x i < 0
The variance expression of statistic S is:
var ( S ) = n ( n 1 ) ( 2 n + 5 ) i = 1 n t i ( i 1 ) ( 2 i + 5 ) 18
The Theil–Sen slope test method [29] can be used to calculate the slope of monotonic trend, and its expression is:
β = Median ( x j x i j i )
where xi and xj are the corresponding values of the ith and jth years of time series, 1< i < j< n, sgn is a sign function, ti is the number of data points in group i, and Median represents the median of the sequence. The parameter β represents the slope of the trend of the sequence; that is, the mean rate of change of the time series, with a positive β indicating an upward trend and a negative β indicating a downward trend. The statistic Z is between minus infinity and plus infinity. In this study, the method used for the MK trend test was as follows: null hypothesis H0: β = 0, at a given significance level of 0.05, when |Z| > 1.96, the trend of the time series was significant, a positive value meant that the sequence had an upward trend, and a negative value indicated a downward trend. When |Z| > 2.58, the significance test of 0.01 was passed.

2.3.2. Mann–Kendall Mutation Test

The MK mutation test can accurately test the mutation point of a time series, which is a common method to study the mutation phenomenon of sequence data such as climate (e.g., precipitation, and temperature) [33,34,35], runoff [36], and water quality [37,38]. The principle of this method is as follows:
For the time series {xi} with n samples, (1 ≤ in), an order column is constructed.
s k = i = 1 k r i k = 2 , 3 , n
r i = 1 x i > x j 0 x i x j j = 1 , 2 , , i
The order column, sk, is the sum of the number of values when the value at moment i is greater than the value at moment j. Under the assumption that the time series is random, the statistics are defined as follows:
U F k = s k E ( s k ) V a r ( s k ) k = 1 , 2 , , n
In formula (8), UF1 = 0, E(sk) and Var(sk) are the mean and variance of sk, respectively. When x1, x2, …, xn are independent of each other, and they have the same continuous distribution, these values can be calculated from the following formula:
E ( s k ) = n ( n + 1 ) 4
V a r ( s k ) = n ( n 1 ) ( 2 n + 5 ) 72 2 k n
where UFk (which represents the UF curve) is the standard normal distribution, which is in time-series order (x1, x2..., xn) calculated statistical sequence, given the significance level of 0.05, if UFi > U0.05, it indicates that there is a significant trend change in the sequence. UBk (which represents the UB curve) repeats the above process in the reverse order of the time series {xi}, making UBk = −UFk (k = n, n-1, …, 1) and UB1 = 0.
In this study the method of the MK mutation test was as follows: the significance level was taken as 0.05, and the critical value of U0.05 = ± 1.96. y = UFk, y = UBk, y = ± 1.96 were plotted on a graph. If the values of UFk and UBk were positive, the sequence showed an upward trend, and if the values were negative the sequence showed a downward trend. When these values exceeded the critical line, it indicated a significant upward or downward trend, and the range beyond the critical line was determined as the time region for abrupt change. If the UFk and UBk curves intersected at the critical boundary, the time corresponding to the intersection was the time when the mutation began.

2.3.3. Min-Max Normalization

Min-max normalization is one of the most commonly used normalization methods [39,40]; it can eliminate the influence of different indicator units, and its formula is as follows:
x i = x i min ( x i ) max ( x i ) m i n ( x i ) i = 1 , n ,
where xi represents the data to be normalized and the range of the normalized data is between 0 and 1. The data normalized in this study were NDVI, TRMM data, and LST data on the corresponding time scale.

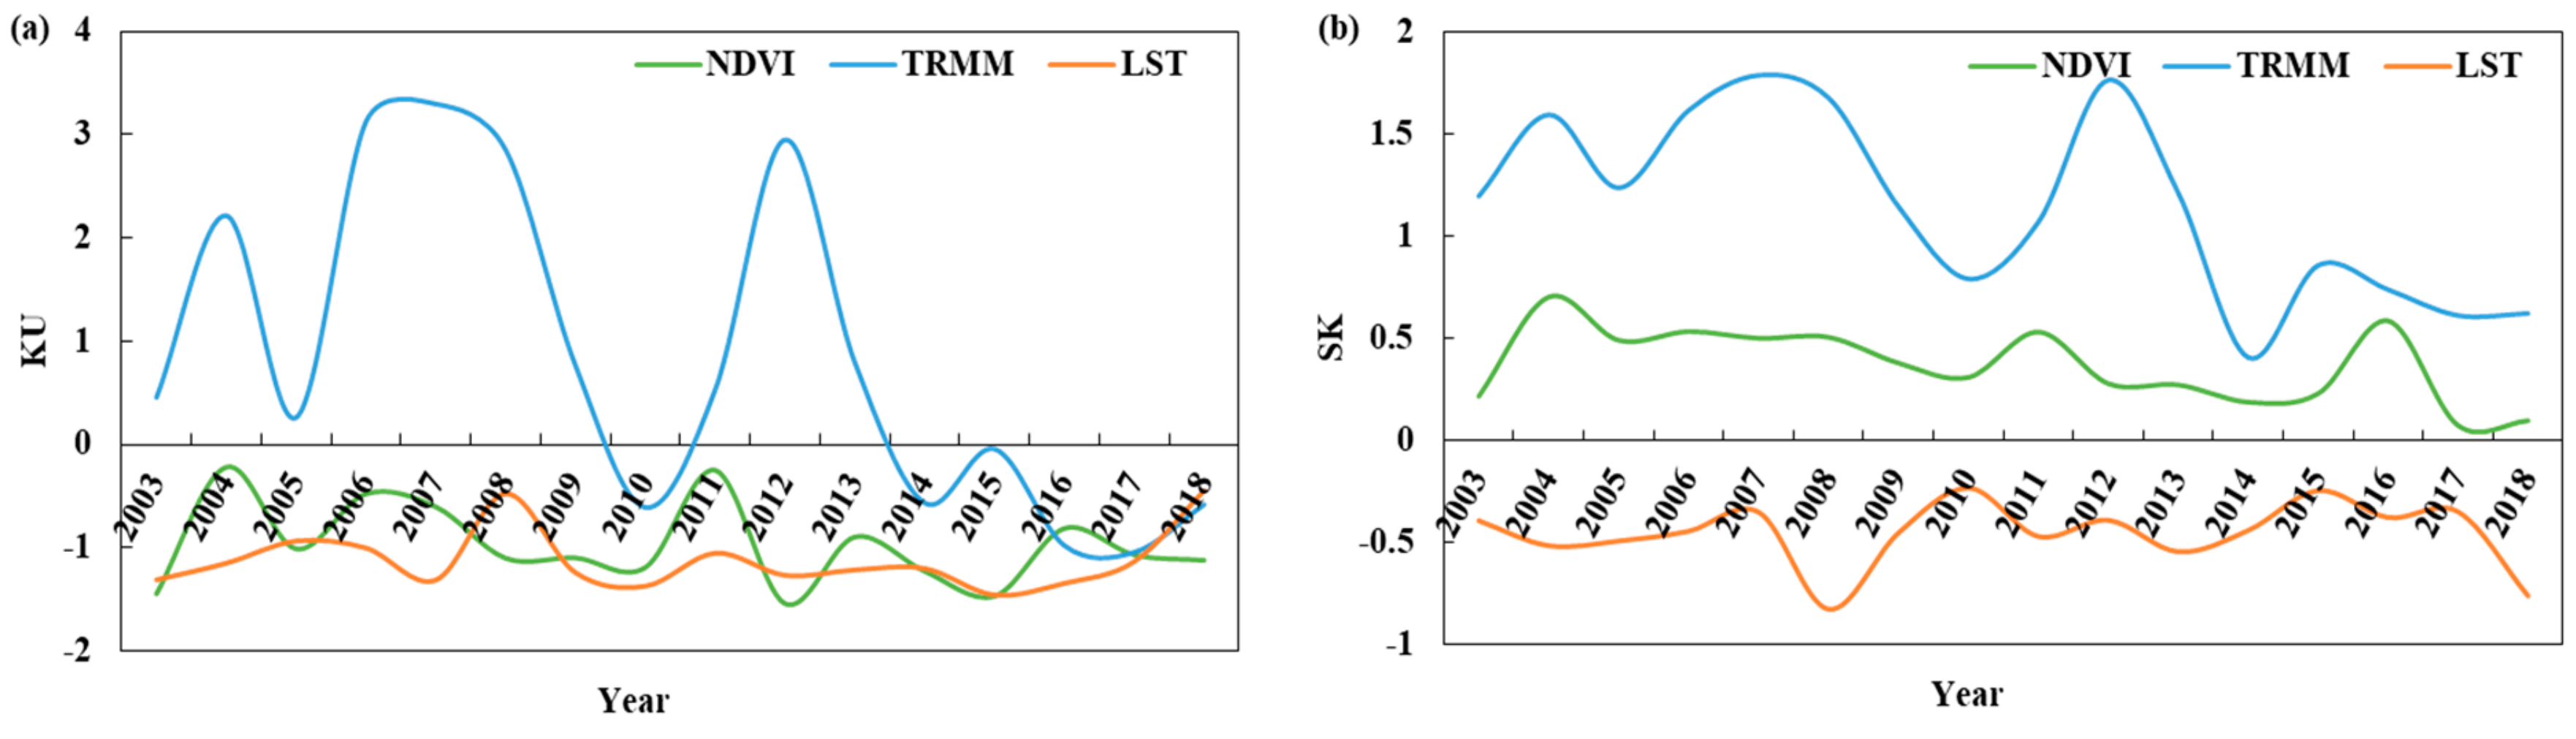
2.3.4. Kurtosis Coefficient and Skewness

To better describe the distribution characteristics of NDVI, precipitation and LST data in a year, two indexes, kurtosis coefficient (KU) and skewness (SK), were introduced in this study [41,42]. The KU represents the concentration degree of the data distribution relative to the normal distribution. When KU > 0, the data distribution is relatively concentrated, and when KU < 0, the data distribution is relatively flat. The greater the absolute value of KU, the greater the difference between the concentration degree of its distribution morphology and the normal distribution; otherwise, the smaller the difference. The SK represents the degree of asymmetry of data distribution centered on the mean value and can reflect the skewed direction of the data distribution. If SK > 0, the data distribution is positively skewed (right-skewed), and if SK < 0, the data distribution is negatively skewed (left-skewed). The greater the absolute value of SK, the greater the deviation degree between the data and the normal distribution, and otherwise, the smaller the difference.

3. Results and Discussion

3.1. Analysis of Spatial and Temporal Characteristics of NDVI in the Huaihe River Basin

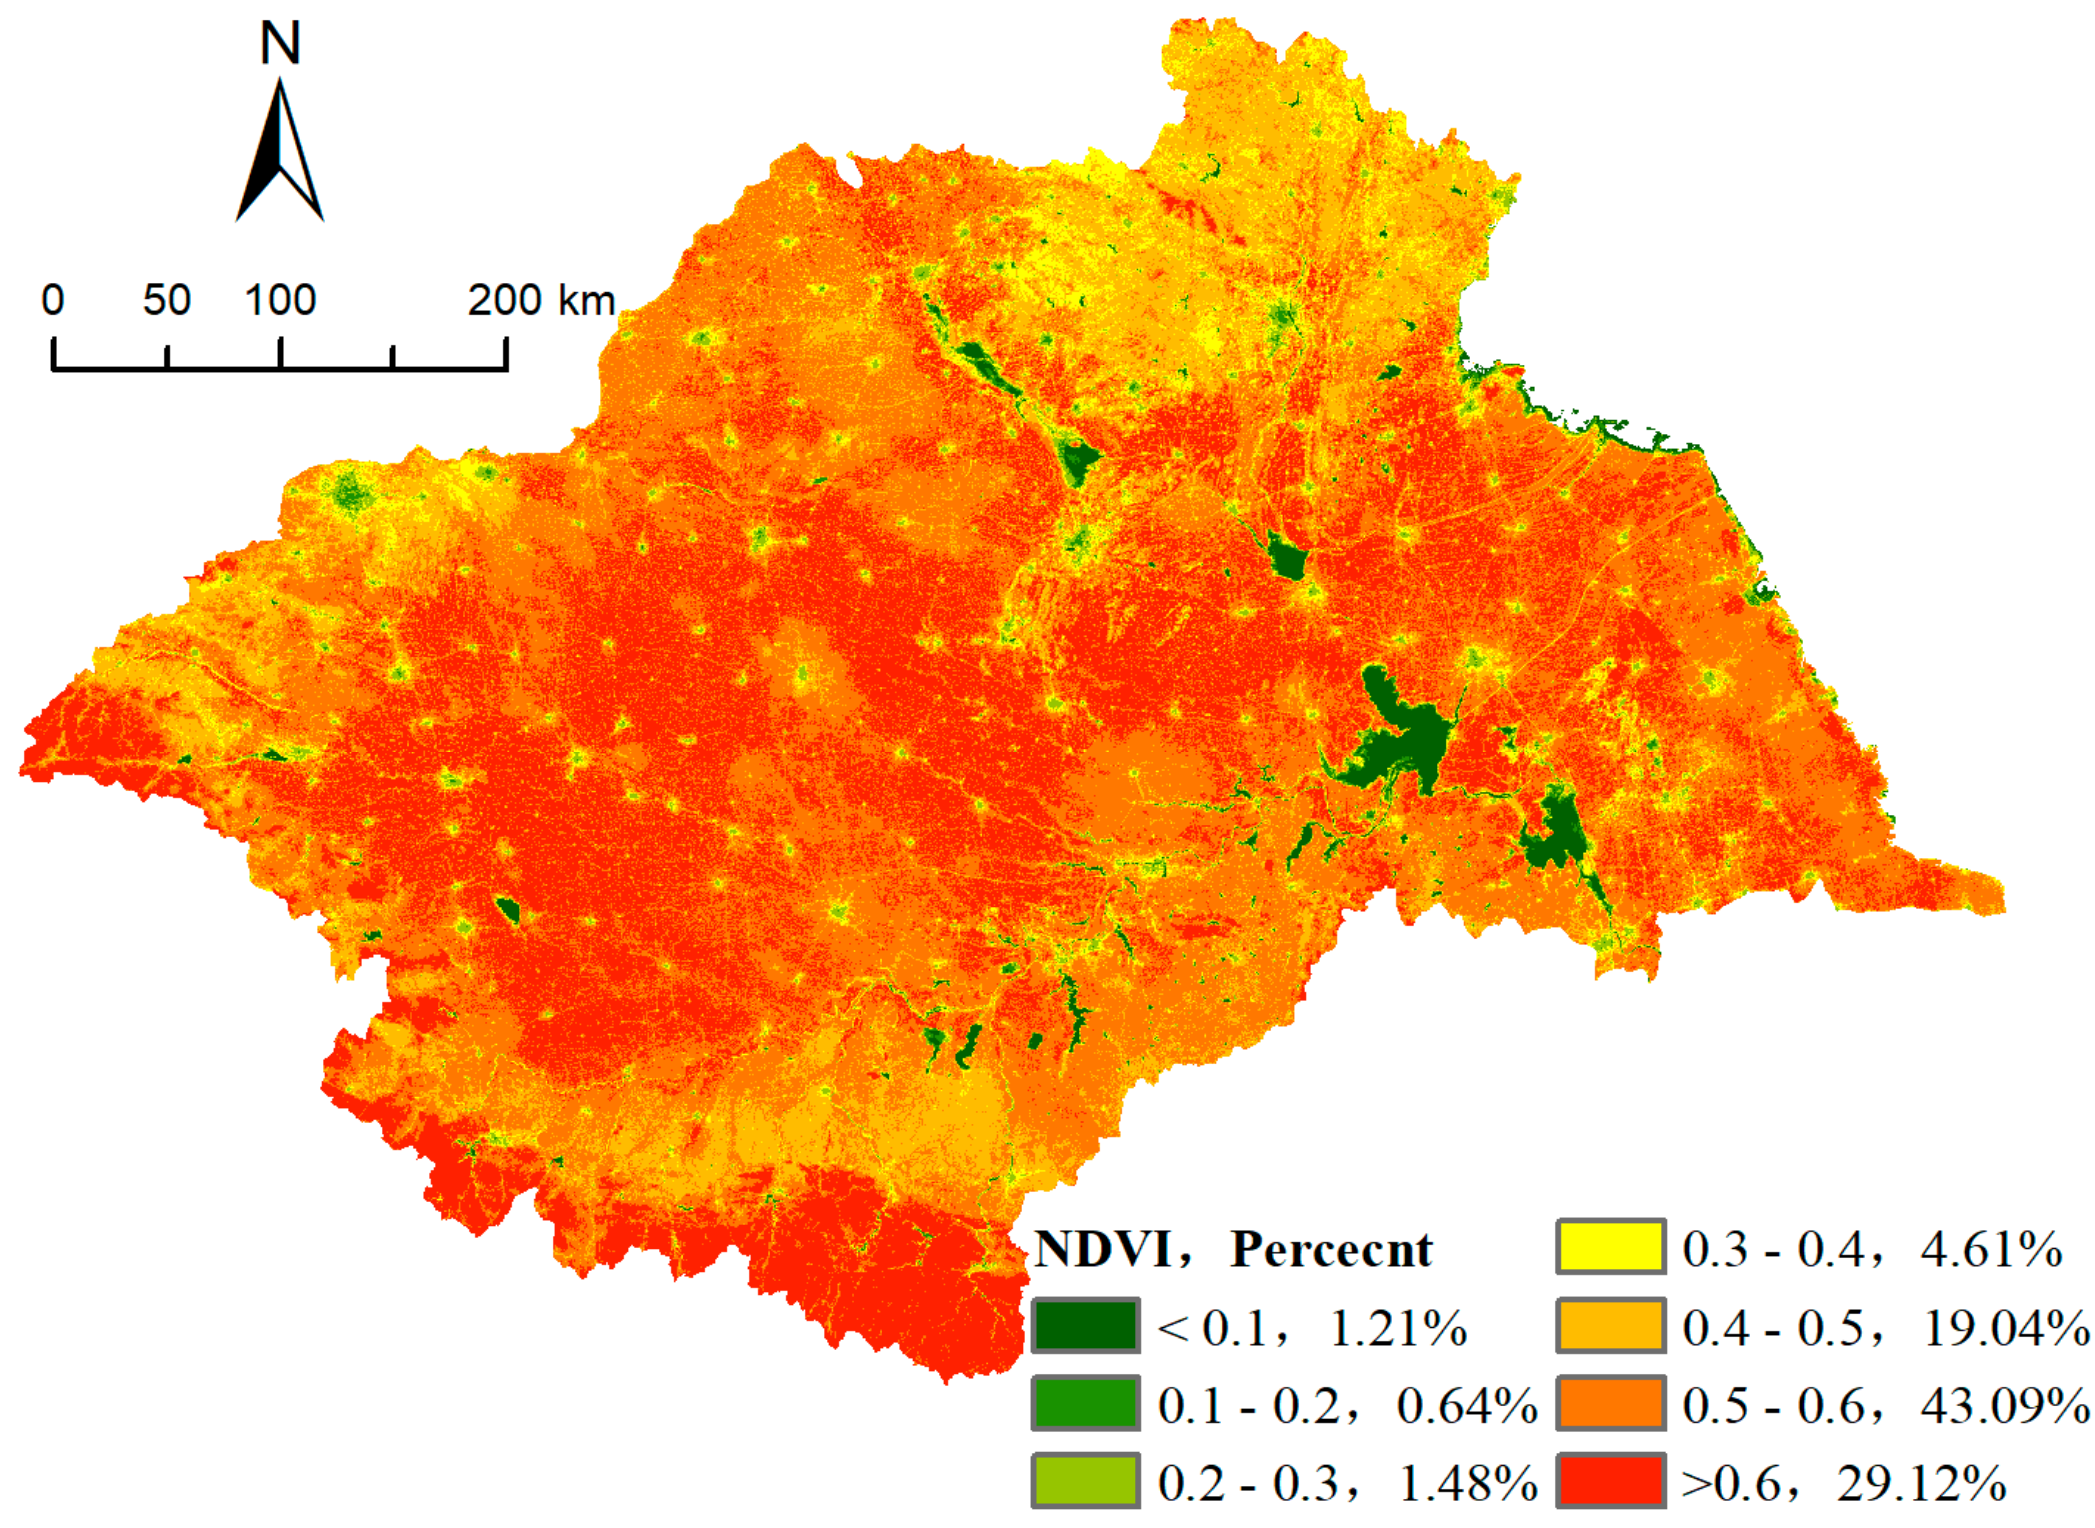
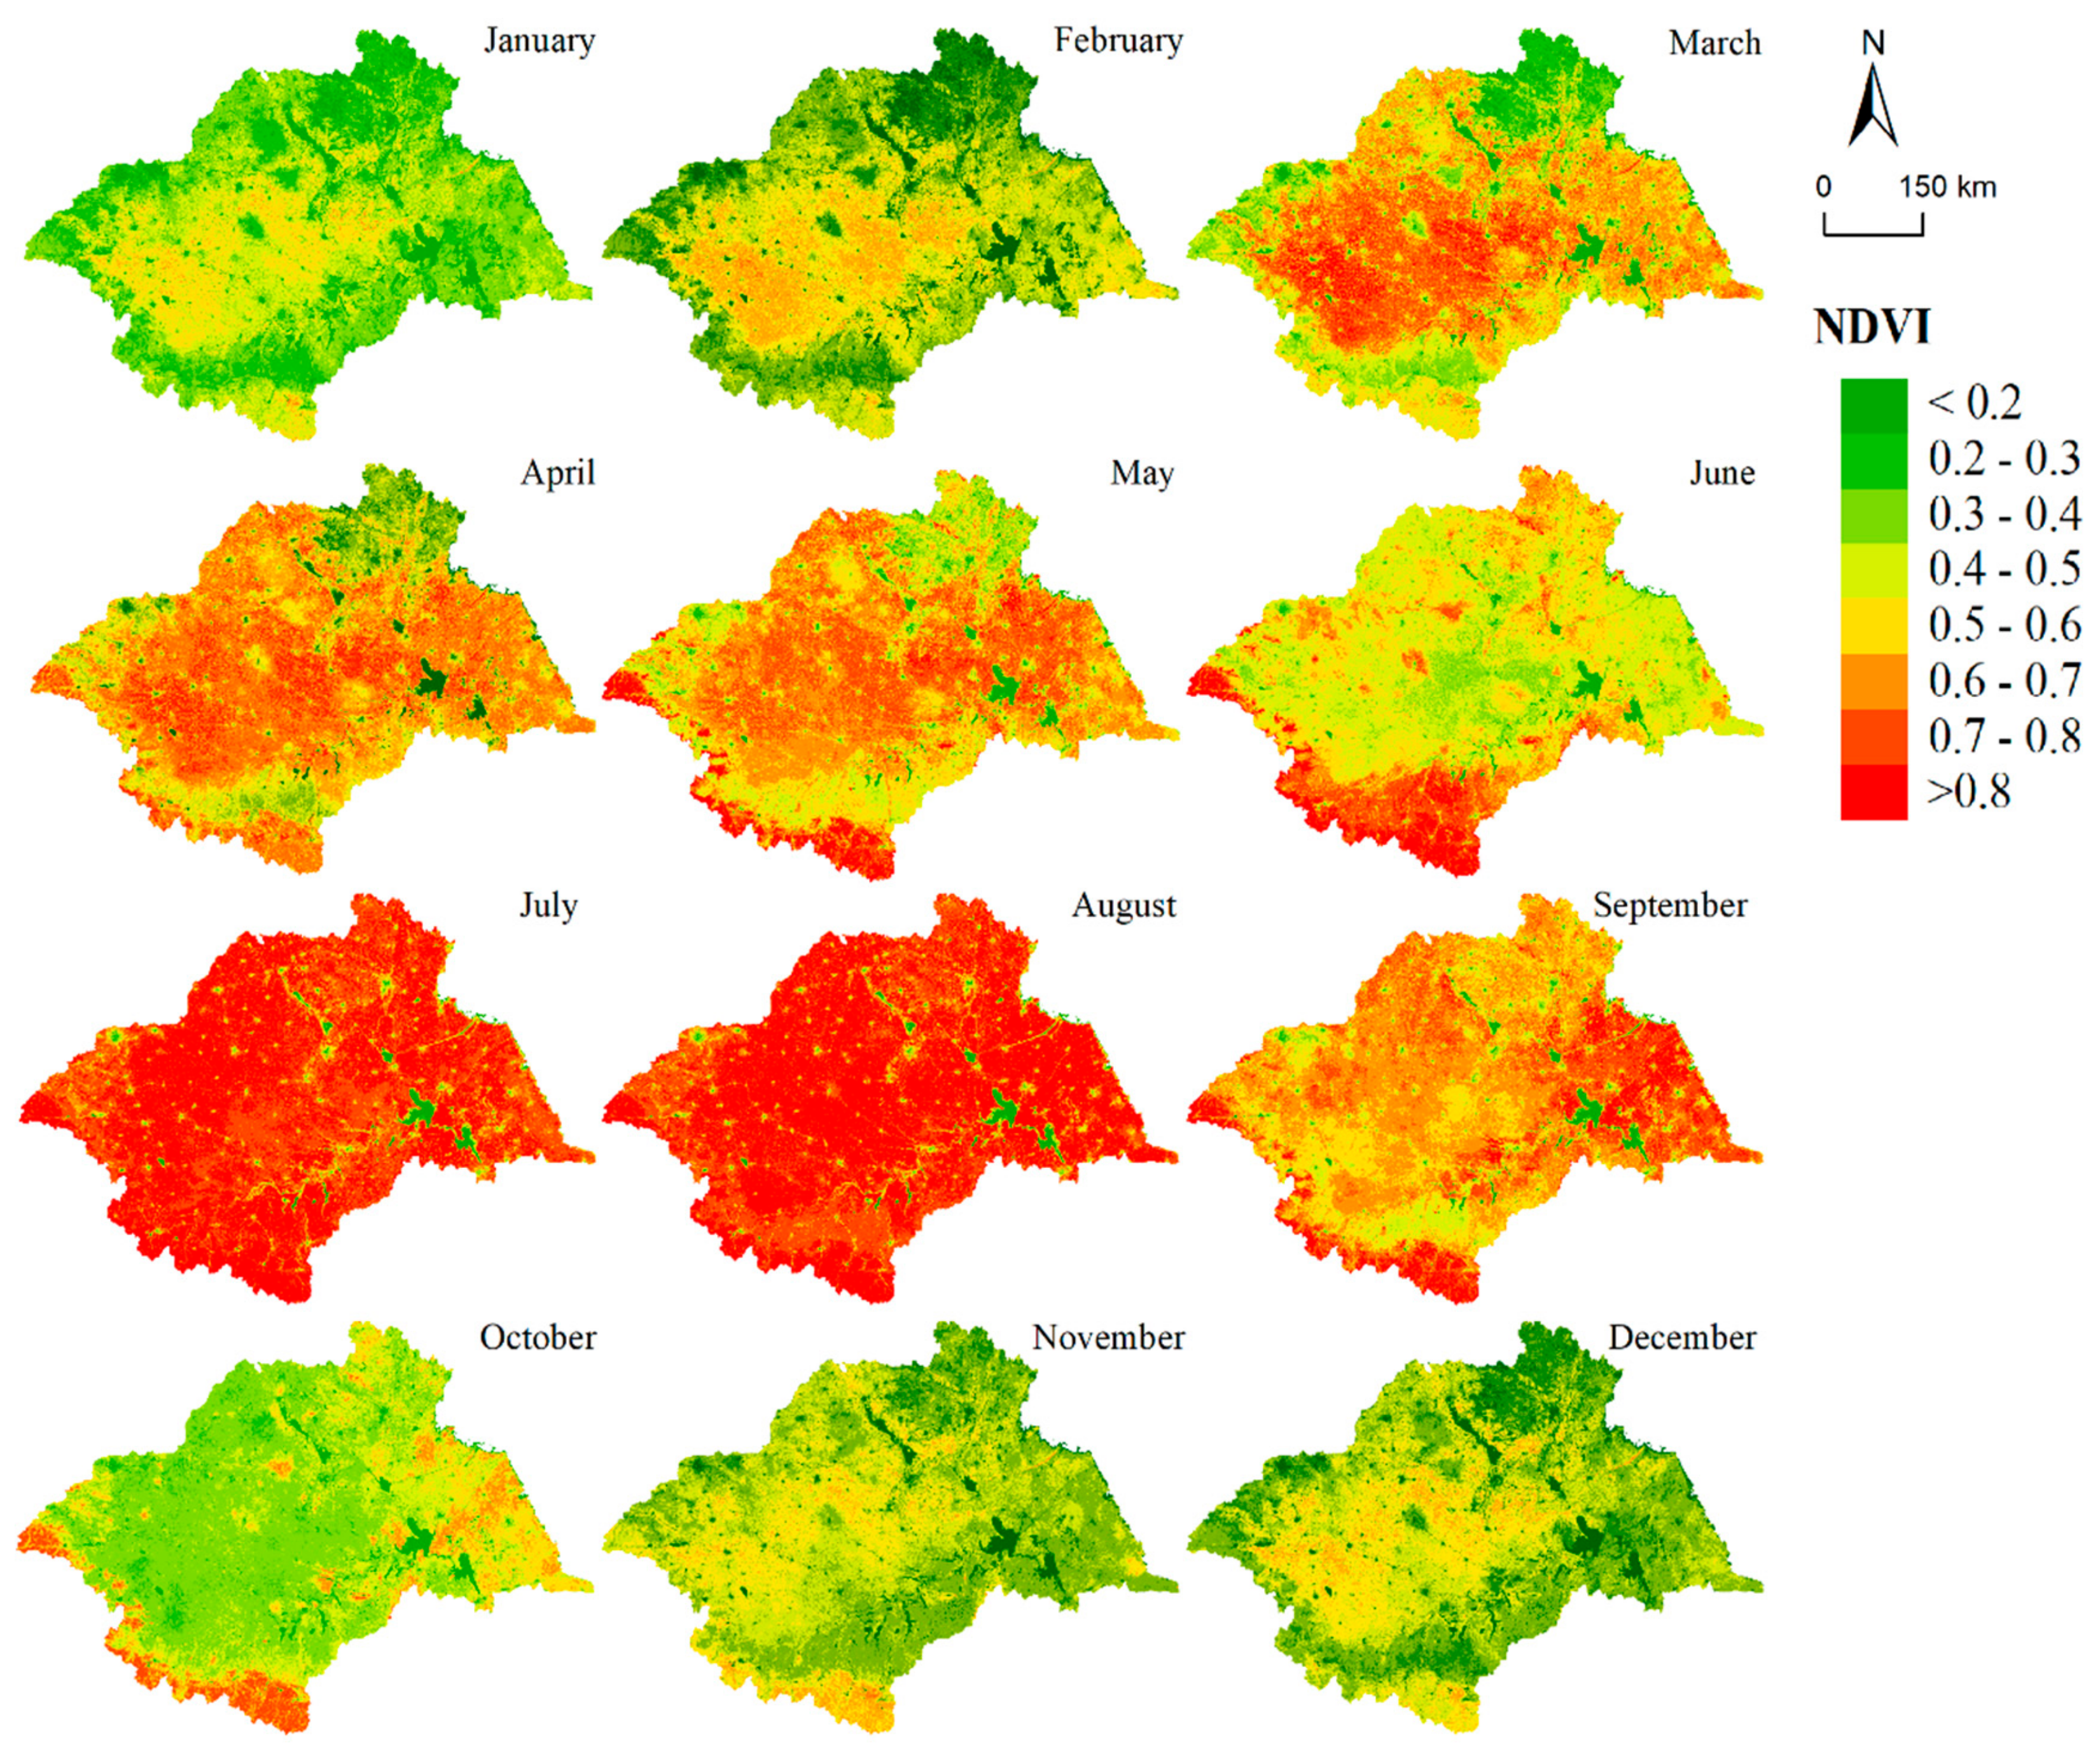
3.1.1. Spatial Distribution Characteristics of the Annual Mean NDVI Value

As shown in Figure 2, the mean of the NDVI pixel in the Huaihe River basin from 2003 to 2018 was 0.54. The lower 5% quantile [43] was 0.36, and the lower 95% quantile was 0.78. The mean NDVI of different land cover types was sorted from large to small as woodland (0.6) > dryland (0.56) > paddy field (0.55) > grassland (0.52) > urban (0.48) > unutilized land (0.43) > water (0.31). The areas with high vegetation cover were mainly concentrated in the southwest and northwest mountainous areas and in some central plain areas. The NDVI value was > 0.6, accounting for 29.12% of the area of the Huaihe River basin. The transition zone NDVI values from the southwestern, northwestern, and northeastern mountains to the plains ranged between 0.4 and 0.5. Areas with NDVI values < 0.3 were mainly concentrated in urban land and water areas, which accounted for 3.33% of the total basin area, among which the NDVI values of water areas were < 0.1, accounting for only 1.21% of the total basin area.

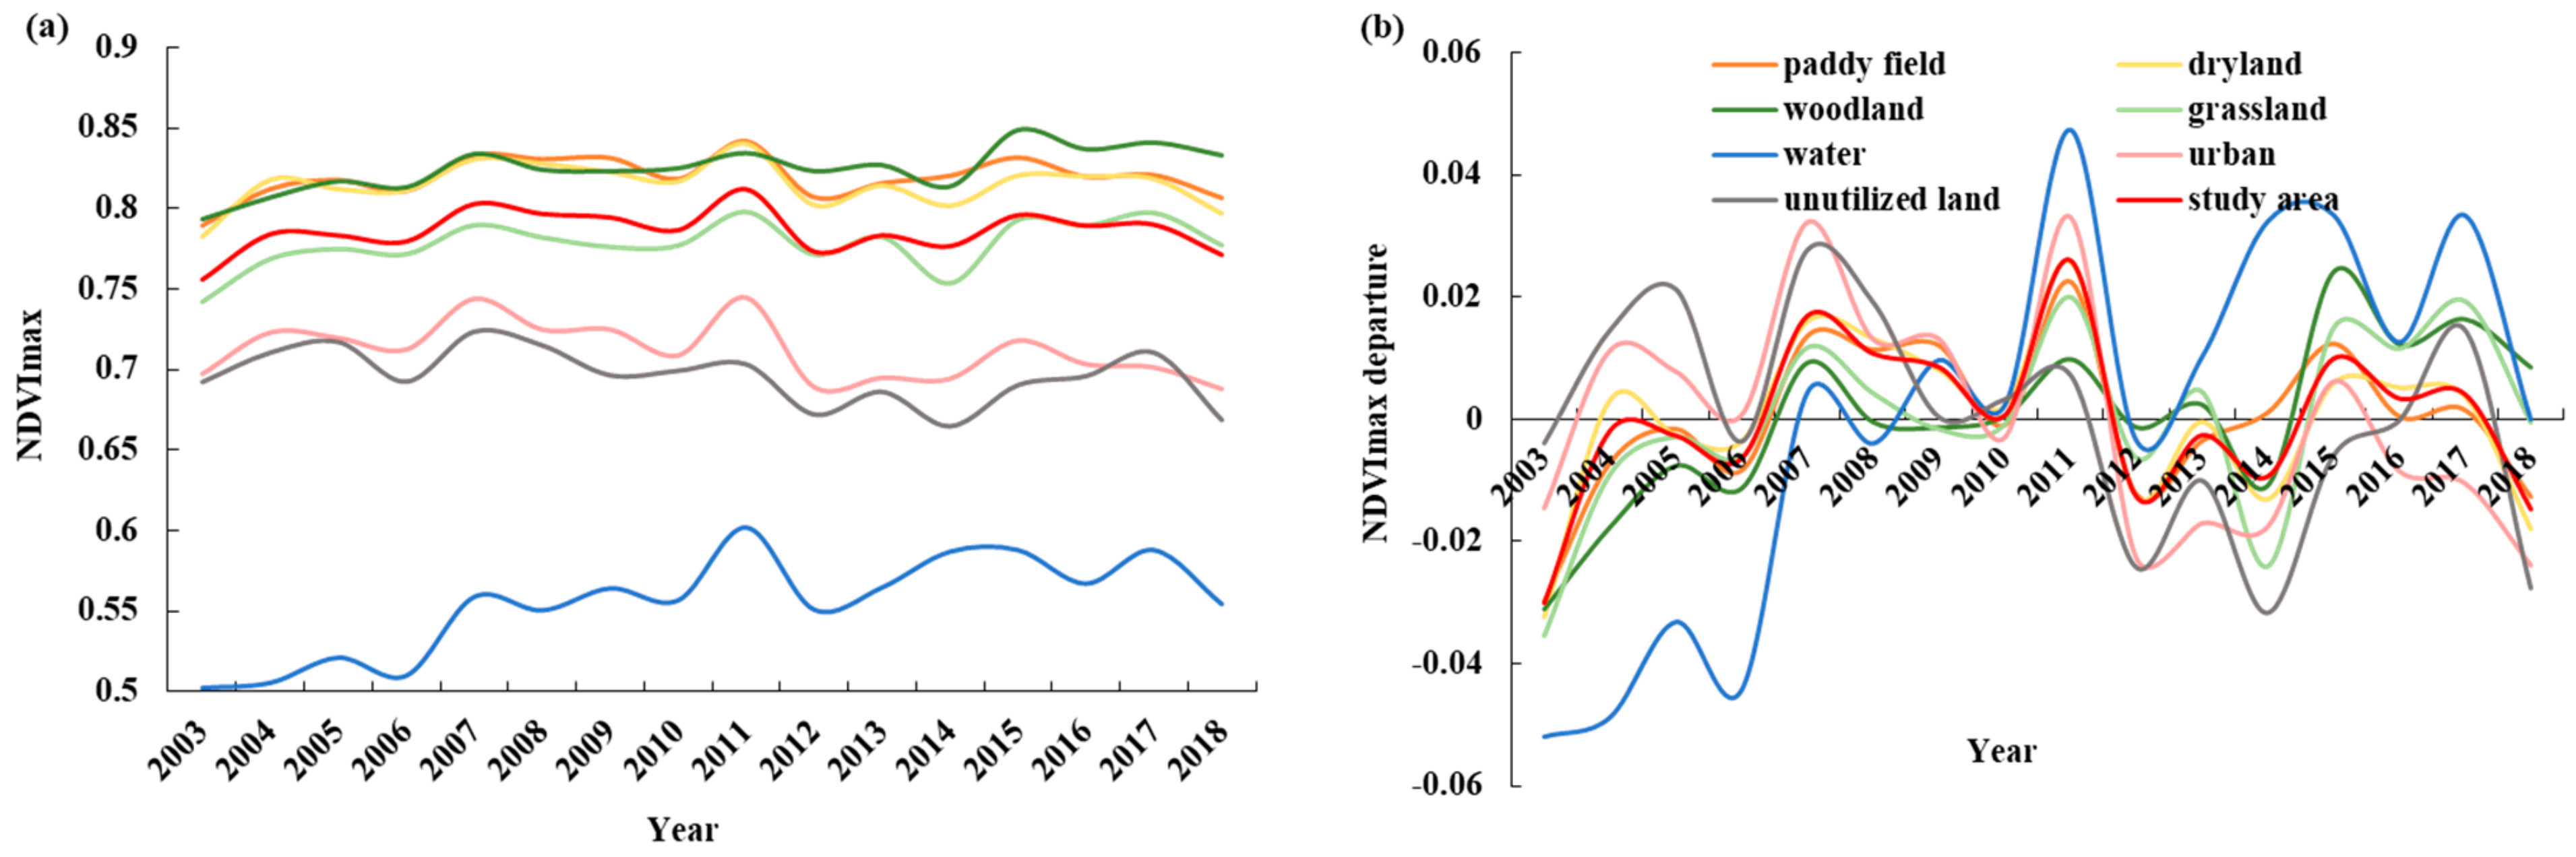
3.1.2. Annual NDVImax Time Changes for Different Land Cover Types

NDVImax refers to the maximum value of NDVI in the pixel, which can better reflect climate change and vegetation growth [44]. As shown in Figure 3a, changes in the annual NDVImax curves for different land cover types in the Huaihe River basin from 2003 to 2018 are similar, and the NDVImax curves of water, urban, and unutilized land fluctuated significantly. In 2007 and 2011, different land cover types showed obvious wave peaks, indicating that the vegetation grew well, and the growth environment was suitable. There were significant troughs in 2006 and 2014, the most likely reason for which was that the environmental conditions for the vegetation were slightly worse than those in the adjacent years. The NDVImax of paddy field, dryland, and woodland ranged between 0.78 and 0.85, and the annual NDVImax was higher than the average level of the whole study area. Conversely, grassland, towns, unutilized land, and water had a lower annual NDVImax than the average level of the whole study area.
As seen in Figure 3b and Table 1, the NDVImax of the study area showed a negative anomaly in 2003–2006 and 2012–2014 as compared with the mean NDVImax in 2003-2018, while a positive anomaly was observed in 2007–2011 and 2015–2017. The NDVImax anomaly of water showed the largest variation, which may be caused by the change in the wetland area. The minimum anomaly (−0.0520) appeared in 2003, and the maximum anomaly (0.0474) appeared in 2011. Except for woodland and unutilized land, the maximum NDVImax anomaly of all other land types occurred in 2011, which is consistent with the result in Figure 3a. Except for urban and unutilized land, the minimum NDVImax anomaly occurred in 2003.
Generally, the vegetation of different land cover types in Huaihe River basin has grown well in the past 16 years, and the inter-annual fluctuation of different vegetation types in NDVImax may be caused by urban expansion, policy orientation, human activities, and environmental changes.

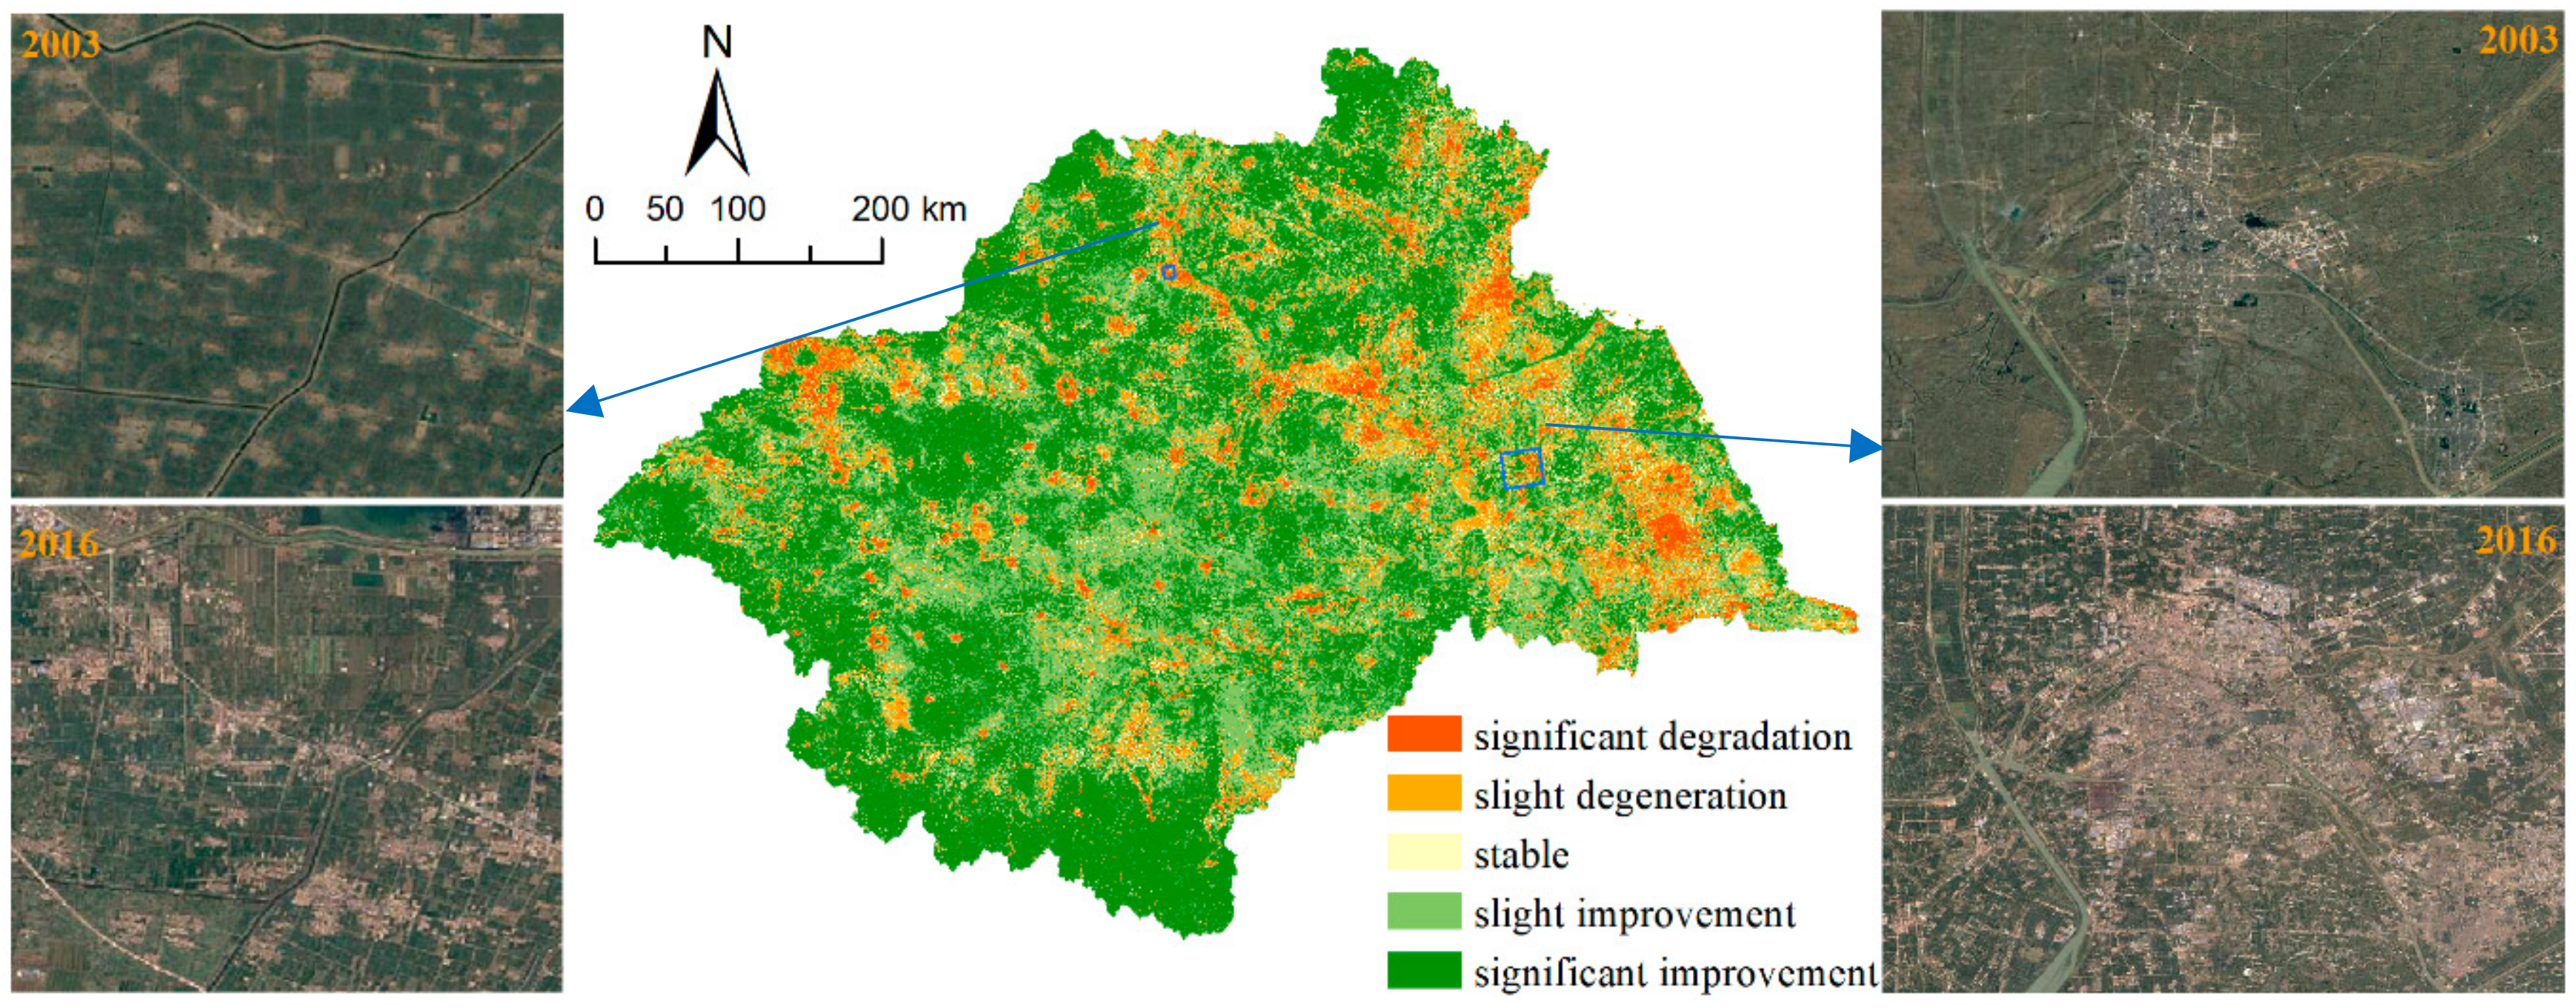
3.1.3. Vegetation Change Trend

In this study, Theil–Sen slope results were divided into a stable region (−0.0005 < β ≤0.0005), an improved region (β > 0.0005), and a degenerate region (β ≤0.0005). The MK trend significance test results were divided into a significant rising region (Z > 1.96), a significant descending region (Z ≤ 1.96), and an insignificant region (−1.96 < Z≤ 1.96). To more accurately reflect changes in the ecological environment in the Huaihe River basin from the perspective of space, this study combined the two methods. The superimposed spatial difference results are shown in Figure 4, and the statistical results are shown in Table 2. From 2003 to 2018, the improved area in the Huaihe River basin was much higher than the degraded area, accounting for 77.26% of the total basin area. Degraded areas accounted for 16.55% of the total basin area and were mainly concentrated near towns and water areas, while 6.18% of the total area remained stable. By comparing Google images of degraded areas in different periods, it can be seen that the main reasons for the decrease, or even disappearance, of vegetation cover were the expansion of towns and the influence of human activities. In addition, vegetation cover near water areas is obviously degraded, and the protection of wetlands needs to be strengthened urgently. Figure 4 shows images of degraded regions in two different years (2003 and 2016). In Table 2, the comparison accuracy of the two results with both positive and negative values was 99.5%, indicating that the two methods were basically consistent in examining the increasing and decreasing results of the NDVI time-series trend.

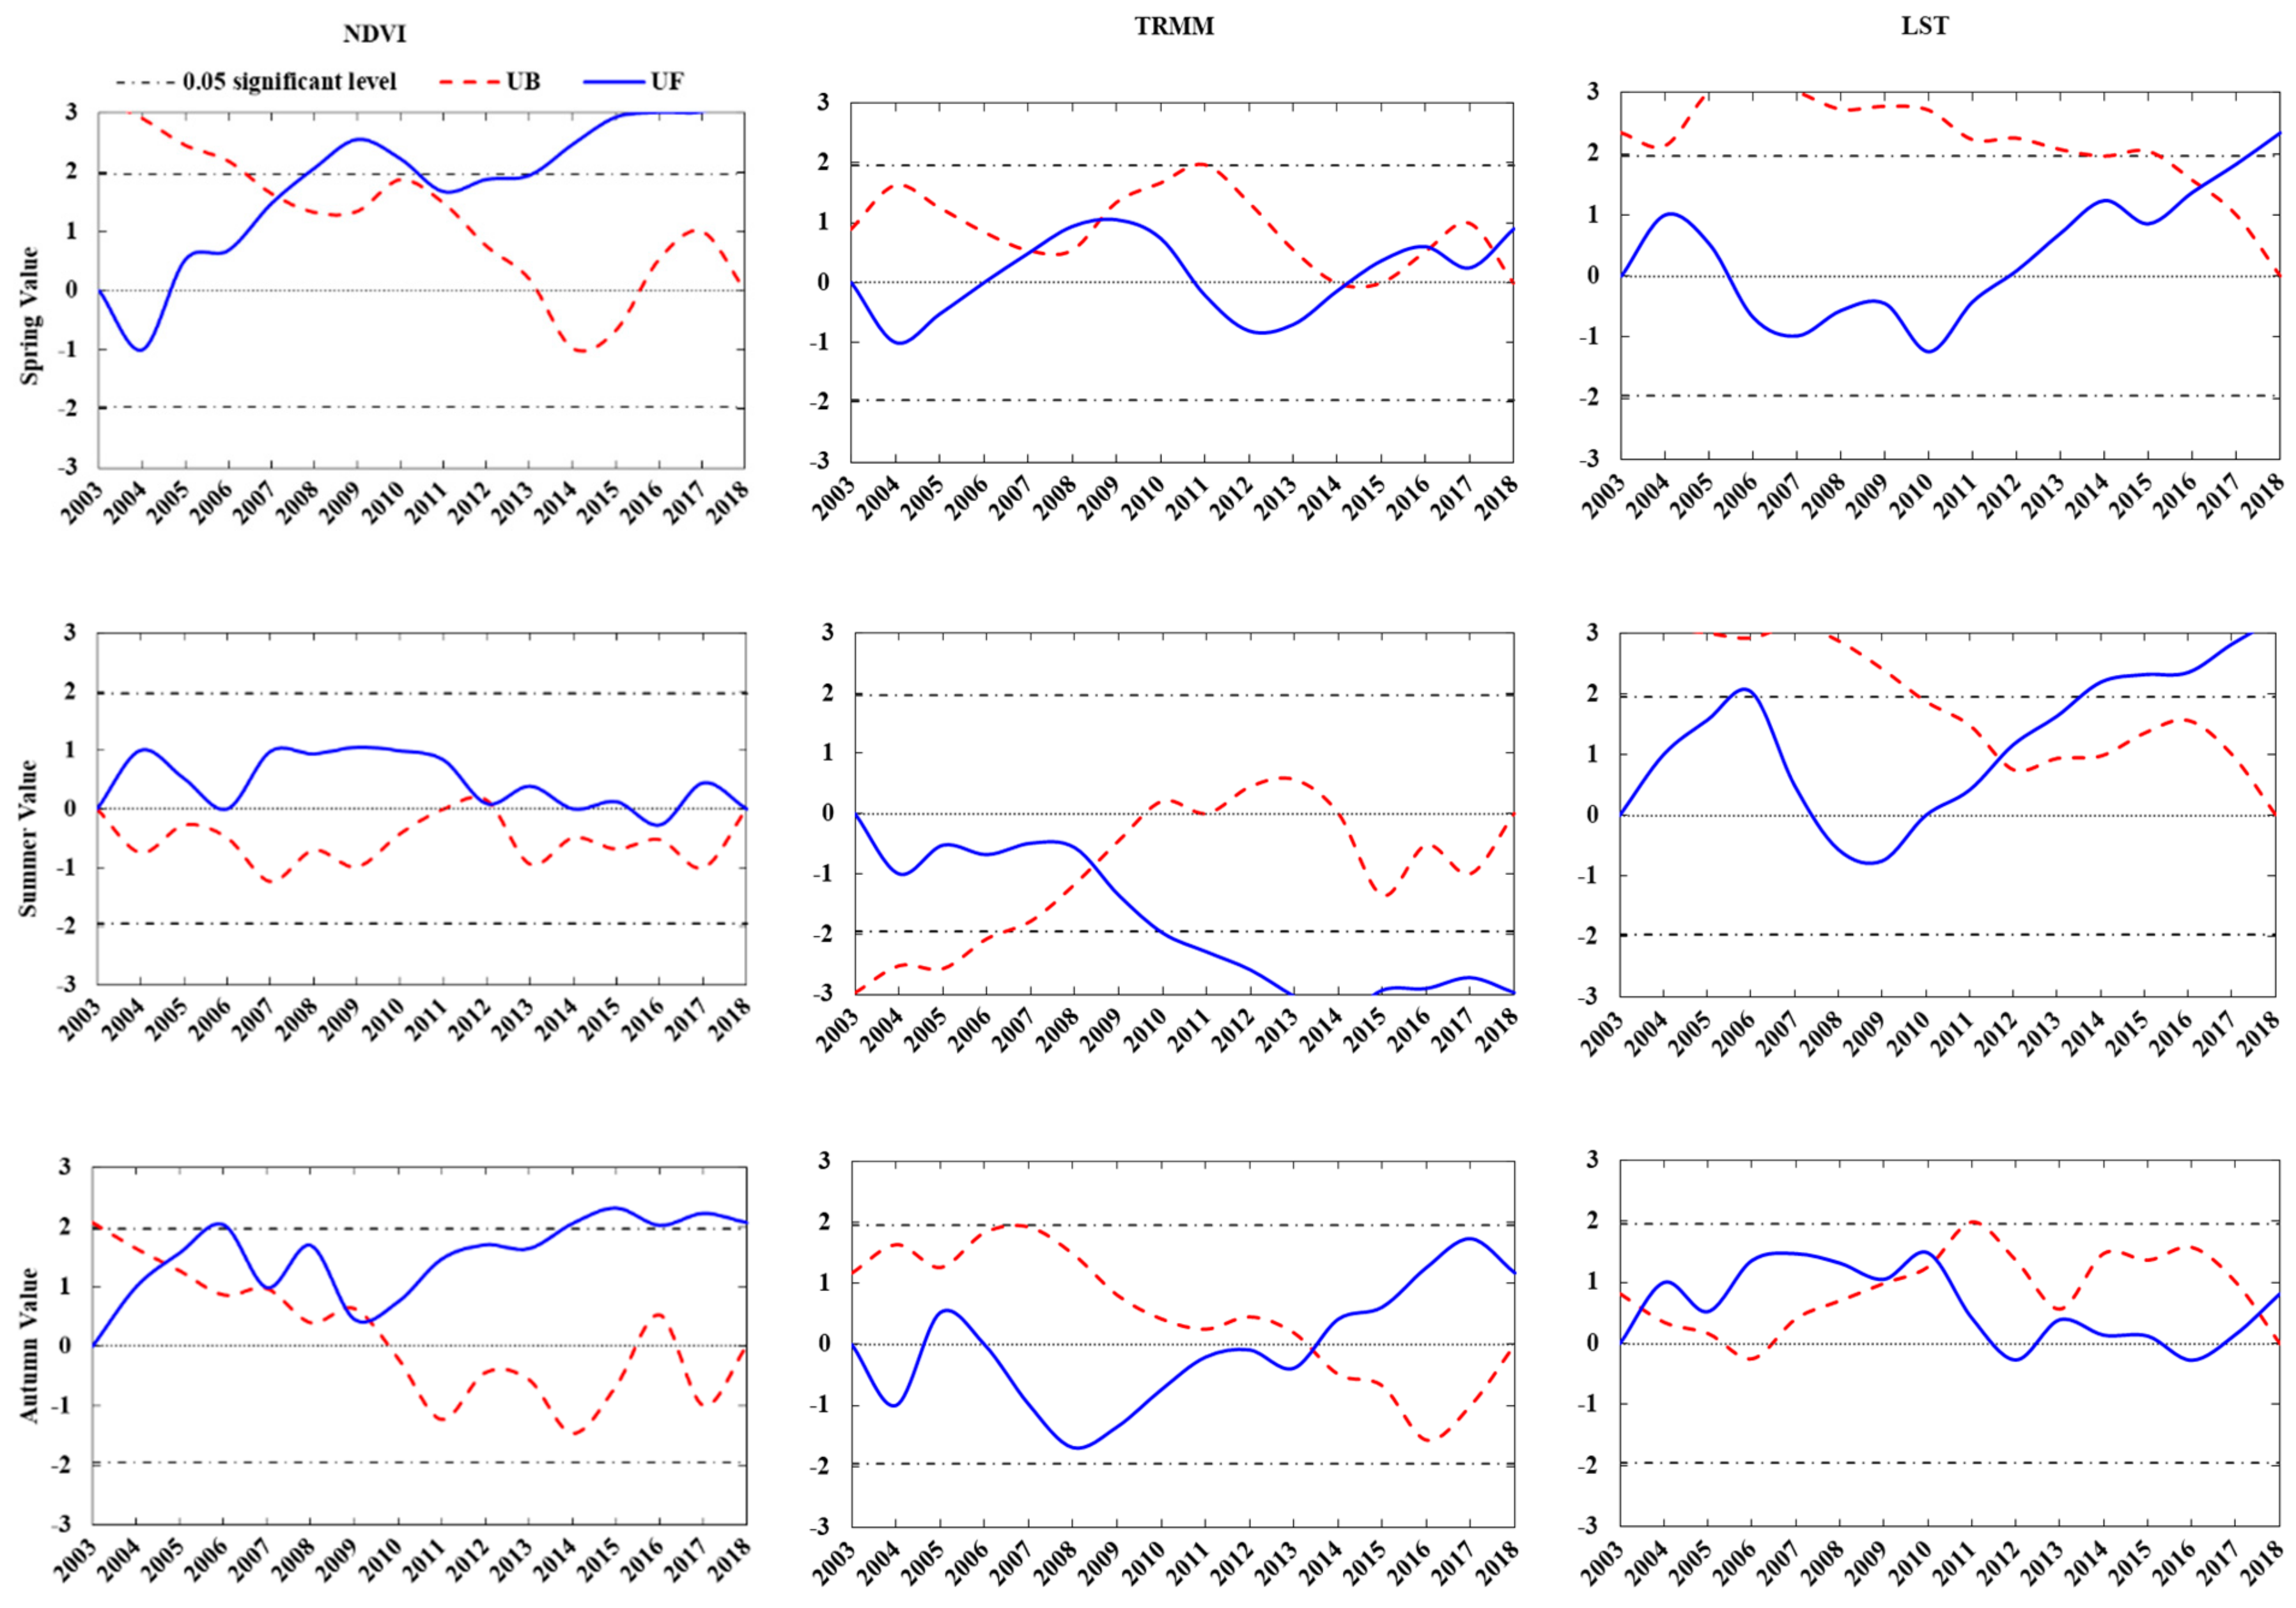
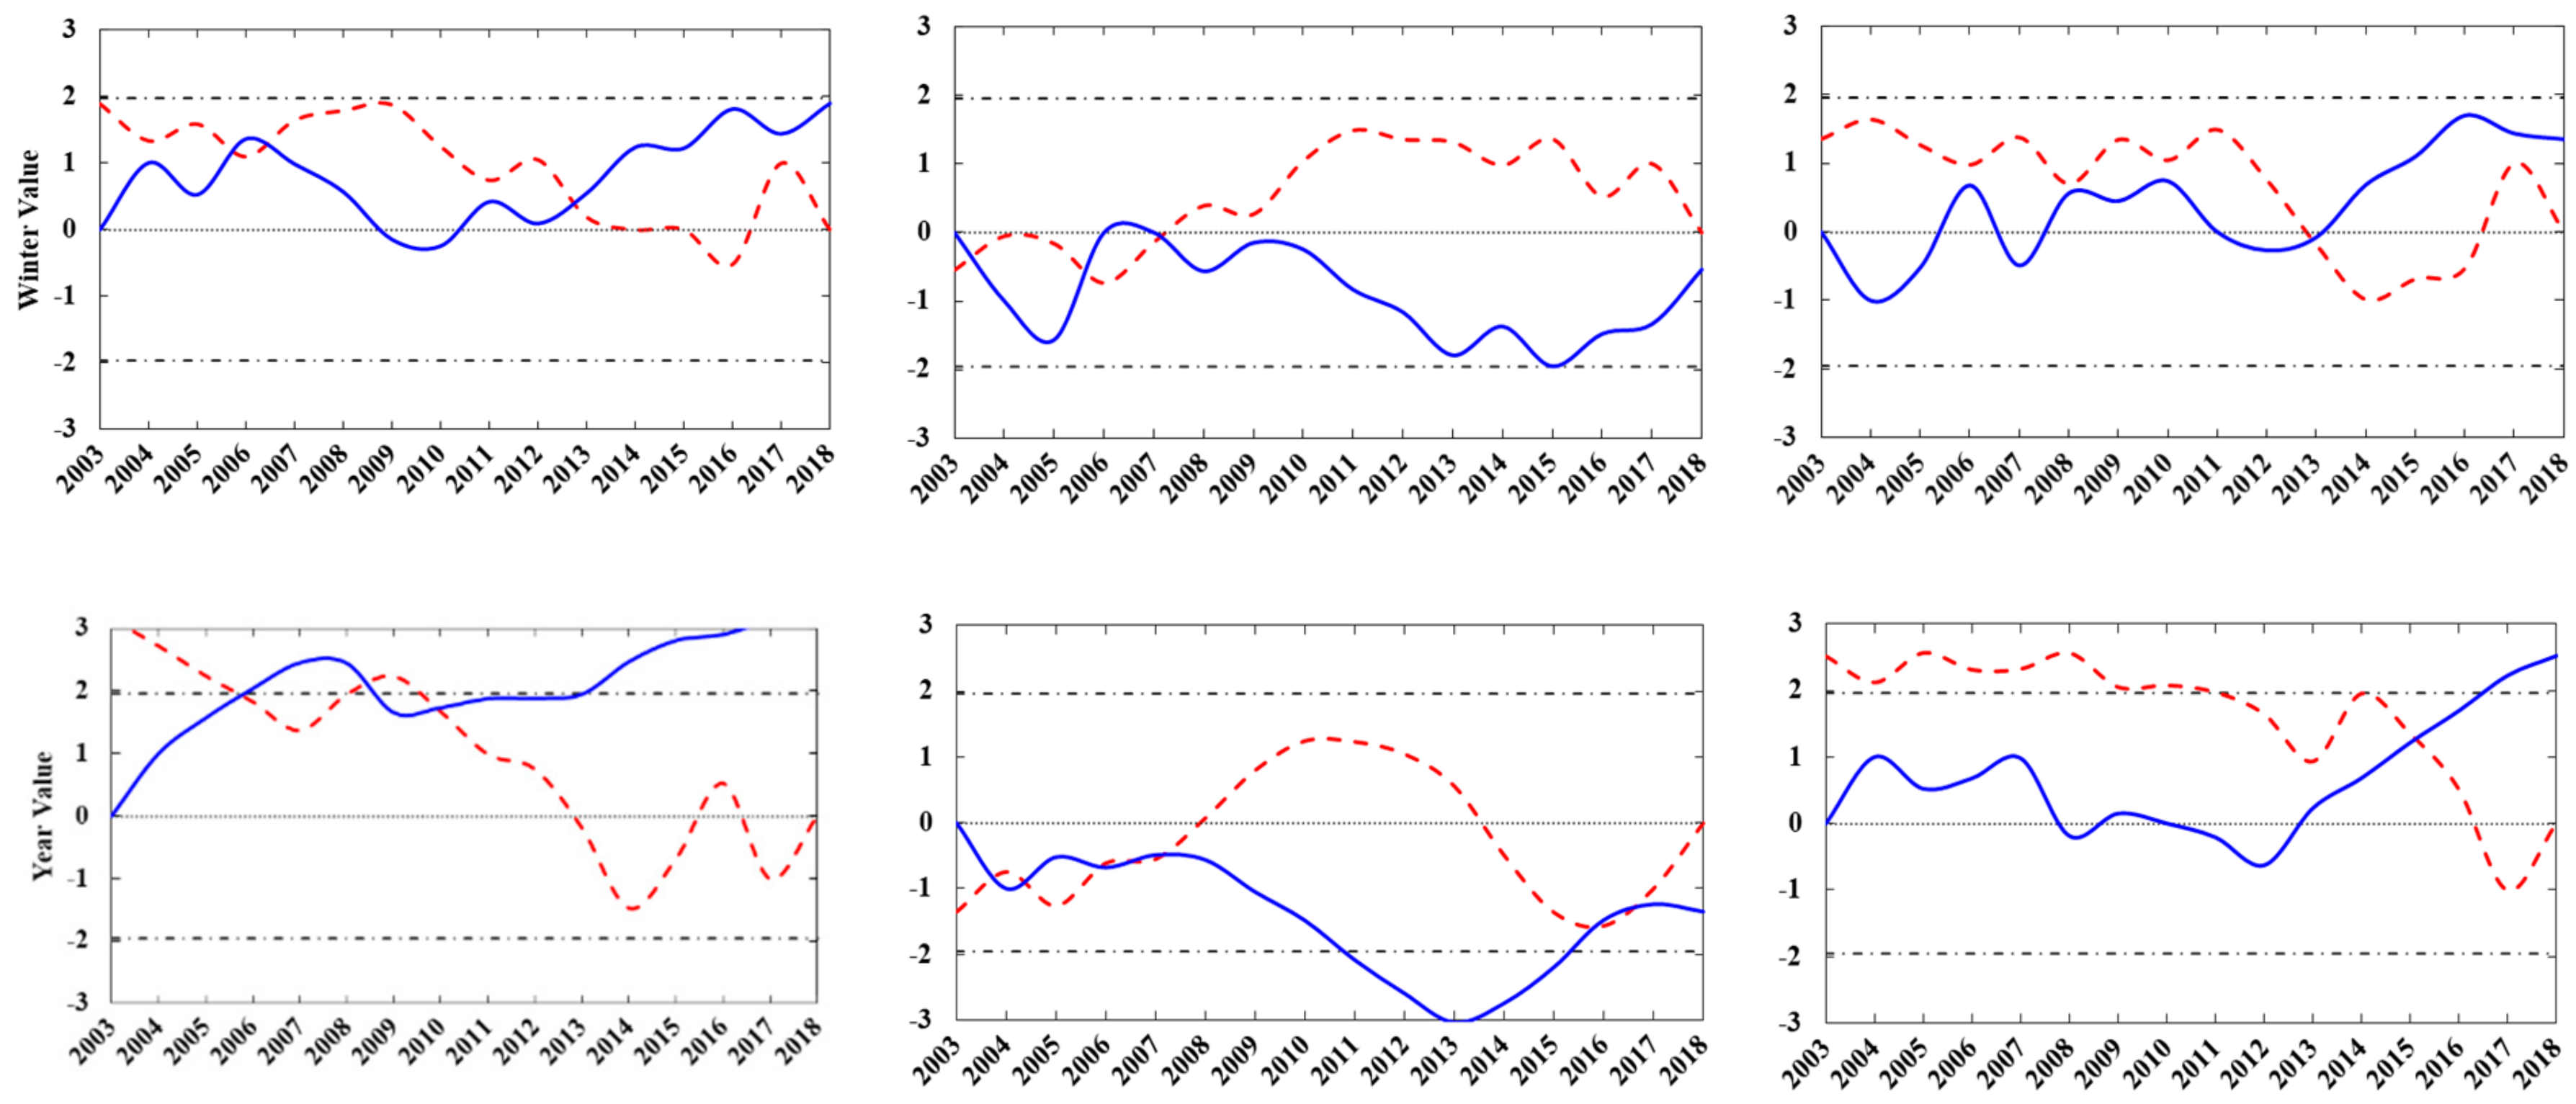
3.2. Mutation Characteristics of NDVI and Climate Factors in the Huaihe River Basin

In this study, the MK mutation test was carried out on NDVI, TRMM, and LST data of the Huaihe River basin at different time scales from 2003 to 2018, with a significance level of 0.05. As shown in Figure 5, UF was the original sequence curve (solid line), UB was the inverse sequence curve (dotted line). Table 3 presents the results of abrupt years at seasonal and annual scales.
From a seasonal-scale perspective, the NDVI in spring changed abruptly in 2007, after which it showed a significant upward trend, except for some periods (e.g., 2011–2013). Spring TRMM and NDVI were similar; in 2007, both went from low to high mutation. The UF and UB curves of spring TRMM had multiple points of intersection, indicating that spring TRMM fluctuations in the study area were high and that precipitation was unstable from 2003 to 2018. The lowest rainfall (100 mm) in the spring TRMM occurred in 2011, while the highest rainfall (296 mm) occurred in 2018. Overall, the LST in spring showed a trend of first rising, then falling and finally rising again. In 2016, there was a sudden change from low to high and the LST increased by 1.55 °C. The fluctuation amplitude of NDVI in summer was not significant. The change occurred around 2012, and the change in the NDVI value after the mutation was not significant. Prior to 2012, the LST in summer demonstrated a process of heating up then cooling down and then heating up again. After 2012, the LST continued to rise and showed a significant trend after 2014. Precipitation in summer decreased annually, and the declining trend was obvious and continued after 2008. Changes in TRMM and LST in autumn were not significant. Prior to 2009, the NDVI in autumn showed an oscillating periodic change, followed by an upward trend after 2009, and began to show a significant upward trend in 2014. In winter, the three changes were not significant; however, NDVI and TRMM changed suddenly in 2006, and NDVI and LST changed suddenly in 2013. After the sudden changes, the curve change trends became consistent within a short time period.
On an annual scale, there were three abrupt years in the NDVI (2006, 2008, and 2010) between 2003 and 2018, and the UF curve showed an overall upward trend. The two periods from 2006to 2008 and 2013 to 2018 showed significant upward trends, with the maximum value appearing in 2014 and the minimum value appearing in 2003. The fluctuation characteristics of the annual precipitation UF curve are not complicated; however, it did show a certain irregularity prior to 2007. After 2007, the annual precipitation curve gradually decreased and reached the minimum in 2013, with annual precipitation of only 809 mm. This phenomenon was mainly caused by the drought in the Huaihe River basin. After 2013, annual precipitation began to increase significantly, which was consistent with the results of Xia et al. [45]. The maximum mean annual LST occurred in 2017 (22 °C), the minimum occurred in 2008 (20 °C), and the abrupt change time appeared in 2015 (21 °C). Following the abrupt change, the increasing LST trend continued.

3.3. Relationships between NDVI and Climate Factors in the Huaihe River Basin

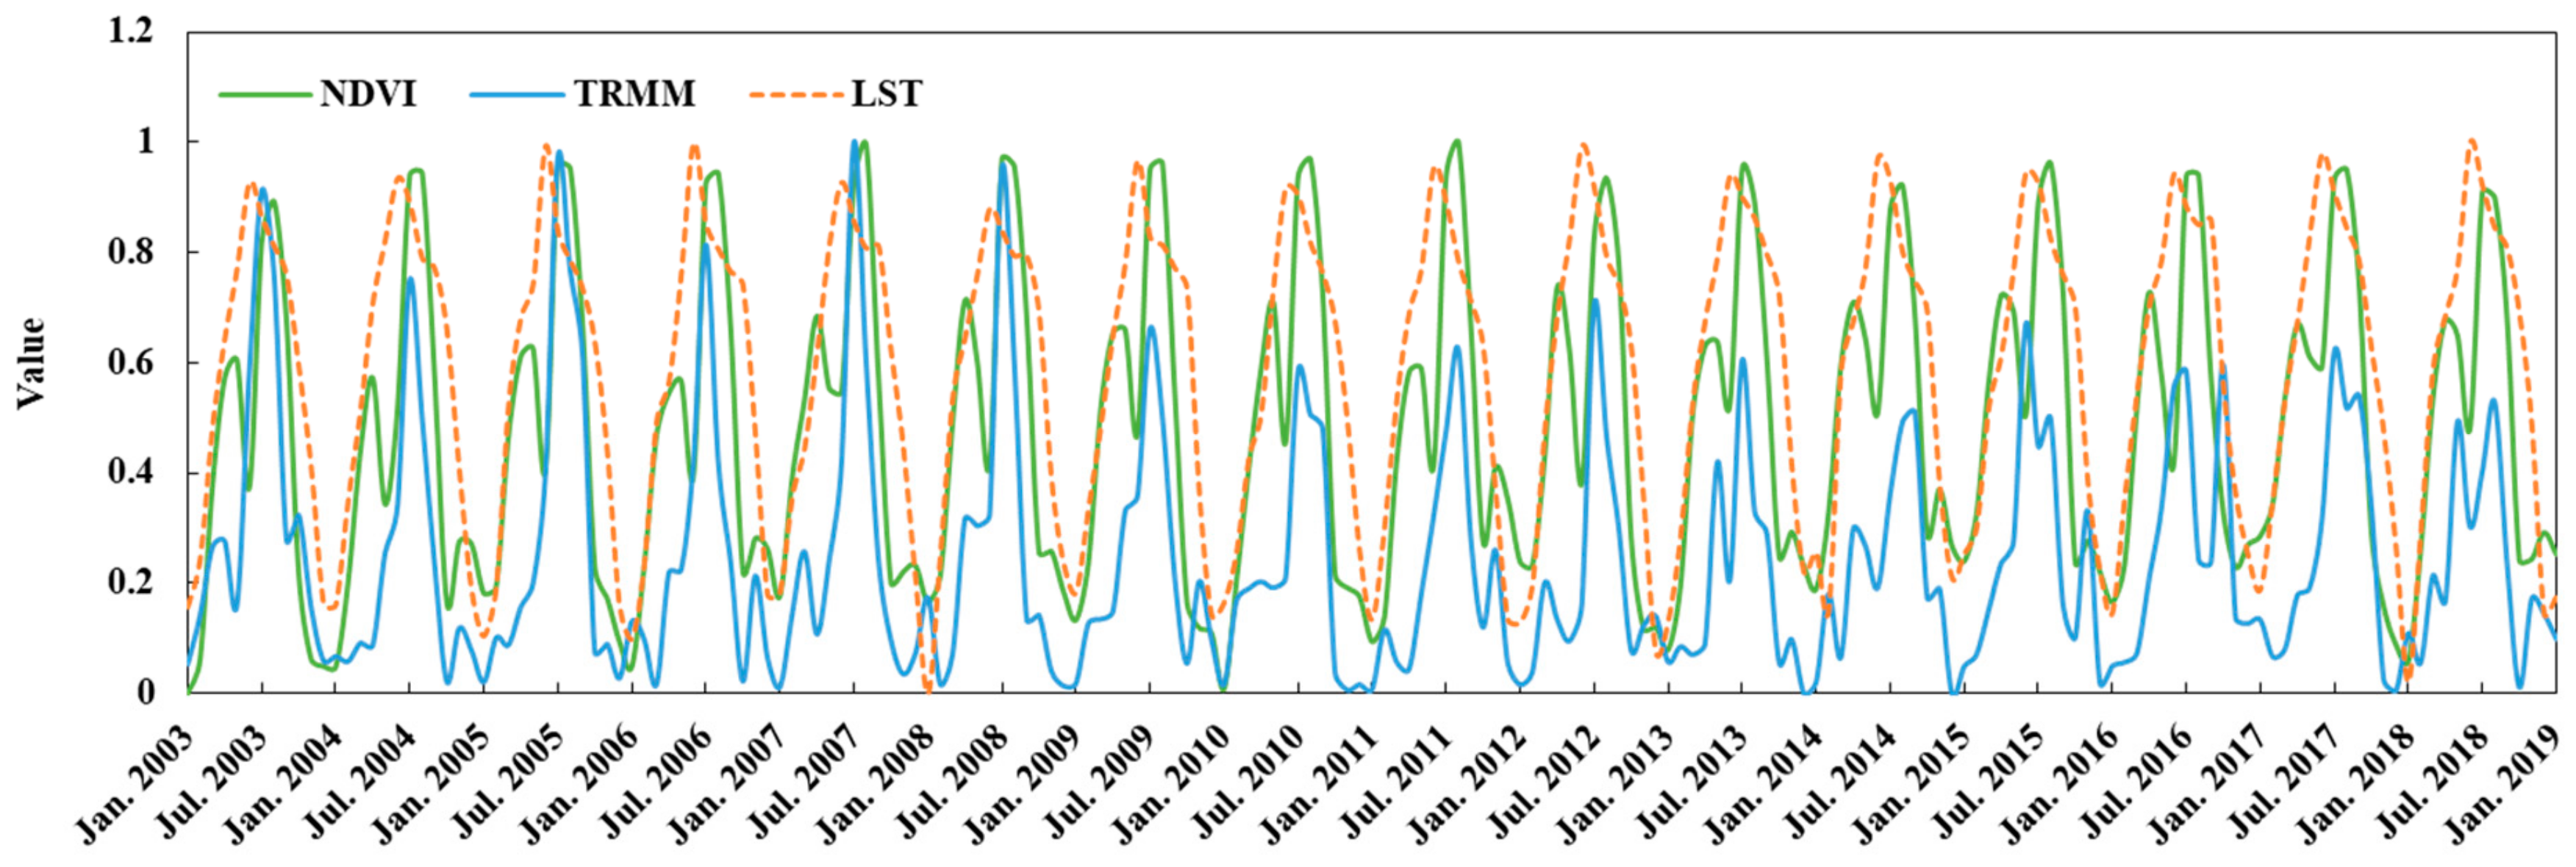
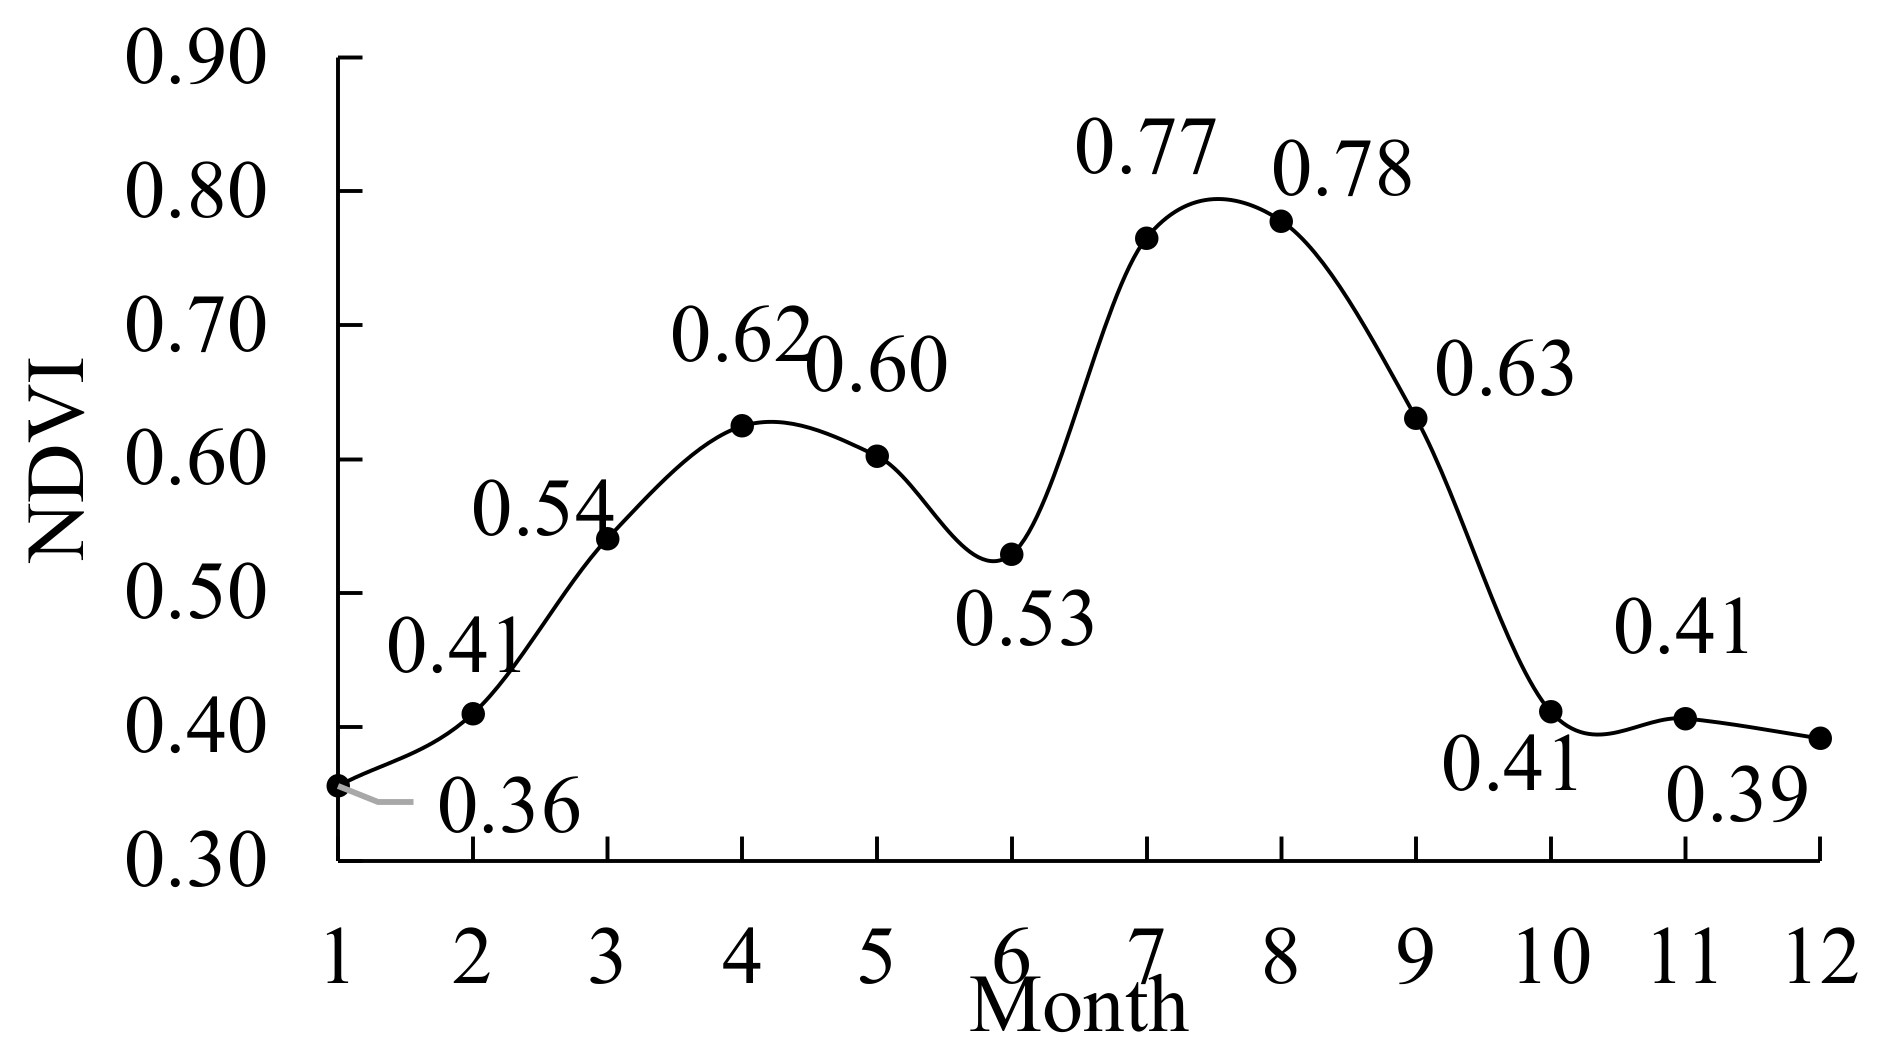
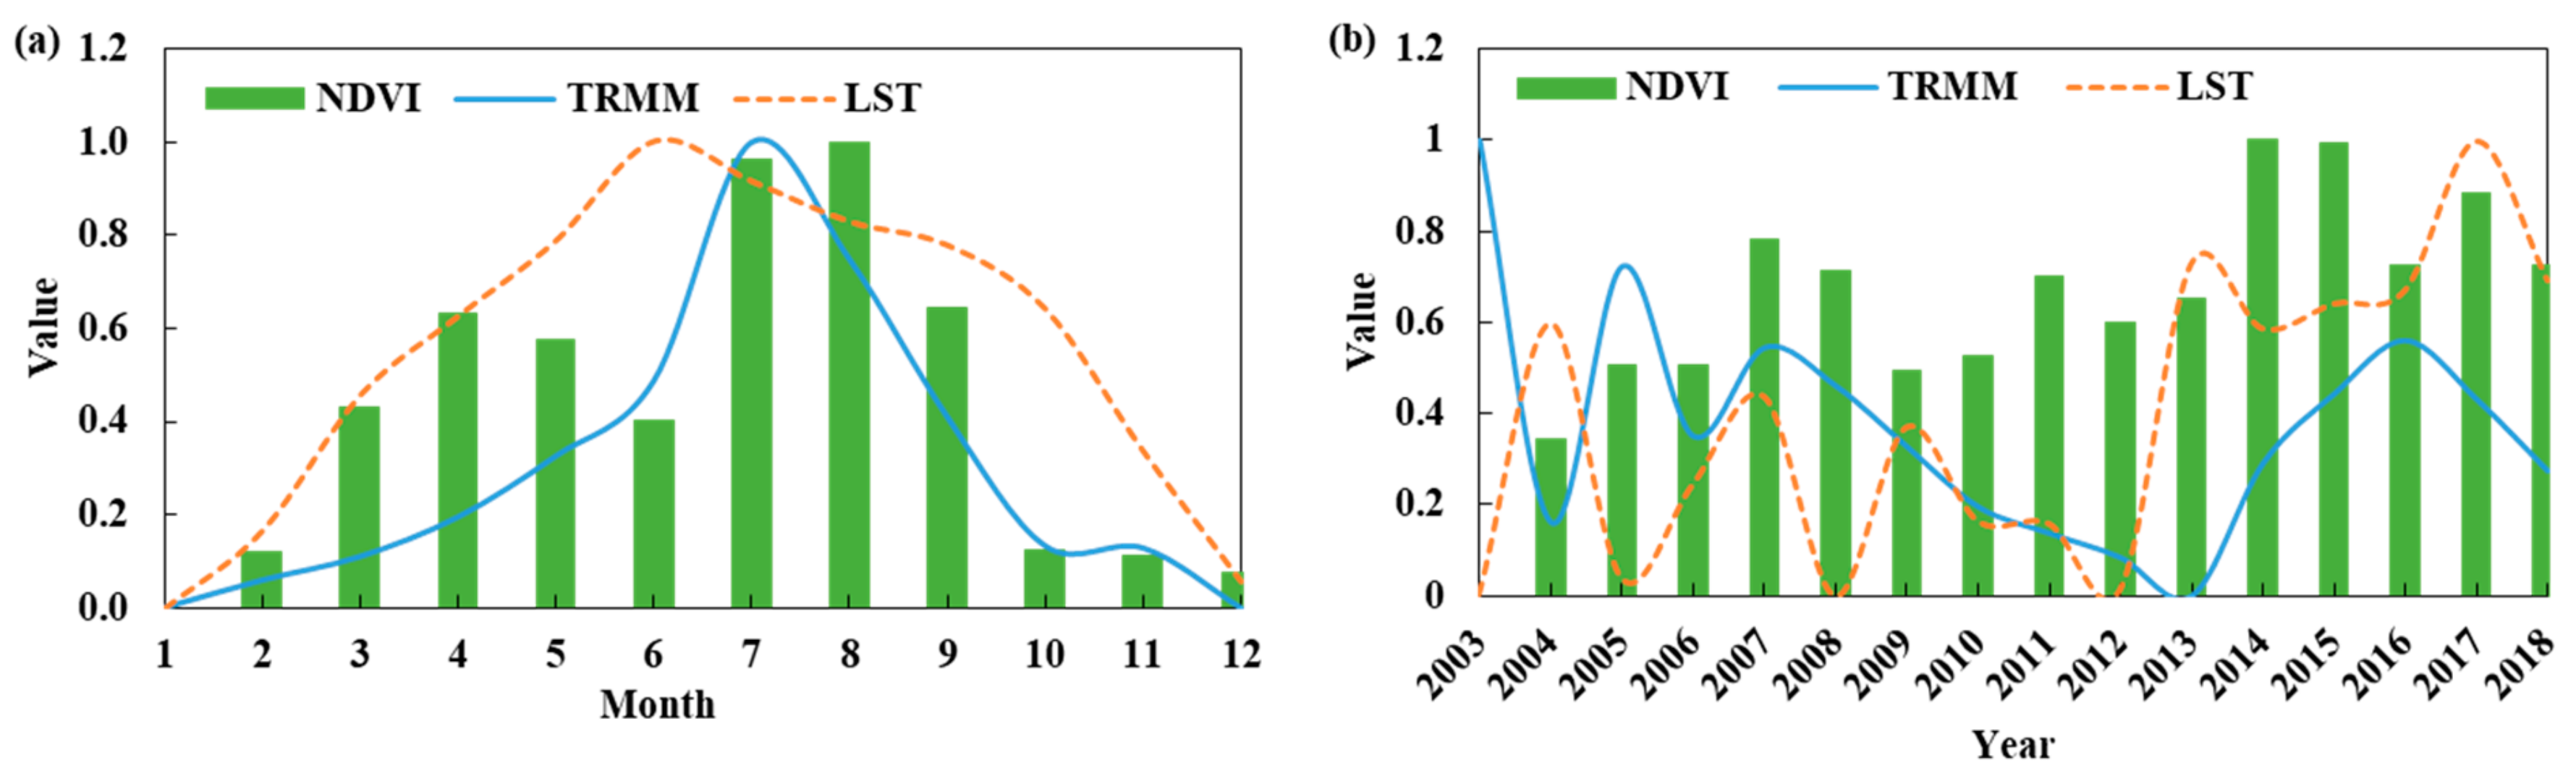
3.3.1. Fluctuation Characteristics of Time-Series Curves Between NDVI and Climate Factors

To comprehensively and comparatively analyze time-series data of NDVI, TRMM, and LST on different time-scales, a min-max normalization method was adopted in this study to normalize and convert the data so as to eliminate the dimensional influence among the three different data types. The normalized results are shown in Figure 5 and Figure 6.
The monthly NDVI curve reflects the phenological growth characteristics of vegetation in the Huaihe River basin to some extent [46]. The fluctuation characteristics of the NDVI, TRMM, and LST curves show obvious seasonal characteristics on the monthly scale (Figure 6). The monthly NDVI curve showed two peaks (April‒May, July‒August) and one valley (June) during the year. The major reason for this is that Huaihe River basin is one of the major grain-producing areas, and the cultivated land area accounts for approximately 50% of the basin area [23]. Therefore, the basin vegetation phenology change is unique. The NDVI decreased significantly in the crop-growing areas in June due to wheat harvesting (Figure 7). This change is illustrated more clearly in Figure 8. March‒April is the greening period of vegetation, and the NDVI curve rises rapidly and reached its peak in July‒August. Vegetation leaves wilt in September‒October, and the NDVI curve declines rapidly. It can be seen from Figure 9a that near the first wave peak (April‒May), the increase in LST was slightly larger than that of TRMM, and the NDVI value in May decreased slightly. In May, NDVI was negatively correlated with LST (p < 0.05, r = −0.5) (Table 4), while TRMM and NDVI were not significantly correlated. This indicates that, compared with April (Table 4), the LST in May can better reflect the vegetation growth change. The occurrence of the trough is because wheat in the Huaihe River basin is in the mature harvest period in June. After the planting of corn and other crops, the NDVI improves. The second peak occurred in the flood season [47] of the Huaihe River basin (July‒August) (Figure 9a). During this period, TRMM and LST were both near the annual peaks, and there were significant negative correlations between these values in July and August (p < 0.01, r = −0.78; p < 0.05, r = −0.60) (Table 4). During this period, due to abundant precipitation and high temperature, moisture transport between the ground and the air was strengthened, which was conducive to increasing air humidity. In addition, during this period, vegetation was in a dense period, and transpiration of leaves was strengthened, which facilitated the cooling of leaves and played a certain protective role for vegetation growth. However, from the matching relationships between TRMM, LST, and NDVI, vegetation in July was more sensitive to climate factors. The TRMM in October showed a significant positive correlation with NDVI (p < 0.01, r = 0.62), indicating that the increase in TRMM in October may have a certain slowing effect on vegetation entering the withering period [48]. The TRMM in October was significantly negatively correlated with LST (p < 0.01, r = −0.71), whereas LST showed no significant correlation with NDVI. In addition, according to the monthly precipitation curve (Figure 6), precipitation in the Huaihe River basin has decreased significantly since 2009, which is related to repeated droughts in the Huaihe River basin since 2009 [45].
As shown in Figure 10, from the perspective of KU and SK, the fluctuation amplitudes of NDVI and LST in the Huaihe River basin were small, and the fluctuation amplitude of LST was the smallest. The KU and SK of TRMM in Huaihe River bas were both larger than NDVI and LST. The KU value of TRMM ranged from −1.05 to 3.3, with the highest value in 2007 and the lowest value in 2017. Maximum precipitation occurred in 2003 (1373 mm), and minimum precipitation occurred in 2013 (809 mm). In addition, the SK values of precipitation were between 0.41 and 1.79, indicating that both the concentration degree and distribution characteristics of precipitation vary greatly interannually. As shown in Figure 6b, the annual NDVI was the highest in 2015, followed by 2014, and the absolute values of precipitation KU and SK in the corresponding years were both low (Figure 10), indicating that when the annual concentration of precipitation and annual distribution were closest to the normal distribution, it was most conducive to vegetation growth.

3.3.2. Correlations between NDVI and Climate Factors on Different Time Scales

According to Table 5, the annual NDVI was positively correlated with the annual mean LST (p < 0.05, r = 0.53), while the annual TRMM was not significantly correlated with the annual NDVI. In spring, the NDVI was positively correlated with the spring TRMM (p < 0.05, r = 0.49); however, it had no significant correlation with the spring LST. In spring, vegetation was in a recovery period, and TRMM had the most significant impact on vegetation growth. The TRMM and LST in other seasons have no obvious correlations with the NDVI. It is worth noting that the NDVI had strong positive correlations with TRMM (p < 0.01, r = 0.88) and LST (p < 0.01, r = 0.78) on the monthly scale, and the confidence was > 99%, indicating that monthly TRMM and LST can better reflect the fluctuation and response of NDVI than seasonal and annual scales.

3.3.3. Effects of TRMM and LST on Vegetation Growth

The annual mean precipitation (TRMM) and land-surface temperature (LST) of the Huaihe River basin from 2003 to 2018 were segregated into 10 categories according to Natural Breaks Class, to facilitate the statistics of the annual mean NDVI of paddy field, dryland, woodland, grassland, and the whole study area in different TRMM and LST ranges, as shown in Table 6. Different types of precipitation can promote or inhibit vegetation growth. When the annual mean NDVI of paddy field, dryland, woodland, and grassland reached its maximum, the precipitation was 1036~1092, 1036~1152, 1093~1152 and 1373~1629 mm, respectively. In addition, when the precipitation is lower than 767 mm, the annual mean NDVI of different vegetations is not ideal. This trend can provide some reference for the planting and management of large-scale contiguous areas.
The LST can vary depending on the environment [49]. According to Table 6, the annual mean NDVI of different vegetations varies significantly for different LST ranges, while the NDVI of the same vegetation shows a certain regularity. With an increase in the LST, the NDVI of paddy fields increased first and then decreased. The annual mean NDVI in dryland was stable and at a good level from 19 to 22.6 °C. The annual mean NDVI of woodland decreased with an increase in the LST. When the LST was higher than 22.7 °C, the annual average NDVI of woodland decreased from 0.53 to 0.49. The variation in the NDVI of grassland with the LST was similar to that of woodland. However, the variation in the annual mean NDVI with the LST in the whole study area was complicated. When the LST was between 8 and 14.4 °C, the annual mean NDVI reached its maximum value of 0.63. When the LST was higher than 22.7 °C, the NDVI dropped to 0.44. In addition, at an LST of 14.5 to 16.4 °C, the NDVI was only 0.99 because the main type covered by this temperature range is water area. Therefore, analysis of the impact of temperature, precipitation, and other factors on the regional environment should be conducted according to different vegetation types, so as to better mine the potential information [50].

4. Conclusions

To analyze the change trend of the ecological environment in the Huaihe River basin from 2003 to 2018 and explore the relationship between NDVI and climate factors (TRMM, LST), this study initially combined MK trend significance test results of annual NDVI with Theil–Sen slope results to analyze the NDVI change trend in the Huaihe River basin over the past 16 years on the pixel scale. Secondly, by means of the MK mutation test, time-series data of NDVI, TRMM, and LST on different time scales were tested for mutations, so as to identify the year when mutations occurred and obtain potential information. Furthermore, the min-max normalization method was used to normalize the NDVI, TRMM, and LST time series data so as to compare their KU and SK values and analyze any matches on a monthly or interannual scale. Finally, the correlation coefficients of NDVI, TRMM and LST at different time scales were combined to analyze their differences at those time scales. The results show that:
(1) The mean value of NDVI in the Huaihe River basin was 0.54, and the NDVI pixel value of 62% was between 0.4 and 0.6. The mean NDVI of different land cover types was sorted from large to small as woodland (0.6) > dryland (0.56) > paddy field (0.55) > grassland (0.52) > urban (0.48) > unutilized land (0.43) > water (0.31). Areas with high vegetation coverage were mainly concentrated in the southwest and northwest mountainous areas, and some central plain areas, while the transition zone from mountains to plains had the second-highest coverage. Areas with NDVI values < 0.3 were mainly concentrated in urban land and water areas, which accounted for 3.33% of the total basin area. Changes in the annual NDVImax curves for different land cover types were similar, and the variation is slight. The inter-annual fluctuation of different vegetation types in NDVImax may be caused by urban expansion, policy orientation, human activities, and environmental changes.
(2) Over 16 years, the improved area of Huaihe River basin was much higher than that in the degraded area, among which the degraded area only accounted for 16.55% of the total basin area, the improved area accounted for 77.26%, and the area that remained stable was 6.18%. The main reasons for the decrease in or even disappearance of vegetation cover are the expansion of towns and the impact of human activities, and the vegetation cover around the water area is obviously degraded, so the protection of wetland ecological environment needs to be strengthened urgently.
(3) The seasonal abrupt change characteristics of NDVI, TRMM, and LST are quite different. The year of abrupt change and the number of abrupt change points are not unique. Only in summer, NDVI and LST suddenly changed at the same time in 2012, and there was only one abrupt change point. In addition, spring NDVI and spring TRMM, winter NDVI and winter TRMM, winter NDVI and winter LST, and annual NDVI and annual TRMM changed suddenly in 2007, 2006, 2013, and 2006, respectively, and the change trend after the mutation became consistent within a short time. The UF curves of NDVI in spring, autumn, and annually showed significant trends after 2013. The UF curve of precipitation in summer and annually showed significant downward trends after 2010. The UF curves of LST in summer and annually showed significant upward trends after 2016.
(4) Compared with April, the LST of the Huaihe River basin in May can better explain the change in vegetation growth. According to the matching relationship between TRMM, LST, and NDVI on the monthly scale (Figure 9a), vegetation in July is more sensitive to climate factors. The increased TRMM in October may have a certain slowing effect on vegetation entering the withering period. NDVI was the highest in 2015, followed by 2014. The absolute values of the TRMM of KU and SK in 2014 and 2015 were both low, indicating that the concentration degree and annual distribution of TRMM in 2014 were the closest to a normal distribution and that this was the condition most conducive to vegetation growth.
(5) Correlations between NDVI, TRMM, and LST in the Huaihe River basin were not significant on seasonal or annual scales; however, significant positive correlations were found on the monthly scale (p < 0.01, r = 0.88; p < 0.01, r = 0.78), indicating that monthly TRMM and monthly LST can better reflect NDVI fluctuations.
(6) When the precipitation is lower than 767 mm, the annual mean NDVI of different vegetations is not ideal. The NDVI of the same vegetation shows a certain regularity in different LST ranges. However, the variation in the annual mean NDVI with LST in the whole study area is complicated. Therefore, when analyzing the impact of temperature, precipitation and other factors on the regional environment, different vegetation types must be considered, so as to better mine the potential information [50].

Author Contributions

Conceptualization, Z.L. and F.Q.; Methodology, Z.L. and H.W.; Data curation, N.L. and J.Z.; Formal analysis, Z.P.; Writing – original draft, Z.L.; Writing – review and editing, Z.L. and F.Q. All authors have read and agreed to the published version of the manuscript.

Funding

This research was supported and funded by the National Science and Technology Platform Construction Project of China (No.2005DKA32300), Major Projects of the Ministry of Education Base in China(No.16JJD770019), Spatiotemporal big data industry technology research institute of Henan province, China (No. 2019DJA01).

Acknowledgments

Acknowledgement for the data support from “National Earth System Science Data Sharing Infrastructure, National Science and Technology Infrastructure of China-Data Center of Lower Yellow River Regions(http://henu.geodata.cn). And NASA’s Level 1 Atmosphere Archive and Distribution System Distributed Active Archive Center, LAADS DAAC (https://ladsweb.modaps.eosdis.nasa.gov).

Conflicts of Interest

The authors declare no conflict of interest.

References

  1. Sun, H.Y.; Wang, C.Y.; Niu, Z.; Bukhosor, L.B. Analysis of the vegetation cover change and the relationship between NDVI and environmental factors by using NOAA time series data. J. Remote Sens. 1988, 2, 204–210. [Google Scholar]
  2. Fan, N.; Xie, G.D.; Zhang, C.S.; Chen, L.; Li, W.H.; Cheng, S.K. Spatial-temporal dynamic changes of vegetation cover in Lancang river basin during 2001–2010. Resour. Sci. 2012, 34, 1222–1231. [Google Scholar]
  3. Yuan, L.H.; Jiang, W.G.; Shen, W.M.; Liu, Y.H.; Wang, W.J.; Tao, L.L.; Zheng, H.; Liu, X.F. The spatio-temporal variations of vegetation cover in the Yellow River Basin from 2000 to 2010. Acta Ecol. Sin. 2013, 33, 7798–7806. [Google Scholar]
  4. Myneni, R.B.; Keeling, C.D.; Tucker, C.J.; Asrar, G.; Nemani, R.R. Increased plant growth in the northern high latitudes from 1981 to 1991. Nature 1997, 386, 698–702. [Google Scholar] [CrossRef]
  5. Ma, L.; Yan, H.W.; He, Y.; Zhang, Q.; Liu, B. Vegetation changes in south Himalayas areas based on remote sensing monitoring during 2001–2015. Arid Land Geog. 2017, 40, 405–414. [Google Scholar]
  6. Fang, J.Y.; Song, Y.C.; Liu, H.Y.; Piao, S.L. Vegetation-climate relationship and its application in the division of vegetation zone in china. Acta Bot. Sin. 2002, 44, 1105–1122. [Google Scholar]
  7. Fuller, D.O.; Prince, S.D. Rainfall and foliar dynamics in tropical Southern Africa: Potential impacts of global climatic change on savanna vegetation. Clim. Chang. 1996, 33, 69–96. [Google Scholar] [CrossRef]
  8. Kong, D.; Zhang, Q.; Singh, V.P.; Shi, P. Seasonal vegetation response to climate change in the northern hemisphere (1982–2013). Glob. Planet. Chang. 2017, 148, S0921818116302260. [Google Scholar] [CrossRef] [Green Version]
  9. Fensholt, R.; Rasmussen, K.; Nielsen, T.; Mbow, C. Evaluation of earth observation based long term vegetation trends Intercomparing NDVI time series trend analysis consistency of Sahel from AVHRR GIMMS, Terra MODIS and SPOTVGT data. Remote Sens. Environ. 2009, 113, 1886–1898. [Google Scholar] [CrossRef]
  10. Fensholt, R.; Proud, S.R. Evaluation of earth observation based global long term vegetation trends comparing GIMMS and MODIS global NDVI time series. Remote Sens. Environ. 2012, 119, 131–147. [Google Scholar] [CrossRef]
  11. Chen, S.N.; Guo, J. Evaluation of different spatial interpolation methods in regional temperature sequence: A case study in Northeast China. Chin. J. Agrometeorol. 2015, 36, 234–241. [Google Scholar]
  12. Zhu, H.Y.; Jia, S.F. Uncertainty in the spatial interpolation of rainfall data. Prog. Geog. 2004, 2, 34–42. [Google Scholar]
  13. Chen, Q.; Chen, Y.H.; Wang, M.J.; Jiang, W.G.; Hou, P.; Li, Y. Change of vegetation net primary productivity in Yellow River watersheds from 2001 to 2010 and its climatic driving factors analysis. Chin. J. Appl. Ecol. 2014, 25, 2811–2818. [Google Scholar]
  14. Li, H.X.; Liu, G.H.; Fu, B.J. Response of vegetation to climate change and human activity based on NDVI in the Three-River Headwaters region. Acta Ecol. Sin. 2011, 31, 5495–5504. [Google Scholar]
  15. Qu, S.; Wang, L.; Lin, A.; Zhu, H.; Yuan, M. What drives the vegetation restoration in yangtze river basin, china: climate change or anthropogenic factors? Ecol. Indic. 2018, 90, 438–450. [Google Scholar] [CrossRef]
  16. Zhou, Y.Y.; Zhu, M.X.; Guo, X.J.; Li, K.; Miao, J.X.; Guo, J.J.; Xu, X.F.; Yue, D.X. Relative effects of climate change and human activities on net primary productivity in Shule River Basin. Acta Ecol. Sin. 2019, 39, 5127–5137. [Google Scholar]
  17. Xiao, M.Z.; Yu, Z.B.; Zhu, Y.L. Copula-based frequency analysis of drought with identified characteristics in space and time: a case study in Huai River basin, China. Theor. Appl. Climatol. 2019, 137, 2865–2875. [Google Scholar] [CrossRef]
  18. Wu, Y.N.; Zhong, P.A.; Xu, B.; Zhu, F.L.; Ma, B. Changing of flood risk due to climate and development in Huaihe River basin, China. Stoch. Environ. Res. Risk Assess 2017, 31, 935–938. [Google Scholar] [CrossRef]
  19. Wang, K.; Chu, D.Y.; Yang, Z.H. Flood Control and Management for the Transitional Huaihe River in China. Procedia Eng. 2016, 154, 703–709. [Google Scholar]
  20. Qing, W.; Xuehua, L.; Baolei, L. Dynamic changes and spatial patterns of vegetation cover in a river basin based on SPOT-VGT data: A case study in the Huaihe River Basin. Prog. Geogr. 2013, 32, 270–277. [Google Scholar]
  21. Ren, X.; Zheng, J.H.; Mu, C.; Yan, K.; Xu, T.B. Evaluating reliability of grassland net primary productivity estimates using different meteorological interpolation methods. Pratacult. Sci. 2017, 34, 439–448. [Google Scholar]
  22. Vicente-Serrano, S.; Saz-Sánchez, M.A.; Cuadrat, J. Comparative analysis of interpolation methods in the Middle Ebro valley (Spain): Application to annual precipitation and temperature. Clim. Res. 2003, 24, 161–180. [Google Scholar] [CrossRef] [Green Version]
  23. Huaihe River Water Conservancy. Available online: http://www.hrc.gov.cn/main/lyjs.jhtml (accessed on 19 November 2019).
  24. Zhang, H.B.; Tang, H.J.; Yang, G.X.; Li, G.; Chen, B.R.; Xin, X.P. Changes of spatial-temporal characteristics based on MODIS NDVI data in Inner Mongolia grassland from 2000 to 2008. J. Chin. Soc. Agric. Eng. 2009, 25, 168–175. [Google Scholar]
  25. Liu, Y.T. Analysis of the Accuracy Evaluation of TRMM Precipitation Data in Henan Province. Master’s Thesis, Henan University, Kaifeng, Henan, China, 2018. [Google Scholar]
  26. Shiflett, S.A.; Liang, L.L.; Crum, S.M.; Feyisa, G.L.; Wang, J.; Jenerette, G.D. Variation in the urban vegetation, surface temperature, air temperature nexus. Sci. Total Environ. 2017, 579, 495–505. [Google Scholar] [CrossRef]
  27. Zhao, W.; He, J.L.; Yin, G.F.; Wen, F.P.; Wu, H. Spatiotemporal variability in land surface temperature over the mountainous region affected by the 2008 Wenchuan earthquake From 2000 to 2017. J. Geophys. Res. Atmos. 2019, 124, 1975–1991. [Google Scholar] [CrossRef]
  28. Zhang, H.Q.; Yang, Y.J.; Xun, S.P.; He, B.F.; Zhang, A.M.; Wu, W.Y. Seasonal and spatial variability of vegetation and land surface temperature in Anhui Province. J. Appl. Meteorol. Sci. 2011, 22, 232–240. [Google Scholar]
  29. Xu, Z.X.; Liu, L.; Liu, Z.F. Impact of Climate Change on Hydrological Cycle in River Basins; Science Press: Beijing, China, 2015; pp. 15–18. [Google Scholar]
  30. Gocic, M.; Trajkovic, S. Analysis of changes in meteorological variables using Mann-Kendall and Sen’s slope estimator statistical tests in Serbia. Glob. Planet. Chang. 2013, 100, 172–182. [Google Scholar] [CrossRef]
  31. Cai, B.F.; Yu, R. Advance and evaluation in the long time series vegetation trends research based on remote sensing. J. Remote Sens. 2009, 13, 1170–1186. [Google Scholar]
  32. Li, Y.; Xie, Z.; Qin, Y.; Xia, H.; Zheng, Z.; Zhang, L.; Pan, Z.; Liu, Z. Drought under global warming and climate change: An empirical study of the Loess Plateau. Sustainability 2019, 11, 1281. [Google Scholar] [CrossRef] [Green Version]
  33. Ye, Z.W.; Wu, W. Characteristics of Climate Change and Its Driving Forces in the Tourism Area of Lushan Mountain Since 1955. Sci. Geogr. Sin. 2011, 31, 1221–1227. [Google Scholar]
  34. Guna, A.; Zhang, J.Q.; Tong, S.Q.; Bao, Y.B.; Han, A.; Li, K.W. Effect of Climate Change on Maize Yield in the Growing Season: A Case Study of the Songliao Plain Maize Belt. Water 2019, 11, 2108. [Google Scholar] [CrossRef] [Green Version]
  35. Yibin, G.; Chunyan, L.U.; Lianxiu, Z.; Xiaoqing, L.; Ying, S.U. Temporal and spatial characteristics of temperature and precipitation in china′s coastal areas from 1951 to 2016. J. Forest. Environ. 2019, 137, 530–539. [Google Scholar]
  36. Wang, J.F.; Wu, T.L. Analysis on runoff variation characteristics and its attribution in the upper reaches of Zhanghe river basin. J. Arid Land Resour. Environ. 2019, 33, 165–171. [Google Scholar]
  37. Faiz, M.A.; Liu, D.; Fu, Q.; Khan, M.I.; Li, T.; Cui, S. Assessment of characteristics and distinguished hydrological periods of a river regime. Environ. Earth Sci. 2018, 77, 7913–7917. [Google Scholar] [CrossRef]
  38. Huang, Y.; Huang, Z.L.; Xiao, W.F.; Zeng, L.X.; Ma, L. Trend Analysis with Mann-Kendall Test on Water Quality of the Mainstream Inflow and Outflow for the Three Gorges Reservoir of Yangtze River. Resour. Environ. Yangtze Basin 2019, 28, 950–961. [Google Scholar]
  39. Yu, Z.; Fung, B.C.M.; Haghighat, F.; Yoshino, H.; Morofsky, E. A systematic procedure to study the influence of occupant behavior on building energy consumption. Energy Build. 2011, 43, 1409–1417. [Google Scholar] [CrossRef] [Green Version]
  40. Chen, M.H.; Chen, Y.B.; Guo, G.H.; Feng, Z.X. Temporal and spatial changes of urban thermal environment and driving mechanism in Dongguan City. Geogr. Res. 2011, 30, 1431–1438. [Google Scholar]
  41. Liang, J.; Tang, M.L.; Zhao, X. Testing high-dimensional normality based on classical skewness and Kurtosis with a possible small sample size. Commun. Stat. Theory Methods 2019, 48, 5719–5732. [Google Scholar] [CrossRef]
  42. Wang, X.M. Misunderstanding of the concepts of skewness and kurtosis. Stat. Decis. 2008, 12, 145–146. [Google Scholar]
  43. Liu, Z.Z.; Zhang, X.W.; Chen, Y.S.; Zhang, C.C.; Qin, F.; Zeng, H.W. Remote sensing estimation of biomass in winter wheat based on CASA model at region scale. Trans. Chin. Soc. Agric. Eng. 2017, 33, 225–233. [Google Scholar]
  44. Li, X.B.; Chen, Y.H.; Zhang, Y.X.; Fan, Y.D.; Zhou, T.; Xie, F. Impact of climate change on desert steppe in northern China. Adv. Earth Sci. 2002, 17, 254–261. [Google Scholar]
  45. Xia, M.; Sun, P.; Zhang, Q.; Yao, R.; Wang, Y.Z.; Wen, Q.Z. Temporal and spatial characteristic of drought in Huaihe River Basin based on standardized precipitation evapotranspiration index. Acta Ecol. Sin. 2019, 39, 3643–3654. [Google Scholar]
  46. Zhang, X.W.; Qin, F. Coupling relationship of precipitation and vegetation and its influence for sediment yield in Pisha sandstone area. Geogr. Res. 2016, 35, 513–524. [Google Scholar]
  47. Luo, L.S.; Xu, M.; Liang, S.X. Stability analysis of the interannual relationship between El Nino/La Nina and the summer rainfall over Huaihe River basin. Meteorol. Mon. 2018, 44, 1073–1081. [Google Scholar]
  48. Zhang, W. Spatial and Temporal Variation of Vegetation Phenology and Its Response to Climate Change in Inner Mongolia. Master’s Thesis, Inner Mongolia Normal University, Hohhot, China, 2019; pp. 37–44. [Google Scholar]
  49. Julien, Y.; Sobrino, J.A.; Mattar, C.; Ruescas, A.B.; Jiménez-Muñoz, J.C.; Sòria, G.; Hidalgo, V.; Atitar, M.; Franch, B.; Cuenca, J. Temporal analysis of normalized difference vegetation index (NDVI) and land surface temperature (LST) parameters to detect changes in the Iberian land cover between 1981 and 2001. Int. J. Remote Sens. 2011, 32, 2057–2068. [Google Scholar] [CrossRef]
  50. Gu, Z.; Duan, X.; Shi, Y.; Li, Y.; Pan, X. Spatiotemporal variation in vegetation coverage and its response to climatic factors in the Red River Basin, China. Ecol. Indic. 2018, 93, 54–64. [Google Scholar] [CrossRef]
Figure 1. Location of the Huaihe River basin, China, and land cover types.
Sustainability 12 02198 g001
Figure 2. Spatial distribution of the annual mean value of the normalized difference vegetation index (NDVI) in the Huaihe River basin, China, from 2003 to 2018.
Sustainability 12 02198 g002
Figure 3. Annual change curve for different land cover types (a) NDVImax and (b) NDVImax departure in the Huaihe River basin, China, from 2003 to 2018.
Sustainability 12 02198 g003
Figure 4. Superposition results of Theil–Sen slope and Mann–Kendall (MK) significance test of the normalized difference vegetation index (NDVI) in the Huaihe River basin, China, from 2003 to 2018.
Sustainability 12 02198 g004
Figure 5. Mann–Kendall abrupt test curves of normalized difference vegetation index (NDVI), precipitation (TRMM), and land-surface temperature (LST) on seasonal and annual scales in the Huaihe River basin, China.
Sustainability 12 02198 g005aSustainability 12 02198 g005b
Figure 6. Time-series curves of normalized difference vegetation index (NDVI), precipitation (TRMM), and land-surface temperature (LST) in the Huaihe River basin, China, on a monthly scale.
Sustainability 12 02198 g006
Figure 7. Spatial variation of monthly mean normalized difference vegetation index (NDVI) in the Huaihe River basin, China, from 2003 to 2018.
Sustainability 12 02198 g007
Figure 8. Monthly mean normalized difference vegetation index (NDVI) curve of the Huaihe River basin, China, from 2003 to 2018.
Sustainability 12 02198 g008
Figure 9. (a) Monthly, and (b) interannual matching relationships between normalized difference vegetation index (NDVI), precipitation (TRMM), and land-surface temperature (LST) in the Huaihe River basin, China.
Sustainability 12 02198 g009
Figure 10. Comparison of: (a) kurtosis coefficient (KU), and (b) skewness (SK) of the normalized difference vegetation index (NDVI), precipitation (TRMM), and land-surface temperature (LST) in the Huaihe River basin, China.
Sustainability 12 02198 g010
Table 1. Statistics on NDVImax departure of different land cover types in the Huaihe River basin, China, from 2003 to 2018.
TypeMaximum Departure YearMaximum DepartureMinimum Departure YearMinimum Departure
paddy field20110.02262003−0.0297
dryland20110.02562003−0.0323
woodland20150.02402003−0.0312
grassland20110.02002003−0.0354
water20110.04742003−0.0520
urban20110.03312018−0.0239
unutilized land20070.02772014−0.0318
study area20110.02592003−0.0300
Table 2. Change trend statistics of the normalized difference vegetation index (NDVI) in the Huaihe River basin, China. from 2003 to 2018. (significance level = 0.05).
βZPixel NumberArea PercentResultβ and Z Accuracy
≤−0.0005≤−1.962363625.50%Significant Degradation99.50%
≤−0.0005−1.96–1.9647453211.05%Slight Degeneration
−0.0005–0.0005−1.96–1.962652956.18%Stable
<−0.0005−1.96–1.96134714831.37%Slight Improvement
<−0.0005<−1.96197040945.89%Significant Improvement
Table 3. Statistics of abrupt change years of normalized difference vegetation index (NDVI), precipitation (TRMM), and land-surface temperature (LST) on seasonal and annual scales (significance level is 0.05).
SpringSummerAutumnWinterYear(s)
NDVI200720122005/2007/20092006/20132006/2008/2010
TRMM2007/2009/2014/2016200820132006/20072004/2006/2007/2016
LST201620122010/201720132015
Table 4. Correlation coefficients between the normalized difference vegetation (NDVI) and climate factors (precipitation; TRMM, and land-surface temperature; LST) from January to December in the Huaihe River basin, China (* p < 0.05, ** p < 0.01).
Month NDVITRMMLST
JanuaryNDVI1
TRMM0.011
LST0.30−0.56 *1
February NDVI1
TRMM01
LST0.21−0.241
March NDVI1
TRMM−0.211
LST0.53*−0.461
April NDVI1
TRMM0.281
LST0.29−0.31
MayNDVI1
TRMM0.091
LST−0.50 *−0.091
June NDVI1
TRMM−0.151
LST−0.04−0.161
July NDVI1
TRMM0.111
LST−0.42−0.78 **1
August NDVI1
TRMM0.171
LST−0.46−0.60 *1
September NDVI1
TRMM0.351
LST−0.47−0.351
OctoberNDVI1
TRMM0.62 **1
LST−0.41−0.71 **1
NovemberNDVI1
TRMM0.361
LST−0.1−0.431
December NDVI1
TRMM0.131
LST0.07−0.58 *1
Table 5. Correlation coefficients of the normalized difference vegetation (NDVI) and climate factors (precipitation; TRMM, and land-surface temperature; LST) under different time scales (* p < 0.05, ** p < 0.01).
Temporal Scale NDVITRMMLST
YearNDVI1
TRMM−0.331
LST0.53 * −0.251
SpringNDVI1
TRMM0.49 * 1
LST0.10−0.05*1
SummerNDVI1
TRMM−0.171
LST−0.07−0.66 ** 1
AutumnNDVI1
TRMM0.271
LST−0.11−0.431
WinterNDVI1
TRMM0.221
LST0.300.171
MonthNDVI1
TRMM0.88 ** 1
LST0.78 ** 0.79 ** 1
Table 6. Comparison of annual mean NDVIs of paddy field, dryland, woodland, grassland, and study area at different annual mean precipitations (TRMM) and land-surface temperatures (LST) in the Huaihe River basin, China, from 2003‒2018.
RangePaddy FieldDrylandWoodlandGrasslandStudy Area
TRMM/mm606–7670.510.470.520.460.45
768–843-0.550.55-0.51
844–9150.560.570.570.440.54
916–9750.490.540.530.430.50
976–1,0350.580.58--0.56
1,036–1,0920.590.590.590.540.57
1,093–1,1520.550.590.670.420.55
1,153–1,2280.550.570.63-0.53
1,229–1,3720.540.530.610.500.49
1,373–1,6290.51-0.640.670.58
LST/℃8.0–14.4--0.67-0.63
14.5–16.40.480.530.660.690.09
16.5–17.80.480.480.650.670.35
17.9–190.540.510.650.630.50
19.1–19.90.580.560.630.590.56
20–20.50.580.560.620.540.56
20.6–21.10.550.560.590.490.55
21.2–21.70.520.560.550.480.54
21.8–22.60.510.570.530.460.55
22.7–24.80.480.480.490.460.44

