Effect of Street Canyon Shape and Tree Layout on Pollutant Diffusion under Real Tree Model


Abstract
1. Introduction
2. Model
2.1. Mathematical Model
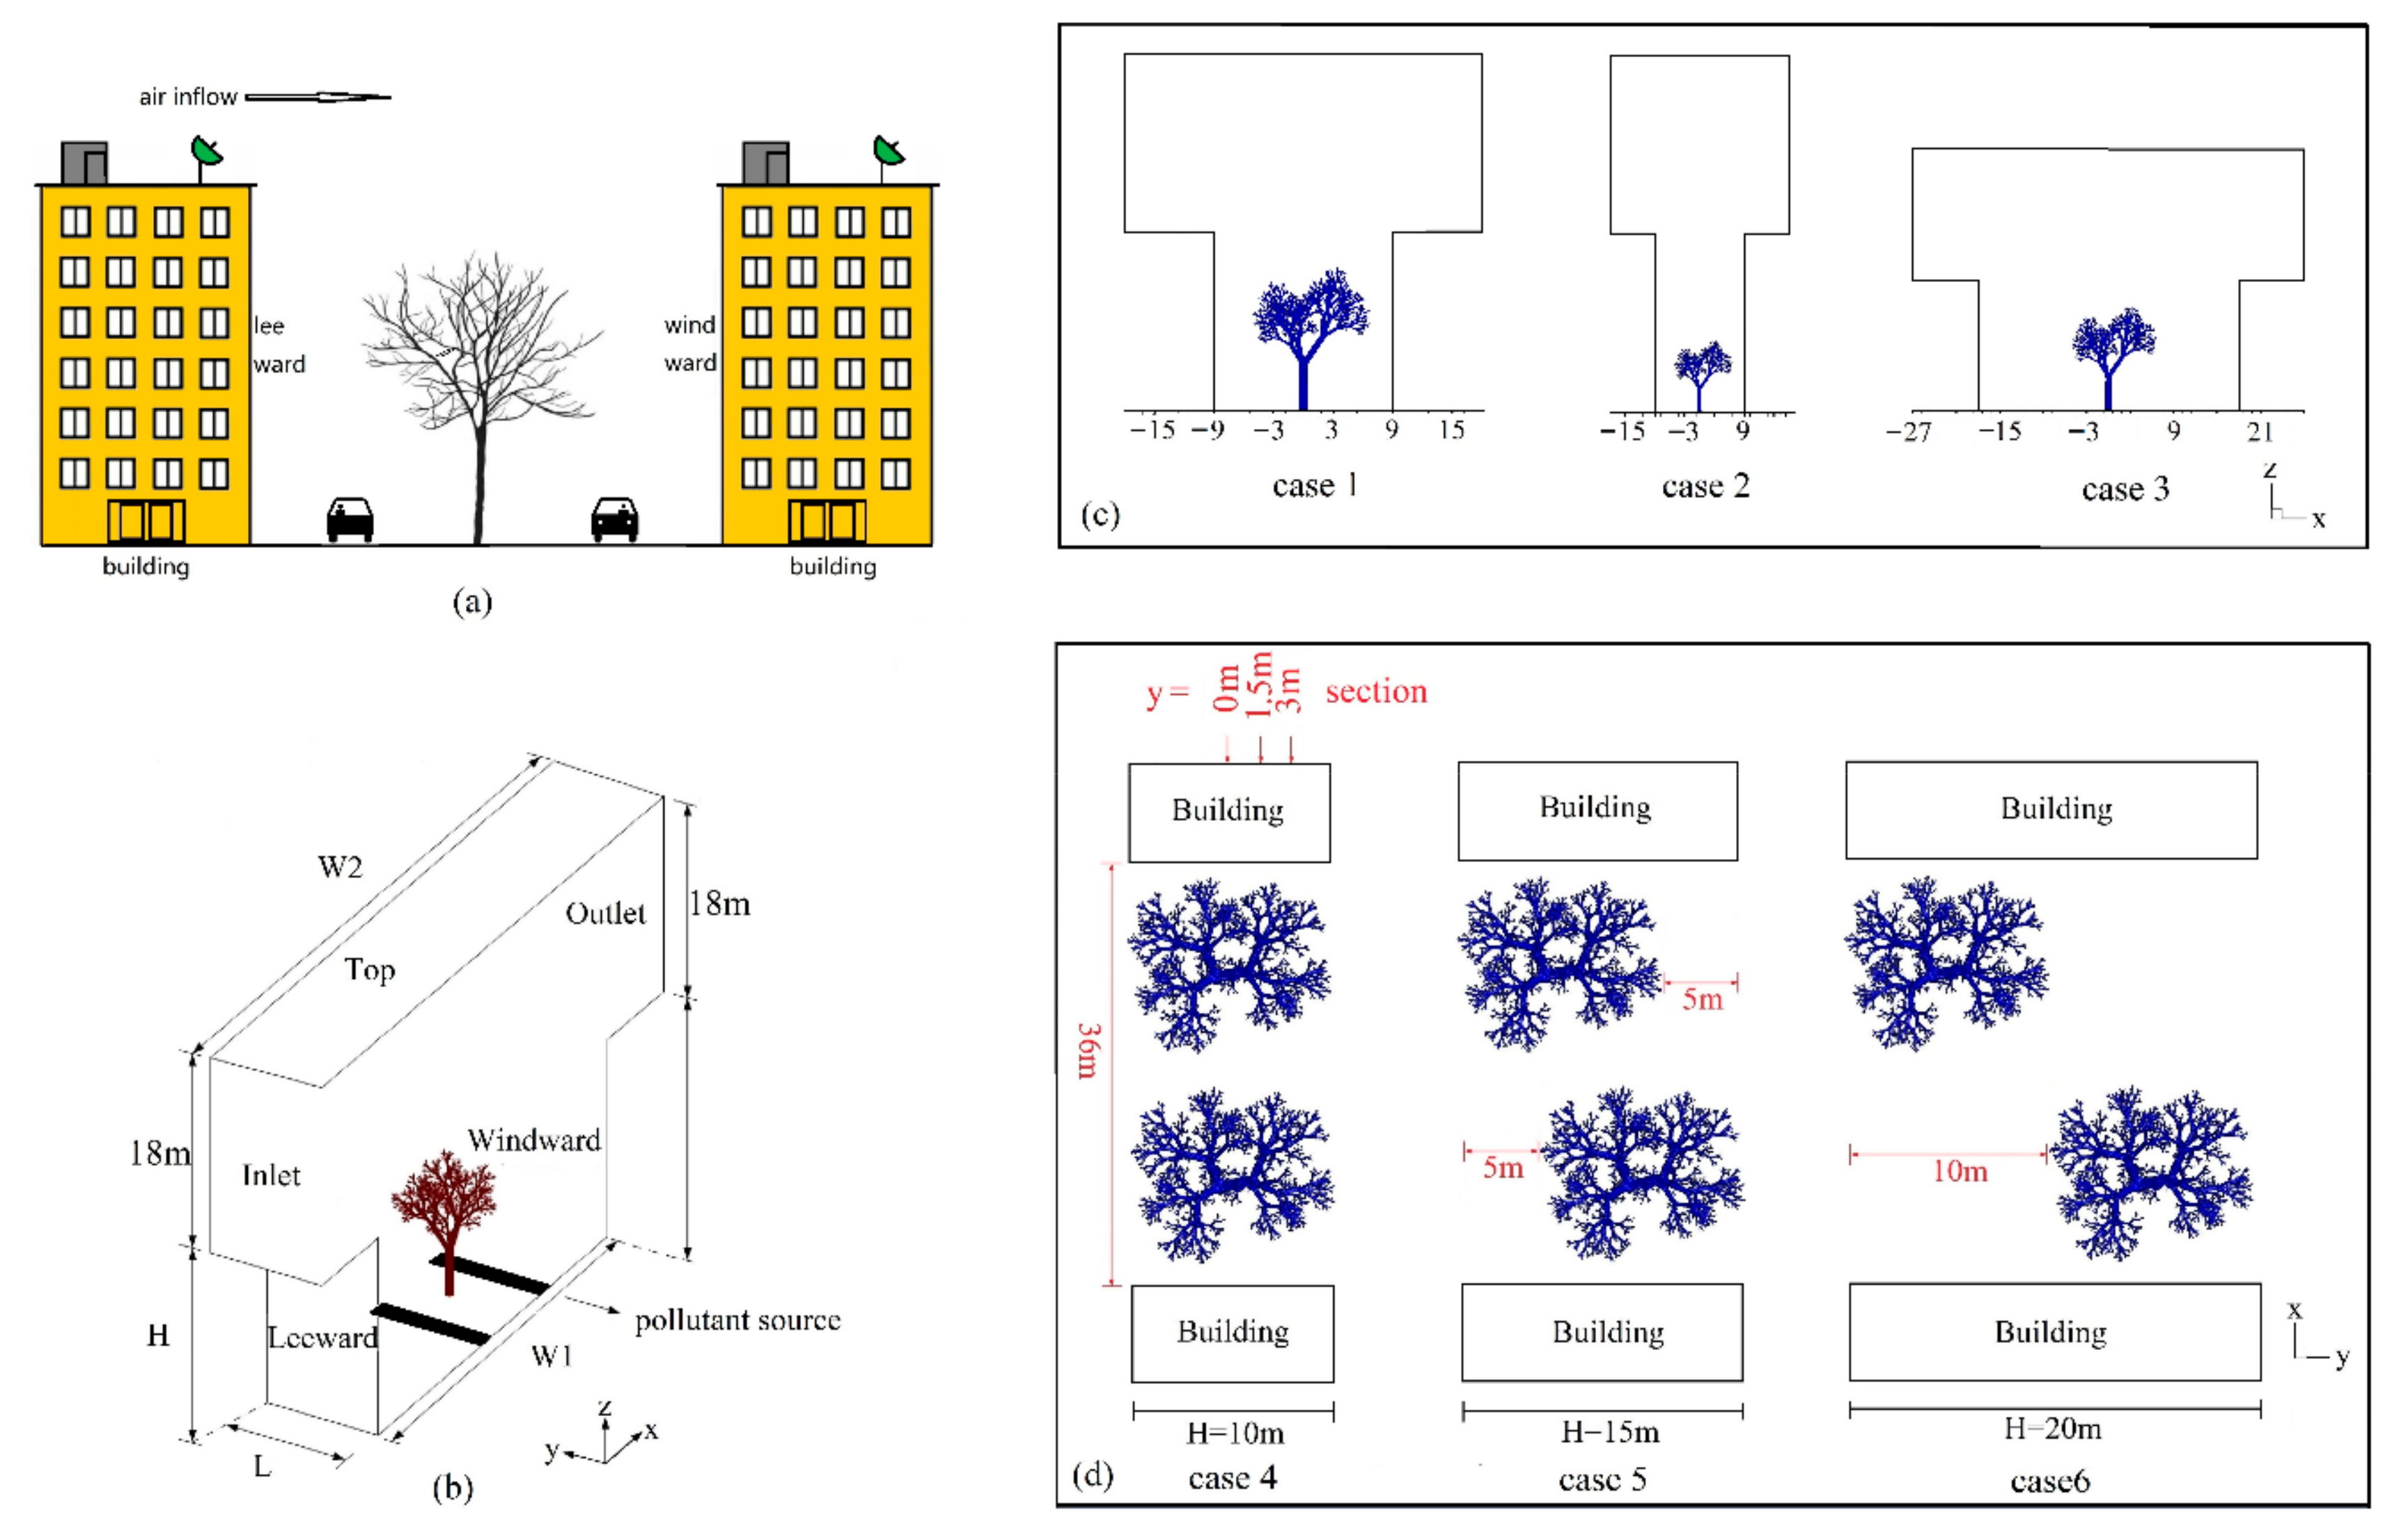
2.2. Physical Model
3. CFD Methodology
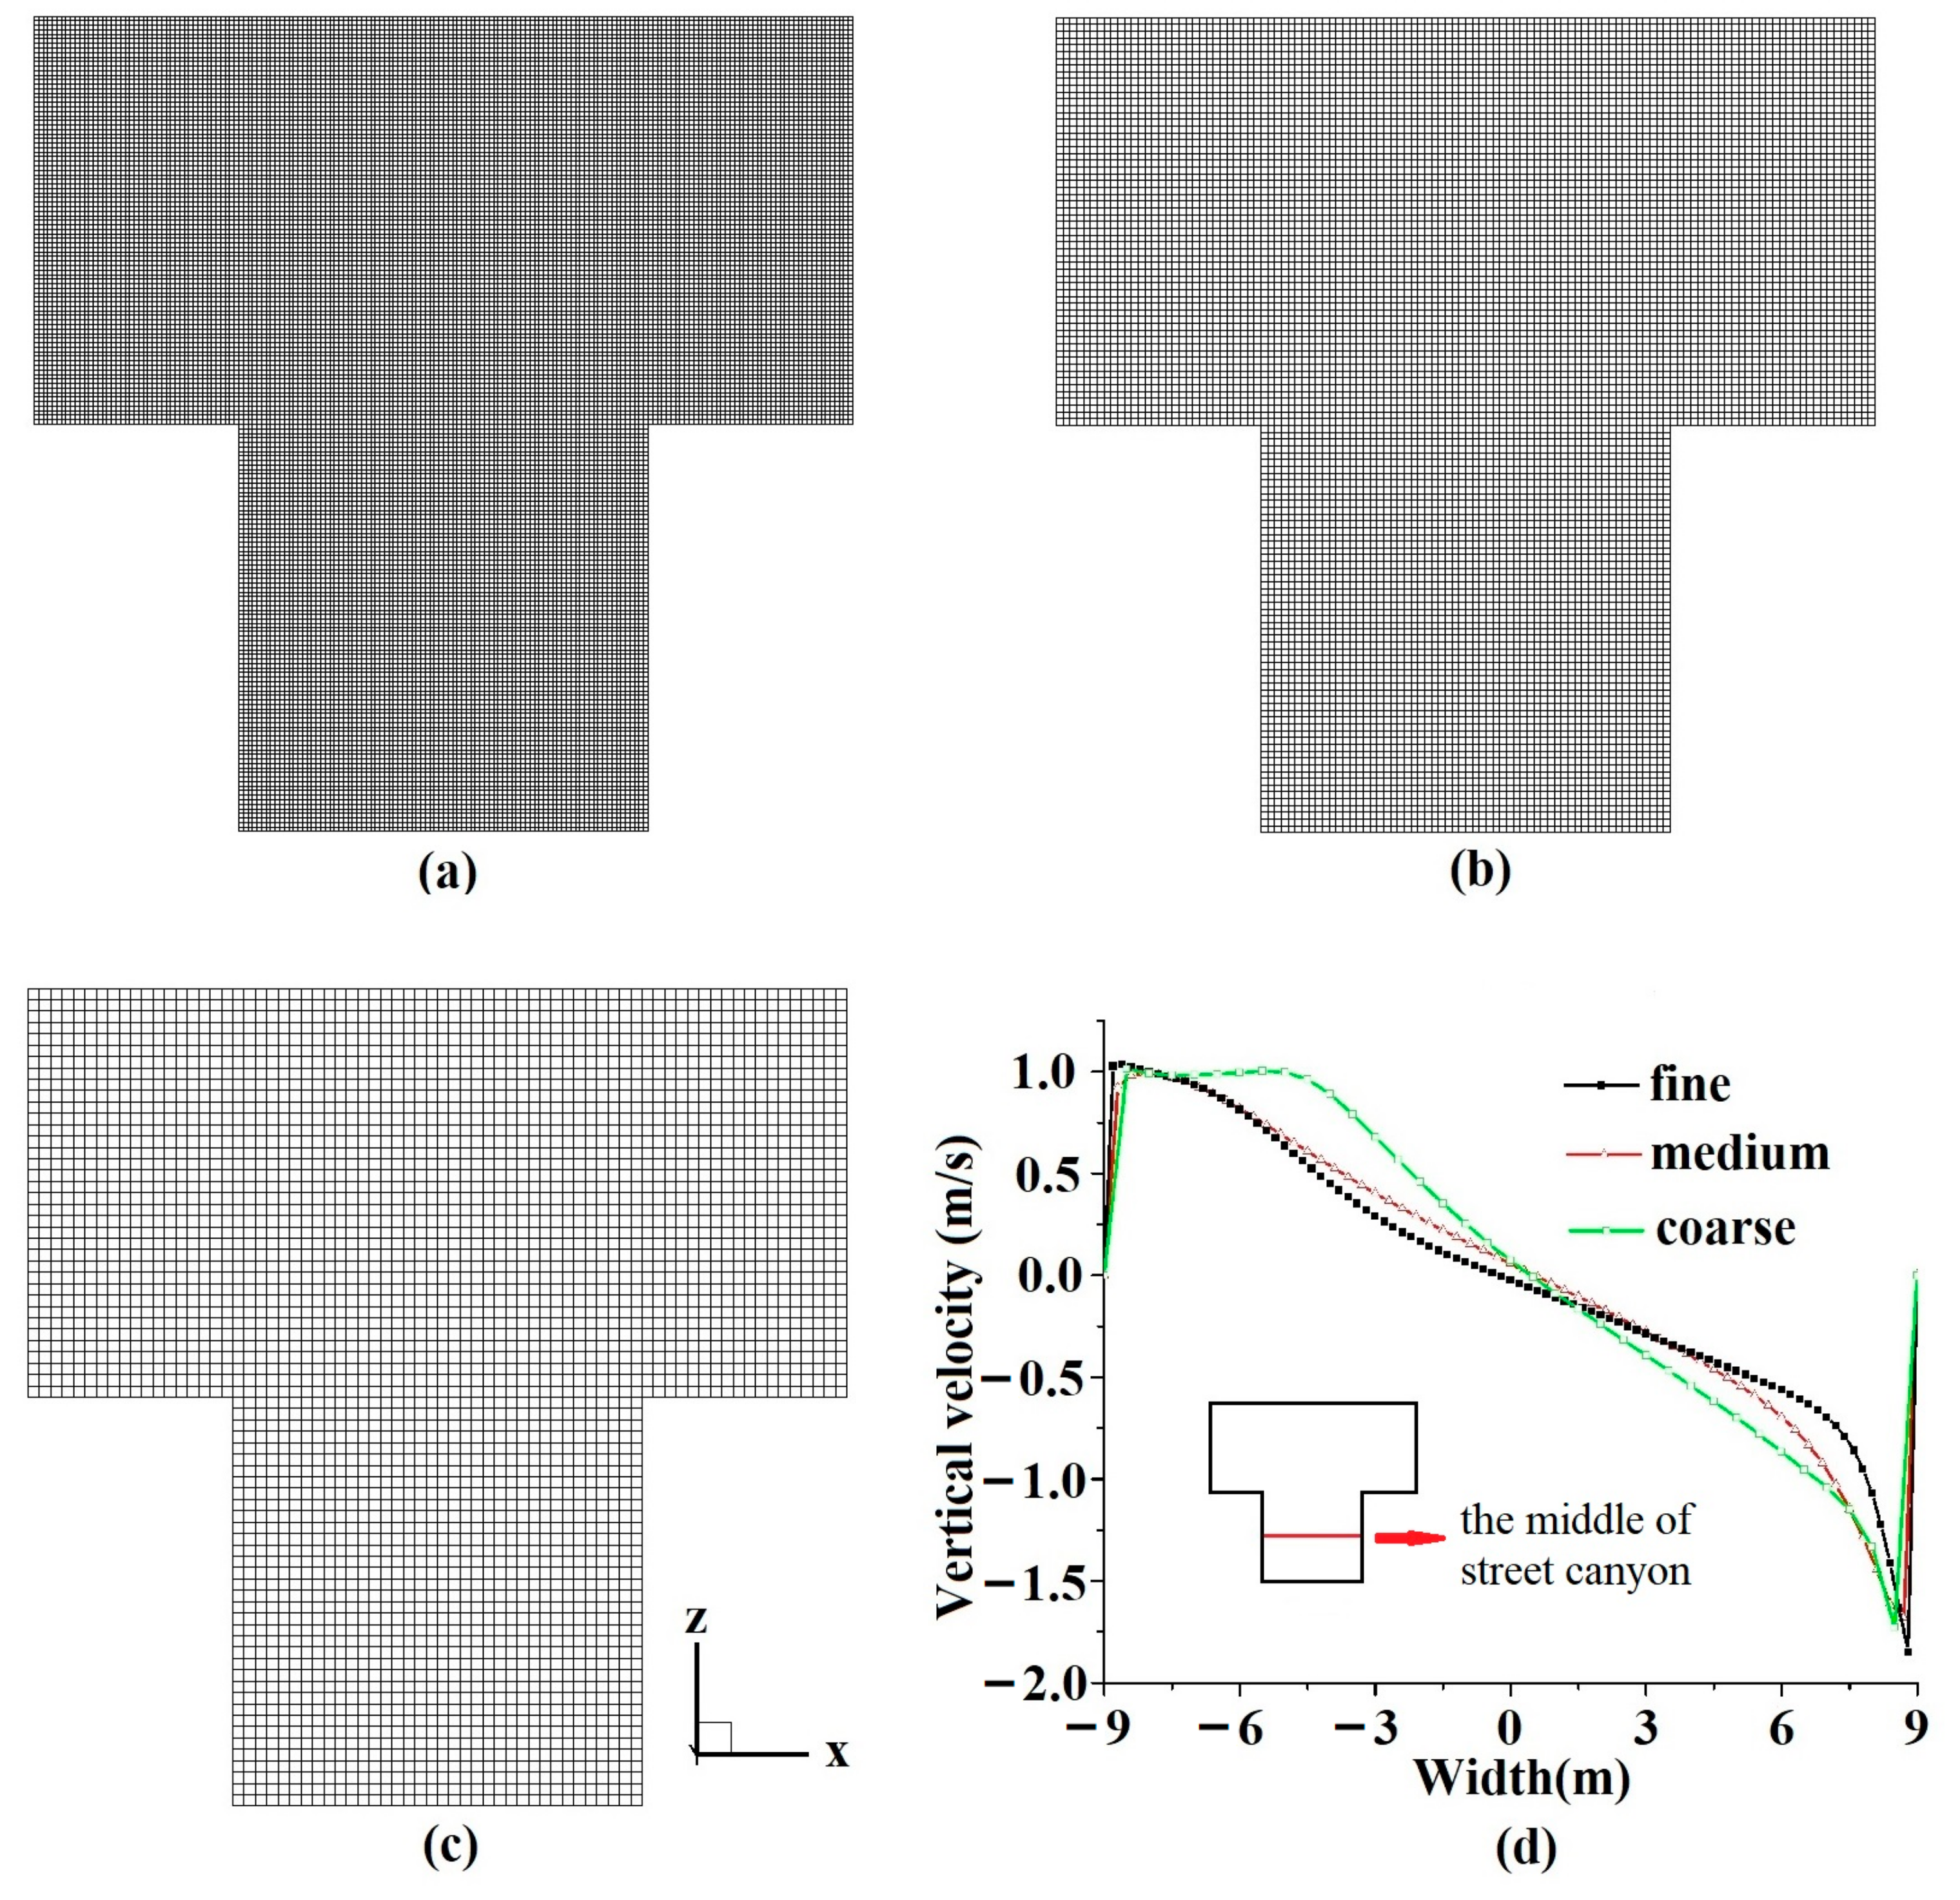
3.1. Mesh
3.2. Algorithm and Boundary Condition
3.3. Case Setting
4. Verification
4.1. Mesh Independence Verification
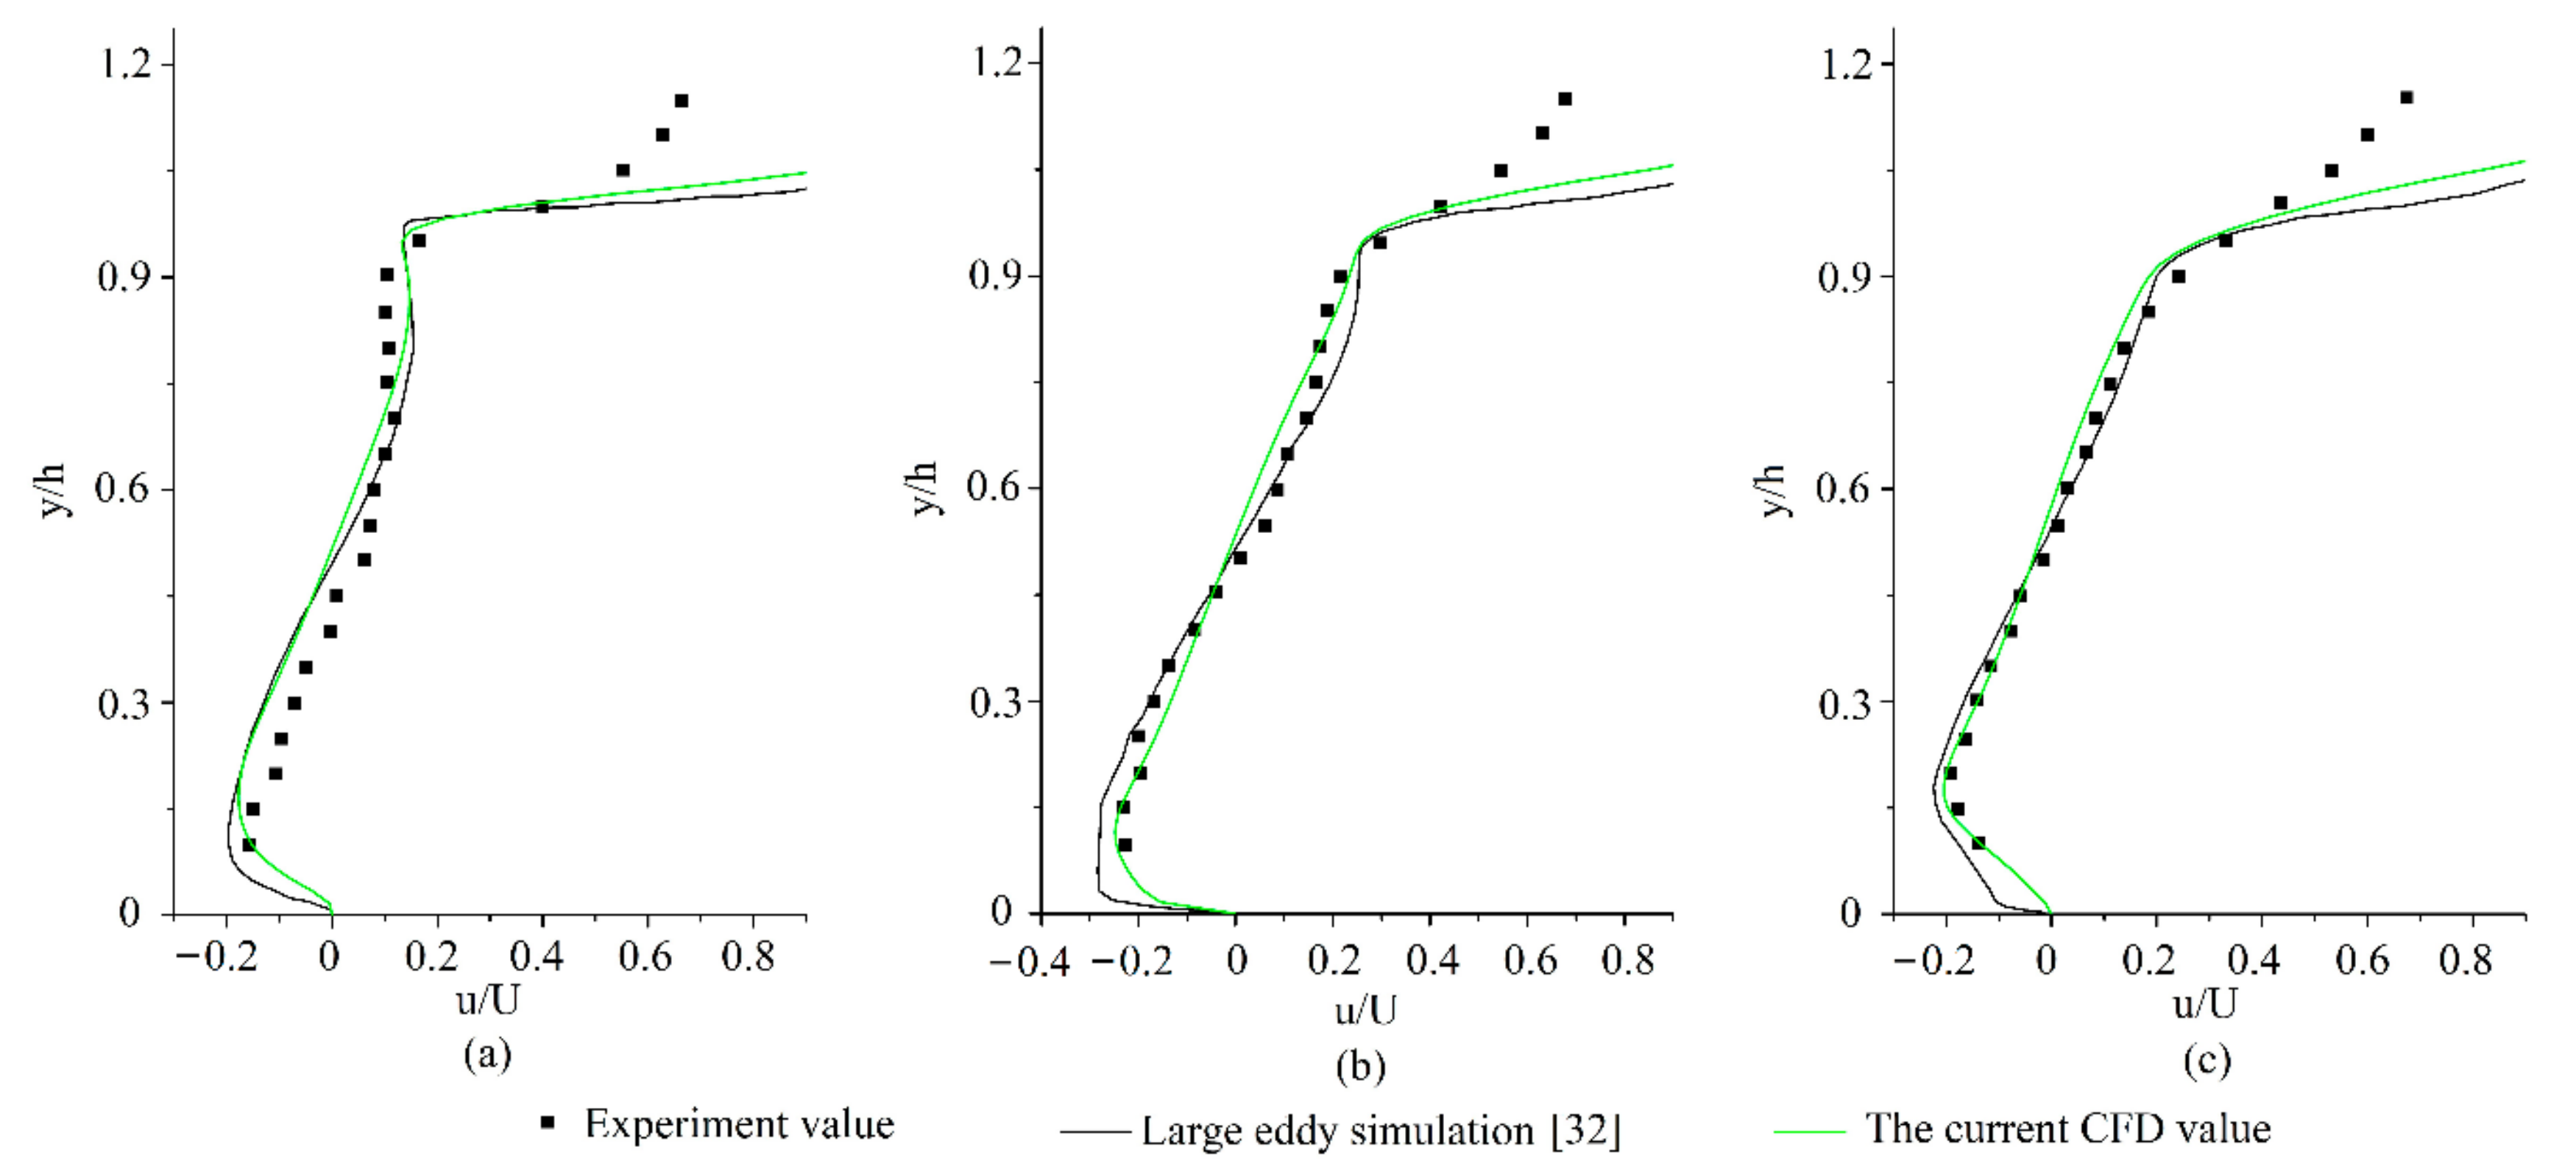
4.2. Velocity Verification
5. Result and Discussion
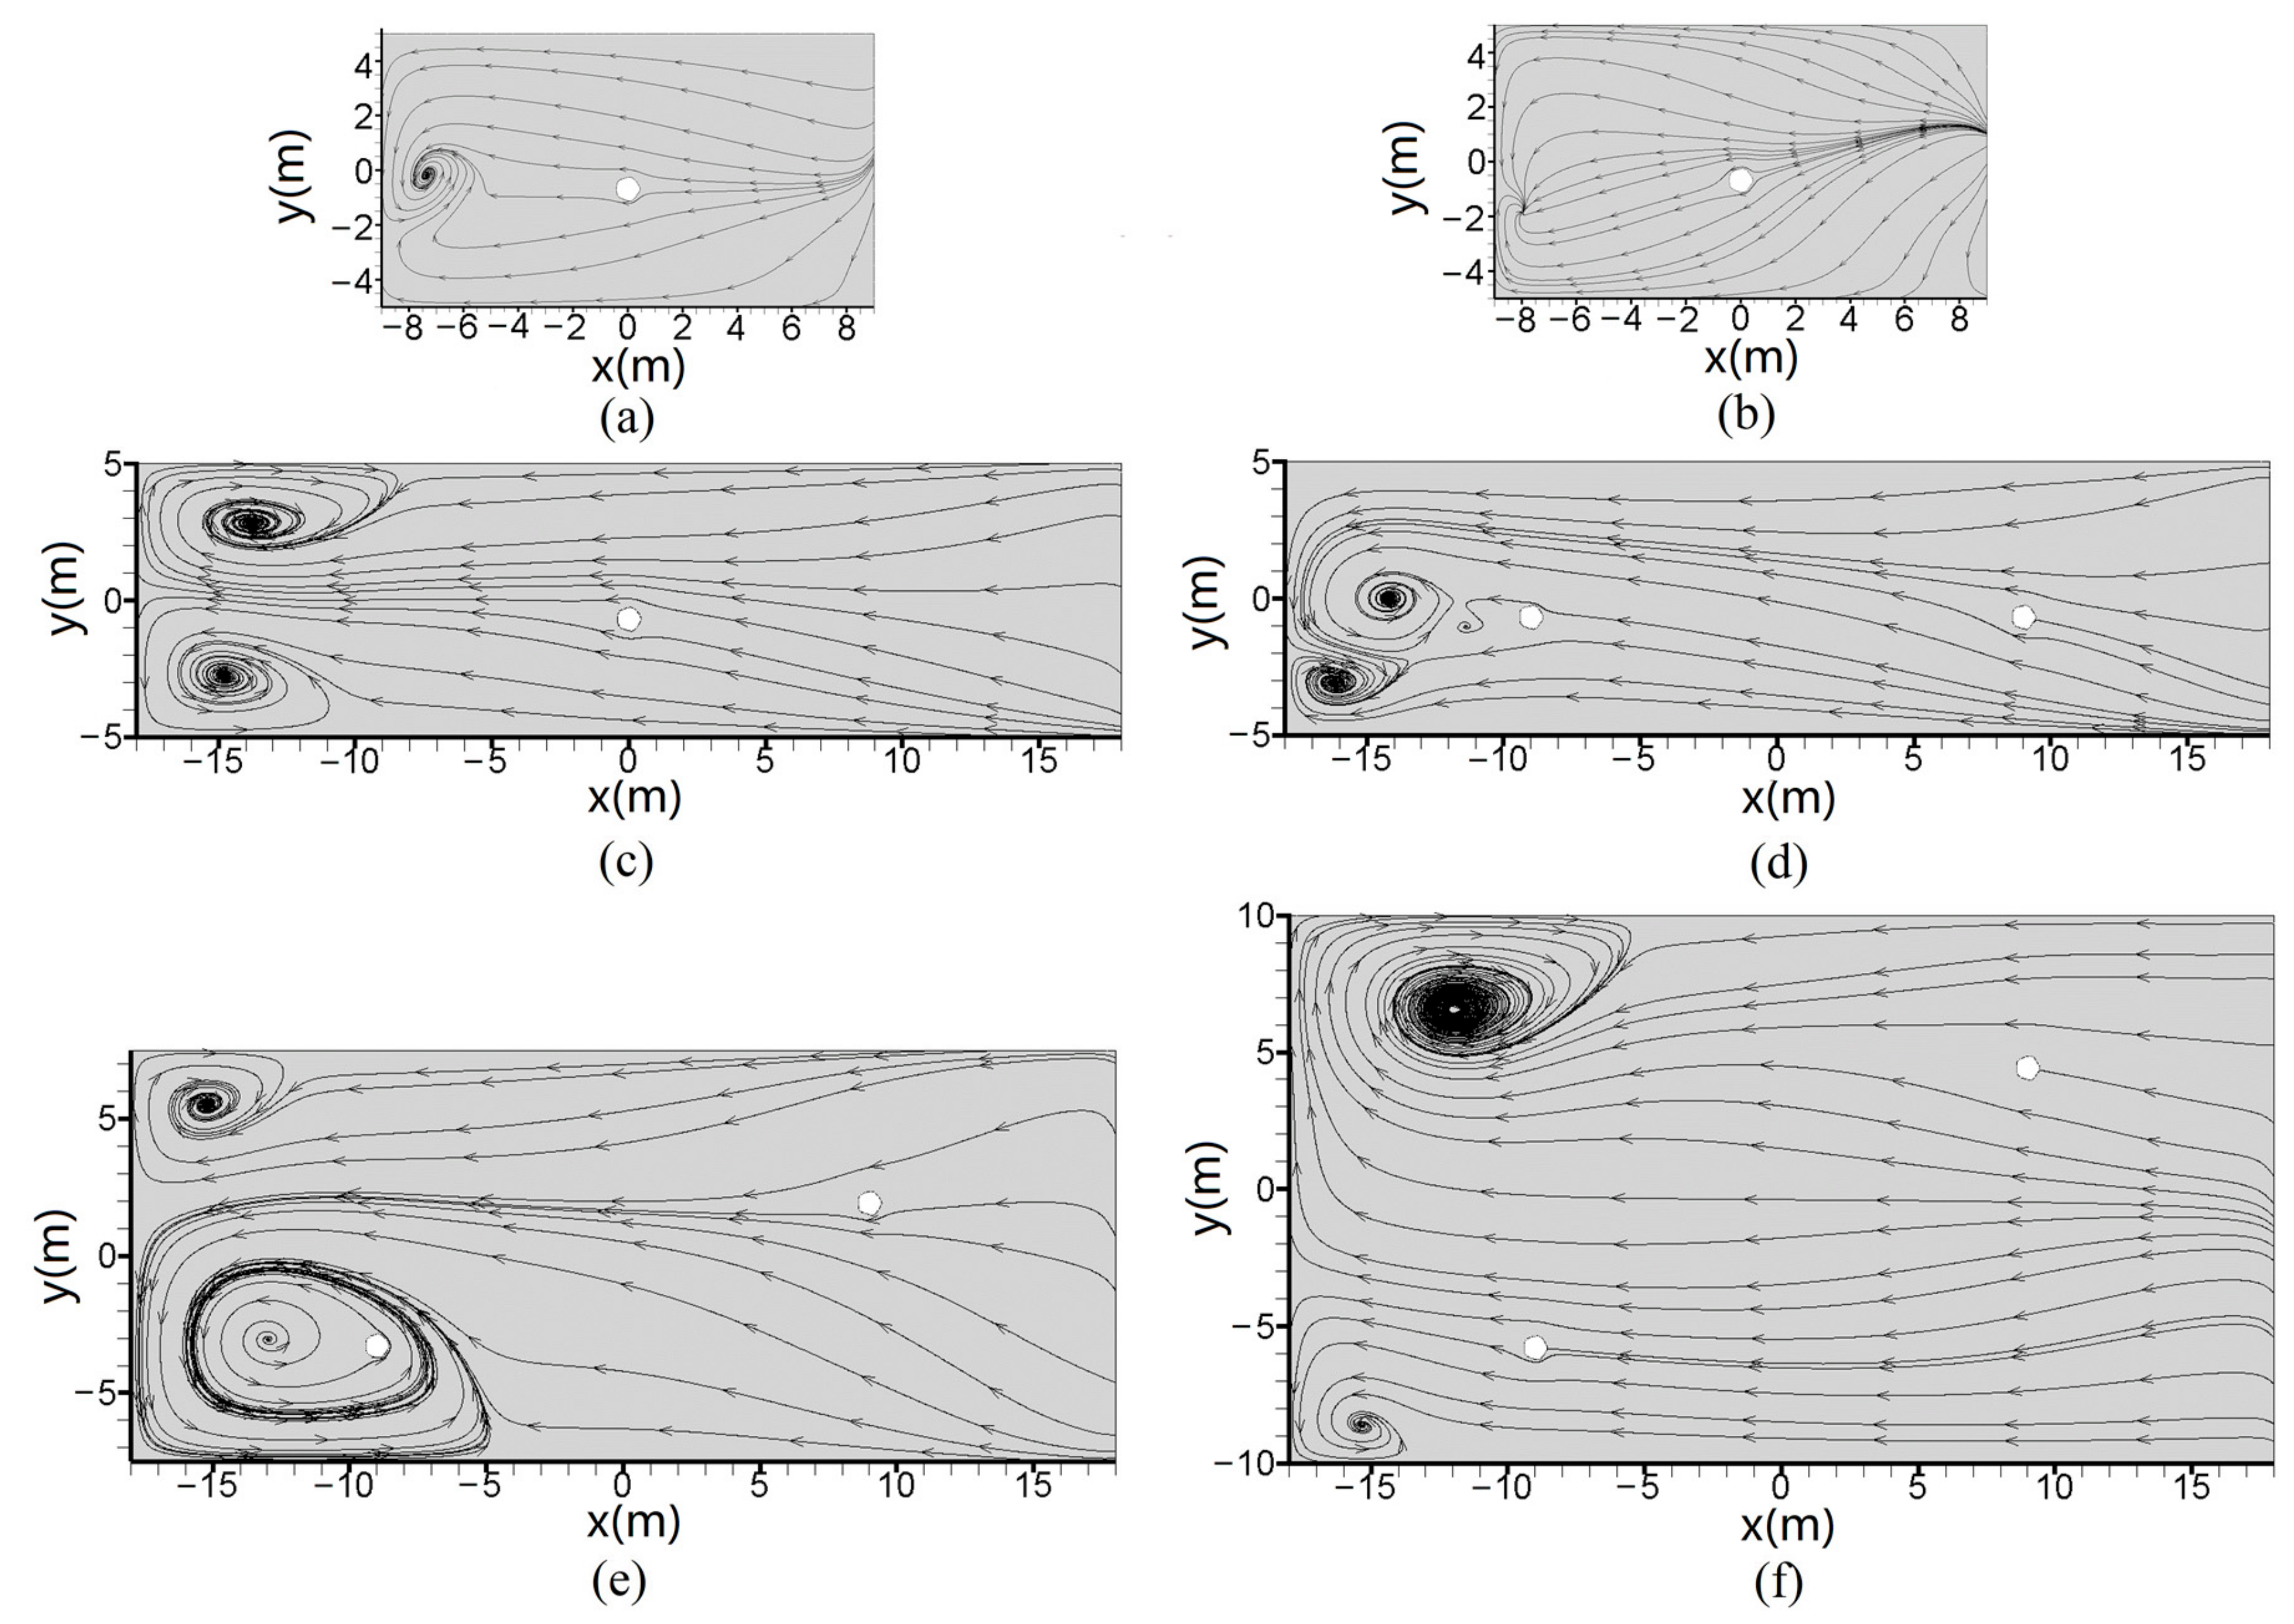
5.1. Flow Field
5.2. Velocity
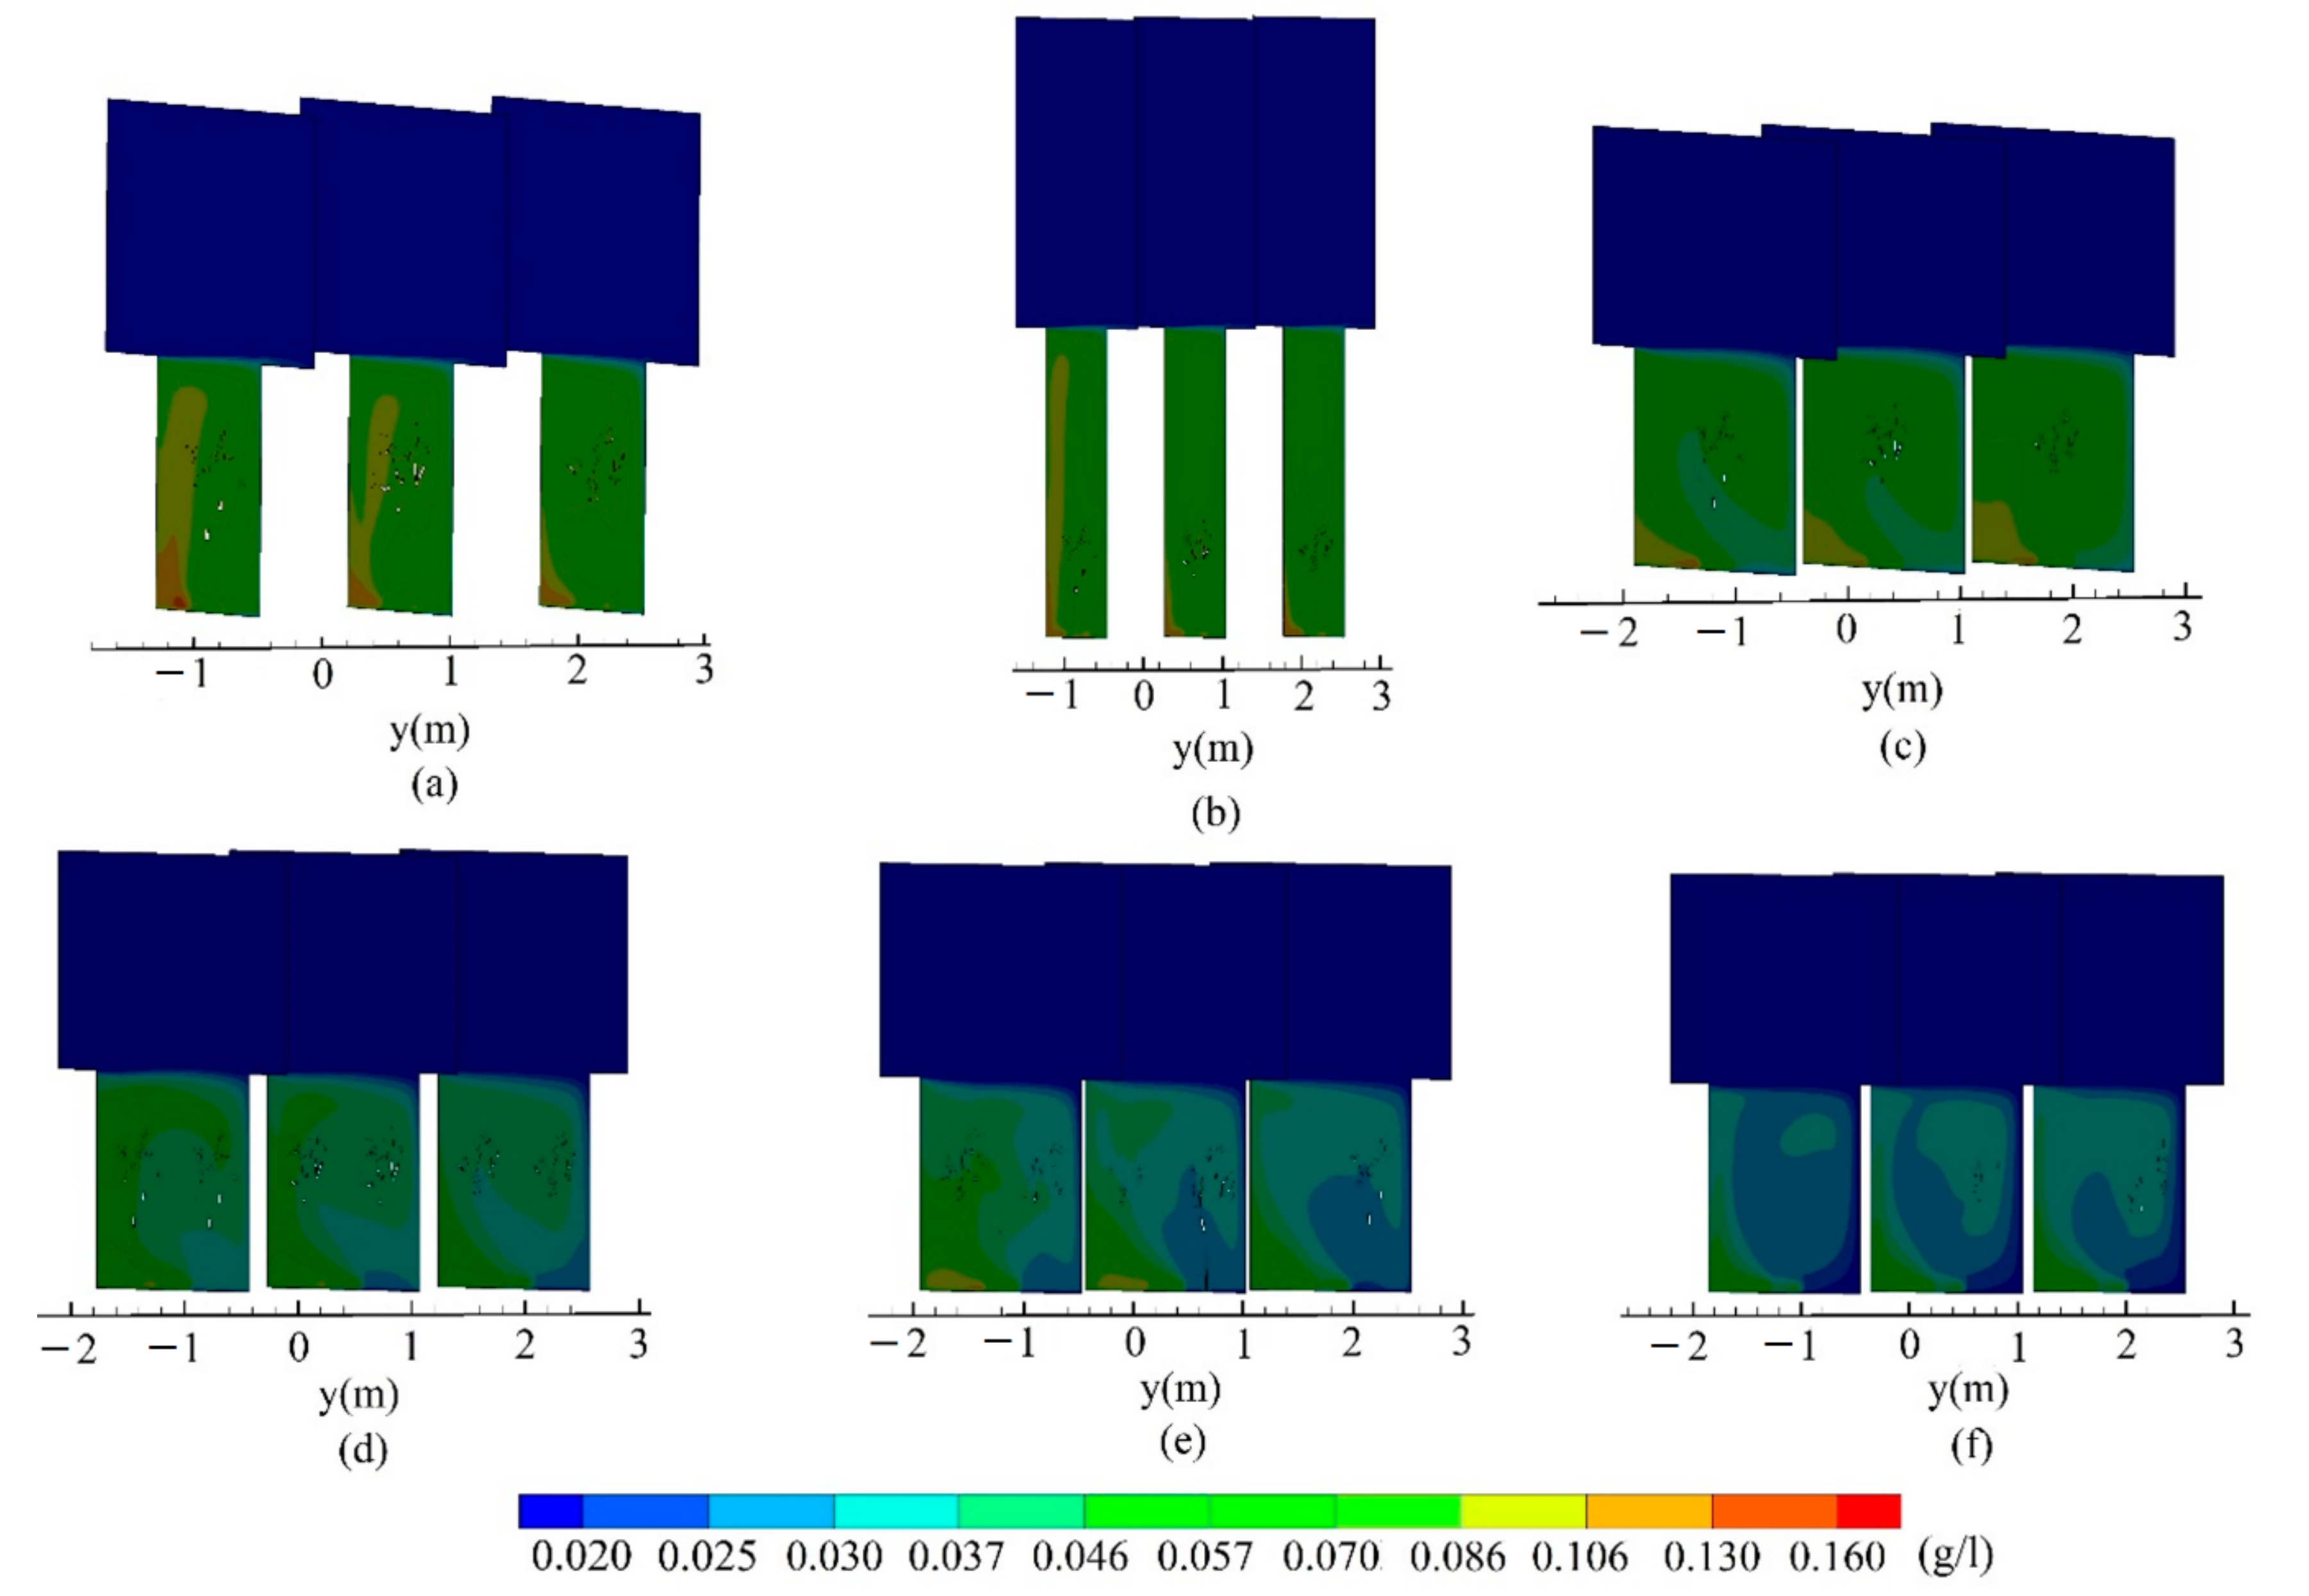
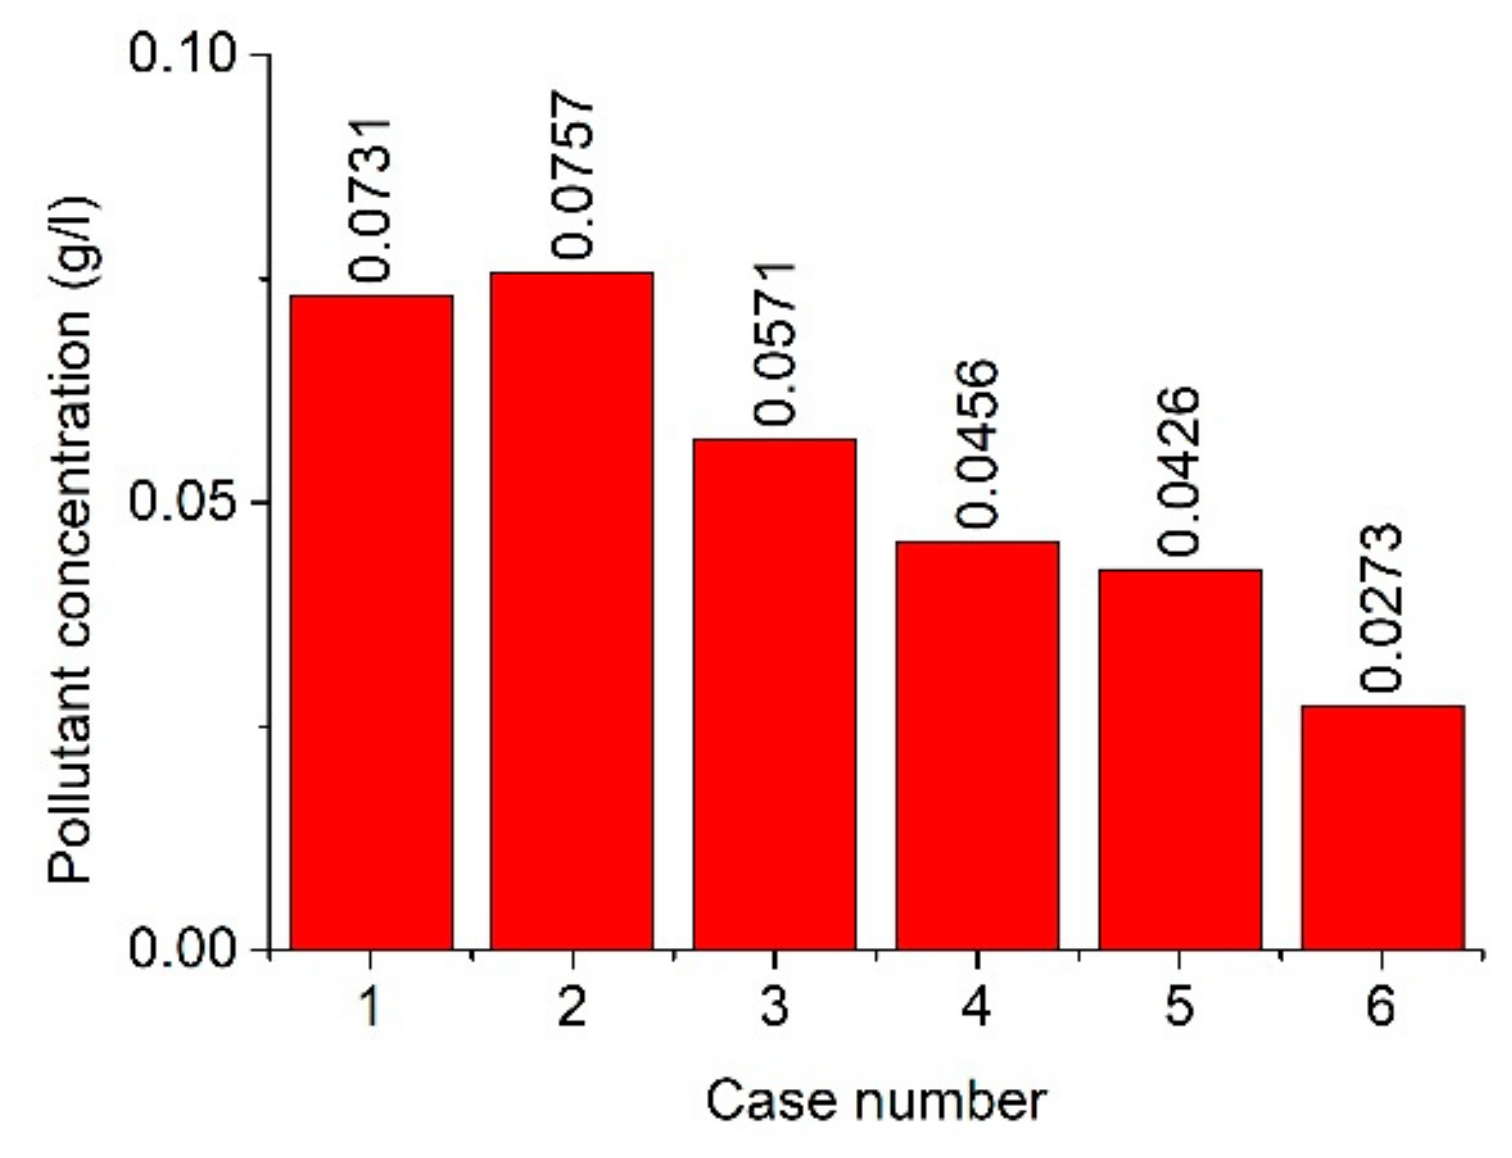
5.3. Pollutant
6. Conclusions
- (1)
- Due to the blocking effect of the tree, the flow field structure is relatively complicated in the street canyon. The height–width ratio of the street canyon does not affect the number of vortices in the street canyon, and the street canyon is controlled by a vortex. The air easily flows from the pore area between the two trees due to difference in tree spacing.
- (2)
- The discontinuous low-velocity area appears around the tree canopy and the trunk at the bottom of the street canyon. The low-velocity area in the deep street canyon is thin and long, and the low-velocity area in the wide street canyon is like the windward side. Influenced by the spacing between two trees, the velocity is lower around and between two tree canopies.
- (3)
- The tree canopy and trunk are anisotropic, such that the pollutants distribute unevenly in the y-axis direction in the street canyon. At pedestrian height, the high pollutant concentration distribution constantly changes on both sides of the leeward side of the street canyon due to the height–width ratio of the street canyon and the layout of trees. The street canyon has a low average pollutant concentration at large y-axis direction spacing between two trees.
Author Contributions
Funding
Conflicts of Interest
References
- Buccolieri, R.; Santiago, J.L.; Rivas, E.; Sanchez, B. Review on urban tree modelling in CFD simulations: Aerodynamic, deposition and thermal effects. Urban For. Urban Gree. 2018, 31, 212–220. [Google Scholar] [CrossRef]
- Chen, L.; Liu, C.; Zhang, L.; Zou, R.; Zhang, Z. Variation in Tree Species Ability to Capture and Retain Airborne Fine Particulate Matter (PM2.5). Sci. Rep. UK 2017, 7, 3206. [Google Scholar] [CrossRef] [PubMed]
- Hefny Salim, M.; Heinke Schlünzen, K.; Grawe, D. Including trees in the numerical simulations of the wind flow in urban areas: Should we care? J. Wind Eng. Ind. Aerod. 2015, 144, 84–95. [Google Scholar] [CrossRef]
- Gromke, C.; Ruck, B. Influence of trees on the dispersion of pollutants in an urban street canyon—Experimental investigation of the flow and concentration field. Atmos. Environ. 2007, 41, 3287–3302. [Google Scholar] [CrossRef]
- Gromke, C.; Buccolieri, R.; Sabatino, S.D.; Ruck, B. Dispersion study in a street canyon with tree planting by means of wind tunnel and numerical investigations evaluation of CFD data with experimental data. Atmos. Environ. 2008, 42, 8640–8650. [Google Scholar] [CrossRef]
- Buccolieri, R.; Gromke, C.; Sabatino, S.D.; Ruck, B. Aerodynamic effects of trees on pollutant concentration in street canyons. Sci. Total Environ. 2009, 407, 5247–5256. [Google Scholar] [CrossRef]
- Gromke, C.; Ruck, B. Pollutant concentrations in street canyons of different aspect ratio with avenues of trees for various wind directions. Bound-Lay. Meteorol. 2012, 144, 41–64. [Google Scholar] [CrossRef]
- Sun, D.; Zhang, Y. Influence of avenue trees on traffic pollutant dispersion in asymmetric street canyons: Numerical modeling with empirical analysis. Transport Res. D-Transp. Environ. 2018, 65, 784–795. [Google Scholar] [CrossRef]
- Huang, Y.D.; Li, M.Z.; Ren, S.Q.; Wang, M.J.; Cui, P.Y. Impacts of tree-Planting pattern and trunk height on the airflow and pollutant dispersion inside a street canyon. Build. Environ. 2019, 165, 106385. [Google Scholar] [CrossRef]
- Wang, C.H.; Li, Q.; Wang, Z.H. Quantifying the impact of urban trees on passive pollutant dispersion using a coupled large-Eddy simulation–Lagrangian stochastic model. Build. Environ. 2018, 145, 33–49. [Google Scholar] [CrossRef]
- Jeanjean, A.P.R.; Buccolieri, R.; Eddy, J.; Monks, P.; Leigh, R.J. Air quality affected by trees in real street canyons: The case of Marylebone neighbourhood in central London. Urban For. Urban Gree. 2017, 22, 41–53. [Google Scholar] [CrossRef]
- Hong, B.; Qin, H.; Lin, B. Prediction of wind environment and indoor/outdoor relationships for PM2.5 in different building-Tree grouping patterns. Atmos.-Basel 2018, 9, 39. [Google Scholar] [CrossRef]
- Gu, Z.L.; Zhang, Y.W.; Lei, K.B. Large eddy simulation of flow in a street canyon with tree planting under various atmospheric instability conditions. Sci. China Technol. Sci. 2010, 53, 1928–1937. [Google Scholar] [CrossRef]
- Wang, Z.H. Monte Carlo simulations of radiative heat exchange in a street canyon with trees. Sol. Energy 2014, 110, 704–713. [Google Scholar] [CrossRef]
- Merlier, L.; Jacob, J.; Sagaut, P. Lattice-Boltzmann Large-Eddy Simulation of pollutant dispersion in street canyons including tree planting effects. Atmos. Environ. 2018, 195, 89–103. [Google Scholar] [CrossRef]
- Mcnabola, A.; Broderick, B.M.; Gill, L.W. A numerical investigation of the impact of low boundary walls on pedestrian exposure to air pollutants in urban street canyons. Sci. Total Environ. 2009, 407, 760–769. [Google Scholar] [CrossRef]
- Hao, C.R.; Xie, X.M.; Huang, Y.; Zhen, H. Study on influence of viaduct and noise barriers on the particulate matter dispersion in street canyons by CFD modeling. Atmos. Pollut. Res. 2019, 10, 1723–1735. [Google Scholar] [CrossRef]
- Murena, F.; Mele, B. Effect of balconies on air quality in deep street canyons. Atmos. Pollut. Res. 2016, 7, 1004–1012. [Google Scholar] [CrossRef]
- Hong, S.W.; Zhao, L.; Zhu, H. CFD simulation of airflow inside tree canopies discharged from air-Assisted sprayers. Comput. Electron. Agric. 2018, 149, 121–132. [Google Scholar] [CrossRef]
- Zhang, K.; Chen, G.; Wang, X.; Liu, S.; Mak, C.M.; Fan, Y.; Hang, J. Numerical evaluations of urban design technique to reduce vehicular personal intake fraction in deep street canyons. Sci. Total Environ. 2019, 653, 968–994. [Google Scholar] [CrossRef]
- Amorim, J.H.; Rodrigues, V.; Tavares, R.; Valente, J.; Borrego, C. CFD modelling of the aerodynamic effect of trees on urban air pollution dispersion. Sci. Total Environ. 2013, 461–462, 541–551. [Google Scholar] [CrossRef] [PubMed]
- Su, J.W.; Wang, L.; Gu, Z.L.; Song, M.M.; Cao, Z.R. Effects of real trees and their structure on pollutant dispersion and flow field in an idealized street canyon. Atmos. Pollut. Res. 2019, 10, 1699–1710. [Google Scholar] [CrossRef]
- OpenCFD. OpenFOAM. 2011. Available online: www.openfoam.com (accessed on 8 June 2019).
- Wang, L.; Su, J.W.; Gu, Z.L.; Tang, L.Y. Numerical Study on Flow Field and Pollutant Dispersion in an Ideal Street Canyon within a Real Tree Model at Different Wind Velocities. Comput. Math. Appl. 2020. [Google Scholar] [CrossRef]
- Crank, J.; Phyllis, N. A practical method for numerical evaluation of solutions of partial differential equations of the heat-Conduction type. Math. Proc. Camb. Philos. Soc. 1947, 43, 50–67. [Google Scholar] [CrossRef]
- Jasak, H. Error Analysis and Estimation for the Finite Volume Method with Application to Fluid Flow; Imperial College London: London, UK, 1996. [Google Scholar]
- Patankar, S.V.; Spalding, D.B. A calculation procedure for heat, mass and momentum transfer in three-Dimensional parabolic flows. Int. J. Heat Mass Tran. 1972, 15, 1787–1806. [Google Scholar] [CrossRef]
- Patankar, S. Numerical Heat Transfer and Fluid Flow; Hemisohere Publishing Corporation: Washington, DC, USA, 1980; pp. 131–134. [Google Scholar]
- Li, W.; He, Y.; Zhang, Y.; Su, J.W.; Chen, C.G.; Chuck, W.Y.; Zhang, R.J.; Gu, Z.L. LES simulation of flow field and pollutant dispersion in a street canyon under time-varying inflows with TimeVarying-SIMPLE approach. Build. Environ. 2019, 157, 185–196. [Google Scholar] [CrossRef]
- Kastner-Klein, P.; Plate, E.J. Wind-Tunnel study of concentration fields in street canyons. Atmos. Environ. 1999, 33, 3973–3979. [Google Scholar] [CrossRef]
- Li, X.X.; Leung, D.Y.C.; Liu, C.H.; Lam, K.M. Physical modeling of flow field inside urban street canyons. J. Appl. Meteorol. Clim. 2008, 47, 2058–2067. [Google Scholar] [CrossRef]
- Liu, C.H.; Barth, M.C.; Leung, D.Y.C. Large-eddy simulation of flow and pollutant transport in street canyons of different building-height-to-street width ratios. J. Appl. Meteorol. Clim. 2004, 43, 1410–1424. [Google Scholar] [CrossRef]


| Tree Number | H (m) | W1 (m) | W2 (m) | L (m) | H/W1 | Aim | |
|---|---|---|---|---|---|---|---|
| Case 1 | 1 | 18 | 18 | 36 | 10 | 1 | Height-width-ratio |
| Case2 | 1 | 36 | 18 | 36 | 10 | 2 | |
| Case3 | 1 | 18 | 36 | 54 | 10 | 0.5 | |
| Case 4 | 2 | 18 | 36 | 54 | 10 | 0.5 | Tree layout |
| Case 5 | 2 (distance 5 m) | 18 | 36 | 54 | 15 | 0.5 | |
| Case 6 | 2 (distance 10 m) | 18 | 36 | 54 | 20 | 0.5 |
© 2020 by the authors. Licensee MDPI, Basel, Switzerland. This article is an open access article distributed under the terms and conditions of the Creative Commons Attribution (CC BY) license (http://creativecommons.org/licenses/by/4.0/).
Share and Cite
Wang, L.; Su, J.; Gu, Z.; Shui, Q. Effect of Street Canyon Shape and Tree Layout on Pollutant Diffusion under Real Tree Model. Sustainability 2020, 12, 2105. https://doi.org/10.3390/su12052105
Wang L, Su J, Gu Z, Shui Q. Effect of Street Canyon Shape and Tree Layout on Pollutant Diffusion under Real Tree Model. Sustainability. 2020; 12(5):2105. https://doi.org/10.3390/su12052105
Chicago/Turabian StyleWang, Le, Junwei Su, Zhaolin Gu, and Qingxiang Shui. 2020. "Effect of Street Canyon Shape and Tree Layout on Pollutant Diffusion under Real Tree Model" Sustainability 12, no. 5: 2105. https://doi.org/10.3390/su12052105
APA StyleWang, L., Su, J., Gu, Z., & Shui, Q. (2020). Effect of Street Canyon Shape and Tree Layout on Pollutant Diffusion under Real Tree Model. Sustainability, 12(5), 2105. https://doi.org/10.3390/su12052105