Article

Effects of Contemporary Land Use Types and Conversions from Wetland to Paddy Field or Dry Land on Soil Organic Carbon Fractions

1
Environment Research Institute, Shandong University, Qingdao 266237, China
2
Ningxia Capital Sponge City Construction & development Co., Ltd, Guyuan 756000, China
3
Beijing Capital Co., Ltd, Beijing 100028, China
4
State Key Laboratory of Eco-hydraulics in Northwest Arid Region of China, Xi’an University of Technology, Xi’an 710048, China
*
Author to whom correspondence should be addressed.
Sustainability 2020, 12(5), 2094; https://doi.org/10.3390/su12052094
Submission received: 20 December 2019 / Revised: 29 February 2020 / Accepted: 7 March 2020 / Published: 9 March 2020
(This article belongs to the Section Sustainable Agriculture)

Abstract

:
Soil organic carbon (SOC) concentration is closely related to soil quality and climate change. The objectives of this study were to estimate the effects of contemporary land use on SOC concentrations at 0–20 cm depths, and to investigate the dynamics of SOC in paddy-field soil and dry-land soil after their conversion from natural wetlands (20 and 30 years ago). We investigated the dissolved organic carbon (DOC), light fraction organic carbon (LFOC), heavy fraction organic carbon (HFOC), and other soil properties (i.e., moisture content, bulk density, pH, clay, sand, silt, available phosphorous, light fraction nitrogen, and heavy fraction nitrogen) in natural wetlands, constructed wetlands, fishponds, paddy fields, and soybean fields. The results indicated that the content of DOC increased 17% in constructed wetland and decreased 39% in fishponds, and the content of HFOC in constructed wetland and fishponds increased 50% and 8%, respectively, compared with that in natural wetlands at 0–20 cm. After the conversion of a wetland, the content of HFOC increased 72% in the paddy fields and decreased 62% in the dry land, while the content of DOC and LFOC decreased in both types. In the paddy fields, LFOC and HFOC content in the topmost 0.2 m of the soil layer was significantly higher compared to the layer below (from 0.2 to 0.6 m), and there were no significant differences observed in the dry land. The findings suggest that the paddy fields can sequester organic carbon through the accumulation of HFOC. However, the HFOC content decreased 22% after 10 years of cultivation with the decrease of clay content, indicating that paddy fields need to favor clay accumulation for the purpose of enhancing carbon sequestration in the paddy fields.

1. Introduction

Fossil fuel combustion and land use change are the two main factors that lead to increased atmospheric carbon dioxide (CO2) concentrations [1]. Lal, [2] estimated that land use changes, including deforestation, conversion of natural ecosystems to agricultural land, drainage of wetlands, and soil cultivation, have contributed 78 ± 12 Pg of carbon (C) to the atmosphere. Besides, paddy soil is one of the most important anthropogenic sources of atmospheric methane (CH4) emission. Knox, Matthews, and Wassmann, [3] estimated that annual global CH4 emissions from paddy fields are about 10–26 Tg (CH4). Soil labile organic matter fractions perform a key role for the source and sink of CO2 and CH4 [4,5]. Dissolved organic carbon (DOC) is mainly composed of organic acids and water-soluble carbohydrates and is an important labile fraction of organic carbon (OC) as it is the main energy source for soil microorganisms [6]. DOC is regarded as a sensitivity index to measure the effects of land use on soil organic matter quality [7]. Based on the density of the soil organic carbon (SOC), light fraction organic carbon (LFOC) (density ≤ 1.7 g cm−3) and heavy fraction organic carbon (HFOC) (density ≥ 1.7 g cm−3) are separated [8]. LFOC consists of lipids, lignin monomers, dimers, and alky-aromatic compounds and mainly originates from partially decomposed plant debris and animal residues [9,10], which is representative of the active component of SOC [11,12]. HFOC forms as a collection of soil aggregates and particles, whose structure is complicated but relatively stable to external environmental conditions [13]. As reported by Freixo, Machado, Santos, et al. [14], HFOC can account for 78–96% of SOC.
Wetland ecosystems act as a significant reservoir of OC [15]. Compared with other terrestrial ecosystems, wetlands have the highest carbon storage per unit area, which is three times more than tropical forests [16]. More than 90% of the stocked carbon in wetland ecosystems is stored in the soil [17]. With their vast reserves of stored carbon, natural wetlands provide a potential sink by offsetting the release of atmospheric carbon [18]. However, due to climatic change and human interference, the natural wetlands are rapidly decreasing worldwide. Wetland reclamation is an essential way to obtain new land in the world, and this results in converted wetlands becoming a source of greenhouse gases (GHGs) [19]. Understanding the dynamics of SOC after wetland reclamation at different periods and depths is meaningful for estimating soil carbon accumulation. Satellite imagery was used to confirm the land-use history and was precise enough to monitor land-use changes or conversion over time [20]. In some studies, reclamation duration had positive effects on SOC accumulation [21,22,23,24]. In contrast, a decreasing trend of SOC concentrations was presented after reclamation in several studies [25,26]. Thus, further research is necessary to understand these differences.
The Nansi Lake, which is the largest freshwater lake in northern China, has experienced intensive reclamation over the past 30 years. During the early 1980s, the Nansi Lake comprised primarily of natural wetlands, with vegetation consisting mainly of reeds and lotus. Wetland drainage and utilization via conversion of the wetlands to farmland, freshwater fishponds, and building land have occurred since the 1980s. The area of marshes has decreased by 90% and that of tillage land increased by 72% from 1987 to 2018 [27]. In this study, the DOC, LFOC, and HFOC content was determined from the surface soil of the natural wetlands, constructed wetlands, fishponds, paddy fields, and dry land at Nansi Lake, China. We hypothesized that different SOC fractions in surface soil (0–20 cm) were affected by distinct land-use types. The objectives of this study were to (i) examine the effects of contemporary land types on the DOC, LFOC, and HFOC content and to (ii) investigate the influence of reclamation history and depths on the DOC, LFOC, and HFOC content in paddy-field soil and dry-land soil after their conversion from natural wetlands.

2. Materials and Methods

2.1. Study Area

The study was conducted at Nansi Lake, located in Jining City, Shandong Province, China (116°34′–117°21′ E, 34°27′–35°20′ N, Figure 1). The study area included Nanyang Lake, Dushan Lake, Zhaoyang Lake, and Weishan Lake, from north to south covering approximately 1266 km2 with an average water depth of 1.5 m. The locations have identical climates, classified as temperate monsoon with a mean annual precipitation of 700 mm. The mean annual maximum and minimum temperatures vary from 26.8 °C in July to −1.7 °C in January [28]. The primary soil types in Nansi Lake are Fluventic Ustochrept, Ustalf, Vertisols (United States Department of Agriculture soil taxonomy). Land-use types in the study were divided into natural wetland (NW), constructed wetland (CW), dry land (DL), paddy fields (PF), and fishponds (FP). The natural wetland represented an ecosystem that is undisturbed by anthropic activities, where reed (Phragmites australis) was the prevailing vegetation. The constructed wetland in the study area is the Xinxue River Constructed Wetland. The Xinxue River is one of the tributaries of Weishan Lake and the downstream section of it was utilized for the fishponds and converted into the Xinxue River Constructed Wetland in 2007 to control the pollution of the domestic sewage and industrial wastewater of cities [29]. The dominate wetland vegetation species in the Xinxue River Constructed Wetland are Phragmites australis, Arundo donax, Nelumbo nucifera, Typha orientalis and Alternanthera philoxeroides. The studied cropland was converted from natural wetlands. The initial clearing of reed was performed by slashing and burning. All fields were prepared for cropping by means of moldboard plow harrowing to a depth of 15–20 cm. Crop rotation was practiced in the dry land and paddy fields. At the dry-land site, soybeans (Glycine max) were planted each year in July and harvested in September, the residues were left on the ground and incorporated into the soil, then the winter wheat (Triticum aestivum) was cropped. Chemical fertilizers were rarely used in soybean fields. Urea, phosphorus pentoxide (P2O5), and potassium oxide (K2O) were used to fertilize the wheat land. The paddy fields were used for rice (Oryza sativa) cultivation in summer and wheat (Triticum aestivum) in winter. Chemical fertilizers including (NH4)2HPO4 and urea were applied in the paddy fields. Pesticides such as methamidophos, dimehypo, and imidacloprid were applied in the paddy, soybean, and wheat fields. The freshwater fishponds were used for aquaculture, including crab and crayfish (Procambarus clarkii) and various species of freshwater fish.

2.2. Soil Sampling and Analysis

Soil sampling was conducted during July 2018. Eight replicated plots were established at each type of land use for soil sampling. At each sample site, the litter was removed and three soil cores (4.8 cm diameter) from topsoil (0–20 cm) were taken by a soil sampler within a 5 m radius and composited into one sample. To account for the effects of factors other than time on soil properties, the dry-land site and the paddy-field site from the same reclamation year were adjacent to each other. Land-use history was confirmed using satellite imagery (Landsat MSS/TM/OLI) and by reviewing local historical documents. Satellite imagery that was available for the study area was obtained from the United States Geological Survey, the Geospatial Data Cloud, and the University of Maryland [30]. Soil samples were collected from dry land that had been converted from natural wetlands to dry land 20 years ago (DL-20y) and 30 years ago (DL-30y). Soil samples were collected from paddy fields that had been converted from natural wetlands to paddy fields 20 years ago (PF-20y) and 30 years ago (PF-30y). To study the effects of long-term cultivation on SOC at different depths, the DL-30y and PF-30y sites were selected. We dug out soil to a 60 cm depth and collected samples along the soil vertical profile (0–20, 20–40, and 40–60 cm). A total of fifty-six soil samples were collected. Each of the soil samples were split up into two subsamples. One subsample was stored at 4 °C for DOC analysis. The other sample was later air-dried for LFOC, HFOC, and other soil property analyses.
All samples were passed through a 2 mm sieve to remove coarse debris for DOC analysis. The dissolved organic carbon (DOC) was determined using the methodology of Jones and Willett [31] and Dittmar, Koch, Hertkorn et al. [32]. Soil samples (10.00 g) were mixed with potassium chloride (2 M, 50 mL), and then shaken for 1 h at 20 °C. All the supernate was filtered through a 0.45-μm filter into separate vials. The concentration of DOC was measured by a total-C analyzer (TOC-L CPN, Shimadzu, Japan) using a non-purgeable OC analysis procedure. To estimate HFOC and LFOC for different land uses, soil samples were measured using the modified gravity method [11,33]. All samples were air-dried and sieved through a 0.9 mm mesh. In this way, we could enlarge the specific surface area of soil samples, which made them get a better contact with the reagents. Soil samples were separated into light fractions (LF) and heavy fractions (HF) utilizing a 1.70 g mL−1 sodium iodide solution. The LF was filtered into 0.043 mm brass sieves, and then the LF was washed using calcium chloride solution and distilled water. The HF was washed 6 times by adding calcium chloride solution and distilled water until all I reactions ceased. The content of LFOC and HFOC was examined by an elemental analyzer (Vario EL III, Elementar Analysensysteme, Germany). At the same time, the content of light fraction nitrogen (LF-N) and heavy fraction nitrogen (HF-N) was also obtained. To obtain the bulk density and moisture content, we collected soil cores at the same site using a 97 cm3 cylinder. The samples were oven-dried at 105 °C until a constant weight was achieved, and the bulk density was calculated according to the standard procedures described in the work of Anderson and Ingram [34]. Available phosphorous (AP) was extracted with 0.5 M NaHCO3 and examined by colorimetry. Soil texture, including the percentages of clay, sand, and silt fractions was measured using a modified micro-pipette method with 0.5 M sodium hexametaphosphate solution as a dispersant [35]. The values of pH were determined by the suspension of 4 g soil powder in 10 mL deionized water using a glass electrode.

2.3. Data Analysis

SPSS (version 23.0) was used to calculate descriptive statistics, including the mean and standard deviation (SD). The Kruskal-Wallis test was utilized as a non-parametric method to detect significant differences between DOC, LFOC, HFOC, and other soil characteristics, i.e., the moisture content, bulk density, pH, clay, sand, silt, available phosphorous, LF-N, and HF-N. Redundancy analysis (RDA) was utilized to explore the impact of soil properties on DOC, LFOC, and HFOC concentrations. Pearson correlation analysis was implemented to determine the possible relationships among DOC, LFOC, HFOC, and some soil properties, i.e., the moisture content, bulk density, pH, clay, sand, silt, available phosphorous, LF-N, and HF-N. Origin 9, ArcGIS 10.2, and CanoDraw 4.14 were used to draw the figures.

3. Results

3.1. Soil Organic Carbon Content in Different Land-Use Types

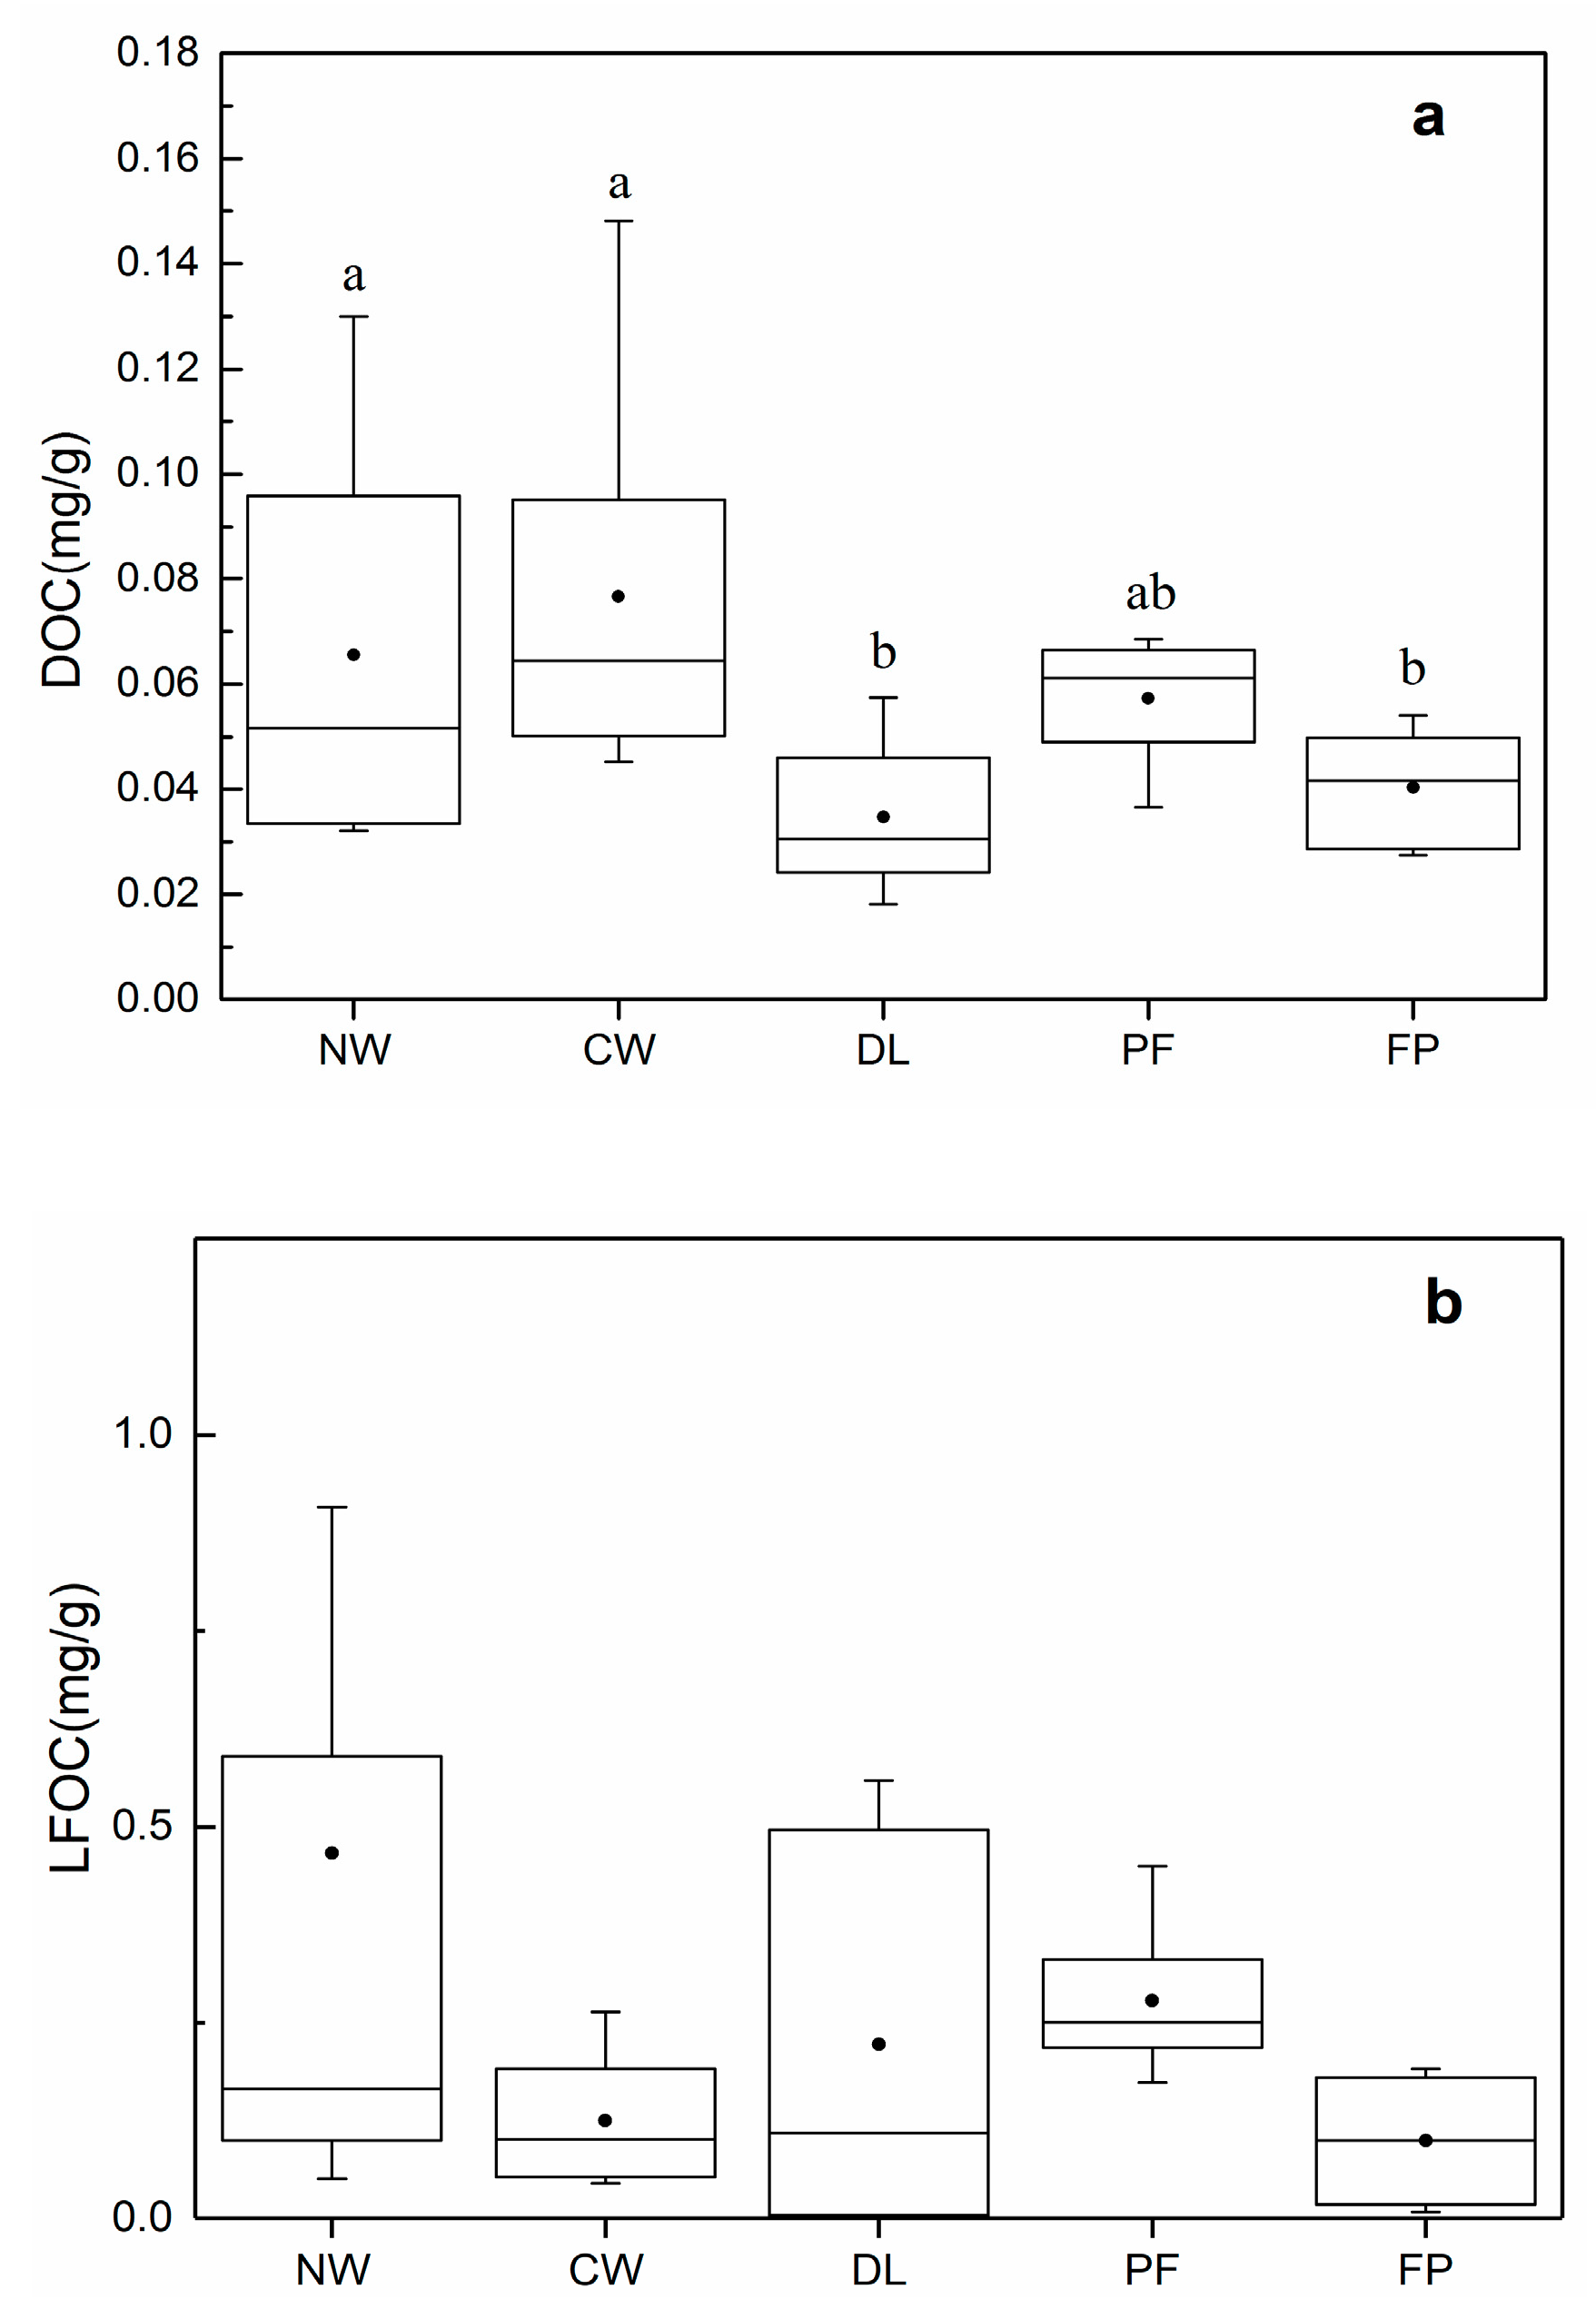
Long-term cultivation has strongly changed the DOC and HFOC content (p < 0.05) compared with the natural wetlands (Figure 2a,c). The dry land (0.035 ± 0.01), paddy fields (0.057 ± 0.01), and fishponds (0.041 ± 0.01) showed a decrease of about 47%, 13%, and 39% of DOC, respectively, while in the constructed wetland (0.077 ± 0.04) the DOC content increased by 17%. For the mean HFOC, the constructed wetland (17.64 ± 6.16), paddy fields (20.26 ± 3.63), and fishponds (12.78 ± 3.86) showed an increase of approximately 50%, 72%, and 8%, respectively, whereas the dry land (4.51 ± 1.48) showed a decrease of 62%. Although the LFOC content was not significantly different across the soil types (p = 0.08), the average content of LFOC decreased by about 61% compared with the natural wetland (Figure 2b).

3.2. Soil Organic Carbon in Different Soil Depths and Reclamation Histories

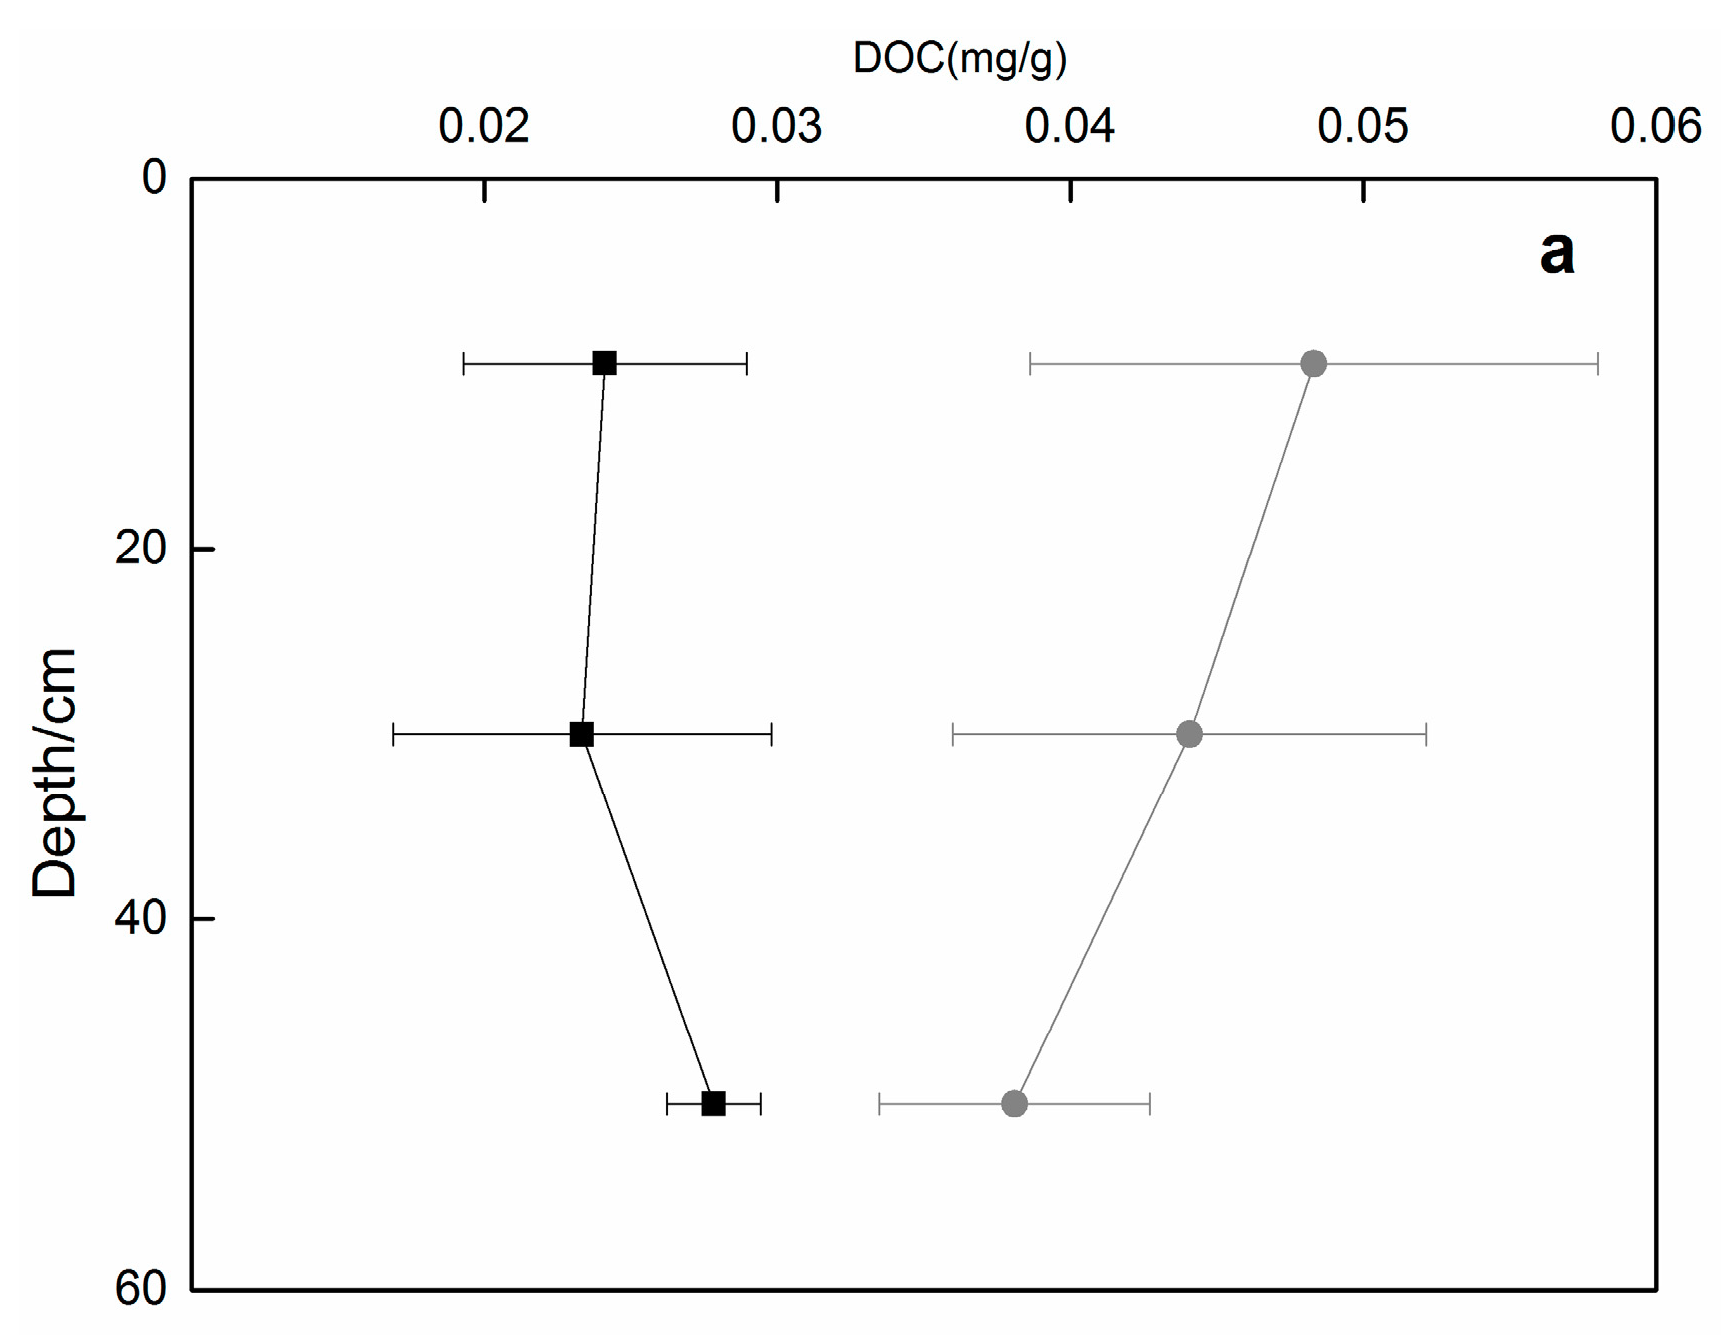
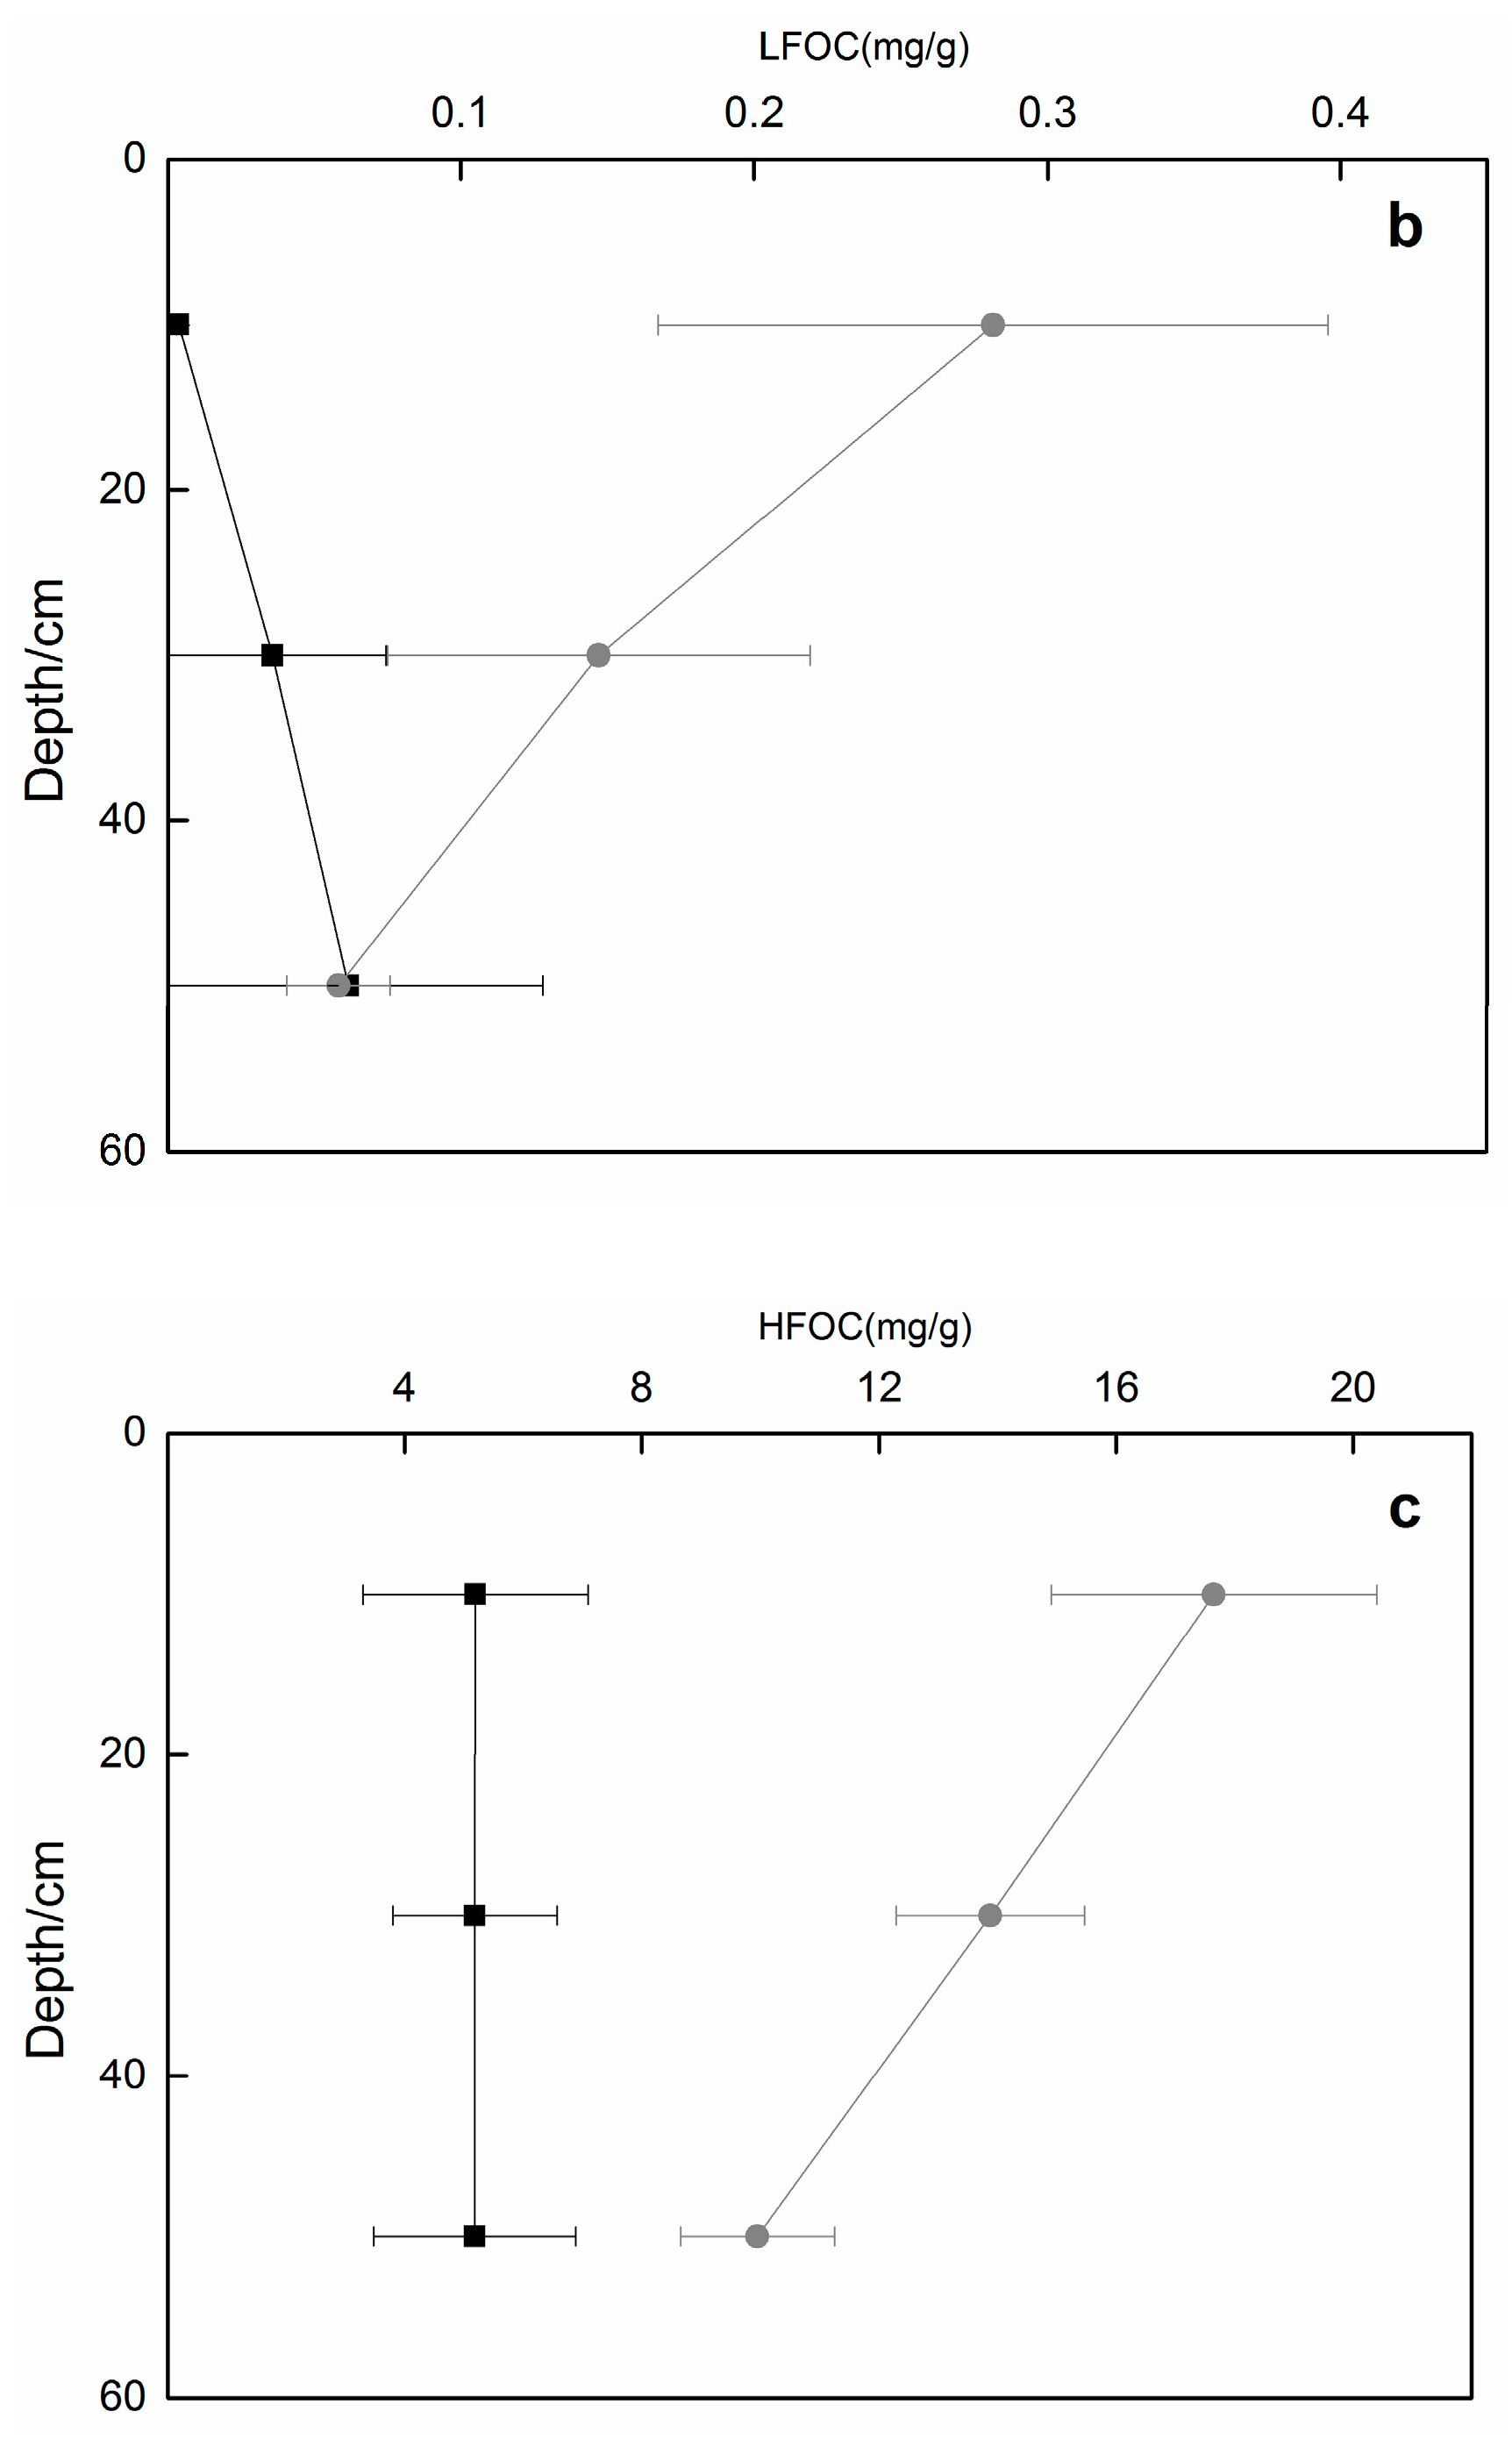
Figure 3 shows a clear vertical differentiation of DOC, LFOC, and HFOC content between the paddy fields and dry land in the study area. For the paddy field profiles, the DOC content was not significantly affected by different depths (p = 0.276), whereas the LFOC and HFOC concentrations in the topmost 0.2 m of the soil layer were significantly higher compared to the layer below (from 0.2 to 0.6 m) and decreased with an increasing soil depth (p < 0.05). For the dry-land profiles, there were no significant differences observed between the different depth intervals.
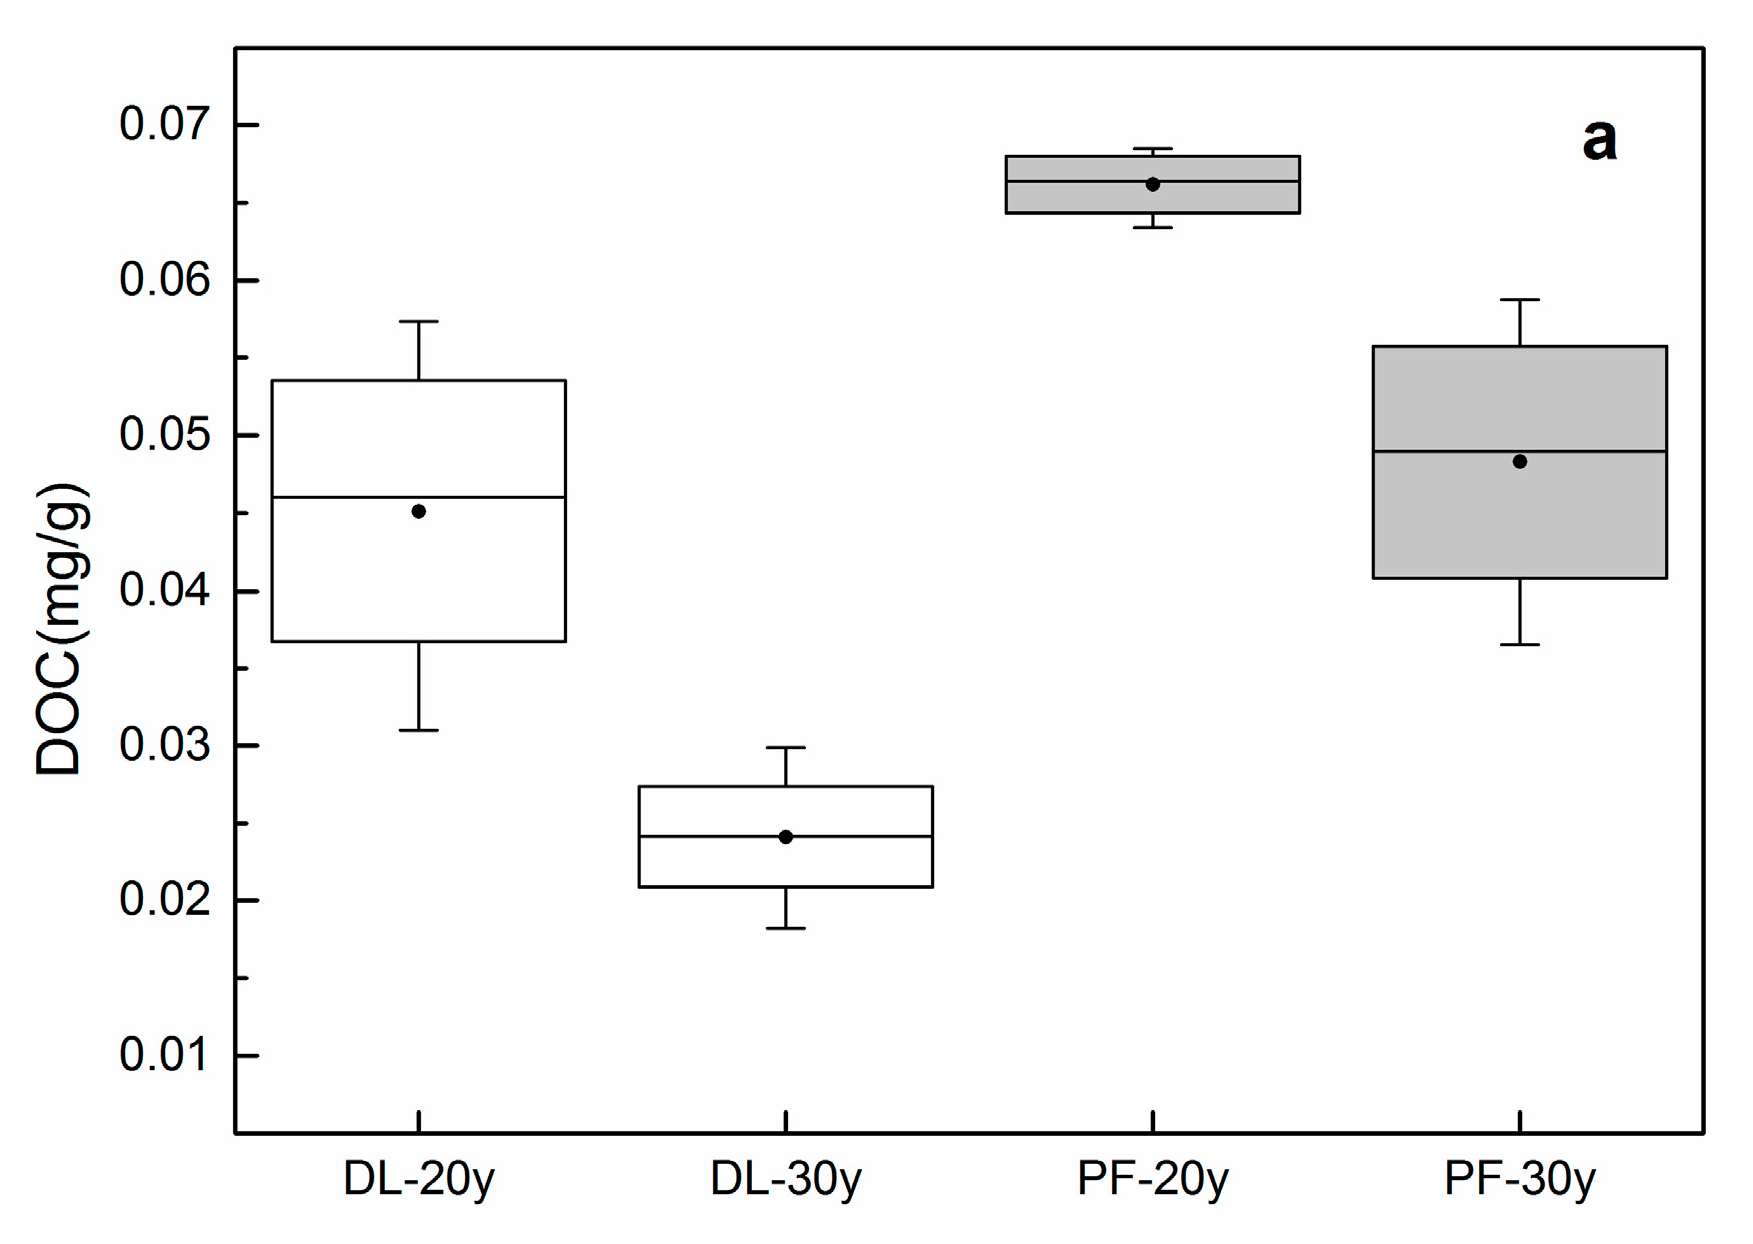
The DOC, LFOC, and HFOC content in the paddy fields and dry land with a different reclamation history are shown in Figure 4. In the dry-land and paddy-field sites, the DOC concentrations decreased from 9.03 and 13.23 mg g−1 to 4.82 and 9.66 mg g−1, respectively, with reclamation duration (p < 0.05). A significant (p < 0.05) decreasing trend in LFOC content from 0.441 to 0.004 mg g−1 was seen in the dry land. The HFOC content in the dry land was not significantly affected by the reclamation history (p = 0.149), whereas the HFOC content in the paddy fields had lost 22% after 10 years of cultivation (p < 0.05).

3.3. Soil Characteristics

Descriptive statistics for moisture content, bulk density, soil pH, soil texture, available phosphorous, LF-N, and HF-N in different land-use types are presented in Table 1. These environmental variables were indirectly associated with OC through microbial activities or vegetation productivity [36,37]. Significant differences of moisture content were found in different land-use types (p < 0.01), and bulk density showed no differences between land-use types. The pH ranged from 7.63 to 8.12 and differed significantly (p < 0.01) in the following order: constructed wetland < natural wetland < paddy fields < fishponds < dry land. The clay content was in the range of 4.32%−22.15% in all soil samples (p < 0.01), the highest value was found in the paddy fields, while the paddy fields had the lowest value in the sand content (p < 0.01). The ascending sequence of available phosphorous in various soils showed as follows: fishponds (3.30 ± 2.66 mg kg−1) < natural wetland (4.06 ± 2.61 mg kg−1) < dry land (4.48 ± 3.36 mg kg−1) < constructed wetland (5.24 ± 2.32 mg kg−1) < paddy fields (13.84 ± 5.65 mg kg−1). The concentrations of HF-N were higher in the paddy fields than those of other land-use types, and the dry land had the lowest HF-N contents (p < 0.01). The information on the soil properties of different soil depths and reclamation histories for the paddy fields and dry land are given in Tables S1 and S2, respectively.
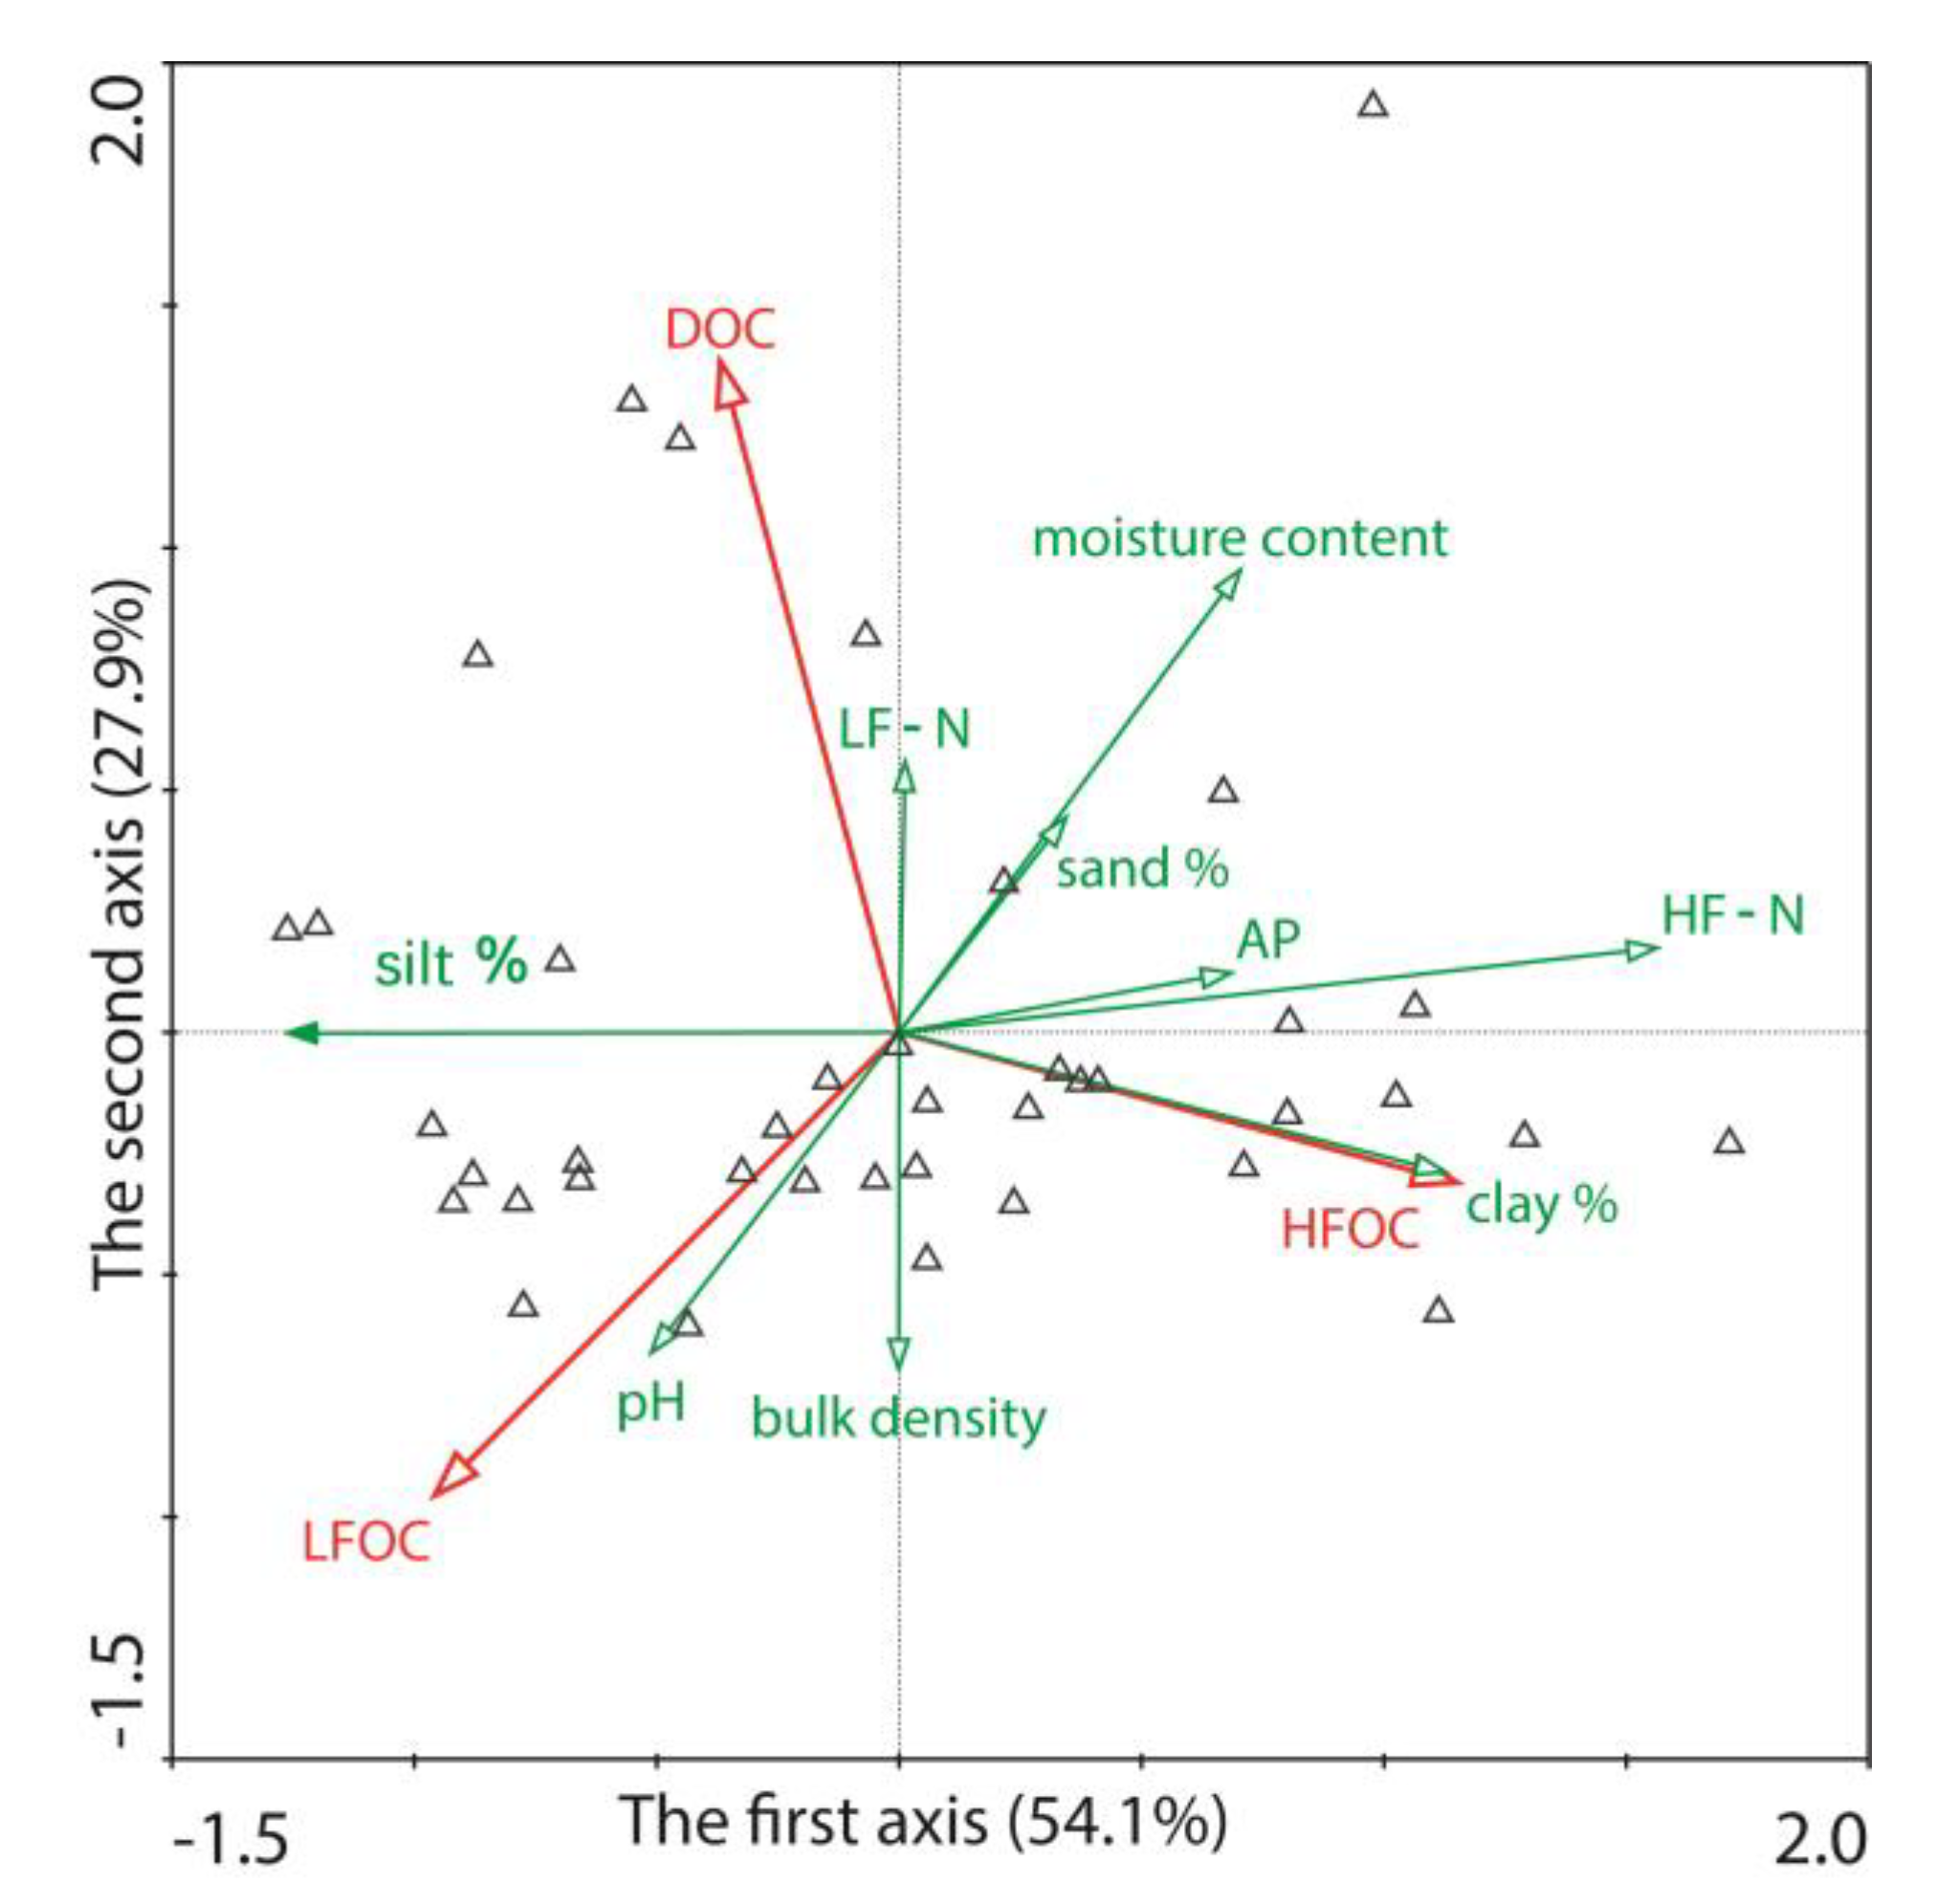
The correlation between OC and the environmental variables (i.e., moisture content, bulk density, pH, clay, sand, silt, available phosphorous, LF-N, and HF-N) are presented in Table 2. The moisture content, LF-N and HF-N was positively correlated with the DOC while the bulk density and pH was negatively correlated with the DOC. The LFOC was only positively correlated to the LF-N. In addition, the moisture content, clay, available phosphorous, and HF-N played significantly positive roles on the concentrations of HFOC, while the pH and silt had negative correlations with the HFOC content. Redundancy analysis between the SOC concentrations and soil properties was conducted using Canoco 5. As indicated by Figure 5, axes 1 and 2 explained 82% of the total variation. The HF-N and moisture content explained 49% and 19%, respectively, of the DOC, LFOC, and HFOC concentrations.

4. Discussion

4.1. Effects of Contemporary Land-Use Types on Soil Organic Carbon

Much work has been completed concerning the concentration of SOC in natural wetlands and cultivated soil [22,38,39]. In this study we further investigated the HFOC of the constructed wetland and fishponds. Compared with natural wetlands, higher HFOC content was found in the constructed wetland, paddy fields, and fishponds, and lower HFOC concentrations were showed in the dry land. These differences were a reflection of the impact of human activities on HFOC dynamics in wetland areas. The natural wetland had a lower input of carbon from anthropogenic sources [40]. In contrast, the constructed wetland, paddy fields, and fishponds had large amount of carbon input, such as following: industrial and domestic sewage, which contains nutrient-rich material, flowed into the constructed wetland [41], and lush vegetation was planted into the constructed wetland, which would increase carbon input through enhanced photosynthesis [42]. Yu, Zhang, Lu, et al. [43] presented that the mean vegetation carbon density of the reed community was 2.35 kg m−2 and that of the lotus community was 0.26 kg m−2 in Nansi Lake. The paddy fields accumulated carbon via agricultural activities such as organic manure [24,44]. As showed in Table 2, the paddy fields had the highest available phosphorous and HF-N content. Fishponds accumulated carbon via fish feed and excrement. The dry land had the lowest HFOC content, which might be a result of decreased organic carbon mineralization and increased decomposition under aerobic conditions compared to anaerobic ones [45,46].
The concentrations of DOC differed significantly among the land-use types (p < 0.01) in the following order: constructed wetland > natural wetland > paddy fields > fishponds > dry land. Cao, Wang, Chen, et al. [47] found that constructed wetlands have more taxa of microbes in sediments than those of river wetlands. Fernandes, Almeida, Pereira, et al. [48] also found that constructed wetlands have a particularly abundant microbe community. Our research showed that the DOC content of constructed wetland was higher than that of natural wetland, suggesting that in the constructed wetland, microbial utilization of DOC was higher. The reason is that the constructed wetland is planted with vegetation, which is beneficial to the formation of microbial communities. Another potential influencing factor may be nutrition content. Freeman, Fenner, Ostle, et al. [49] reported that nutrition content could affect the release of DOC in different wetland types. The constructed wetland stores more nutrients than the natural wetland, which is the reason why the constructed wetland has higher DOC concentrations than the natural wetland. Although paddy fields have a significant source of nutrients (Table 2), measured DOC content was low. The reason for this phenomenon is that the additional acid anions, such as nitrate (NO3−), lead to DOC consumption during redox reactions [50]. Moreover, long-term intensive cultivation would affect replenishment mechanisms, such as the exfoliation from plant roots, hydrolysis of soil organic compounds, and dissolution from litter [51], which lead to lower DOC content in the dry land and the paddy fields. In agreement, several authors have observed higher DOC content in natural wetlands compared with farmland [38,52]. The content of DOC in the fishponds was between those two cultivation types, which might be the result of the lack of vegetation residue input [53]. In our study, DOC content was significantly negatively correlated with soil pH and bulk density (Table 2). High soil pH can affect the DOC concentrations directly and can also influence DOC concentrations by affecting microbial species [54]. High bulk density indicates low soil porosity, which curbs the activity of soil biota and aerobic microbes [55], thus reducing DOC concentrations. In this study, the LFOC of the five different sites did not show significant differences, but natural wetlands had the highest LFOC content. The result suggests a significant plant residue, provided by plant litter and roots in the natural wetland, compared with other land-use types.

4.2. Effects of the Conversion from Wetland to Paddy Fields and Dry Land on Soil Organic Carbon

In our research, when natural wetlands were converted to paddy fields or dry land, the contents of HFOC in the paddy fields increased, while it decreased at the dry-land site. Zhang, Song, Yang, [56] also reported that converting native marshland to soybean fields (1, 3, 5, 9, 15, and 35 years) resulted in a rapid decrease in the HF-C concentration. Our research indicated that the paddy fields had a large potential to sequester SOC compared with dry land through the accumulation in HFOC. This difference between the two crop systems can be explained mainly by the following two reasons: on the one hand, wetland drainage is one of the key factors in the topsoil (0–20 cm), affecting organic matter accumulation by regulating the equilibrium of organic matter production and decomposition [57]. The changes in the soil redox status will lead to soil organic matter mineralization and/or immobilization of stored nutrients [45]. Organic matter decomposition in the dry land proceeded at speeds increasing from twofold [58] to threefold [46] faster than in paddy field conditions. Therefore, high carbon input and the flooding condition of the paddy fields resulted in a higher amount of organic matter in the soil and a slower decomposition rate, indicating the accumulation of carbon. On the other hand, chemical protection—the binding with Fe/Al oxyhydrates—can facilitate soil C sequestration through the large surface area [59]. As reported by Yan, Zhou, Zhu, et al. [60], paddy soil presented 26−220% higher Fe oxyhydrates than dry-land soil. This result suggests that paddy fields can sequester more carbon compared with dry land. Furthermore, we found that when natural wetlands were converted to paddy fields or dry land, the content of DOC and LFOC was reduced. Previous studies in the Sanjiang Plain of Northeast China also showed that higher DOC concentrations occurred in the topsoil (0−20 cm) in the wetland compared with cultivated soils, while the differences were not obvious in the subsoil (20−40 cm) [38]. Therefore, the effects of land-use on DOC were only detected in the topsoil. In our research, the DOC content was not significantly affected by different depths at the paddy field site, and the content of HFOC in the paddy fields showed a decreasing trend with increasing soil depth, which further illustrates that HFOC was absorbed at 0−20 cm. The primary reason is that chemical fertilizers are mainly applied in the plow layer (0−20 cm), and then gradually decrease with increasing soil depth (Table S1).
The reclamation history was also used to illustrate that reclaimed soils have the capacity to sequester organic carbon [24]. The paddy fields and dry land in this study are adjacent to each other and have uniform parent materials under nearly identical climate conditions and landscape. Our research showed that HFOC content was higher in PF-20y than in PF-30y and there was no significant difference in the dry land. Cui, Liu, Li, et al. [22] reported that after 40-year cultivation, the paddy fields slowly accumulated SOC. In our research, the reclamation duration may not be long enough for us to find the accumulation of HFOC. Another reason for the different content of HFOC in PF-20y and PF-30y mainly lies in the soil properties. Our results suggested that PF-20y (28.4%) had higher clay content than PF-30y (15.9%) (Table S2). It is believed that soil with a high clay content has a great capacity for SOC sequestration in soil with similar inputs of carbon [41,61,62]. Some studies also reported that paddy-field soil tends to lose clay materials [62]. Therefore, strict management was required to favor clay accumulations for the purpose of enhancing the capacity of the paddy fields’ carbon sequestration. Other studies also reported that the conversion of forests to cereal-crop cultivation leads to SOC loss with increasing years of cultivation due to the downtrend of the clay content and low activity of clay after cultivation [63,64]. Although the HFOC content was not significantly different in the dry land, the DOC and LFOC content was significantly decreased following the reclamation duration. For LFOC content, DL-20y was higher than DL-30y mainly because DL-20y had amounts of residue supply, including wheat straw and soybean stalks. These results indicated that crop harvesting decreases the organic matter returning into the soil, and the supply of residue contributes to the accumulation of LFOC [65].

5. Conclusions

Our study found that contemporary land-use types and the long-term cultivation of wetlands to paddy fields or dry land both have significant effects on the soil organic carbon fractions. The HFOC increased in the constructed wetland, paddy fields, and fishponds compared with the natural wetland due to the positive effects of carbon input from anthropogenic sources. The constructed wetland had higher DOC content than the natural wetland, while the natural wetland had higher LFOC content than the constructed wetland, indicating that in the constructed wetland microbial, the utilization of DOC was higher and in the natural wetland, plant residue supply was abundant. In addition, the paddy fields exhibited higher HFOC content in the topsoil (0−20 cm) than the adjacent dry land and showed a decreasing trend with increasing soil depth, indicating that paddy fields have the capacity to sequester more carbon than dry land through the accumulation of HFOC. However, it may not be a sustainable carbon sink because the HFOC content decreased 22% after 10 years of cultivation with the decrease of clay content. The conversion from wetlands to a paddy fields increases the sequestration of soil organic carbon while conversion from wetlands to dry land decreases the storage of soil organic carbon. The study has implications for carbon accounting in wetlands and the management of wetlands for mitigating CO2 emissions.

Supplementary Materials

The following are available online at https://www.mdpi.com/2071-1050/12/5/2094/s1, Table S1. Soil properties in different soil depths for paddy field and dry land; Table S2. Soil properties in different reclamation history for paddy field and dry land.

Author Contributions

Conceptualization, formal analysis, investigation, writing—original draft, D.Z.; formal analysis, investigation, writing—review and editing, J.D. and S.J.; investigation, writing—review and editing, M.H. and Q.Q.; conceptualization, formal analysis, funding acquisition, supervision, writing—review and editing, J.L. All authors have read and agreed to the published version of the manuscript.

Funding

This research was funded by the China Major Science and Technology Program for Water Pollution Control and Treatment (2017ZX07101003); the Natural Science Foundation of Shandong Province, China (ZR2017MC013); and the Natural Science Foundation of Shanxi Province (2019JLP-26).

Acknowledgments

Thanks to the professional editors at Editage for their English editing.

Conflicts of Interest

The authors declare no conflict of interest.

References

  1. Thornton, P.E.; Calvin, K.; Jones, A.D.; Di Vittorio, A.V.; Bond-Lamberty, B.; Chini, L.; Shi, X.Y.; Mao, J.F.; Collins, W.D.; Edmonds, J.; et al. Biospheric feedback effects in a synchronously coupled model of human and Earth systems. Nat. Clim. Chang. 2017, 7, 496–500. [Google Scholar] [CrossRef]
  2. Lal, R. Soil carbon sequestration to mitigate climate change. Geoderma 2004, 123, 1–22. [Google Scholar] [CrossRef]
  3. Knox, J.W.; Matthews, R.B.; Wassmann, R. Using a crop/soil simulation model and GIS techniques to assess methane emissions from rice fields in Asia. III. Databases. Nutr. Cycl. Agroecosys. 2000, 58, 179–199. [Google Scholar] [CrossRef]
  4. Lu, Y.H.; Wassmann, R.; Neue, H.U.; Huang, C.Y. Dynamics of dissolved organic carbon and methane emissions in a flooded rice soil. Soil Sci. Soc. Am. J. 2000, 64, 2011–2017. [Google Scholar] [CrossRef]
  5. Tian, J.; Lu, S.H.; Fan, M.S.; Li, X.L.; Kuzyakov, Y. Labile soil organic matter fractions as influenced by non-flooded mulching cultivation and cropping season in rice-wheat rotation. Eur. J. Soil Biol. 2013, 56, 19–25. [Google Scholar] [CrossRef]
  6. Tao, S.; Lin, B. Water soluble organic carbon and its measurement in soil and sediment. Water Res. 2000, 34, 1751–1755. [Google Scholar] [CrossRef]
  7. Gregorich, E.G.; Carter, M.R.; Angers, D.A.; Monreal, C.M.; Ellert, B.H. Towards a minimum data set to assess soil organic matter quality in agricultural soils. Can. J. Soil Sci. 1994, 74, 367–385. [Google Scholar] [CrossRef] [Green Version]
  8. Janzen, H.H.; Campbell, C.A.; Brandt, S.A.; Lafond, G.P.; Townley-Smith, L. Light-fraction organic matter in soil from long-term crop rotations. Soil Sci. Soc. Am. J. 1992, 56, 1799–1806. [Google Scholar] [CrossRef] [Green Version]
  9. Sollins, P.; Spycher, G.; Glassman, C.A. Net nitrogen mineralization from light- and heavy-fraction forest soil organic matter. Soil Biol. Biochem. 1984, 16, 31–37. [Google Scholar] [CrossRef]
  10. Yang, Y.S.; Guo, J.F.; Chen, G.S.; Yin, Y.F.; Gao, R.; Lin, C.F. Effects of forest conversion on soil labile OC fractions and aggregate stability in subtropical China. Plant Soil 2009, 323, 153–162. [Google Scholar] [CrossRef]
  11. Boone, R.D. Light-fraction soil organic matter: Origin and contribution to net nitrogen mineralization. Soil Biol. Biochem. 1994, 26, 1459–1468. [Google Scholar] [CrossRef]
  12. Gong, W.; Yan, X.Y.; Wang, J.Y.; Hu, T.X.; Gong, Y.B. Long-term manure and fertilizer effects on soil organic matter fractions and microbes under a wheat-maize cropping system in northern China. Geoderma 2009, 149, 318–324. [Google Scholar] [CrossRef]
  13. Tan, Z.; Lal, R.; Owens, L.; Izaurralde, R.C. Distribution of light and heavy fractions of soil organic carbon as related to land use and tillage practice. Soil Till. Res. 2007, 92, 53–59. [Google Scholar] [CrossRef]
  14. Freixo, A.A.; Machado, P.L.; Santos, H.P.; Silva, C.A.; Fadigas, F.S. Soil organic carbon and fractions of a Rhodic Ferralsol under the influence of tillage and crop rotation systems in southern Brazil. Soil Till. Res. 2002, 64, 221–230. [Google Scholar] [CrossRef]
  15. Eswaran, H.; Van Den Berg, E.; Reich, P. Organic carbon in soils of the world. Soil Sci. Soc. Am. J. 1993, 57, 192–194. [Google Scholar] [CrossRef] [Green Version]
  16. WBGU (German Advisory Council on Global Change). The Accounting of Biological Sinks and Sources under the Kyoto Protocol: A Step forwards or Backwards for Global Environmental Protection; Special Report: Bremerhaven, Germany, 1998. [Google Scholar]
  17. Liu, Z.G. Carbon stock and GHG emission of wetland ecosystem. Sci. Geogr. Sin. 2004, 24, 634–639. (In Chinese) [Google Scholar] [CrossRef]
  18. Lal, R. Carbon sequestration. Philos. Trans. R. Soc. B Biol. Sci. 2008, 363, 815–830. [Google Scholar] [CrossRef]
  19. Whiting, G.J.; Chanton, J.P. Greenhouse carbon balance of wetlands: Methane emission versus carbon sequestration. Tellus B 2001, 53, 521–528. [Google Scholar] [CrossRef]
  20. Green, K.; Kempka, D.; Lackey, L. Using remote sensing to detect and monitor land-cover and land-use change. Photogramm. Eng. Rem. S 1994, 60, 331–337. [Google Scholar] [CrossRef]
  21. Roth, P.J.; Lehndorff, E.; Cao, Z.H.; Zhuang, S.Y.; Bannert, A.; Wissing, L.; Schloter, M.; Kögel- Knabner, I.; Amelung, W. Accumulation of nitrogen and microbial residues during 2000 years of rice paddy and non-paddy soil development in the Yangtze River Delta, China. Glob. Chang. Biol. 2011, 17, 3405–3417. [Google Scholar] [CrossRef]
  22. Cui, J.; Liu, C.; Li, Z.L.; Wang, L.; Chen, X.F.; Ye, Z.Z.; Fang, C.M. Long-term changes in topsoil chemical properties under centuries of cultivation after reclamation of coastal wetlands in the Yangtze Estuary, China. Soil Till. Res. 2012, 123, 50–60. [Google Scholar] [CrossRef]
  23. Wissing, L.; Kölbl, A.; Schad, P.; Bräuer, T.; Cao, Z.H.; Kögel-Knabner, I. Organic carbon accumulation on soil mineral surfaces in paddy soils derived from tidal wetlands. Geoderma 2014, 228–229, 90–103. [Google Scholar] [CrossRef]
  24. Zhang, H.; Wu, P.B.; Yin, A.J.; Yang, X.H.; Zhang, X.; Zhang, M.; Gao, C. Organic carbon and total nitrogen dynamics of reclaimed soils following intensive agricultural use in eastern China. Agr. Ecosyst. Environ. 2016, 235, 193–203. [Google Scholar] [CrossRef]
  25. Fu, Q.L.; Ding, N.F.; Liu, C.; Lin, Y.C.; Guo, B. Soil development under different cropping systems in a reclaimed coastal soil chronosequence. Geoderma 2014, 230, 50–57. [Google Scholar] [CrossRef]
  26. Iost, S.; Landgraf, D.; Makeschin, F. Chemical soil properties of reclaimed marsh soil from Zhejiang Province P.R. China. Geoderma 2007, 142, 245–250. [Google Scholar] [CrossRef]
  27. Zhao, D.; Dong, J.Y.; Ji, S.P.; Liu, J. Land use pattern and soil organic carbon storage in Nansi Lakes Area for 5 periods since 1978. Wetl. Sci. 2019, 17, 637–644. (In Chinese) [Google Scholar] [CrossRef]
  28. Yang, J.; Shan, L.Z.; Xi, J.C.; Li, X.M.; Ge, Q.S. Land use pattern changes and ecological effects in Nansihu wetland. Resour. Sci. 2014, 36, 856–864. (In Chinese) [Google Scholar]
  29. Cao, Q.Q.; Wang, R.Q.; Liu, J. Composition and distribution of organic carbon in river sediments: A case study of two northern Chinese rivers. Pol. J. Environ. Stud. 2015, 24, 969–975. [Google Scholar] [CrossRef]
  30. Batjes, N.H. Total carbon and nitrogen in the soils of world. Eur. J. Soil Sci. 2015, 65, 2–3. [Google Scholar] [CrossRef]
  31. Jones, D.L.; Willett, V.B. Experimental evaluation of methods to quantify dissolved organic nitrogen (DON) and dissolved OC (DOC) in soil. Soil Biol. Biochem. 2006, 38, 991–999. [Google Scholar] [CrossRef]
  32. Dittmar, T.; Koch, B.; Hertkorn, N.; Kattner, G. A simple and efficient method for the solid-phase extraction of dissolved organic matter (SPE-DOM) from seawater. Limnol. Oceanogr. Meth. 2008, 6, 230–235. [Google Scholar] [CrossRef]
  33. Zhang, W.J.; Peng, P.Q.; Tong, C.L.; Wang, X.L.; Wu, J.S. Characteristics of distribution and composition of OC in Dongting Lake floodplain. Environ. Sci. 2005, 26, 56–60. (In Chinese) [Google Scholar] [CrossRef]
  34. Anderson, J.M.; Ingram, J.S.I. Tropical Soil Biology and Fertility: A Handbook of Methods; CAB International: Wallingford, UK, 1993. [Google Scholar]
  35. Indoranate, S.J.; Hammer, R.D.; Koenig, P.G.; Follmer, L.R. Particle-size analysis by a modified pipette procedure. Soil Sci. Soc. Am. J. 1990, 54, 560–563. [Google Scholar] [CrossRef]
  36. Denef, K.; Zotarelli, L.; Boddey, R.M.; Six, J. Microaggregate-associated carbon as a diagnostic fraction for management-induced changes in soil organic carbon in two Oxisols. Soil Biol. Biochem. 2007, 39, 1165–1172. [Google Scholar] [CrossRef]
  37. Zhou, P.; Song, G.H.; Pan, G.X.; Li, L.Q.; Zhang, X.H. Role of chemical protection by binding to oxyhydrates in SOC sequestration in three typical paddy soils under long-term agro-ecosystem experiments from South China. Geoderma 2009, 153, 52–60. [Google Scholar] [CrossRef]
  38. Zhang, J.B.; Song, C.C.; Yang, W.Y. Land use effects on the distribution of labile organic carbon fractions through soil profiles. Soil Sci. Soc. Am. J. 2006, 70, 660–667. [Google Scholar] [CrossRef]
  39. Zhang, J.B.; Song, C.C.; Wang, S.M. Short-term dynamics of carbon and nitrogen after tillage in a freshwater marsh of northest China. Soil Till. Res. 2008, 99, 149–157. [Google Scholar] [CrossRef]
  40. Li, X.Z.; Sun, Y.G.; Mander, Ü.; He, Y.L. Effects of land use intensity on soil nutrient distribution after reclamation in an estuary landscape. Landsc. Ecol. 2013, 28, 699–707. [Google Scholar] [CrossRef]
  41. Bai, J.; Xiao, R.; Zhang, K.; Gao, H.; Cui, B.; Liu, X. Soil organic carbon as affected by land use in young and old reclaimed regions of a coastal estuary wetland, China. Soil Use Manag. 2013, 29, 57–64. [Google Scholar] [CrossRef]
  42. Ryu, Y.; Baldocchi, D.D.; Kobayashi, H.; van Ingen, C.; Li, J.; Black, T.A.; Beringer, J.; van Gorsel, E.; Knohl, A.; Law, B.E.; et al. Integration of MODIS land and atmosphere products with a coupled-process model to estimate gross primary productivity and evapotranspiration from 1 km to global scales. Glob. Biogeochem. Cycles 2011, 25, 271–284. [Google Scholar] [CrossRef] [Green Version]
  43. Yu, Q.Z.; Zhang, Z.L.; Lu, J.S.; Sun, J.J. Spatial and temporal variation of vegetation carbon storage in nansihu lake wetland from 1987 to 2008. Ecol. Environ. Sci. 2012, 21, 1527–1532. (In Chinese) [Google Scholar] [CrossRef]
  44. Zhao, G.M.; Sun, X.; Ling, L.; Liu, Z.P. Innovative artificial agro-ecosystems enhance soil carbon sequestration in Coastal Zones of Southeast China. CLEAN Soil Air Water 2013, 41, 581–586. [Google Scholar] [CrossRef]
  45. Sigua, G.C.; Coleman, S.W.; Albano, J. Beef cattle pasture to wetland reconversion: Impact on soil organic carbon and phosphorus dynamics. Ecol. Eng. 2009, 35, 1231–1236. [Google Scholar] [CrossRef]
  46. Debusk, W.F.; Reddy, K.R. Turnover of detrital organic carbon in a nutrient-impacted everglades marsh. Soil Sci. Soc. Am. J. 1998, 62, 1460–1468. [Google Scholar] [CrossRef]
  47. Cao, Q.Q.; Wang, H.; Chen, X.C.; Wang, R.Q.; Liu, J. Composition and distribution of microbial communities in natural river wetlands and corresponding constructed wetlands. Ecol. Eng. 2017, 98, 40–48. [Google Scholar] [CrossRef]
  48. Fernandes, J.P.; Almeida, C.M.R.; Pereira, A.C.; Ribeiro, I.L.; Reis, I.; Carvalho, P.; Clara, M.; Basto, P.; Mucha, A.P. Microbial community dynamics associated with veterinary antibiotics removal in constructed wetlands microcosms. Bioresour. Technol. 2015, 182, 26–33. [Google Scholar] [CrossRef] [PubMed]
  49. Freeman, C.; Fenner, N.; Ostle, N.J.; Kang, H.; Dowrick, D.J.; Reynolds, B.; Lock, M.; Sleep, D.; Hughes, S.L.; Hudson, J. Export of dissolved organic carbon from peatlands under elevated carbon dioxide levels. Nature 2004, 430, 195–198. [Google Scholar] [CrossRef]
  50. Bartlett, R.; Bottrell, S.; Coulson, J. Behaviour of sulphur during diagenesis of a maritime ombrotrophic peat from yell, Shetland Islands, UK. Appl. Geochem. 2005, 20, 1597–1605. [Google Scholar] [CrossRef]
  51. Saviozzi, A.; Levi-Minzi, R.; Cardelli, R.; Riffaldi, R. A comparison of soil quality in adjacent cultivated, forest and native grassland soils. Plant Soil 2001, 233, 251–259. [Google Scholar] [CrossRef]
  52. Wang, L.L.; Song, C.C.; Yang, G.S. Dissolved organic carbon characteristics in surface ponds from contrasting wetland ecosystems: A case study in the Sanjiang Plain, Northeast China. Hydrol. Earth Syst. Sci. 2013, 17, 371–378. [Google Scholar] [CrossRef] [Green Version]
  53. Srivastava, P.; Singh, P.K.; Singh, R.; Bhadouria, R.; Singh, D.K.; Singh, S.; Afreen, T.; Tripathi, S.; Singh, P.; Singh, H.; et al. Relative availability of inorganic N-pools shifts under land use change: An unexplored variable in soil carbon dynamics. Ecol. Indic. 2016, 64, 228–236. [Google Scholar] [CrossRef]
  54. Szoboszlay, M.; Dohrmann, A.B.; Poeplau, C.; Don, A.; Tebbe, C.C. Impact of land-use change and soil organic carbon quality on microbial diversity in soils across Europe. FEMS Microbiol. Ecol. 2017, 93, 1–12. [Google Scholar] [CrossRef] [PubMed]
  55. Avnimelech, Y.; Ritvo, G.; Meijer, L.E.; Kochba, M. Water content, organic carbon and dry bulk density in flooded sediments. Aquacult. Eng. 2001, 25, 25–33. [Google Scholar] [CrossRef]
  56. Zhang, J.B.; Song, C.C.; Yang, W.Y. Tillage effects on soil carbon fractions in the Sanjiang Plain, Northest China. Soil Till. Res. 2007, 93, 102–108. [Google Scholar] [CrossRef]
  57. Frolking, S.; Roulet, N.T.; Moore, T.R.; Richard, P.J.H.; Lavoie, M.; Muller, S.D. Modeling Northern Peatland decomposition and peat accumulation. Ecosystems 2001, 4, 479–498. [Google Scholar] [CrossRef]
  58. Reddy, K.R.; Patrick, W.H. Effect of alternate aerobic and anaerobic conditions on redox potential, organic matter decomposition and nitrogen loss in flooded soils. Soil Biol. Biochem. 1975, 7, 87–94. [Google Scholar] [CrossRef]
  59. Osher, L.J.; Matson, P.A.; Amundson, R. Effect of land use change on soil carbon in Hawaii. Biogeochemistry 2003, 65, 213–232. [Google Scholar] [CrossRef]
  60. Yan, X.; Zhou, H.; Zhu, Q.H.; Wang, X.F.; Zhang, Y.Z.; Yu, X.C.; Peng, X. Carbon sequestration efficiency in paddy soil and upland soil under long-term fertilization in southern China. Soil Till. Res. 2013, 130, 42–51. [Google Scholar] [CrossRef]
  61. Song, X.Y.; Spaccini, R.; Pan, G.; Piccolo, A. Stabilization by hydrophobic protection as a molecular mechanism for organic carbon sequestration in maize-amended rice paddy soils. Sci. Total Environ. 2013, 458–460, 319–330. [Google Scholar] [CrossRef]
  62. Zhang, G.L.; Gong, Z.T. Pedogenic evolution of paddy soils in different soil landscapes. Geoderma 2003, 115, 15–29. [Google Scholar] [CrossRef]
  63. Mcdonagh, J.F.; Thomsen, T.B.; Magid, J. Soil organic matter decline and compositional change associated with cereal cropping in southern Tanzania. Land Degrad. Dev. 2001, 12, 13–26. [Google Scholar] [CrossRef]
  64. Birch-Thomsen, T.; Elberling, B.; Fog, B.; Magid, J. Temporal and spatial trends in soil organic carbon stocks following maize cultivation in semi-arid tanzania, east Africa. Nutr. Cycl. Agroecosyst. 2007, 79, 291–302. [Google Scholar] [CrossRef]
  65. Zhang, W.J.; Xu, M.G.; Wang, X.J.; Huang, Q.H.; Nie, J.; Li, Z.Z.; Li, S.L.; Hwang, S.W.; Lee, K.B. Effects of organic amendments on soil carbon sequestration in paddy fields of subtropical China. J. Soil Sediment. 2012, 12, 457–470. [Google Scholar] [CrossRef]
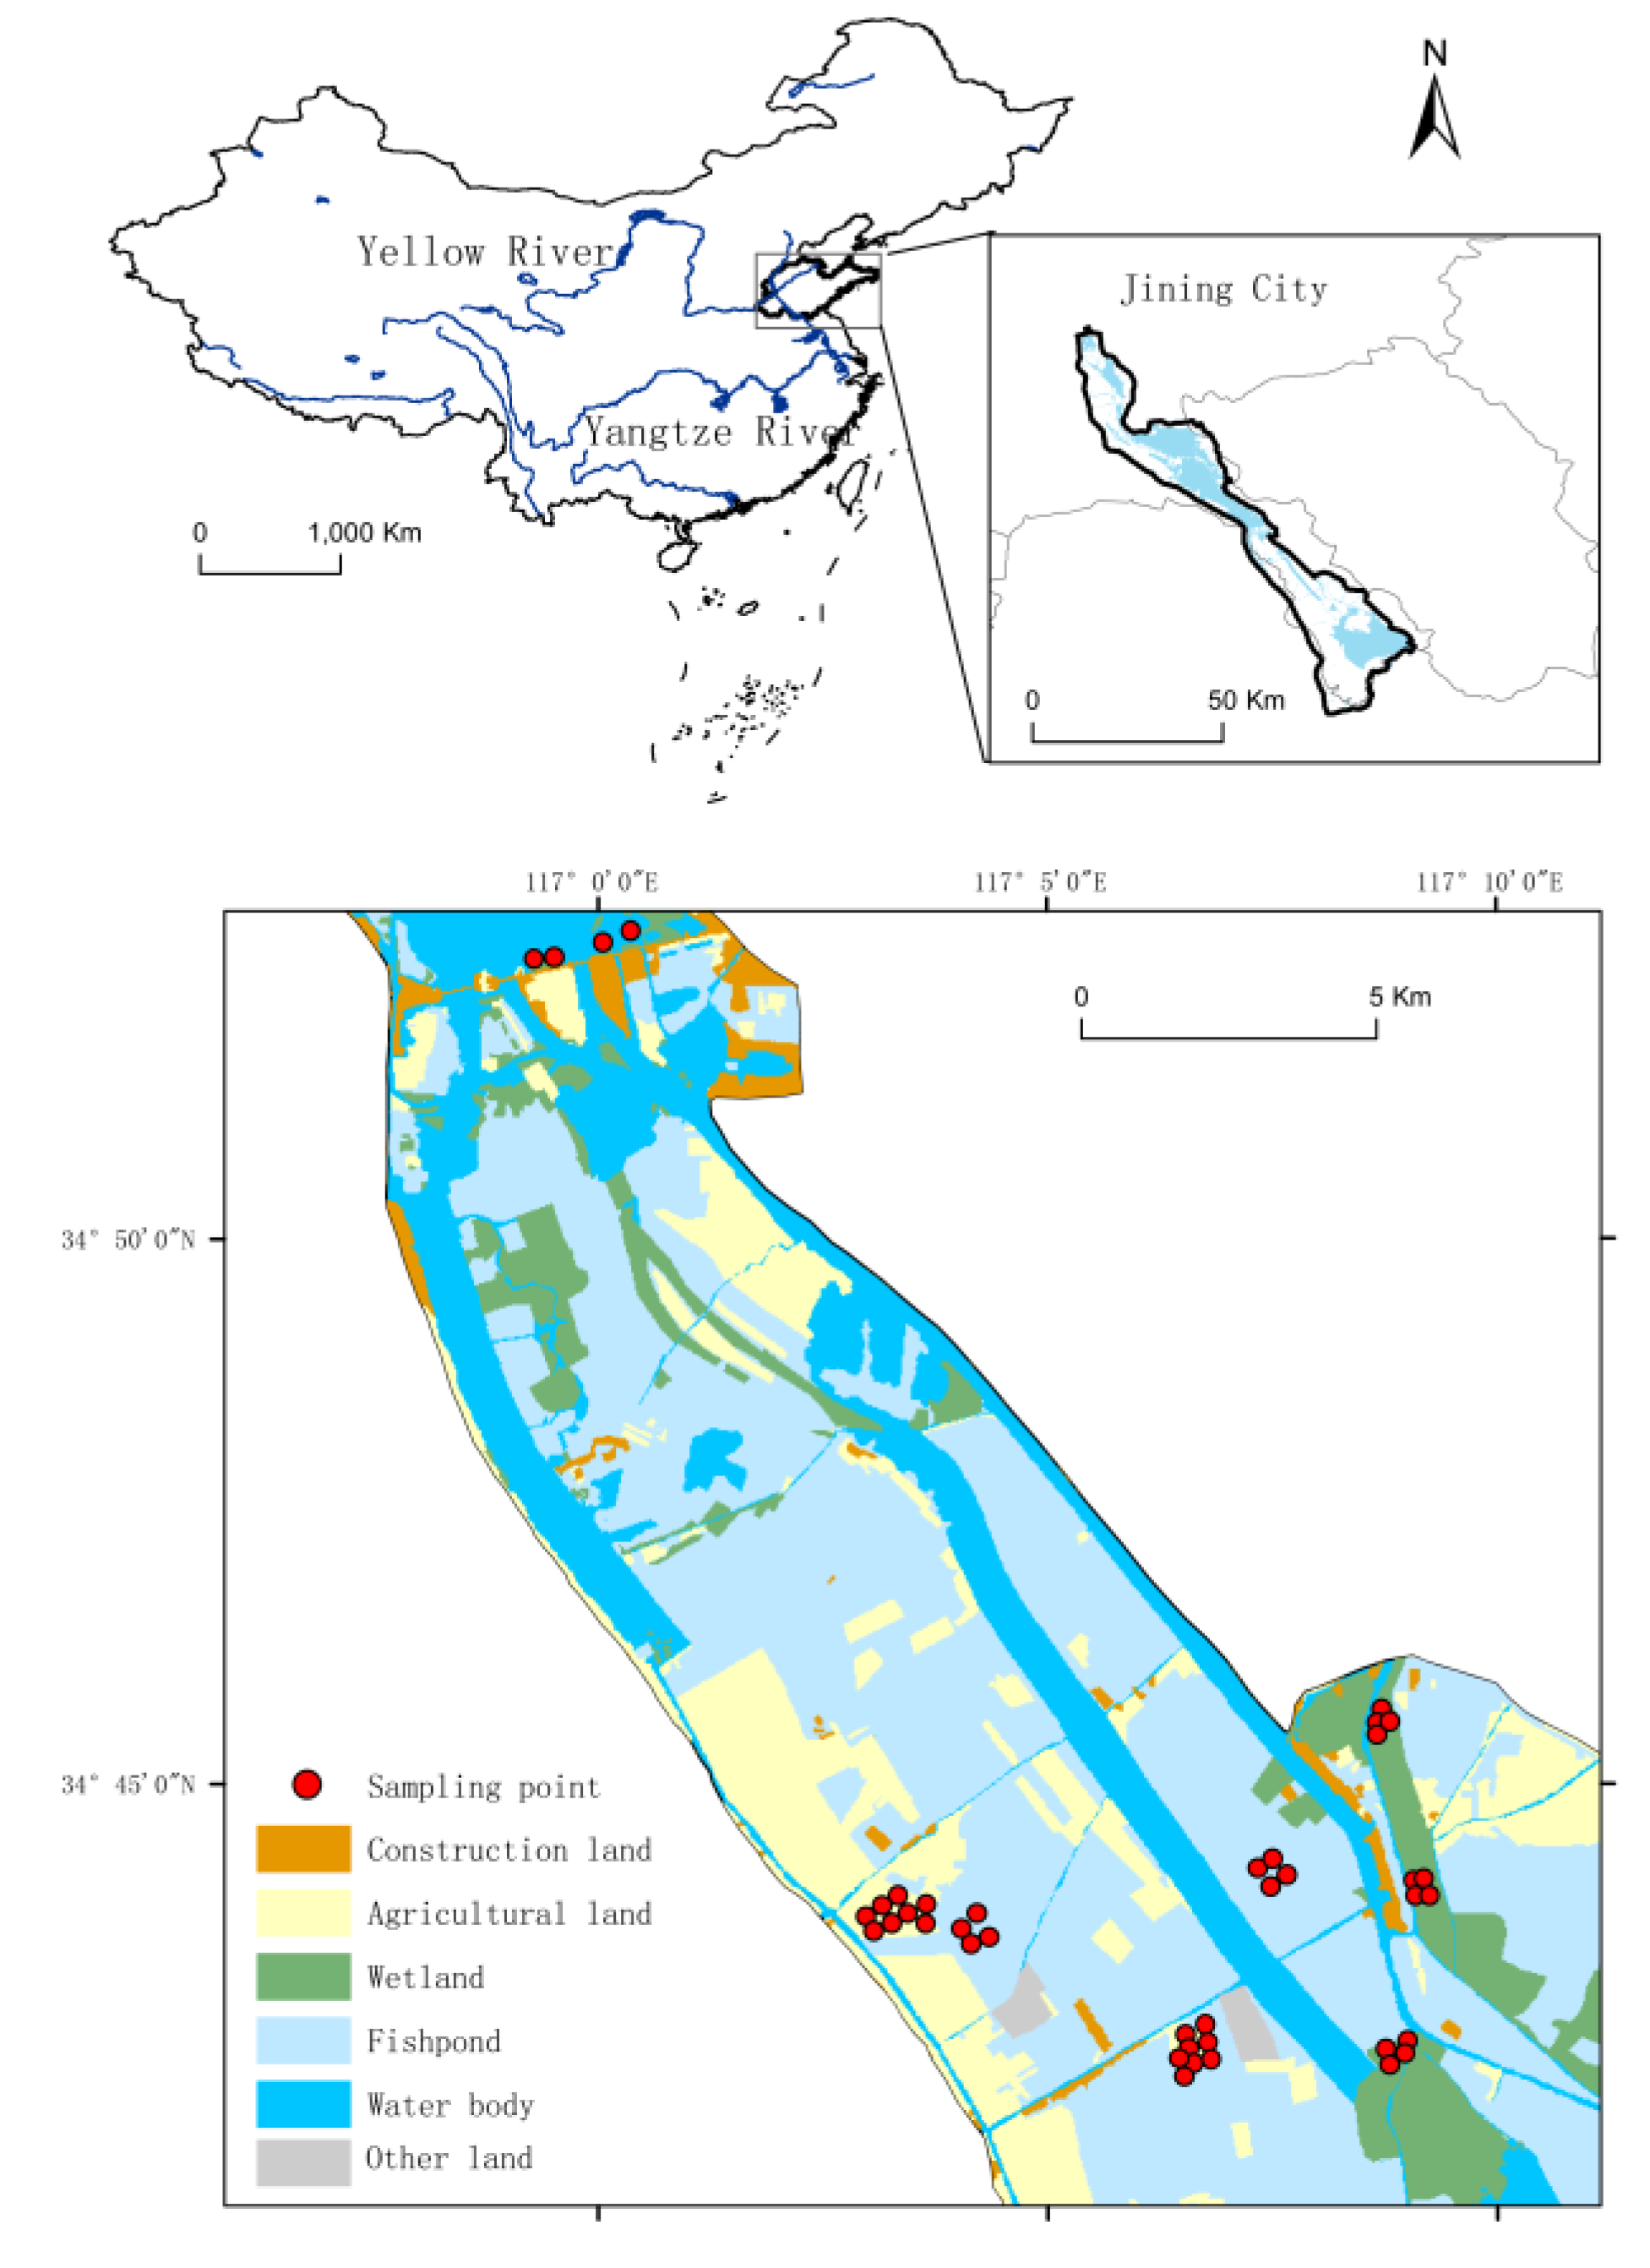
Figure 1. Location map of sampling sites in the study area.
Sustainability 12 02094 g001
Figure 2. Soil organic carbon (SOC) content for land-use type (natural wetland (NW), constructed wetland (CW), dry land (DL), paddy field (PF), fishpond (FP)) for 0–20 cm soil depth. (a) Dissolved organic carbon (DOC) content for land-use type for 0–20 cm soil depth. Different letters indicate significant differences (p < 0.05); (b) Light fraction organic carbon (LFOC) content for land-use type for 0–20 cm soil depth. Different letters indicate no significant differences (p = 0.077); (c) High fraction organic carbon (HFOC) content for land-use type for 0–20 cm soil depth. Different letters indicate significant differences (p < 0.05).
Sustainability 12 02094 g002aSustainability 12 02094 g002b
Figure 3. SOC content in 0–20 cm, 20–40 cm, and 40–60 cm soil depth. The black bar represents dry land and the gray bar represents the paddy fields. (a) DOC content in 0–20 cm, 20–40 cm, and 40–60 cm soil depth; (b) LFOC content in 0–20 cm, 20–40 cm, and 40–60 cm soil depth; (c) HFOC content in 0–20cm, 20–40cm, and 40–60cm soil depth.
Sustainability 12 02094 g003aSustainability 12 02094 g003b
Figure 4. SOC content for different reclamation histories for 0–20 cm soil depth. Dry-land cultivation 20 years (DL-20y); dry-land cultivation 30 years (DL-30y); paddy-field cultivation 20 years (PF-20y); paddy field cultivation 30 years (PF-30y). (a) DOC content for different reclamation histories for 0–20 cm soil depth; (b) LFOC content for different reclamation history for 0–20 cm soil depth; (c) HFOC content for different reclamation histories for 0–20 cm soil depth.
Sustainability 12 02094 g004aSustainability 12 02094 g004b
Figure 5. Redundancy analysis (RDA) of the relationships between SOC content in soil (red lines) and soil property variables (green lines) using Canoco 5. AP = available phosphorous; DOC = dissolved organic carbon; HFOC = heavy fraction organic carbon; HF-N = heavy fraction nitrogen; LFOC = light fraction organic carbon; LF-N = light fraction nitrogen.
Sustainability 12 02094 g005
Table 1. Soil properties of different soils in Nansi Lake, China.
Natural WetlandConstructed WetlandDry LandPaddy FieldFishpondSignificant
Moisture content
%
0.60 ± 0.240.79 ± 0.460.22 ± 0.060.57 ± 0.120.49 ± 0.05**
Bulk density
g cm−3
0.76 ± 0.210.68 ± 0.260.80 ± 0.210.81 ± 0.170.80 ± 0.13
pH7.88 ± 0.087.63 ± 0.108.12 ± 0.078.04 ± 0.058.09 ± 0.05**
Clay %8.76 ± 6.068.65 ± 4.084.32 ± 1.5322.15 ± 7.1012.37 ± 1.23**
Sand %11.45 ± 5.689.10 ± 5.213.90 ± 1.033.61 ± 1.572.40 ± 1.01**
Silt %79.79 ± 8.3082.26 ± 5.5091.78 ± 2.1174.25 ± 7.8285.24 ± 1.90**
AP
mg kg−1
4.06 ± 2.615.24 ± 2.324.48 ± 3.3613.84 ± 5.653.30 ± 2.66**
LF-N
mg g−1
0.0290 ± 0.030.0120 ± 0.010.0242 ± 0.030.0326 ± 0.010.0097 ± 0.01*
HF-N
mg g−1
0.5815 ± 0.351.9620 ± 0.660.1370 ± 0.152.2808 ± 0.511.0981 ± 0.78**
Note: The values are means ± standard deviation. ** Correlation is significant at the 0.01 level (2-tailed); * Correlation is significant at the 0.05 level (2-tailed).
Table 2. Pearson correlation analysis among SOC and the soil properties in different land-use types.
Moisture ContentBulk DensitypHClaySandSiltAPLF-NHF-N
DOC0.772 **−0.478 **−0.536 **0.0070.371 *−0.2330.2130.423 **0.395 *
LFOC0.179−0.267−0.072−0.0570.235−0.0910.1390.841 **−0.020
HFOC0.546 **−0.117−0.389 *0.586 **0.271−0.712 **0.409 **0.1320.902 **
Note: ** Correlation is significant at the 0.01 level (2-tailed); * Correlation is significant at the 0.05 level (2-tailed).