Article

Understanding the Drivers of National-Level Energy Audit Behavior: Demographics and Socioeconomic Characteristics

Department of Technology & Society, Stony Brook University, Stony Brook, NY 11794, USA
*
Author to whom correspondence should be addressed.
Sustainability 2020, 12(5), 2059; https://doi.org/10.3390/su12052059
Submission received: 20 February 2020 / Revised: 2 March 2020 / Accepted: 3 March 2020 / Published: 7 March 2020

Abstract

:
The energy audit—an assessment of a home’s energy systems performed by a trained auditor in order to provide the resident with strategies for saving energy and money—is provided by many utility companies throughout the United States for free or at a reduced cost. The uptake of such programs is generally low, and little is known about audit participants. Importantly, as more evidence points to the need to look beyond physical building characteristics to increase energy efficiency, this work explores if specific characteristics of the individual are correlated with increased participation in audit programs. This research analyzes the most recent (2015) national level Residential Energy Consumption Survey (RECS) data through a binary logit regression to determine what socioeconomic and demographic factors, if any, are statistically significant in linking to the decision to undertake an audit, while controlling for physical building characteristics. The findings indicate that age has a significant and positive relationship with the decision to undertake an audit, as does being non-white, while renting has a significant and negative relationship. Knowledge about national-level participation in audit programs can help policy makers craft more strategic incentives to increase participation and, ultimately, help connect the audit decision to the more important next step of retrofits and upgrades to save energy.

1. Introduction

Simple energy efficiency measures, such as home insulation upgrades and the purchase of compact fluorescent bulbs, can save money for residential consumers while lessening burdens on energy systems and the environment. Many of these strategies are inexpensive and can result in significant cost savings for consumers. One way for residents to learn about and choose from a number of these options—thereby lessening information asymmetries—is to undertake a home energy audit [1,2]. Some researchers argue that reducing the information barrier is a necessary step to closing the intention–behavior gap in energy efficiency practices [3,4]. An aim of this research is to explore the decision to undertake an energy audit—a home inspection to gauge areas of inefficiency and opportunities for energy improvement—by way of Residential Energy Consumption Survey (RECS) data from 2015 (released in fall 2017; the most recent data available), which asks respondents if their home has had an audit. The audit variable is binary (yes/no); thus, a nonlinear logit equation is used to determine statistical significance between this behavior and any demographic or socioeconomic characteristics, while controlling for physical building variables.
A large body of existing research points to the growing need for policymakers to give attention to non-physical building characteristics in order to better understand energy efficiency decisions among citizens and consumers [5,6,7,8,9]. Some researchers point to the intention–behavior gap as a driving force behind lack of energy efficiency program participation, whereby stark differences exist between what individuals intend to do and actually do [10,11,12,13,14]; others argue that the technical and cost-saving potential for efficient buildings exists but that intervening economic factors such as information asymmetries, heterogeneous risk tolerance thresholds among individuals, and inaccurate personal discount rates lead to lack of participation in such cost-savings potential [3,4,6,15,16,17]. Thus, many researchers are turning to socioeconomic and demographic factors as drivers of energy efficiency decisions to complement the field’s knowledge of physical building characteristics that influence energy consumption [1,18,19,20,21,22,23,24,25,26]; the present study builds upon this large and growing body of research.
Increasing knowledge about national-level participation trends in energy audits can help policymakers strengthen programs and develop strategic incentives to target certain user groups. However, while the audit is important, ultimately, policymakers are interested in the drivers of home retrofit projects that stem from audits, which lead to quantifiable reductions in energy consumption; thus, knowledge about participants in audits is a crucial first step.

1.1. Energy Efficiency

A number of researchers [5,6,7,27,28,29,30,31,32] argue that energy efficiency is an important means to reducing energy consumption and lessening greenhouse gas emissions. Societal sentiments around energy efficiency have evolved over the decades, particularly in light of new environmental knowledge about climate change, and energy efficiency is now seen as an important tool in a portfolio of options intended to increase our energy security, lessen greenhouse gas emissions, and help manage spikes in demand for energy for heating, cooling, and electricity. Indeed, Pacala and Socolow [31] give energy efficiency a key role as one of the most important “wedges” for reducing greenhouse gas emissions by 2054 in their conceptual model of potential technologies.
Buildings are one important area of focus within the broader picture of energy efficiency because, despite significant innovation in new construction, existing structures are still powered primarily by fossil fuel sources and contribute a significant amount to annual greenhouse gas emissions. Buildings also offer a number of easy fixes to increase efficiency, and the residential sector is a particularly important area to focus on. The residential sector accounted for 958.8 million metric tons of CO2 emissions in 2017, a slight decrease from 1990 levels (963 million metric tons of CO2) [33] but still highly problematic for meeting climate goals. Emissions from the residential sector come from both direct burning of fossil fuels for heating and cooking, as well as electricity for all other home uses [33].
Energy efficiency in buildings is achieved through a number of mechanisms. Building codes typically dictate minimum levels of energy efficiency that must be achieved in the new construction or major renovation of buildings in the United States. These codes vary by jurisdiction, as there is no national building code. There is little in place on the policy side to address energy use in existing buildings, although some municipalities are beginning to explore this. New York City passed new legislation in late 2009 under the Greener Greater Buildings Plan, which modifies some sections of the city building code [34]. One important component of the Greener Greater Buildings Plan was the passage of Local Law 84 (LL84), which mandates annual energy benchmarking and the disclosure of properties over 50,000 SF. The city claims that this legislation, and the resulting publicly available disclosure data, now in its fifth year, is the most comprehensive of its kind in the nation [34]. A number of other cities have followed suit. More recently, New York City Mayor Bill de Blasio announced the launch of the NYC Building Operator Training Program to help residential buildings cut energy costs up to 20 percent by training operators of multifamily buildings [35]. The training curriculum is hosted through the City University of New York’s (CUNY) Building Performance Lab and is designed to upgrade the skills of building operators in learning about energy and resource conservation techniques related to a building’s heating, electrical, and water systems, but does not target or train occupants or residents [35]. Thus, although programs do exist, they fall short in that they typically target large buildings, and rarely target the occupant. Programs meant to target individual residential consumers typically consist of voluntary schemes, awareness campaigns, and labeling programs. One well-known consumer-based program is the Department of Energy’s (DOE) Energy Star program, which helps consumers identify more energy efficient appliances. This program has been expanded since its initial development and now offers a comprehensive energy assessment and scoring system for buildings [36,37].
Consumer-led energy efficiency measures can include a variety of interventions in the home, such as the purchase of more energy efficient appliances, upgrades to insulation, the application of more efficient caulking and weatherization techniques, or more costly system retrofits. Some of these interventions, such as the purchase of energy efficient appliances, may have an increased upfront cost for the consumer. Other interventions, such as caulking, have little upfront cost but require time and effort. In all cases, these interventions require the consumer to take initiative to purchase the item or make the improvement. Undertaking an energy audit is often a helpful first step in identifying the most cost-effective areas of potential savings, thus making the question of who is choosing to participate in audits an interesting one. However, there is clear evidence that even when presented with cost-effective choices that will reduce energy consumption and save the consumer money, many individuals choose not to make the purchase or investment [4,15]. In addition, some consumers have strong intentions to engage in energy efficient, pro-environmental behavior, but do not carry those intentions through to action [9,10,11,12,13,38,39]. This can be due to any number of intervening factors (for example, some researchers highlight the role of habits as a potential explanatory variable for the continued increase in energy consumption despite rising environmental awareness [40,41,42,43,44]). Thus, the demographic and socioeconomic focus is taking a center stage in energy research as policy makers realize that even among nearly identical physical structures or households, there may be vast differences in the energy consumption or efficiency behaviors undertaken [26]. Innovative cities and municipalities—driven by innovative and forward-thinking policymakers—are crafting new policy mechanisms that take such individualized factors into account; thus, for those policymakers, demographic and socioeconomic data and findings can offer important direction.

1.2. Existing Work

A number of other studies have made use of the RECS dataset, although it has not been explored as extensively as it could be. Additionally, very few of these existing studies focus on demographic factors. One researcher [45] utilized the RECS dataset from 2005 to investigate whether housing characteristics helped determine residential heating and cooling demands. Another [46] explored the impact of physical and behavioral factors on household air conditioning use by way of the 2001 RECS dataset. Poyer, Henderson, and Teotia [47] used multi-year RECS data from 1980–1990 to explore specific differences in energy consumption between Latino and non-Latino households. Fumo and Rafe Biswas [48] used RECS data to develop multiple linear regression models to determine important predictive variables in residential energy consumption but did not analyze demographic factors. Other researchers [49,50] utilized RECS as input data for validating other modeling techniques but did not utilize RECS as the focal data tool itself. The authors of this research have also used RECS data to better understand PEV adoption choices [51].
The study most similar to the research undertaken here is work by [52]. That study utilizes RECS data from 2005 to explore factors that are linked to the awareness and purchase of Energy Star appliances. The researchers found that minority ethnic groups and those with lower incomes are less likely to purchase Energy Star appliances, and that principal-agent issues between owner and renter carry over to this realm [52]. Other researchers [53,54,55,56] have conducted empirical work—in the U.S. and abroad—to explore demographic factors that influence energy efficiency using primary data sources other than the RECS.
No other studies, to the knowledge of the authors, have explored the audit variable found in the RECS dataset, and energy audits in general are understudied. Some recent studies [1,2] assessing socioeconomic and qualitative characteristics of individuals undertaking energy audits are focused on specific geographic areas, such as Seattle or New York, but do not take a national-scale view of audit behavior. Both [1,2] found that age was positively correlated with audit behavior in Seattle, WA, and New York State, respectively.

2. Materials and Methods

This research uses survey data from the 2015 Residential Energy Consumption Survey (RECS), released as a preliminary dataset in fall 2017 (the most recent dataset available). These observations represent a multi-stage area probability sampling scheme, which is representative of the entire residential population of the United States [57]. The 2015 dataset was released in October 2017 as a preliminary dataset, with more data forthcoming. This is the second time the EIA has released a preliminary version of a survey dataset, allowing researchers to perform custom analyses more recently after the completion of a survey.

2.1. Sample

The RECS is the only nationwide source of energy consumption data for the U.S. residential market [58]. This comprehensive survey has been administered 14 times since 1978 and gathers both broad and detailed characteristics about energy use and consumption in the household [34]. As the U.S. Energy Information Administration (EIA) explains, “Originally conducted by trained interviewers with paper and pencil, the 2015 study used a combination of computer-assisted personal interview (CAPI), web, and mail modes to collect data for the Household and Energy Supplier Surveys” [58]. The data was collected from nearly 6000 households, which is representative of 118.2 million U.S. households. Additionally, the EIA added new variables to the 2015 survey to gauge what they term “emerging technologies and usage behavior” undertaken by householders, such as smartphones, tablets, and smart thermostats [58]. According to the EIA, the final response of 5686 households represents a 50.8% response rate [58].

2.2. Variables and Key Measures

2.2.1. Dependent Variable

In the most recent RECS, interviewers asked respondents if their home has had an energy audit. The question is structured in such a way that it defines an audit as well as inquires if one has been performed. It is worded in the RECS as follows: “A home energy audit is when a trained professional examines how energy is used in all parts of a home. After examining a home, the energy auditor will provide a list of ways to reduce energy use and save money on energy bills. Has your home had an energy audit?” [59]. The available responses to this question were yes, no, or don’t know. This key variable, termed AUDIT by the RECS, will serve as the focal dependent variable for this analysis. As a binary variable, responses of yes are coded as “1” and no as “0”. Responses of “don’t know” were recorded in this dataset as missing data and were ultimately dropped from the model.
This dependent variable was chosen from the dataset among the others available because an audit typically requires an investment by the resident of either time or money, and perhaps both, and the decision is usually made with the specific goal of saving money on heating/cooling costs or increasing energy efficiency. Thus, the choice to undertake such an activity is an important—but understudied and little understood—individual-scale behavior.

2.2.2. Independent Variable(s)

All years of the RECS ask respondents a short set of demographic questions. For purposes of this study, statistical analyses will explore possible correlations between the dependent variable AUDIT and the independent variables of householder’s gender (male or female), employment status (recoded as employed full-time or not), if the householder lives with a spouse or partner (yes or no), the level of education (recoded as college degree—associates or higher—or not), gross household income for 2015 (in 24 categories of $5000 increments ranging from below $2500 to over $120,000), if the householder is of Hispanic or Latino descent (yes or no), householder race (recoded into non-white (yes or no), and householder age (in years, ranging from 16–85).
Despite the demographic component of the RECS, the survey does not include questions inquiring about respondents’ attitudes, values, or social/cultural orientations around energy use, as an opinion survey like the General Social Survey (GSS) might do. This is a shortcoming of the RECS, but for purposes of an exploratory analysis using demographics, it serves as a good starting point; future research by the authors can address more nuanced individual orientations through qualitative interviews or follow-up surveys.

2.2.3. Additional Control Variables

It is assumed that housing characteristics will influence one’s choice to obtain an energy audit. Thus, statistical models should also control for physical housing variables, such as age of home, square-footage, etc. The following home characteristic variables are included in the analysis: home type (recoded into single family attached or detached, or not), heating degree days (HDD) and cooling degree days (CDD) for 2015, the total square footage of the home, if the householder owns the home (yes or no), the date that the home was built (in 10-year increments across 8 categories), primary exterior wall type, primary roof material, the number of bedrooms, the number of full baths, the age of primary home heating equipment, and if the home has higher ceilings than average (greater than 8’). Additionally, two other environmentally focused variables are included in the dataset, which may indicate an inclination towards more energy-efficient behavior and thus a higher likelihood of obtaining an energy audit. These variables include ownership of an Energy Star water heater (yes or no) or freezer (yes or no). A measure of draftiness for the home was also included in the dataset (yes or no), which is both a subjective assessment by the respondent, as well as an additional proxy for housing characteristics. Finally, a weighting variable, termed nweight, was included in the model, which represents the final sampling weight of the dataset, accounting for different probabilities of selection and rates of response [57].
All variables, along with key summary data points, are presented in Table 1 and Table 2 below.

2.3. Analytic Strategy

The dependent variable for this study is a nominal, discrete variable (AUDIT). Thus, a logit is the best choice of analytic tool. This will allow for identification of the probability of a given householder undertaking an energy audit based on a number of potentially correlated factors. A basic logit model for the audit variable can be modeled as follows:
Pr (audit = 1) = F(Xβ)
where F ≈ logistic CDF, 1 + e^(−xβ).
The following assumptions can be made about the model:
  • Y is binary
  • Y is conditional on X: P(y|x)
  • Functional form of relationship between P(y) and X is logit
  • Model is specified with the correct independent variables
  • The Yi’s are statistically independent, generated from a random sample
  • No exact multicollinearity
Given the nonlinearity of the parameters, this model cannot be safely estimated using Ordinary Least Squares (OLS). Thus, estimation for the model will be done using Maximum Likelihood (ML), which aims to find betas that maximize the likelihood or probability of obtaining the observed data.
It should be noted that there is a clear precedent for using this type of analytical model to better understand a discrete dependent variable, particularly when it involves the prediction of an individual’s likelihood to adopt a particular choice or undertake a behavior [60,61]. In this particular study, although only 9% of respondents have had an energy audit, this represents 458 individuals, and the total sample size is still large (n = 5088). Thus, robust statistical analyses can be safely performed.

3. Results

Table 3 (below) presents results from three logit models: a full model (Model 1), which includes all demographic variables and household characteristic variables, and two reduced models, which include only demographic variables (Model 2) and only household characteristic variables (Model 3), respectively. Based on these results, a few key findings can be highlighted. Unless otherwise specified, the discussed results are from Model 1, with Models 2 and 3 used to triangulate findings.

3.1. Model Fit

The model fit is fair to good. The overall Likelihood Ratio (LR) test is significant at the 99% level (p = 0.000). The Psuedo-R-squared value is low, at 0.026 (ranging from 0.2 to 0.4 indicates a very good model fit), which indicates that only approximately 2% of variation in the dependent variable is explained by the independent variables. However, the results of the Pearson Chi-Square goodness of fit test of 0.6189 indicate that the model is a good fit for the data and we should not reject the “good fit” null hypothesis.

3.2. Statistical Significance of Coefficients

The following variables returned significant coefficients in the full model (Model 1): hhage (age of householder) and nonwhite (race is not white). These variables are significant at the 99% level (p < 0.000) and 95% level (p < 0.005), respectively. In Model 2 (which includes only household demographics without control variables for physical building characteristics), the age of householder was again significant at the 99% level (p < 0.000). In Model 3 (which includes only physical building characteristics), the variable kownrent (whether the respondent owns or rents) was significant at the 95% level (p < 0.005). All other variables returned insignificant coefficients; thus, holding all else equal, we can determine they have no strong correlation with one’s decision to undertake an energy audit and can be disregarded for the remainder of the discussion. Given the significant variables, we can conclude from the model that the demographic characteristics of age and race appear to be correlated to one’s decision to undertake an audit, and, without demographic characteristics in the model, the distinction between owning or renting one’s home also appears to be correlated to an audit decision. These will be discussed further.

3.3. Direction of Coefficients

Of the statistically significant variables, the age of the householder and a nonwhite race returned positive coefficients, and owning or renting one’s home returned a negative coefficient. The positive coefficient on the continuous variable age indicates that each additional year increase in age is positively correlated with undertaking an energy audit. For a binary variable such as nonwhite, the positive coefficient indicates an answer in the affirmative (e.g., being non-white) is correlated with a higher probability of undertaking an energy audit. For the ordinal variable for owning or renting one’s home, where the variable is coded a 1 for owning, a 2 for renting, and a 3 for occupying without owning or paying rent, the negative coefficient indicates that falling in a lower category for the variable has a positive impact on one’s decision to undertake an energy audit. Stated more simply, householders living in homes that they own are more likely to undertake audits than those that rent their homes, all else being equal.

3.4. Additional Findings

Tests of sensitivity and specificity generate findings that tell us that, overall, 89.96% of observations were correctly classified. These tests indicate that potentially 10.04% of findings that have been classified as negative are incorrectly classified as such (false negatives). The results of the test for the Receiver Operating Characteristic (ROC) curve are favorable, with results for the area under the curve returning at 0.62. The closer this area is to 1, the better the model is.

4. Discussion

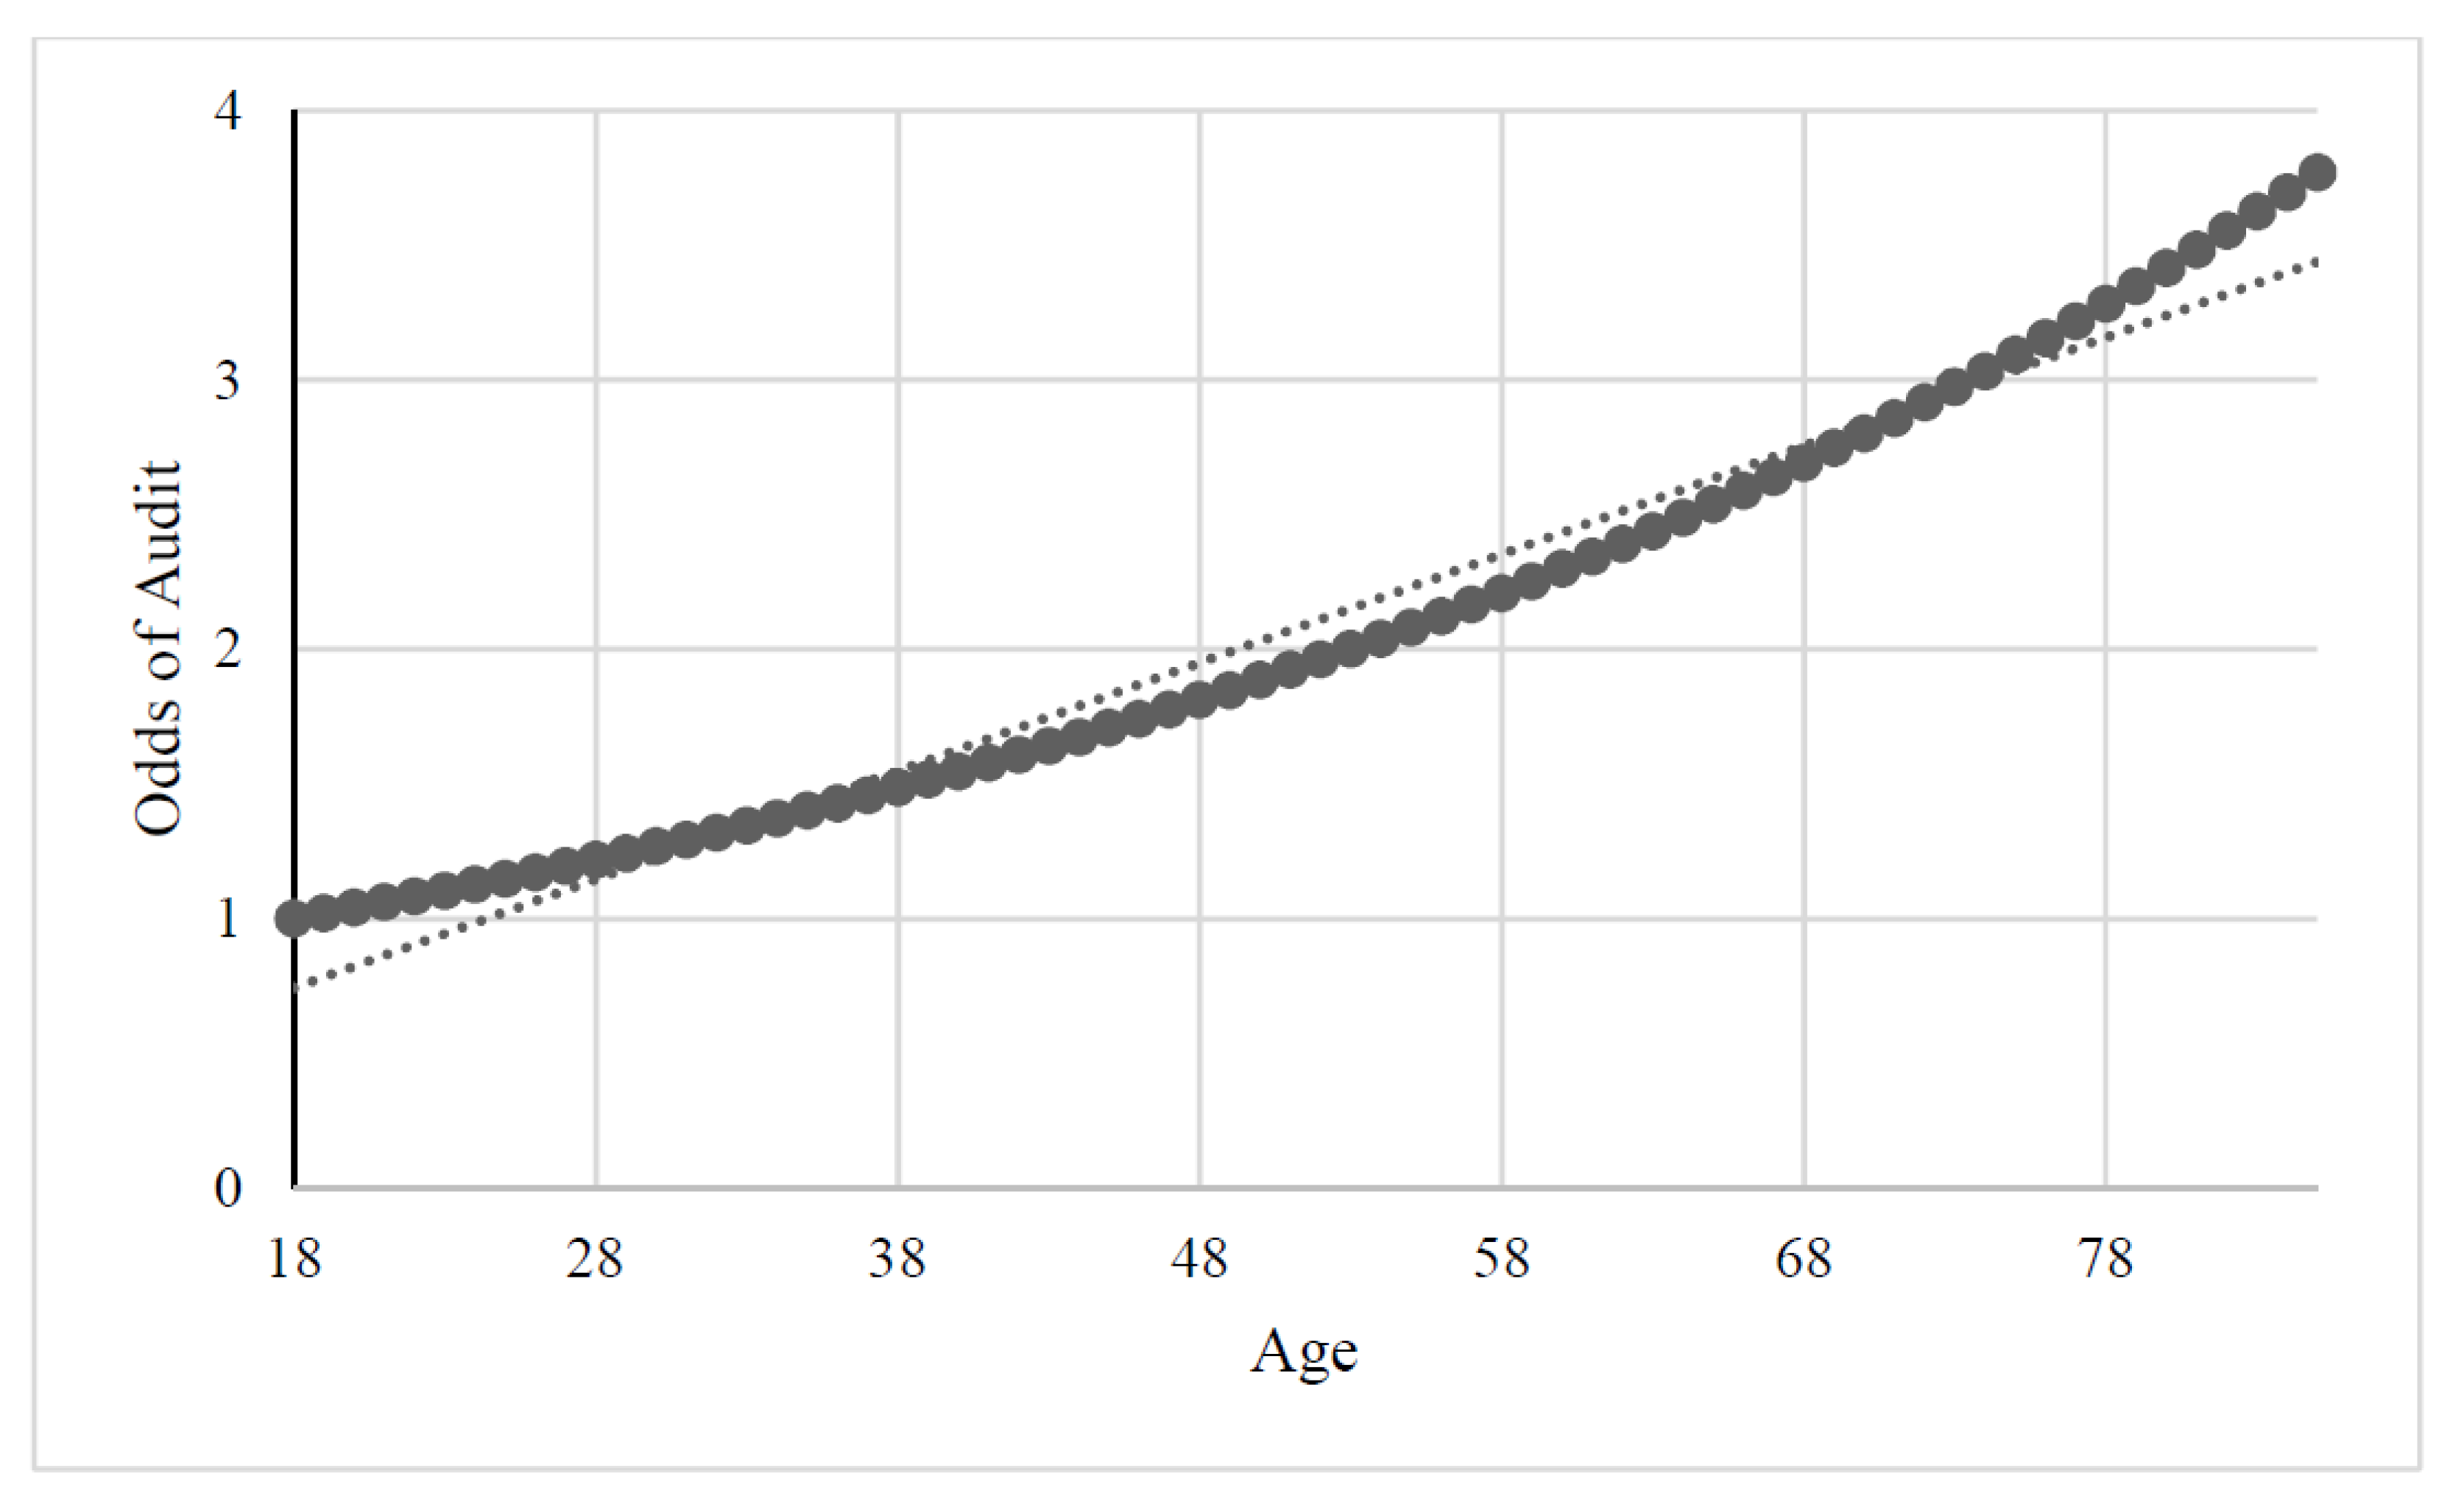
4.1. Analysis of Odds

Some analysis can be noted, particularly in regards to the statistically significant demographic variables, which were the independent variables of most interest in the model. First, the odds found in Table 3 tell us that each one-year increase in age increases the odds of undertaking an energy audit by 1.02, or approximately 2%, holding all else equal. See Figure 1 for a plotting of these odds. Furthermore, being nonwhite increases the odds of undertaking an energy audit by 1.55, or 55%, holding all else equal. Thus, those householders making decisions to have an energy audit generally seem to be older and non-white. No other demographic variables returned significant coefficients.
The results from variables on household characteristics from Model 3 are predictable. The statistically significant variable of kownrent confirms much of what existing research has found about the influence of home ownership on energy efficiency, and the barriers resulting from principal agent challenges in renter–landlord relationships. The odds of undertaking an audit if you rent your home instead of own are 0.57. Stated more simply, if the respondent rents instead of owns, the probability of undertaking a home energy audit decreases by approximately 43%.

4.2. Policy Implications and Recommendations

Some discussion is necessary regarding the findings noted above, particularly the results from the model(s) using a national sample that is representative of 118 million U.S. households indicating that older, non-white respondents are more likely to undertake audits, and that homeownership is a strong driver of audit behavior.
First, the finding regarding age aligns with the few existing studies on audits [1,2]. However, those studies found relationships not only between age, but also between higher incomes (a negative association) and more education, which this study did not find. One argument for this finding regarding older participants is that individuals who are older perhaps have more time, particularly if they are retired, no longer working full time, or have children who have grown and are out of the home. This group is also more likely to be homeowners. Taken together, these characteristics may make this group more inclined to undertake the effort and time necessary to complete an energy audit. Policy makers may find it important to find ways to engage the inverse of this group—younger individuals (who are likely to have lower household incomes at earlier stages of their careers) in order to balance participation in audit programs. Utility companies offering incentives for lower cost audits should think strategically about the choice of tool for marketing their programs (e.g., electronically via email for people who pay their bills online, as a paper insert in bills, other mechanisms), as this will capture a broader range of customers.
The finding regarding nonwhite participants is interesting and undeveloped; little existing work supports this finding at present. One possible explanation is that nonwhite participants tend to live in geographic areas where incentives for participation in audit programs are available, inducing more participation in those areas (irrespective of race). This is an area for further study. Although the RECS survey asks individuals if they have received a free or subsidized home energy audit, that variable is not included here, and would require additional analysis into the geographic location of policy mandates and the development of a new statistical model. However, this points to an interesting direction for a follow-up study.
Finally, the finding that homeowners are more likely than renters to undertake audits is well in line with a large body of existing work on misaligned incentives and principal-agent challenges faced by renters [62,63,64,65], and is also in alignment with other studies on audits [1]. Renters are also more likely to consume more electricity, all else being equal, in part because the price signal is absent in many rental arrangements. For instance, if renters are sub-metered and responsible for their own monthly electricity, they are also typically constrained by lease provisions that do not allow them to make any significant renovations to the unit or appliances in order to save energy or money, and building owners have little incentive to upgrade units if they do not bear the monthly cost of electricity usage [66]. In fact, some programs for low-cost audits, such as the one in New York State, require the participant to be a homeowner, thereby excluding renters from the conversation altogether [1,67]. Policy mechanisms should find ways to engage renter groups with energy efficiency, and the energy audit mechanism is likely not the way to do this given its emphasis on physical upgrades to built space. However, there are other creative mechanisms to engage renters, such as “ambassadors” within multifamily buildings, and incentives for personal purchases, such as lightbulbs, that renters will more directly benefit from financially.
Overall, the socioeconomic and demographic findings presented here build upon and support findings in numerous empirical studies, such as [1,18,19,20,21,22,23,24,25,26,51]. Such studies highlight the many ways that individual heterogeneity in socio-demographics and behavioral choice accounts for significant variation between predicted and actual energy use in buildings, and participation in energy efficiency programs. Such insights can provide policymakers with deeper insights that move beyond physical building characteristics.
The findings here should be interpreted conservatively. This work is not arguing for audit programs that should only be crafted to target certain individuals; instead, we offer some insight into an understudied area of energy efficiency work. One of the main takeaways from other studies of audit participants is that despite findings indicating higher uptake among certain socioeconomic groups (e.g., older participants) the households that participated in audits were highly variable and heterogeneous [2,68]. Furthermore, existing work points to the crucial role of the auditor in homeowner perceptions of the audit process and any follow-up behaviors they take [1,2,68]. It is likely, then, that auditor behavior may have some influence on the initial participation in audit programs as well. For instance, if a cluster of auditors are highly enthusiastic, highly trained, and well embedded in the local market, there may be reason to believe that that geographic area would see a higher participation rate in audit programs.

4.3. Limitations and Future Research

This research is limited in that the RECS is a secondary dataset, thereby limiting the authors’ ability to ask survey respondents specific questions crafted around tailored research hypotheses. Of particular interest would be a more contextual understanding of the culture, values, and social norms influencing how and why individuals may make decisions regarding energy audits. This would likely come from empirical research or fieldwork, which would be a good next step to building on research from secondary sources and publicly available datasets like the RECS, as these datasets could be merged to generate a more robust analysis. Additionally, since the RECS is a U.S.-based dataset, generalizing these findings to international locations is challenging.
However, from an exploratory standpoint, this study is a good first step in making connections between demographic characteristics and audit decisions and exploring potentially important correlations between variables. In addition, although the context will vary, there are likely to be a number of takeaways (such as the renter versus owner distinction) that are transferable to non-U.S. cities and jurisdictions. Finally, this research adds to existing work by being one of the first to explore the audit variable (first added to the RECS in 2009) and specifically connecting it to demographic variables. A number of interesting variables remain, and there are significant opportunities for further statistical study to explore additional relationships within the dataset.

Author Contributions

Conceptualization, E.H.; methodology, E.H. and Y.W.; software, Y.W.; validation, E.H.; formal analysis, E.H.; investigation, E.H.; resources, E.H.; data curation, E.H. and Y.W.; writing—original draft preparation, E.H.; writing—review and editing, E.H. and Y.W.; visualization, E.H. and Y.W.; supervision, E.H.; project administration, E.H.; All authors have read and agreed to the publication version of the manuscript.

Funding

This research received no external funding.

Acknowledgments

The authors would like to thank Xin Yue for an earlier analysis of a prior version of the RECS dataset in 2016.

Conflicts of Interest

The authors declare no conflict of interest.

References

  1. Boucher, J.L.; Araújo, K.; Hewitt, E. Do education and income drive energy audits? A socio-spatial analysis of New York State. Resour. Conserv. Recycl. 2018, 136, 355–366. [Google Scholar] [CrossRef]
  2. Ingle, A. Behavioral Perspectives on Home Energy Audits: The Role of Auditors, Labels, Reports, and Audit Tools on Homeowner Decision-Making; LBNL-5715E; Lawrence Berkeley National Lab: Berkeley, CA, USA, 2012.
  3. Hirst, E.; Brown, M. Closing the efficiency gap: Barriers to the efficient use of energy. Resour. Conserv. Recycl. 1990, 3, 267–281. [Google Scholar] [CrossRef]
  4. Jaffe, A.B.; Stavins, R.N. The energy paradox and the diffusion of conservation technology. Resour. Energy Econ. 1994, 16, 91–122. [Google Scholar] [CrossRef]
  5. Lutzenhiser, L. A cultural model of household energy consumption. Energy 1992, 17, 47–60. [Google Scholar] [CrossRef]
  6. Blumstein, C.; Goldstone, S.; Lutzenhiser, L. A theory-based approach to market transformation. Energy Policy 2000, 28, 137–144. [Google Scholar] [CrossRef]
  7. Lutzenhiser, L. Marketing Household Energy Conservation: The Message and the Reality. In New Tools for Environmental Protection: Education, Information, and Voluntary Measures; National Academies Press: Washington, DC, USA, 2002; pp. 49–66. [Google Scholar]
  8. Stern, P. Changing Behavior in Households and Communities: What Have We Learned? In New Tools for Environmental Protection: Education, Information, and Voluntary Measures; National Academies Press: Washington, DC, USA, 2002; pp. 201–212. [Google Scholar]
  9. Stern, P.C. New Environmental Theories: Toward a Coherent Theory of Environmentally Significant Behavior. J. Soc. Issues 2000, 56, 407–424. [Google Scholar] [CrossRef]
  10. Godin, G.; Conner, M.; Sheeran, P. Bridging the intention–behaviour gap: The role of moral norm. Br. J. Soc. Psychol. 2005, 44, 497–512. [Google Scholar] [CrossRef]
  11. Fennis, B.M.; Adriaanse, M.A.; Stroebe, W.; Pol, B. Bridging the intention–behavior gap: Inducing implementation intentions through persuasive appeals. J. Consum. Psychol. 2011, 21, 302–311. [Google Scholar] [CrossRef]
  12. Bamberg, S. Effects of implementation intentions on the actual performance of new environmentally friendly behaviors—Results of two field experiments. J. Environ. Psychol. 2002, 22, 399–411. [Google Scholar] [CrossRef]
  13. De Vries, P.; Aarts, H.; Midden, C.J.H. Changing Simple Energy-Related Consumer Behaviors: How the Enactment of Intentions Is Thwarted by Acting and Non-Acting Habits. Environ. Behav. 2011, 43, 612–633. [Google Scholar] [CrossRef]
  14. Knussen, C.; Yule, F.; MacKenzie, J.; Wells, M. An analysis of intentions to recycle household waste: The roles of past behaviour, perceived habit, and perceived lack of facilities. J. Environ. Psychol. 2004, 24, 237–246. [Google Scholar] [CrossRef]
  15. Jaffe, A.B.; Stavins, R.N. The energy-efficiency gap what does it mean? Energy Policy 1994, 22, 804–810. [Google Scholar] [CrossRef]
  16. Allcott, H.; Greenstone, M. Is There an Energy Efficiency Gap? J. Econ. Perspect. 2012, 26, 3–28. [Google Scholar] [CrossRef]
  17. Thompson, P.B. Evaluating energy efficiency investments: Accounting for risk in the discounting process. Energy Policy 1997, 25, 989–996. [Google Scholar] [CrossRef]
  18. Araújo, K.; Boucher, J.L.; Aphale, O. A clean energy assessment of early adopters in electric vehicle and solar photovoltaic technology: Geospatial, political and socio-demographic trends in New York. J. Clean. Prod. 2019, 216, 99–116. [Google Scholar] [CrossRef]
  19. Pelenur, M.J.; Cruickshank, H.J. Closing the Energy Efficiency Gap: A study linking demographics with barriers to adopting energy efficiency measures in the home. Energy 2012, 47, 348–357. [Google Scholar] [CrossRef]
  20. Shen, M.; Lu, Y.; Tan, K.Y. Big Five Personality Traits, Demographics and Energy Conservation Behaviour: A Preliminary Study of Their Associations in Singapore. Energy Procedia 2019, 158, 3458–3463. [Google Scholar] [CrossRef]
  21. Roberts, S. Demographics, energy and our homes. Energy Policy 2008, 36, 4630–4632. [Google Scholar] [CrossRef]
  22. Brounen, D.; Kok, N.; Quigley, J.M. Residential energy use and conservation: Economics and demographics. Eur. Econ. Rev. 2012, 56, 931–945. [Google Scholar] [CrossRef]
  23. Goddard, R.; Zhang, L.; Xia, X. Optimal Sizing and Power Sharing of Distributed Hybrid Renewable Energy Systems Considering Socio-Demographic Factors. Energy Procedia 2019, 159, 340–345. [Google Scholar] [CrossRef]
  24. Karatasou, S.; Laskari, M.; Santamouris, M. Determinants of high electricity use and high energy consumption for space and water heating in European social housing: Socio-demographic and building characteristics. Energy Build. 2018, 170, 107–114. [Google Scholar] [CrossRef]
  25. Antonopoulos, C.; Trusty, A.; Shandas, V. The role of building characteristics, demographics, and urban heat islands in shaping residential energy use. City Environ. Interact. 2020, 100021. [Google Scholar] [CrossRef]
  26. Brown, C.; Gorgolewski, M.; Goodwill, A. Using physical, behavioral, and demographic variables to explain suite-level energy use in multiresidential buildings. Build. Environ. 2015, 89, 308–317. [Google Scholar] [CrossRef]
  27. Brown, M.A. The effectiveness of codes and marketing in promoting energy-efficient home construction. Energy Policy 1993, 21, 391–402. [Google Scholar] [CrossRef]
  28. Guerin, D.A.; Yust, B.L.; Coopet, J.G. Occupant Predictors of Household Energy Behavior and Consumption Change as Found in Energy Studies since 1975. Fam. Consum. Sci. Res. J. 2000, 29, 48–80. [Google Scholar] [CrossRef]
  29. Haas, R. Energy efficiency indicators in the residential sector. Energy Policy 1997, 25, 789–802. [Google Scholar] [CrossRef]
  30. Jaffe, A.B.; Stavins, R.N. Dynamic Incentives of Environmental Regulations: The Effects of Alternative Policy Instruments on Technology Diffusion. J. Environ. Econ. Manag. 1995, 29, S43–S63. [Google Scholar] [CrossRef]
  31. Pacala, S.; Socolow, R. Stabilization Wedges: Solving the Climate Problem for the Next 50 Years with Current Technologies. Science 2004, 305, 968–972. [Google Scholar] [CrossRef] [Green Version]
  32. Transue, M.; Felder, F.A. Comparison of energy efficiency incentive programs: Rebates and white certificates. Util. Policy 2010, 18, 103–111. [Google Scholar] [CrossRef]
  33. U.S. Energy Information Administration. Monthly Energy Review; U.S. Energy Information Administration: Washington, DC, USA, 2018.
  34. New York City Mayor’s Office of Sustainability. Greener, Greater Buildings Plan; New York City Mayor’s Office of Sustainability: New York, NY, USA, 2018.
  35. City of New York. Mayor de Blasio Announces New Energy Efficiency Program for Apartment Buildings; City of New York: New York, NY, USA, 2016.
  36. U.S. Environmental Protection Agency. Energy Star for Buildings; U.S. Environmental Protection Agency: Washington, DC, USA, 2018.
  37. U.S. Environmental Protection Agency. Interpret Your Results: What Your 1–100 EnergyStar Score Means; U.S. Environmental Protection Agency: Washington, DC, USA, 2018.
  38. Fishbein, M.; Ajzen, I. Predicting and Changing Behavior: The Reasoned Action Approach, 1st ed.; Psychology Press: London, UK, 2009. [Google Scholar]
  39. Fishbein, M.; Ajzen, I. Belief, Attitude, Intention and Behavior: An Introduction to Theory and Research; Addison-Wesley Publishing: Boston, MA, USA, 1975. [Google Scholar]
  40. Hewitt, E.L.; Andrews, C.J.; Senick, J.A.; Wener, R.E.; Krogmann, U.; Allacci, M.S. Distinguishing between green building occupants’ reasoned and unplanned behaviours. Build. Res. Inf. 2016, 44, 119–134. [Google Scholar] [CrossRef]
  41. Ouellette, J.A.; Wood, W. Habit and intention in everyday life: The multiple processes by which past behavior predicts future behavior. Psychol. Bull. 1998, 124, 54–74. [Google Scholar] [CrossRef]
  42. Landis, D.; Triandis, H.C.; Adamopoulos, J. Habit and Behavioral Intentions as Predictors of Social Behavior. J. Soc. Psychol. 1978, 106, 227–237. [Google Scholar] [CrossRef]
  43. Chen, C.-F.; Chao, W.-H. Habitual or reasoned? Using the theory of planned behavior, technology acceptance model, and habit to examine switching intentions toward public transit. Transp. Res. Part F Traffic Psychol. Behav. 2011, 14, 128–137. [Google Scholar] [CrossRef]
  44. Verplanken, B.; Wood, W. Interventions to Break and Create Consumer Habits. J. Public Policy Mark. 2006, 25, 90–103. [Google Scholar] [CrossRef] [Green Version]
  45. Kaza, N. Understanding the spectrum of residential energy consumption: A quantile regression approach. Energy Policy 2010, 38, 6574–6585. [Google Scholar] [CrossRef]
  46. Yun, G.Y.; Steemers, K. Behavioural, physical and socio-economic factors in household cooling energy consumption. Appl. Energy 2011, 88, 2191–2200. [Google Scholar] [CrossRef]
  47. Poyer, D.A.; Henderson, L.; Teotia, A.P.S. Residential energy consumption across different population groups: Comparative analysis for Latino and non-Latino households in USA. Energy Econ. 1997, 19, 445–463. [Google Scholar] [CrossRef]
  48. Fumo, N.; Biswas, M.A.R. Regression analysis for prediction of residential energy consumption. Renew. Sustain. Energy Rev. 2015, 47, 332–343. [Google Scholar] [CrossRef]
  49. Levy, J.I.; Woo, M.K.; Tambouret, Y. Energy savings and emissions reductions associated with increased insulation for new homes in the United States. Build. Environ. 2016, 96, 72–79. [Google Scholar] [CrossRef]
  50. Mostafavi, N.; Farzinmoghadam, M.; Hoque, S. Urban residential energy consumption modeling in the Integrated Urban Metabolism Analysis Tool (IUMAT). Build. Environ. 2017, 114, 429–444. [Google Scholar] [CrossRef]
  51. Wang, Y.; Hewitt, E.L. Plug-in Electric Vehicle (PEV) Adoption in U.S. Transport for Policy. In Proceedings of the 2019 International Energy and Sustainability Conference (IESC), Farmingdale, NY, USA, 17–18 October 2019; pp. 1–21. [Google Scholar] [CrossRef]
  52. Murray, A.G.; Mills, B.F. Read the label! Energy Star appliance label awareness and uptake among U.S. consumers. Energy Econ. 2011, 33, 1103–1110. [Google Scholar] [CrossRef]
  53. Santin, O.G. Behavioural Patterns and User Profiles related to energy consumption for heating. Energy Build. 2011, 43, 2662–2672. [Google Scholar] [CrossRef]
  54. Pilkington, B.; Roach, R.; Perkins, J. Relative benefits of technology and occupant behaviour in moving towards a more energy efficient, sustainable housing paradigm. Energy Policy 2011, 39, 4962–4970. [Google Scholar] [CrossRef]
  55. Ward, D.O.; Clark, C.D.; Jensen, K.L.; Yen, S.T.; Russell, C.S. Factors influencing willingness-to-pay for the ENERGY STAR® label. Energy Policy 2011, 39, 1450–1458. [Google Scholar] [CrossRef]
  56. Yan, S.; Lifang, F. Influence of psychological, family and contextual factors on residential energy use behaviour: An empirical study of China. Energy Procedia 2011, 5, 910–915. [Google Scholar] [CrossRef] [Green Version]
  57. U.S. Energy Information Administration. Residential Energy Consumption Survey (RECS): Using the 2015 Microdata File to Compute Estimates and Standard Errors (RSEs); U.S. Energy Information Administration: Washington, DC, USA, 2017.
  58. U.S. Energy Information Administration. Residential Energy Consumption Survey (RECS) 2015 Technical Documentation Summary; U.S. Energy Information Administration: Washington, DC, USA, 2017.
  59. U.S. Energy Information Administration. 2015 RECS—A Household Survey (Self-Administered Paper Version); U.S. Energy Information Administration: Washington, DC, USA, 2015.
  60. Jridi, O.; Bargaoui, S.A.; Nouri, F.Z. Household preferences for energy saving measures: Approach of discrete choice models. Energy Build. 2015, 103, 38–47. [Google Scholar] [CrossRef]
  61. Jan, I. Adoption of improved cookstoves in Pakistan: A logit analysis. Biomass Bioenergy 2017, 103, 55–62. [Google Scholar] [CrossRef]
  62. Bird, S.; Hernández, D. Policy options for the split incentive: Increasing energy efficiency for low-income renters. Energy Policy 2012, 48, 506–514. [Google Scholar] [CrossRef] [Green Version]
  63. Charlier, D. Energy efficiency investments in the context of split incentives among French households. Energy Policy 2015, 87, 465–479. [Google Scholar] [CrossRef]
  64. Maruejols, L.; Young, D. Split incentives and energy efficiency in Canadian multi-family dwellings. Energy Policy 2011, 39, 3655–3668. [Google Scholar] [CrossRef] [Green Version]
  65. Panayotou, T.; Zinnes, C. Free-Lunch Economics for Industrial Ecologists. In Industrial Ecology and Global Change; Cambridge University Press: Cambridge, UK, 1994; pp. 383–398. [Google Scholar]
  66. Hewitt, E. Organizational characteristics in residential rental buildings: Exploring the role of centralization in energy outcomes. In Handbook of Sustainability and Social Science Research; Springer International Publishing: Basel, Switzerland, 2017. [Google Scholar]
  67. New York State Energy Research and Development Authority (NYSERDA). Home Performance Assessment Application; New York State Energy Research and Development Authority (NYSERDA): Albany, NY, USA, 2018.
  68. Palmer, K.; Walls, M.; O’Keeffe, L. Putting information into action: What explains follow-up on home energy audits? Resour. Future 2015, 15–34. [Google Scholar] [CrossRef]
Figure 1. Audit odds plotted with age.
Sustainability 12 02059 g001
Table 1. Dependent variable AUDIT 1.
Frequency%
Home Has Not Had Audit463091.00
Home Has Had Audit4589.00
1 Source: RECS 2015 v2.
Table 2. Descriptive Statistics by household demographics and home characteristics on AUDIT 2.
DescriptionMeanStd.Dev.Obs.Range
Dependent Variable
AuditHome has had an energy audit0.0900.28650880–1
Focal Independent Variables (Household Demographics)
hhsexFemale or Male1.4390.49656861–2
employhhHouseholders is employed full-time0.7040.66056860–2
moneypyAnnual gross household income for the last year3.6702.22956861–8
sdescentHouseholder is Hispanic or Latino0.1270.33356860–1
hhageAge of householder in years52.29717.015568618–85
collegeHouseholder holds college degree0.6920.46256860–1
nonwhiteHouseholder is non-white0.1840.38756860–1
Additional Control Variables: Home Characteristics and Other Energy Variables
singlefamHouse is single family attached or detached0.7100.45356860–1
hdd65Heating degree days in 2015, best temperature 65F3707.8492149.27356860–9843
cdd65Cooling degree days in 2015, best temperature 65F1719.2061193.56356860–6607
totsqft_enTotal square footage2081.4441282.6605686221–8501
kownrentOwn or rent1.3200.48956861–3
yearmaderangeRange when housing unit was built4.3232.12556851–8
walltypeMajor outside wall material2.8331.61456861–9
rooftypeMajor roofing material4.5411.33148281–9
bedroomsNumber of bedrooms2.8331.10656860–10
ncombathNumber of full bathrooms1.7460.74756860–6
equipageAge of main space heating equipment15.72318.08954291–42
highceilHome has higher than average ceiling0.3650.48154000–1
eswaterEnergy Star qualified water heating0.3850.48747240–1
esfreezeEnergy Star qualified freezer0.3890.48817000–1
draftyFrequency of draft3.3590.76656861–4
nweightFinal sample weight20,789.35011,345.4605686983.791–158,078.6
2 Source: RECS 2015 v2.
Table 3. Maximum Likelihood Regression Estimates of 2015 AUDIT 3,4.
Model 1.Model 2. Household DemographicsModel 3. Home Characteristics
Independent Variables
hhsex−0.147−0.036
0.8630.965
(0.109)(0.100)
employhh0.0700.070
1.0761.073
(0.090)(0.083)
moneypy−0.0150.013
0.9851.013
(0.030)(0.024)
sdescent0.2160.159
1.2411.172
(0.186)(0.157)
hhage0.019 ***0.022 ***
1.0191.022
(0.004)(0.003)
college0.2830.184
1.3271.202
(0.132)(0.118)
nonwhite0.436 **0.206
1.5471.229
(0.144)(0.130)
singlefam0.032 −0.060
1.0320.942
(0.179)(0.177)
hdd650.000 0.000
1.0001.000
(0.000)(0.000)
cdd650.000 0.000
1.0001.000
(0.000)(0.000)
totsqft_en−0.000 −0.000
1.0001.000
(0.000)(0.000)
kownrent−0.413 −0.559 **
0.6610.572
(0.177)(0.173)
yearmaderange−0.070 −0.079
0.9330.924
(0.029)(0.029)
walltype−0.007 −0.007
0.9940.993
(0.036)(0.036)
rooftype0.008 0.009
1.0091.009
(0.042)(0.042)
baderooms0.112 0.095
1.1181.100
(0.071)(0.070)
ncombath0.098 0.097
1.1031.102
(0.095)(0.092)
equipage0.000 0.000
1.0001.000
(0.003)(0.003)
highceil0.150 0.150
1.1611.161
(0.117)(0.116)
drafty−0.113 −0.086
0.8930.918
(0.076)(0.074)
nweight−0.000−0.000−0.000
1.0001.0001.000
(0.000)(0.000)(0.000)
Constant−3.095 ***−3.539 ***−1.625 **
0.0451.0290.197
(0.658)(0.317)(0.562)
Pseudo R-square0.0260.0170.013
Number of households405450884054
3 * indicates * p < 0.05, ** indicates p < 0.01, and *** p < 0.001. 4 The first number is the unstandardized coefficient, the second number is the odds ratio, and the third number in the parentheses is the standard error.

