Article

Summer Outdoor Thermal Comfort in Urban Commercial Pedestrian Streets in Severe Cold Regions of China

1
School of Architecture, Harbin Institute of Technology, Harbin 150001, China
2
Key Laboratory of Cold Region Urban and Rural Human Settlement Environment Science and Technology, Ministry of Industry and Information Technology, Harbin 150001, China
*
Author to whom correspondence should be addressed.
Sustainability 2020, 12(5), 1876; https://doi.org/10.3390/su12051876
Submission received: 6 January 2020 / Revised: 18 February 2020 / Accepted: 27 February 2020 / Published: 2 March 2020
(This article belongs to the Section Social Ecology and Sustainability)

Abstract

:
This paper investigates outdoor thermal comfort in summer in commercial pedestrian streets in Harbin, using meteorological measurements and questionnaire surveys (1013 valid questionnaires). The results demonstrate that: (1) Thermal sensation has a lower range in an outdoor environment with smaller sky view factor (SVF) and less fluctuation, while the thermal sensation vote (TSV) range is more dispersed in an outdoor environment with larger SVF and more fluctuation; (2) In the urban, high-density commercial districts in Harbin, the air temperature and solar radiation have a greater influence on outdoor thermal sensation, while wind speed has less of an influence, and residents in areas with less fluctuations are more sensitive to air temperature and solar radiation; (3) The universal thermal climate index (UTCI) can accurately evaluate outdoor thermal comfort in Harbin in summer, with a neutral UTCI value of 19.3 °C and a range from 15.6 to 23.0 °C; (4) The actual acceptable thermal range is 16.8–29.3 °C, and this takes into account the psychological adaptation of the residents, which provides a more practical reference value; (5) With reference to the psychological adaptation, the outdoor thermal sensation of residents in early summer is about 0.5 TSV higher than that in late summer. These results provide a theoretical basis and a technical reference for the design of commercial pedestrian streets in severe cold regions.

1. Introduction

With the current trend towards urbanization, global warming and the urban heat island are attracting increasing attention, while heat loads and outdoor thermal stress in densely populated areas are increasing [1]. Extreme weather conditions may lead to increased heat stress, resulting in physical discomfort and even death [2,3]. A suitable outdoor environment not only improves the livability of a city by facilitating a higher frequency of commercial and recreational activities but also reduces energy consumption inside buildings by attracting people to spend more time outdoors. In summer, there is a surge in the outdoor activities of residents from severe cold regions, and commercial pedestrian streets are crowded. The outdoor thermal comfort level is of great significance in improving the quality of external space and promoting regional economic development. Therefore, the question of outdoor thermal comfort in commercial pedestrian streets in summer in severe cold regions demands further attention.
Several scholars have shown that the human thermal sensation is closely related to outdoor meteorological parameters, but this correlation varies in different climatic zones. For instance, Lin et al. found in Taiwan that residents’ thermal sensation had a strong correlation to air temperature and mean radiant temperature and a weak correlation with wind speed and relative humidity [4]. Lai et al. found that the air temperature in Tianjin is the main factor affecting human thermal sensation, followed by solar radiation and relative humidity [5]. In 2019, Xu et al. concluded that air temperature and solar radiation are the main physical factors affecting outdoor thermal comfort in Xi’an [6]. In the arid region, Ruiz et al. found the highest correlation between human body heat sensation and temperature in Mendoza, Argentina [7]. In the Mediterranean region, Nikolopoulou found that air temperature and solar radiation are the main factors affecting outdoor thermal comfort and the utilization of space in Athens, Greece [8]. Aha Mahmoud found that each microclimate features different effects of solar radiation and wind speed, which affected residents’ thermal perception in Cairo, Egypt [9]. These results show that, in different climate zones, the factors that influence human thermal sensation are different. Therefore, it is necessary to study the thermal sensation of the human body and the characteristics of the outdoor thermal environment in the severe cold region to support the design-decision making process for commercial buildings in this region.
Different spatial scales and forms have a certain impact on the outdoor thermal environment, and this affects the human thermal sensation. The impact is most significant in complex urban street spaces. Relevant studies show that urban canyons account for two-thirds of urban space and therefore play an important role in radiation balance and outdoor thermal comfort [10,11]. In 2006, Johansson performed an experimental study on street space of two different scales in two urban districts in Morocco, and the results show that a compact block morphology is conducive to shading and improved outdoor thermal comfort in summer but with reduced outdoor thermal comfort in winter [12]. In 2010, F. Bourbia et al. concluded that, in a semi-arid climate, the higher the length-width ratio, the lower the street air temperature and the lower the building surface temperature [13]. In 2014, Qaid et al. found that the average aspect ratio of street spaces has a significant impact on the thermal environment comfort level [14]. According to the simulation results from Xiao et al. on Guangzhou blocks in 2019, a street with a north/south orientation in a point block with the canyon aspect ratio (H/W) above two provides significantly improved outdoor thermal comfort at pedestrian height, while streets with east/west orientation are recommended for arcades [15]. Elmira Jamei et al. summarized the effects of aspect ratio, street orientation, sky perspective factor, local and neighborhood scale on the outdoor thermal comfort of streets and found that most studies focus on hot and humid climates, hot and dry climates, Mediterranean climates, subtropical climates and other areas [16], with little relevant research carried out in the severe cold regions of China, particularly in urban commercial streets with complex spatial scales.
One of the principal research methods to evaluate outdoor thermal comfort level is through quantitative indicators. In order to select the most appropriate indicator for scientific evaluation, several studies have been carried out on the outdoor thermal environment in different climate zones. In 2017, Freitas et al. summarized 165 outdoor thermal comfort indicators that have been used to simulate human thermal perceptions. Various thermal indicators were rated based on six factors, including comprehensiveness, scope, complexity, transparency, availability and effectiveness, of which, the universal thermal climate index (UTCI) was 27, the physiological equivalent temperature (PET) 26 and the predicted mean vote (PMV) 23 [17]. It has also been shown that the UTCI can be applied to the evaluation of the thermal environment in different climates, seasons and latitudes, indicating that it is applicable and has certain advantages in representing human body changes relating to meteorological parameters in a sensitive manner [6,18,19,20]. However, most outdoor thermal comfort studies used to evaluate the UTCI are focused on sub-tropical or temperate climate regions, and little attention has been given to severe cold regions. Therefore, the accuracy of the UTCI in severe cold regions requires further verification.
Previous studies on the outdoor thermal environment in severe cold regions focus on the winter [21,22]. Designers examine how to minimize the effect of the cold winter winds through the reasonable layout of building groups, but there is insufficient consideration for natural ventilation and the outdoor thermal environment in summer. In addition, there are diverse business formats in commercial districts, and some of these layouts have a heat exhaust effect on the outdoor space, thus affecting the outdoor thermal comfort levels. Therefore, this paper focuses on the outdoor thermal environment of urban commercial pedestrian streets in severe cold regions in summer. By combining meteorological measurements and a subjective questionnaire, this paper investigates outdoor thermal comfort in a commercial pedestrian street in Harbin under different spatial scales. At the same time, the suitability of the UTCI in severe cold regions in summer is verified, and values for the neutral UTCI, neutral UTCI range and actual thermal acceptability range are obtained.

2. Methods

2.1. The Site

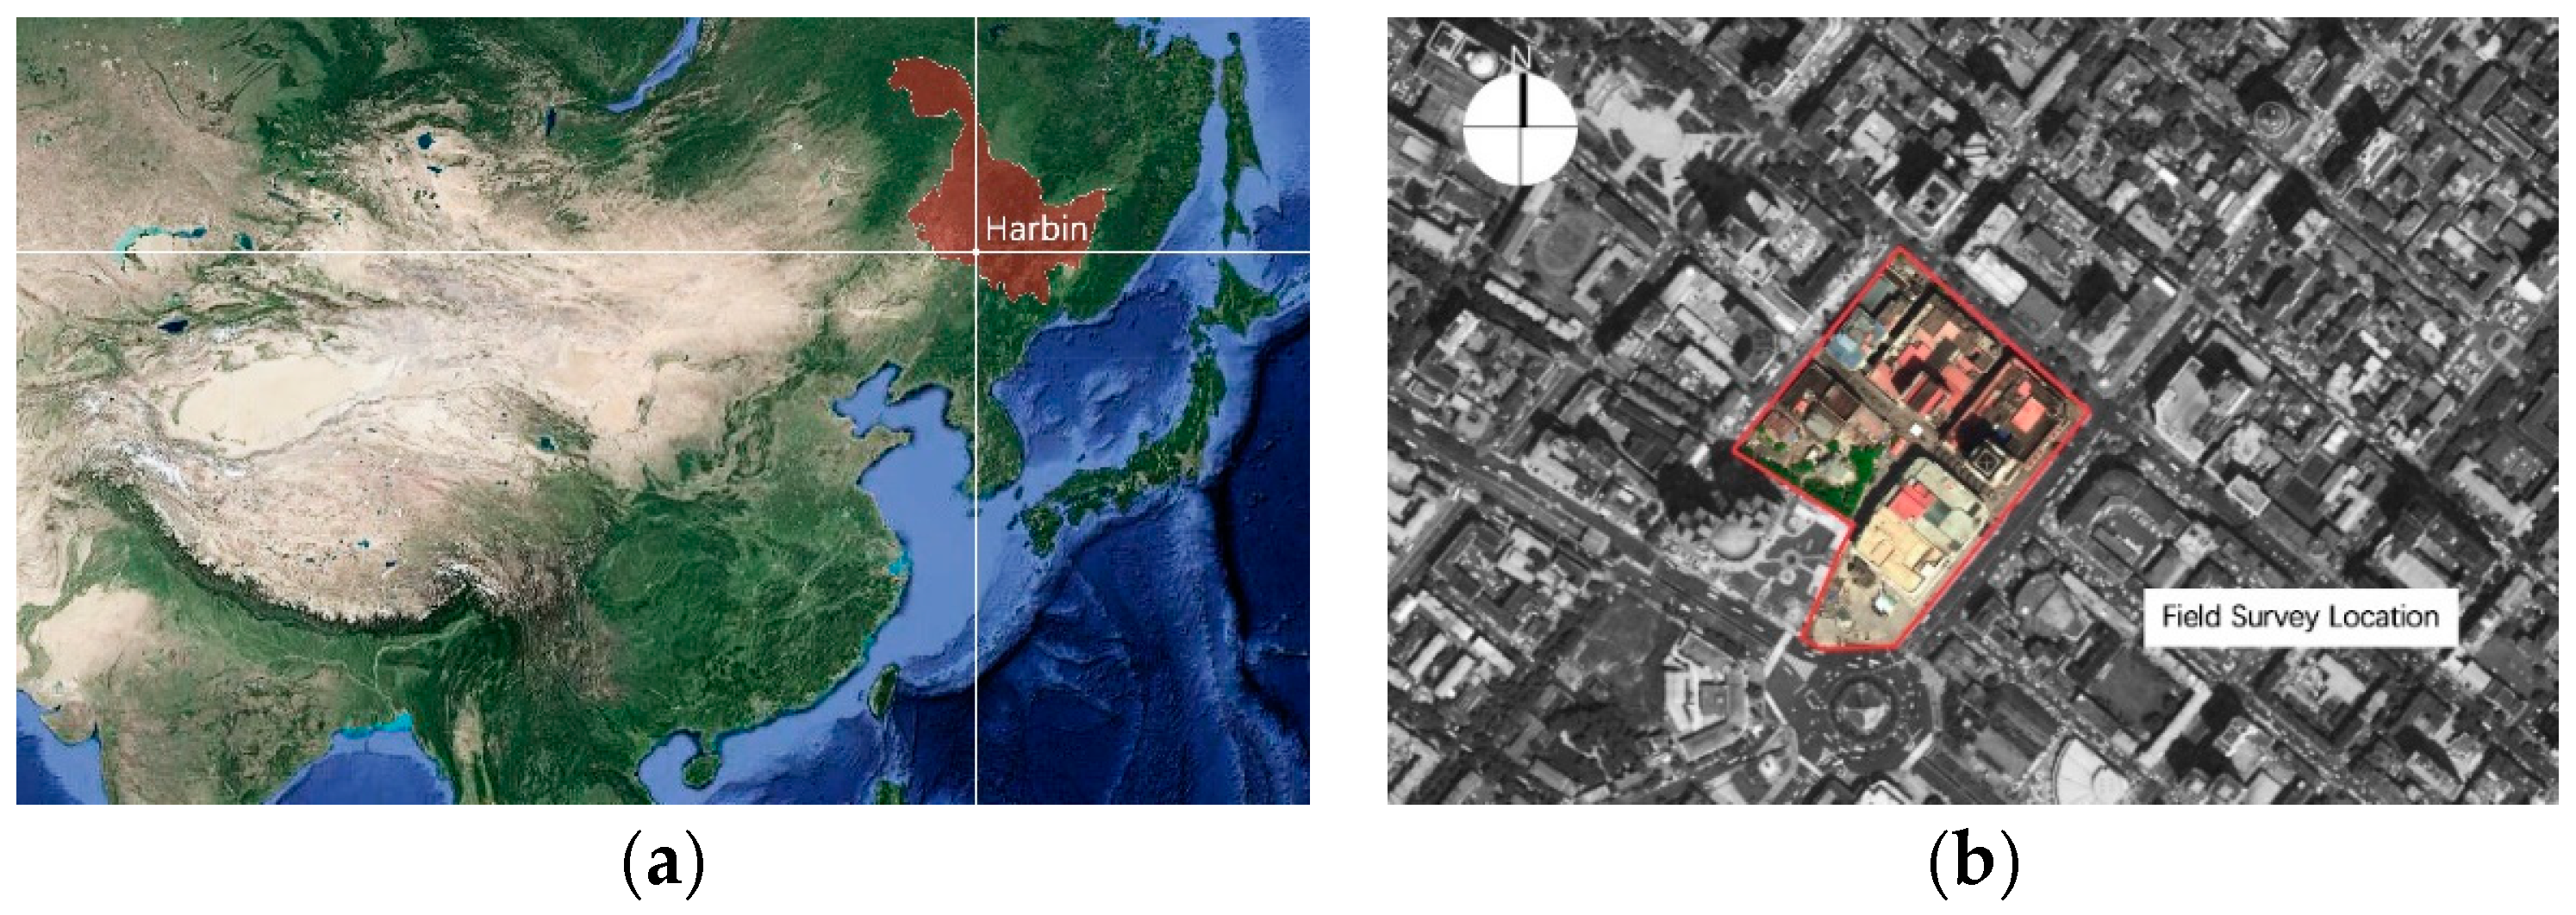
Harbin (125°42′–130°10′ E, 44°04′–46°40′ N) is located in the northeast of China. According to the Koppen climate classification system, the climate in Harbin is Dwa, characterized by cold, dry snowy winters and slightly hot and rainy summers [23]. Figure 1 shows the monthly mean temperature, maximum temperature, minimum temperature and mean relative humidity in Harbin city from 1981 to 2010 (according to data from the official China Meteorological Administration website). The annual average temperature difference in Harbin exceeds 40 °C, and the highest monthly average temperature for the year occurs in July (27.8 °C), the lowest monthly average temperature occurs in January (−22.9 °C) and the monthly average relative humidity is between 48% and 78%.
The study site is located in an urban commercial district in Harbin (Figure 2). It consists of a pedestrian street with a NW-SE orientation, three auxiliary streets with a NE-SW orientation and an open square. This work considers the commercial pedestrian streets as the research objects. The length of the NW-SE street is about 230 m. The two auxiliary streets on the north are about 105 m long, and the auxiliary street on the south is about 120 m long. This area includes a high-rise office building, a high-rise apartment and commercial buildings of different heights, with diverse functions and scales. As a result, the outdoor environment in different locations varies greatly, and the shielding effect of buildings on the site varies at different times during the day.

2.2. Field Survey

2.2.1. Meteorological Parameter Measurements

Measurements in this study were performed on eight occasions from June 15, 2019 to August 15, 2019. In order to obtain sufficient samples to cover the activity time of commercial crowds, each measurement was set up from 9:30 to 17:30 on weekends, and a questionnaire survey was conducted to assess the outdoor thermal comfort of the pedestrian shoppers. Four measuring points: A, B, C and D were set up on the commercial pedestrian streets, distributed along the NW-SE pedestrian street and one of the NE-SW auxiliary streets (Figure 3). The buildings on both sides of point A are a high-rise office building and a high-rise commercial building, which are shaded for a considerable time. The street width is 21 m, which is typical of a street canyon space. Point B is the square node in the street, with greater width scale and strong solar radiation. Point C is located at the intersection of the streets, and the height of the surrounding buildings is from 24 to 36 m. Point D is located in one of the NE-SW auxiliary streets. This street is 7-m-wide, and the buildings on both sides are 24-m-high.
The sky view factor (SVF) refers to the ratio of the radiation received by a planar surface to the radiation emitted by the entire hemispheric environment [24,25], and it is typically represented by a dimensionless value between 0 and 1. The SVF is also related to urban environment geometric parameters [16,26], which can be combined with influencing factors such as buildings, trees and landscape to reflect the real space scale [27]. Several studies have pointed out that the SVF, which is an appropriate parameter to describe urban geometry [28], is closely related to outdoor thermal comfort [6,20,29,30,31]. To evaluate the spatial scale of each measuring point more comprehensively, the sky view factor (SVF) is applied as a quantitative indicator for the different locations. It is found that the SVF at each measuring point is significantly different, which proves that the selected measurement points have significant variances and can therefore represent the spatial morphology of different characteristics in the study area.
In the field measurement experiments, meteorological parameters, including air temperature (Ta), relative humidity (RH), globe temperature (Tg), wind speed (Va) and wind direction were measured. Ta, RH and Tg were recorded using a Testo 480 (Testo SE & Co. KGaA, Titisee-Neustadt, Germany). Va and wind direction were recorded using a Kestrel N5500 (Nielsen-Kellerman Co., Boothwyn, PA, USA). All instruments comply with the ISO 7726 standard [32]. Table 1 details the sensors used to measure the meteorological parameters. All instruments were set up 1.5 m above ground level [6,20,33,34,35], and the meteorological parameters were recorded every minute. In order to exclude the influence of surrounding buildings on the measured data, all instruments were located a minimum of two meters away from nearby buildings.

2.2.2. Questionnaire Survey

The subjective questionnaire designed for this study consists of two parts (Table 2). The first part records personal information, including gender, age, location, activity level, clothing and time of submission. The second part examines four aspects: the thermal sensation vote (TSV), the overall comfort vote (OCV), the preference vote for each meteorological parameter and the thermal acceptability vote. The thermal sensation vote (TSV) uses the modified ASHRAE 7-point scale (i.e., −3, cold; −2, cool; −1, slightly cool; 0, neutral; 1, slightly warm; 2, warm and 3, hot). The overall comfort vote (OCV) uses a 3-point scale (−1, discomfort; 0, neutral and 1, comfortable). The thermal acceptability vote uses a 4-point scale (−2, extremely unacceptable; −1, unacceptable; 1, acceptable and 2, extremely acceptable). The preference vote for each meteorological parameter also uses a 3-point scale (−1, 0 and 1 representing weaker/lower, unchanged and stronger/higher, respectively), reflecting the subject’s need for different meteorological parameters. A total of 1013 valid questionnaires were collected.

2.3. UTCI

The quantitative index for outdoor thermal comfort selected for this study is the universal thermal climate index (UTCI). This is based on the multiple node “Fiala” human physiology and thermal comfort model and combined with the most advanced clothing model. It not only considers the general urban population response to the actual environmental temperature through clothing adaptation behavior but also takes into account the temperature change caused in the human body through the adjustment of clothing, the distribution of the clothing over different body parts and clothing thermal resistance and water vapor evaporation capacity affected by wind speed changes [36].
This study uses a calculator provided by the UTCI official website (www.utci.org) to calculate the UTCI. The meteorological parameters input include air temperature (Ta), relative humidity (RH), wind speed at a height of 10 m above the ground and mean radiant temperature (Tmrt). The air temperature (Ta) and relative humidity (RH) are directly obtained from the mobile weather stations. The wind speed at 10 m height (Va10m) is obtained using Equation (1) using the wind speed values measured at 1.5 m to obtain the wind speed at 10 m height from the ground.
V a 1   =   V a 2 ( Z 1 Z 2 ) α ,
where Va1 is the wind speed at a height of 10 m from the ground (m/s), Va2 is the wind speed at a height of 1.5 m from the ground (m/s), Z1 is 10 m, Z2 is 1.5 m, α is the wind speed correction index with terrain variation and α in this study is 0.33 [37].
The mean radiant temperature (Tmrt) is one of the important factors for the UTCI calculation. This is defined as the uniform ambient temperature in an imaginary enclosure, where the radiant heat transfer from the human body to an enclosure surface is equal to the nonuniform temperature heat transfer to an actual enclosure surface [38]. The calculation of Tmrt is performed to the ISO 7726 standard (ISO 1998) and expressed as:
T mrt = [ ( T g + 273 ) 4 + 1.10 × 10 8 V a 0.6 ε D 0.4 ( T g T a ) ] 1 4 273 ,
where D is globe diameter (D = 0.15 m in this study) and ε is emissivity (ε = 0.95 for a black globe).

3. Results and Discussion

3.1. Results of the Meteorological Parameter Measurements

Table 3 lists the mean value, maximum value and minimum value of the meteorological parameters at each measuring point during the measured period. The lowest air temperature is 17.1 °C, the highest is 39.4 °C and the range is 22.3 °C. The relative humidity fluctuates between 15.5% and 66.6%. The lowest globe temperature is 19.4 °C, the highest is 50.5 °C and the range is 31.1 °C. The instantaneous wind speed at 1.5 m varied between 0.00 and 15.01 m/s.
The meteorological fluctuations at each point have obvious differences. The minimum air temperature (17.1 °C) and globe temperature (19.4 °C) occurred at point A, and the highest air temperature (39.4 °C) and globe temperature (50.5 °C) were measured at point B. The reason was that point A, with a small SVF value (SVFA = 0.222), was flanked by high-rise commercial buildings and high-rise office buildings. The street had a high aspect ratio and was shaded for a long time. Point B (SVFB = 0.402), located in the central square of the commercial district, is an open space with considerable solar radiation and a fluctuating outdoor environment. The SVF values at point C and point D are clearly different (SVFC = 0.388 and SVFD = 0.132), but there is less variation in solar radiation at these points, resulting in relatively less fluctuations in the outdoor environment. Hence, the trends in air temperature and global temperature are relatively consistent. The average wind speed at each measurement point was relatively similar, with the average wind speed at point D being the lowest (0.56 m/s), with the smallest range. It is worth noting that the maximum wind speed at point A (Vmax = 15.01 m/s) was significantly different from other points. The high ratio of street height to width allows the formation of canyon wind at point A, and the wind speed increases instantaneously. The trends in relative humidity at each point are generally consistent. Air temperatures and solar radiation at point B are higher than at the other three points. The wind speed at point A is more variable than that at the other three points, and the changes in the meteorological parameters at point C and point D are relatively limited. The results indicate greater fluctuations in the outdoor environment at point A and point B with less fluctuations and more consistence at point C and point D.

3.2. Results of Outdoor Thermal Sensation Survey

3.2.1. Basic Data

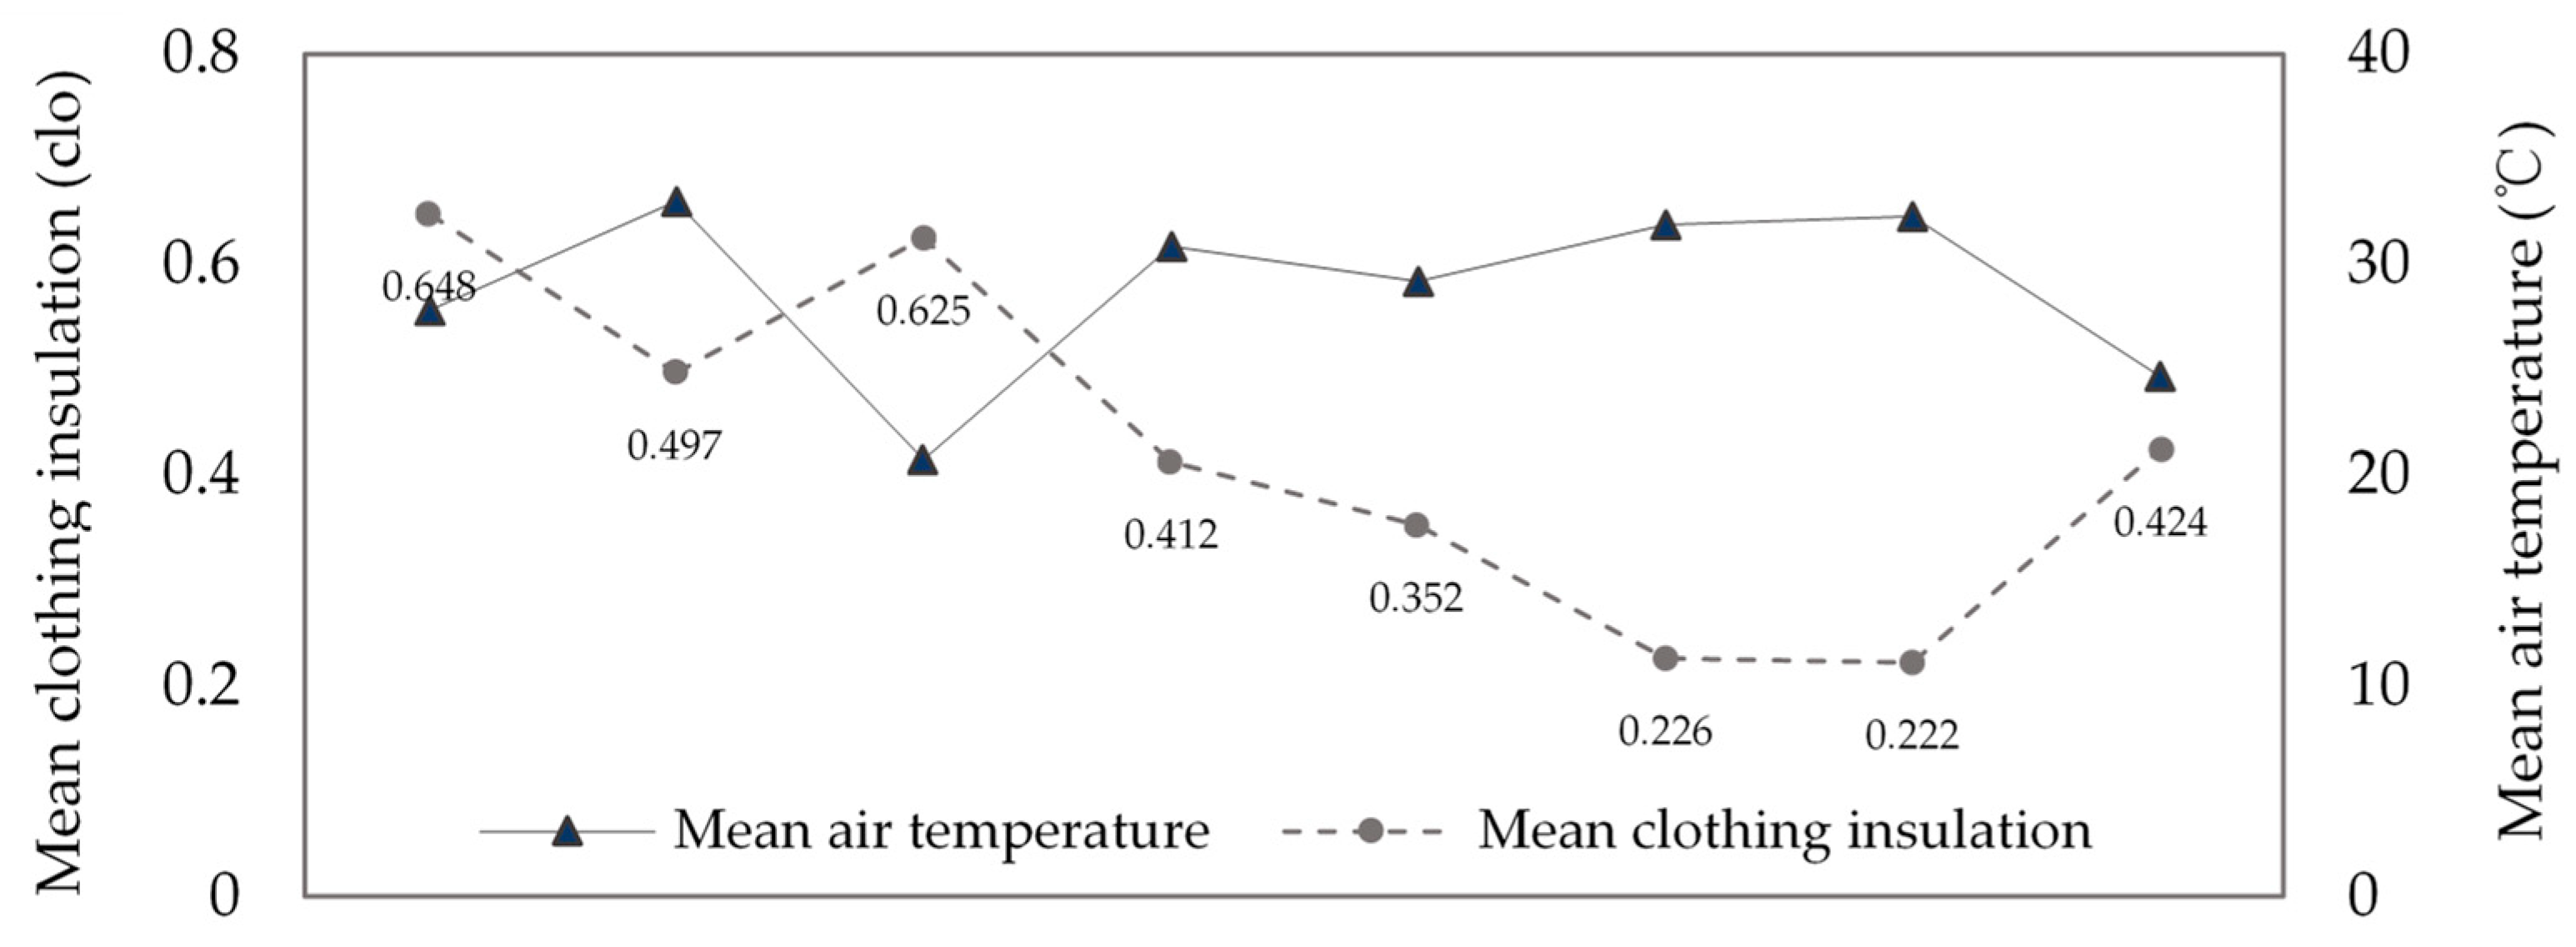
Amongst the 1013 valid questionnaires, there were 47.98% male respondents and 52.02% female respondents, providing a balanced proportion of males and females. During the survey period, “Light exercising” (62.4%) was the primary activity, followed by “Standing” (26.6%). The activity levels are converted to metabolic rates according to the ASHRAE 55 standard, with a calculated metabolic rate of 1.2 MET for standing and 2 MET for walking (Figure 4). According to the statistics for the clothing status of the respondents and the clothing insulation value estimation table compiled to the ISO 7730 standard (2005) [39], the average clothing resistance of people in Harbin in summer is 0.41 clo, and the individual differences in clothing resistance fluctuated between 0.22 and 0.82 clo, with changing trends in the mean clothing insulation consistent with the mean air temperature (Figure 5). Therefore, gender, clothing insulation and activity levels in the commercial pedestrian streets have a minor influence on the subjects’ thermal sensation in summer.

3.2.2. Outdoor Thermal Sensation and Thermal Comfort

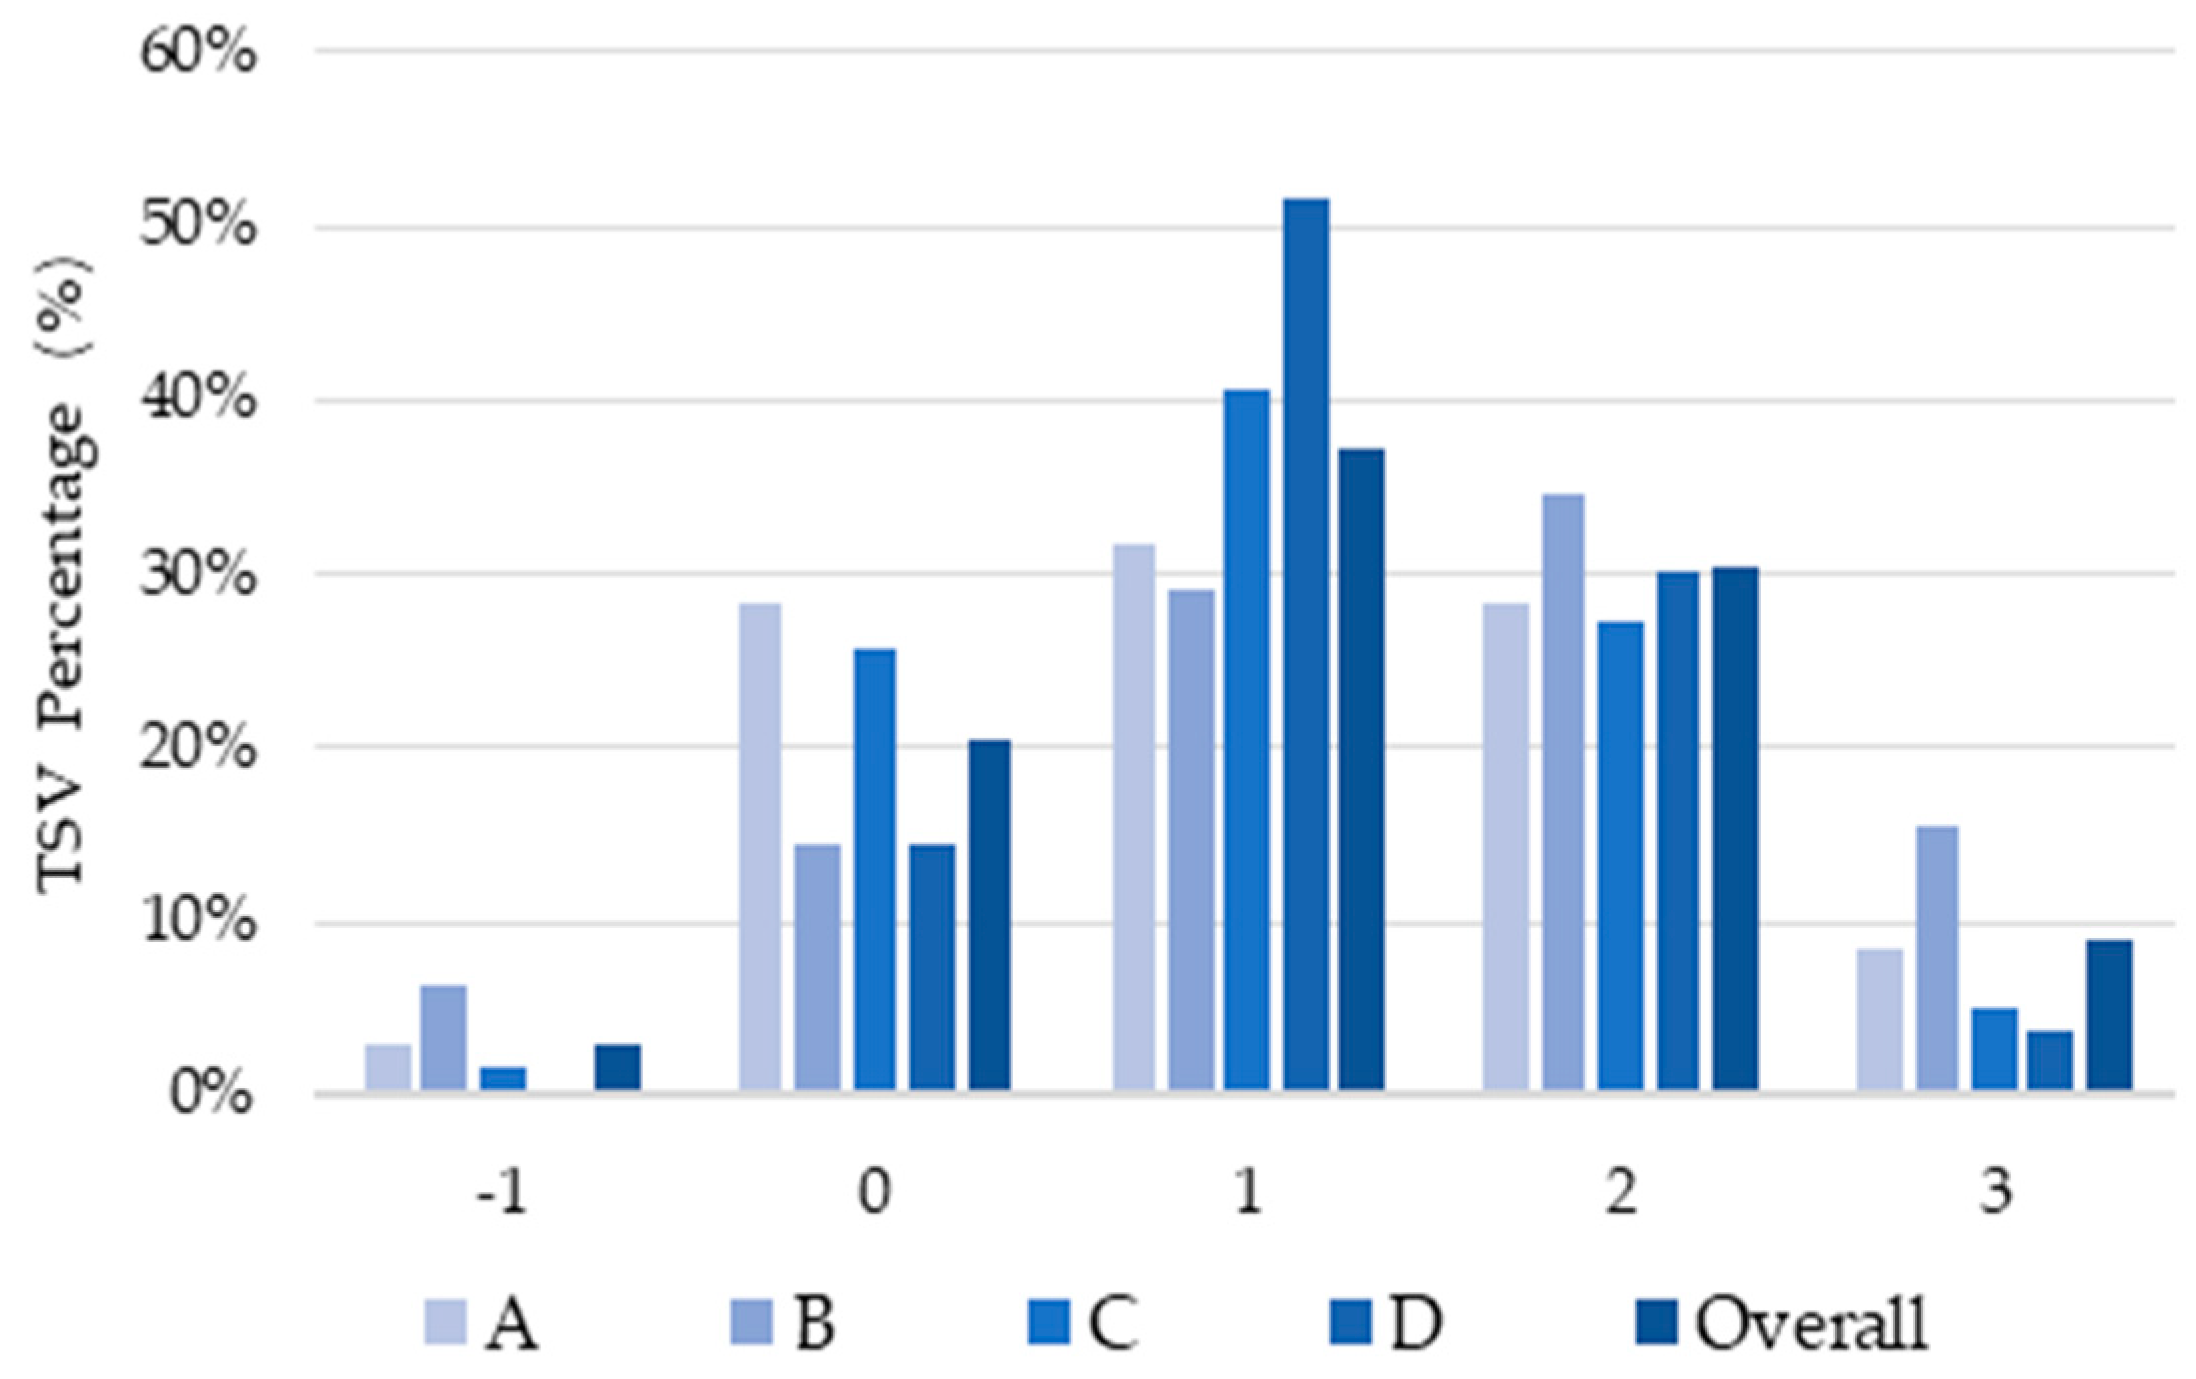
In terms of the outdoor thermal sensation, the distribution of thermal sensations reported by respondents at each point is different (Figure 6). Overall, the main thermal sensation recorded in summer is “Slightly warm” (37.1%), followed by “Warm” (30.4%). In terms of the thermal sensation vote at each point, five different types of TSV were recorded at A, B and C, ranging from “Slightly cool (TSV = −1)” to “Hot (TSV = 3)”, while only four were recorded at D, ranging from “Neutral (TSV = 0)” to “Hot (TSV = 3)”. The TSV at A is evenly distributed between “Neutral (TSV = 0)”, “Slightly warm (TSV = 1)” and “Warm (TSV = 2)”, with “Slightly warm (TSV = 1)” accounting for the largest proportion (31.7%). The TSV distribution at B is quite different, with “Warm (TSV = 2)” accounting for the largest proportion (34.5%). This could be due to the high SVF at point B, with considerable exposure to direct solar radiation. The most common TSV recorded at points C and D is “Slightly warm (TSV = 1)”, accounting for 40.5% and 51.7%, respectively. The proportion of “Slightly cool (TSV = −1)” and “Hot (TSV = 3)” recorded at points A and B, with more fluctuations in the thermal environment, are significantly higher than for points C and D, which have less fluctuations in the thermal environment. This is noticeable at point B with the largest SVF, where “Hot (TSV = 3)” accounts for nearly 20% of measurements at this point. Although points A and C have the same TSV range, the distribution of the TSV measurements at these points is quite different, and the trend at point C is closest to the overall trend. Additionally, it is found that the thermal sensation has a lower range in an outdoor environment with smaller SVF and less fluctuation, while the TSV range is more dispersed in an outdoor environment with larger SVF and more fluctuation.
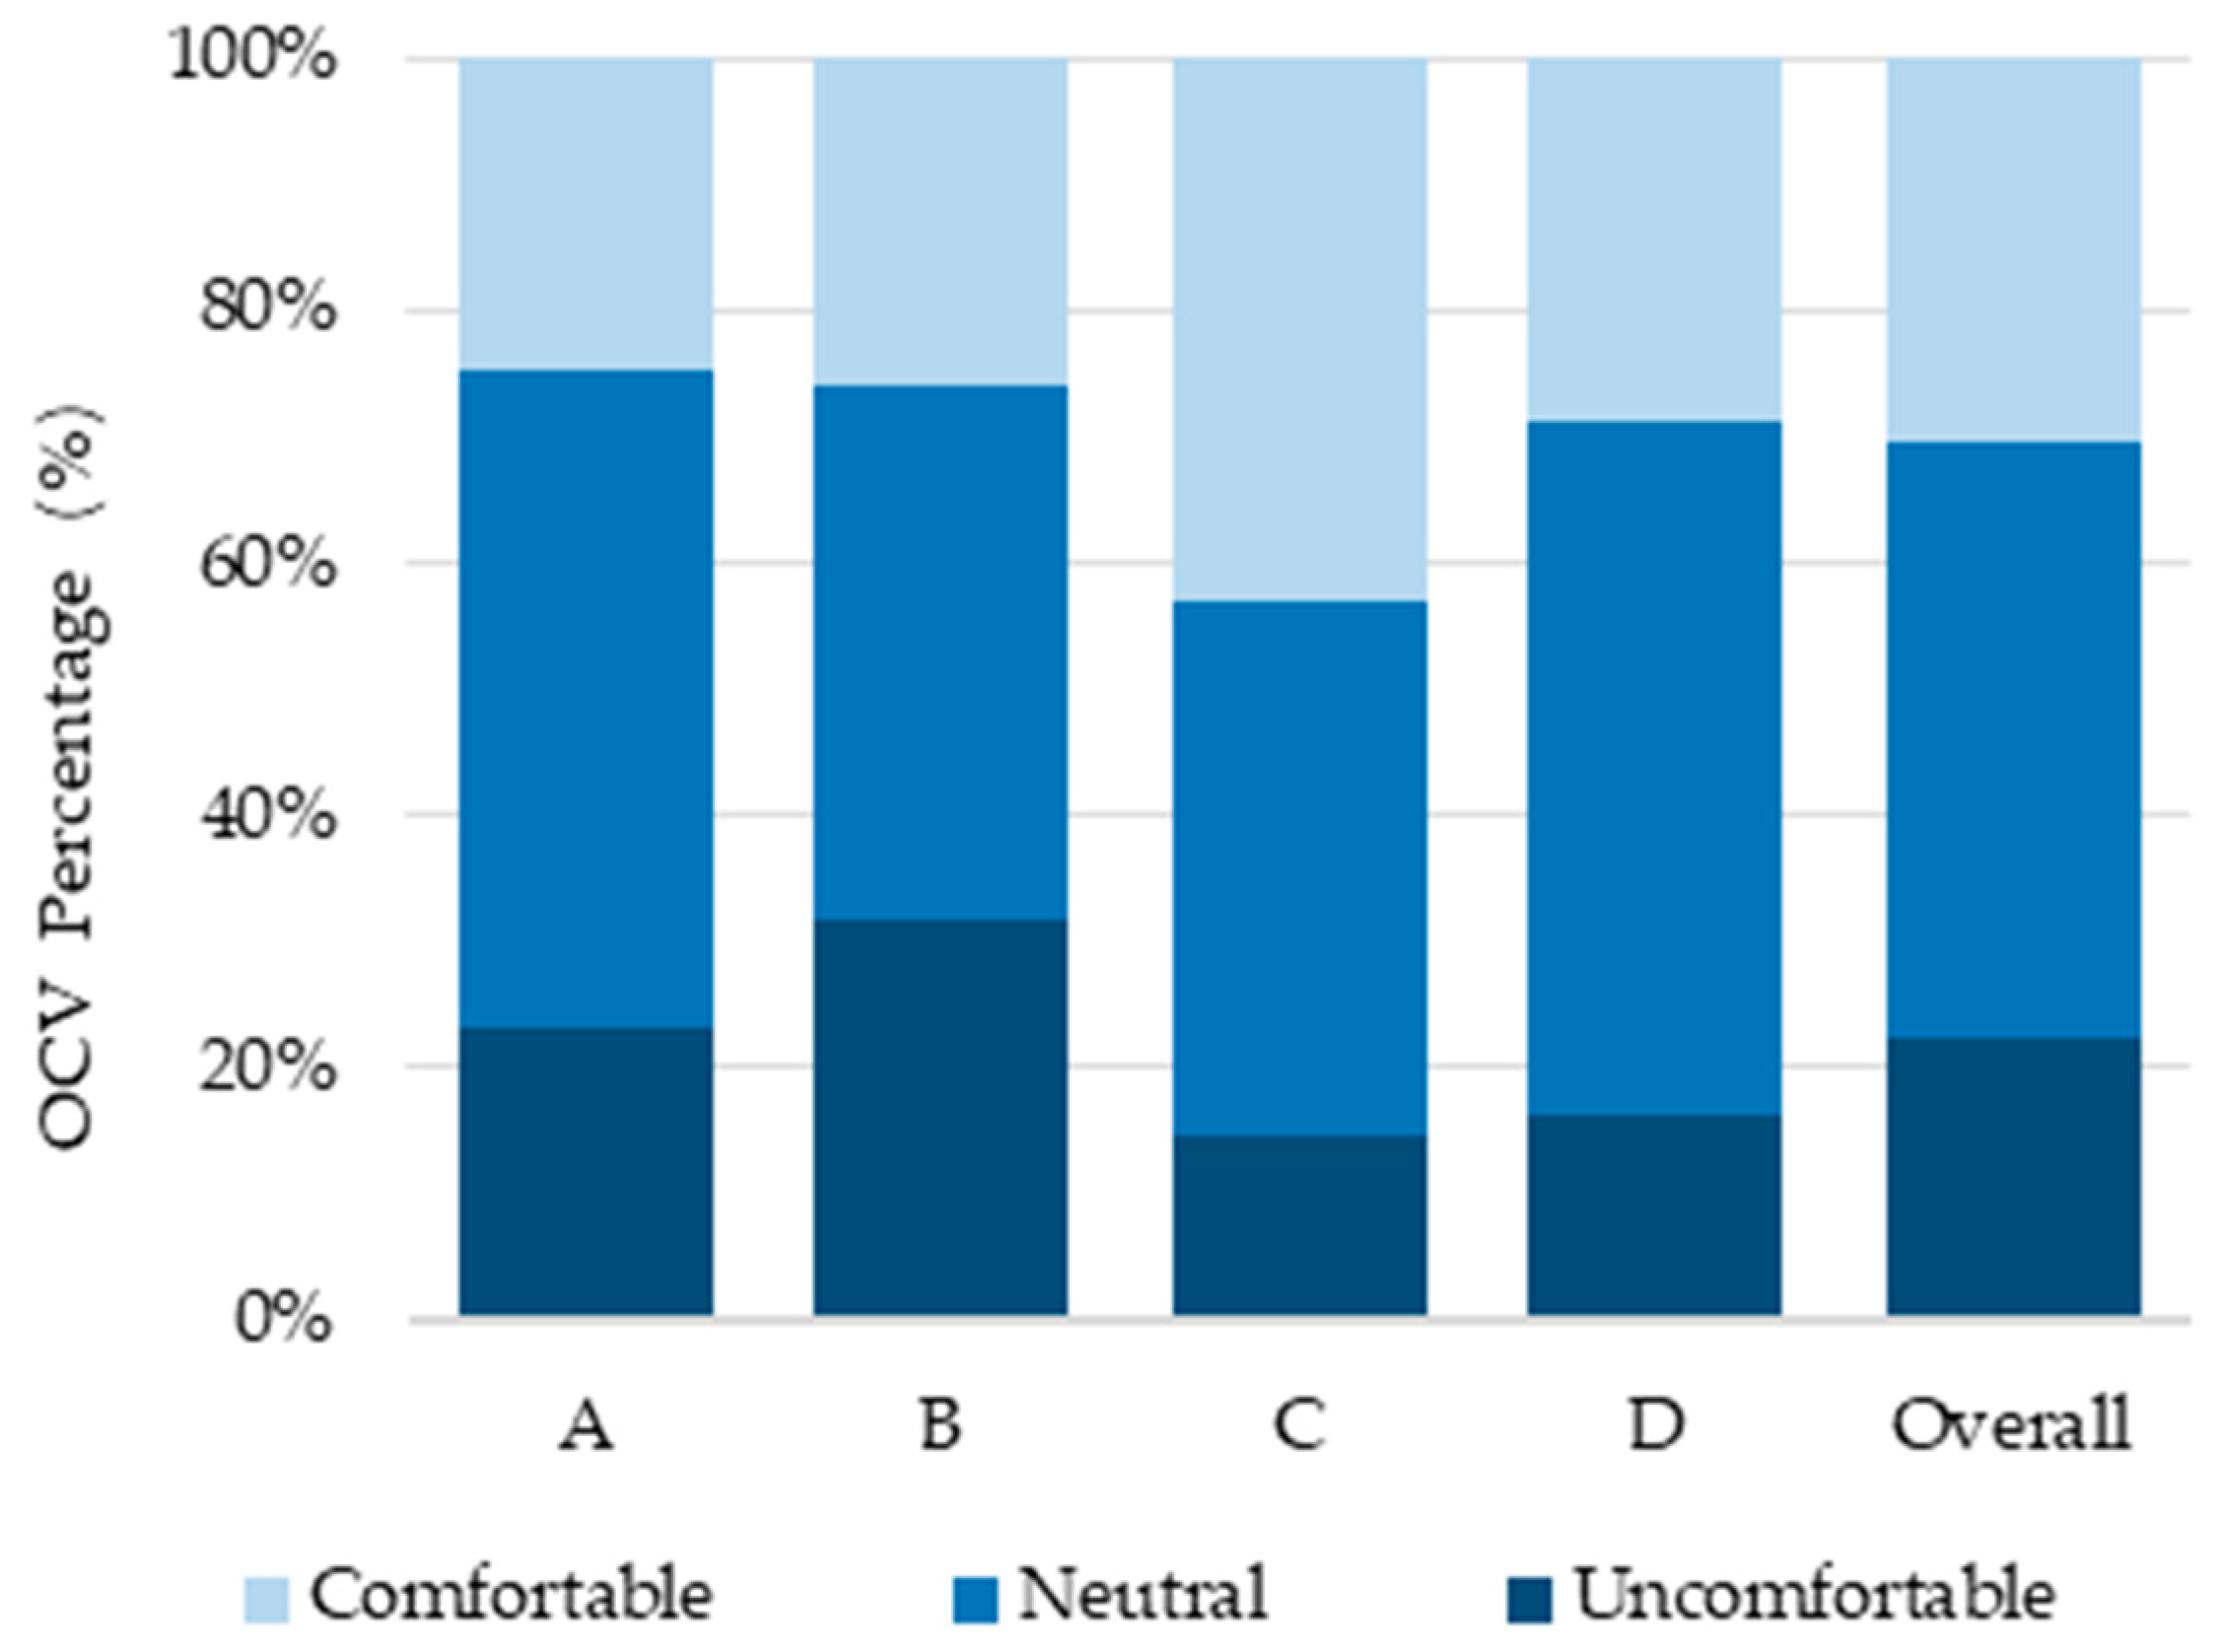
Overall comfort is influenced by many factors, such as the thermal environment, mood and physiology. Figure 7 shows the percentage of subjects at each point voting for each overall comfort level. Among the three points A, B and D, “Neutral” is the most frequent choice (52.0%, 42.4% and 55.0%), while “Comfortable” is the most frequent (43.0%) at point C, followed by D (28.7%). On the whole, “Neutral” (47.3%) is the most common overall comfort vote in summer, and the percentage of respondents reporting “Uncomfortable” is 22.4%. It is of interest that over 20% report “Uncomfortable” at point A and point B, while at point C and point D, this drops to 14.8% and 16.3%, respectively. This suggests that, in severe cold regions in summer, an outdoor environment with more fluctuation is more likely to cause discomfort.
It is seen that there is a strong nonlinear relationship between TSV and OCV. By calculating the OCV mean value for each TSV interval and regression analysis with TSV (Figure 8), a binomial Equation (3) can be obtained. Equation (3) shows that the most comfortable outdoor conditions can be achieved when TSV = −0.2 in severe cold regions in summer.
Y   =   0.126 X 2 0.054 X   +   0.551   ( R 2   =   0.976 ) ,

3.2.3. Effects of Meteorological Parameters on Outdoor Thermal Sensation

To understand the effect of meteorological parameters on human thermal sensation in severe cold regions in summer, this study analyzes the correlation between each meteorological parameter (Ta, RH, Tg and V1.5m) and TSV (Table 4). The results show that all meteorological parameters have a significant correlation to TSV, with air temperature and globe temperature having a positive correlation to TSV and relative humidity and wind speed at 1.5 m having a negative correlation. The air temperature has a slightly greater effect on TSV than globe temperature. This shows that air temperature and solar radiation are the main factors affecting thermal sensation in this area in summer and wind speed has a minor effect. However, these conclusions are limited to high-density commercial districts in severe cold cities and cannot be extended to other urban functional areas. Therefore, more comprehensive surveys are necessary to explore the effects of various meteorological parameters on the thermal sensation of residents of severe cold regions.
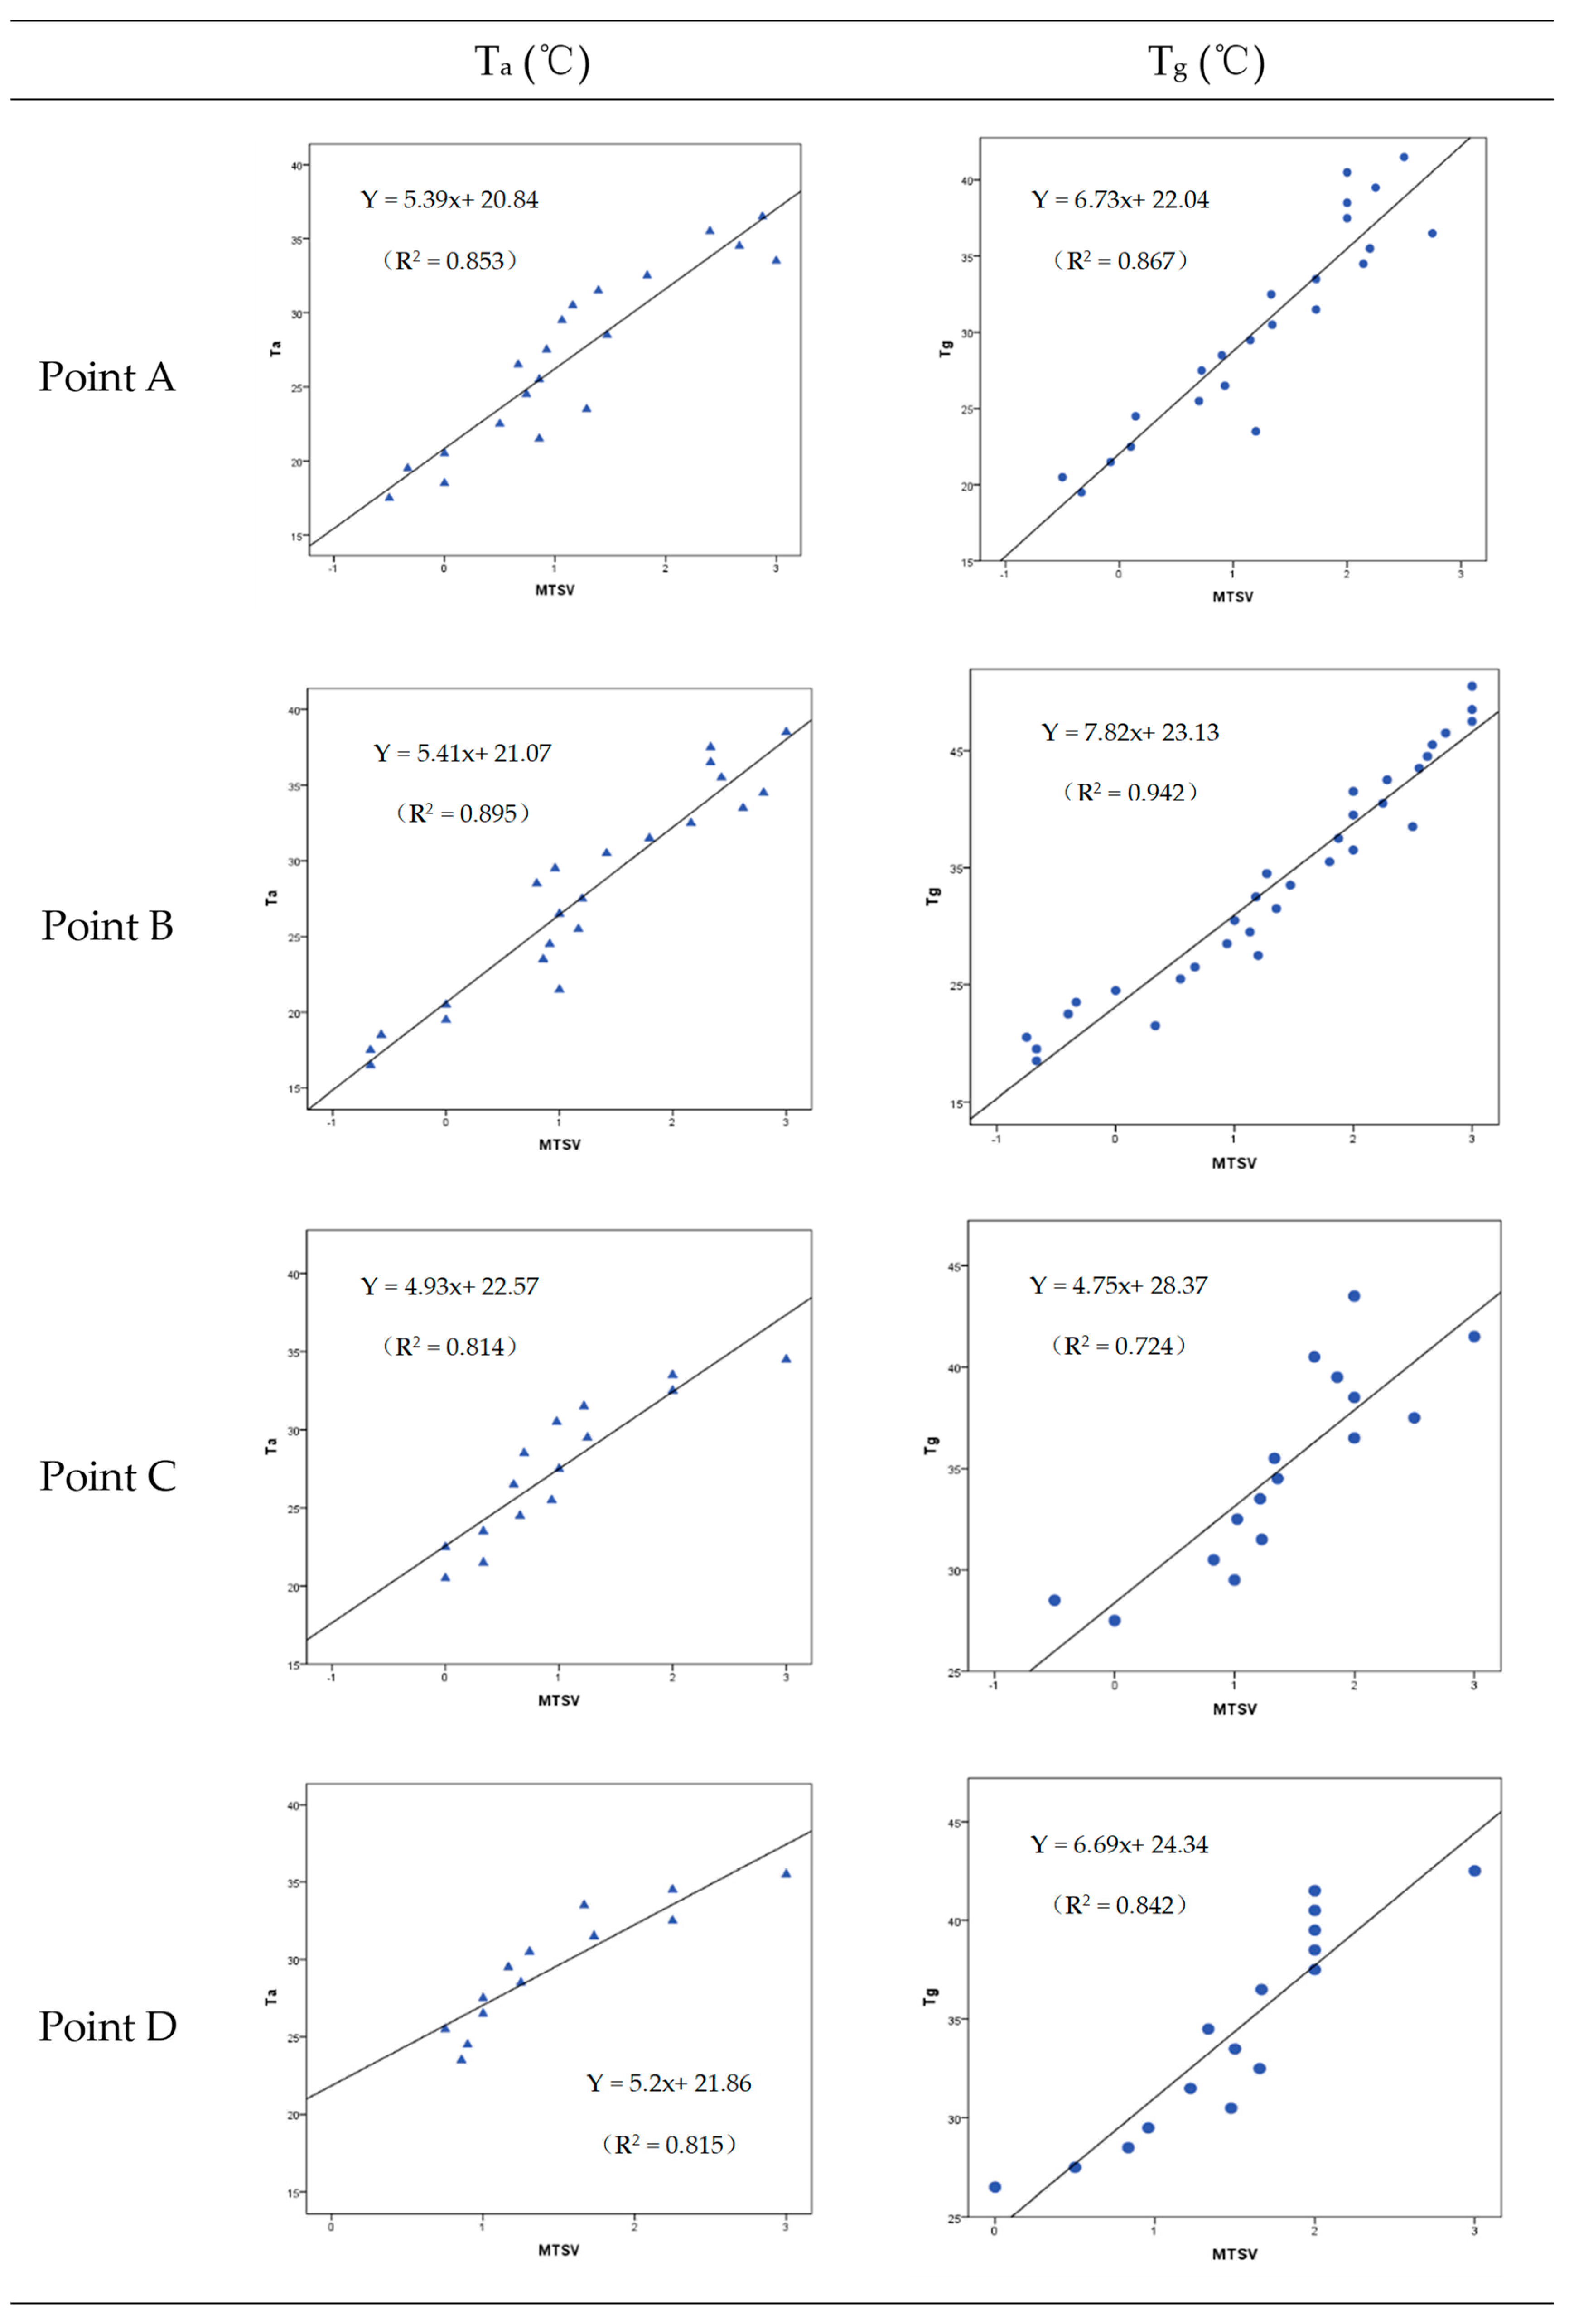
For a more accurate analysis of the sensitivity of human thermal sensation to air temperature and solar radiation, the mean thermal sensation vote value (MTSV) is calculated at every 1 °C interval of air temperature and globe temperature at each point. This is used for correlation analysis of the air temperature and globe temperature with the corresponding MTSV (Figure 9).
According to R2, the air temperature and globe temperature in summer are significantly correlated with the human thermal sensation at each point, and point B has the strongest correlation. The slope of the linear regression equation represents the sensitivity of the human thermal sensation to the meteorological parameters. The order of sensitivity of the air temperature and globe temperature in summer is C (SVFC = 0.388) > D (SVFD = 0.132) > A (SVFA = 0.222) > B (SVFB = 0.402), indicating that sensitivity to air temperature and solar radiation is highest at point C, followed by point D. The slope at point C is 4.93 and 4.75, respectively. This means that, at point C, in order to change human thermal sensation by one point, the air temperature only needs a change of 4.93 °C or the globe temperature a change of 4.75 °C. It can be concluded that the sensitivity of residents in severe cold regions to air temperature and solar radiation in summer is more intense in areas with a stable outdoor environment but has little relationship to the SVF. Xu et al. also used this method to explore the sensitivity of human thermal sensation to air temperature and globe temperature in different landscape areas and found that residents are most sensitive to thermal environment changes in unshaded areas in summer [6] but only in landscaped regions without the influence of buildings.

3.2.4. Preference Vote of Meteorological Parameters

Human thermal comfort is not solely affected by a single meteorological parameter but by a series of parameters. Figure 10 shows that subjects’ preferences for various meteorological parameters are different at each point. The majority of respondents at point B desire lower air temperatures and reduced solar radiation in summer. This is related to the large SVF value at point B. However, at point A, this trend is not obvious, since point A is shaded for the greater part of the day, and the demand for changes of solar radiation is not apparent. It is found that the subjects’ requirements for air temperature and solar radiation are basically the same at all measurement points, which also explains why the correlation coefficient between air temperature, globe temperature and TSV is relatively close, as reported in Section 3.2.3. In terms of the pedestrian wind speed, the demands for wind to increase at point D are the most obvious, and the higher the air temperature, the higher the desired wind speed. Since the summer climate conditions are hot, increased wind speed increases the rate of moisture evaporation from the skin and the rate of convection and heat transfer between the skin and the surrounding air. In terms of relative humidity, the subjects’ demands for humidity at each point is not clear. It is of interest that more respondents expected the humidity to decrease at point A. It may be because larger wind speeds accelerate the water vapor exchange between point A and the surrounding areas, causing local humidification.

3.3. Outdoor Thermal Comfort Index

3.3.1. Correlation Analysis between MTSV and UTCI

The universal thermal climate index (UTCI) has become a common index for the evaluation of outdoor thermal comfort and is regarded as one of the most comprehensive indices for calculating heat stress in outdoor spaces [20], but its suitability in Harbin requires further verification. The mean TSV is calculated for every UTCI degree interval in summer. For example, when exposed to 20 to 21 °C UTCI, the mean thermal sensation vote of respondents is 0.4, so for 20.5 °C UTCI, the TSV is 0.4 on average. The correlation analysis of UTCI and MTSV is carried out according to this method (Figure 11), and the formula obtained from fitting is shown as Equation (4). The slope of the linear equation obtained is 7.381, which means that, as the UTCI changes by 7.381 °C outdoors in a severe cold region in summer, the residents’ thermal sensation changes by one TSV scale.
The determination coefficient (R2) represents the accuracy of the UTCI in predicting outdoor thermal comfort levels in severe cold regions in summer. The higher the R2 value, the higher the prediction accuracy. The results reflect that the determination coefficient (R2) for the regression equation between UTCI and MTSV is 0.931, with a good degree of fit, which indicates that the UTCI can accurately evaluate outdoor thermal comfort levels in severe cold regions in summer.
Y   =   7.381 X   +   19.313   ( R 2   =   0.931 ) ,

3.3.2. Neutral UTCI and Neutral UTCI Range

Generally, the temperature where people feel neither hot nor cold is defined as the thermoneutral temperature [40], when MTSV = 0, UTCI is neutral, and the UTCI range of the MTSV (−0.5, 0.5) is neutral. According to the above regression Equation (4), the neutral UTCI is 19.3 °C, and the neutral UTCI ranges from 15.6 to 23.0 °C.
The neutral UTCI and neutral UTCI range in Harbin are compared with the values for six other climatic regions (Table 5). The neutral UTCI in Nagoya is clearly higher than that in other regions, followed by Guangzhou and Hong Kong. In the cold regions of China, the neutral UTCI and neutral UTCI range in Xi’an and Tianjin also have clear differences. The neutral UTCI range in Tianjin is narrower than that in Xi’an. This is probably due to the large variability of the climatic conditions in Xi’an, causing residents in Xi’an to become more tolerant to the changeable climate conditions. The neutral UTCI and neutral UTCI ranges in Umeå and Harbin, which have the same main climate type [23], are also significantly different. When considering the significant seasonal differences in the severe cold regions, it is only the neutral UTCI and the neutral UTCI range in summer that are compared in each climatic region. Although the neutral UTCI of Nagoya is higher than that in the other climatic regions in summer, the neutral UTCI range is the lowest, indicating that Nagoya residents have a better ability to adapt to the warmer environment but with a smaller band of perception of the neutral UTCI. In comparison with Guangzhou and Hong Kong, Harbin has a larger range of neutral UTCI in summer, because both Guangzhou and Hong Kong are located in hot summer and warm winter areas, accompanied by relatively small climatic changes through the year. Therefore, the neutral UTCI ranges are both narrow. However, the climate fluctuation in Harbin is large throughout the year. Local residents have been living in these climatic conditions for a long time, and the long-term thermal experience may change the thermal expectation [41,42]. Therefore, residents in Harbin show strong adaptability to climate changes. In comparison with Umeå, which has the same main climate type as Harbin, it is found that the mean air temperature in summer in Harbin is higher than that in Umeå, resulting in a lower neutral UTCI temperature for residents in Umeå. The above results confirm the existence of obvious thermal adaptation phenomena in different climatic regions. The neutral UTCI and neutral UTCI range in different regions are affected by climatic factors, indicating that it is necessary to study the subjective perception of the outdoor thermal environment in each climatic zone and expand the sample size in each city.

3.3.3. Thermal Acceptability Range

Based on the method proposed by De Dear and Fountain, this study defines the thermal sensation beyond the range of (−1,1) on the TSV scale as “predicted unacceptable votes (PUV)”. In the questionnaire, the thermal unacceptability vote by the respondents is defined as “actual unacceptable votes (AUV)”. Thermal acceptability range refers to the temperature range that at least 80% of the subjects find acceptable and, therefore, only 20% of the subjects find unacceptable [46]. In the study, the thermal unacceptability rate for each degree UTCI interval is calculated, and the correlation between “actual unacceptable votes (AUV)”, “predicted unacceptable votes (PUV)” and UTCI, respectively, is performed (Figure 12), with quadratic polynomial fitting Equations (5) and (6) obtained.
Percentage   of   PUV :   Y   =   0.00365 X 2     0.15968 X   +   1.90330   ( R 2   =   0.838 ) ,
Percentage   of   AUV :   Y   =   0.00359 X 2     0.16557 X   +   1.96748   ( R 2   =   0.894 ) ,
According to the Equations (5) and (6), it can be concluded that the predicted thermal acceptable range in summer in severe cold regions is 18.4–25.3 °C, while the actual thermal acceptable range is 16.8–29.3 °C. The actual thermal acceptable range is wider than the predicted thermal acceptable range, and the predicted thermal acceptable range is fully contained in the actual thermal acceptable range. Meanwhile, the neutral UTCI range is not fully contained in the actual thermal acceptable range. This shows that, in summer in the severe cold region, people can accept a hotter outdoor environment, and the residents’ acceptance of the outdoor thermal environment in summer is not only dependent on the perception of the outdoor thermal environment but is also affected by other factors. Xu et al. suggest that these might be psychological factors [20], so a specific investigation is conducted in Section 3.3.4. According to Section 3.2.2 and when TSV = −0.2, the UTCI is 17.8, and the most comfortable outdoor environment can be achieved. The UTCI value corresponding to this condition is in the actual thermal acceptable range. In conclusion, the actual thermal acceptable range has a higher reference value when designing commercial pedestrian streets in severe cold regions.

3.3.4. Psychological Adaptation

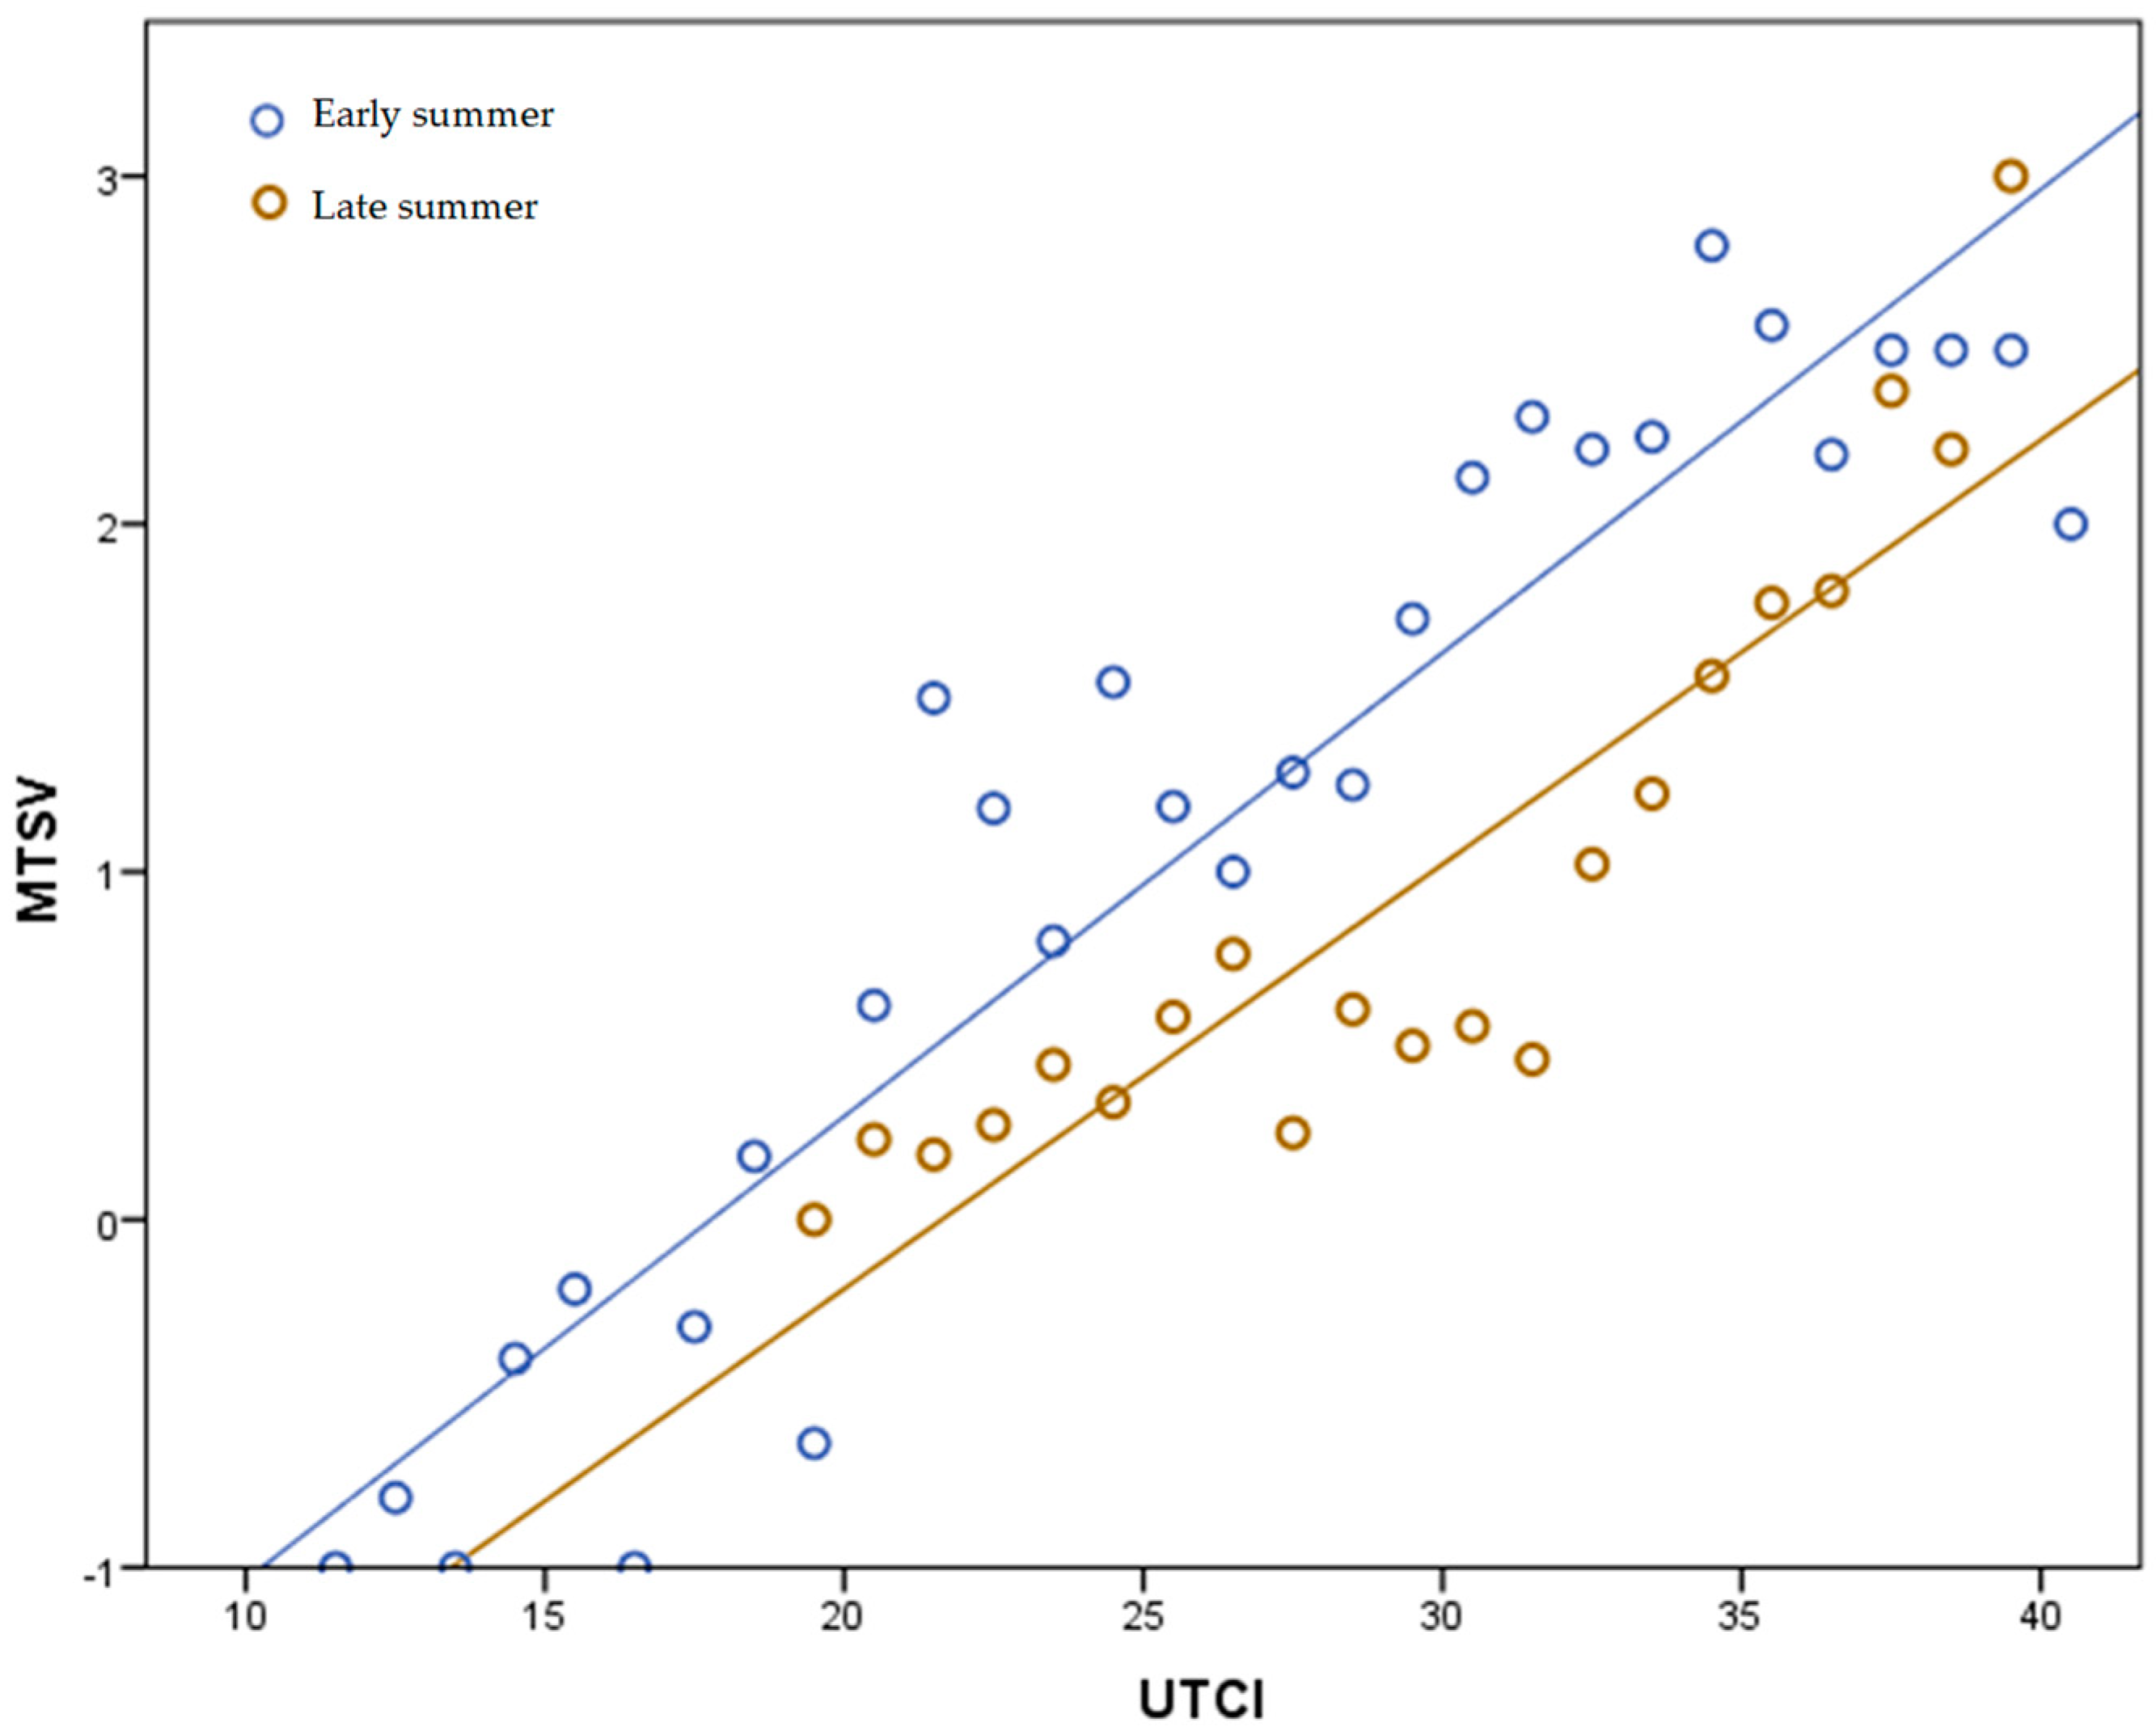
The perception of outdoor thermal environments is affected by thermal adaptation, which can be divided into three categories: physiological adaptation, psychological adaptation and behavioral adaptation [40]. This section explores the influence of psychological factors on outdoor thermal sensation based on Section 3.3.3. To quantify the influence of the psychological adaptation on the outdoor thermal sensation of residents of severe cold regions in summer, the regression models for UTCI and MTSV in early summer (the first month of the summer) and late summer (the last month of the summer) (Figure 13) are compared, and the regression Equations (7) and (8) are obtained, respectively.
Early   summer :   Y   =   0.133 X     2.368   ( R 2   =   0.870 ) ,
Last   summer :   Y   =   0.122 X     2.639   ( R 2   =   0.808 ) ,
According to the regression Equations (7) and (8), in early summer, the MTSV value is slightly higher than the MTSV value in late summer, with a difference of about 0.5 on the TSV scale. This means that, at the same UTCI condition, residents in the severe cold regions feel warmer in early summer. This suggests that residents in severe cold regions experience psychological adaptations to hot weather when facing similar warm climate conditions for a long time. The results demonstrate the influence of the psychological factors mentioned in Section 3.3.3 on outdoor thermal environment perceptions.

4. Conclusions

This study investigates outdoor thermal comfort in urban commercial pedestrian streets in Harbin. Through the measurement of meteorological parameters and a questionnaire survey of residents’ outdoor thermal comfort in summer, subjective and objective data for the outdoor thermal environment in commercial pedestrian streets of different spatial scales are obtained. The data analysis provides the following conclusions:
  • In summer, “Slightly warm” (TSV = 1) is the most common thermal sensation reported by residents in severe cold regions, and the outdoor thermal sensation is related to the different spatial scales. According to this study, the distribution of thermal sensation in severe cold regions in summer is tighter in areas of the outdoor environment with smaller SVF and less fluctuation, while the distribution is more dispersed in areas with larger SVF and greater fluctuation.
  • This study shows that the effects of air temperature and solar radiation on outdoor thermal sensation is greater than that of wind speed in urban high-density commercial districts in severe cold regions in summer. Residents of severe cold regions are more sensitive to changes in air temperature and solar radiation in areas with a stable outdoor environment.
  • It is confirmed that the UTCI can accurately evaluate outdoor thermal comfort levels in severe cold regions in summer. In comparison with Guangzhou, Hong Kong and Nagoya, the neutral UTCI in Harbin is lower and the range of neutral UTCI is wider, because residents in Harbin are more able to adapt to larger fluctuations in the outdoor environment.
  • Residents of severe cold regions show psychological adaptations to the outdoor thermal environment in summer. The MTSV value in early summer is slightly higher by about 0.5 on the TSV scale to that in late summer.
  • This work shows that the actual thermal acceptable range in summer in severe cold regions is 16.8–29.3 °C, which is wider than the predicted thermal acceptable range. In addition, in comparison with the neutral UTCI range, the actual thermal acceptable range takes into account the psychological adaptation of residents of severe cold regions to the outdoor environment, which is therefore of more practical reference value.

Author Contributions

Z.Z., J.L., C.S. and Y.H. conceived the research, including conceptualization, data analysis, investigation and methodology. All the authors were engaged in final manuscript preparation and writing. All authors have read and agreed to the published version of the manuscript.

Funding

This paper is funded by the National Natural Science Foundation of China (Grant No. 51708149), China Postdoctoral Science Foundation (Grant No. 2017M621276) and Heilongjiang Postdoctoral Science Foundation (Grant No. LBH-Z17076).

Conflicts of Interest

The authors declare no conflicts of interest.

References

  1. Cheung, C.S.C.; Hart, M.A. Climate change and thermal comfort in Hong Kong. Int. J. Biometeorol. 2014, 58, 137–148. [Google Scholar] [CrossRef]
  2. Hendel, M.; Azos-Diaz, K.; Tremeac, B. Behavioral adaptation to heat-related health risks in cities. Energy Build. 2017, 152, 823–829. [Google Scholar] [CrossRef]
  3. Patz, J.A.; Campbell-Lendrum, D.; Holloway, T.; Foley, J.A. Impact of regional climate change on human health. Nature 2005, 438, 310–317. [Google Scholar] [CrossRef] [PubMed]
  4. Lin, T.-P.; Dear, R.D.; Hwang, R.-L. Effect of thermal adaptation on seasonal outdoor thermal comfort. Int. J. Climatol. 2011, 31, 302–312. [Google Scholar] [CrossRef]
  5. Lai, D.Y.; Guo, D.H.; Hou, Y.F.; Lin, C.Y.; Chen, Q.Y. Studies of outdoor thermal comfort in northern China. Build. Environ. 2014, 77, 110–118. [Google Scholar] [CrossRef]
  6. Xu, M.; Hong, B.; Jiang, R.S.; An, L.; Zhang, T. Outdoor thermal comfort of shaded spaces in an urban park in the cold region of China. Build. Environ. 2019, 155, 408–420. [Google Scholar] [CrossRef]
  7. Ruiz, M.A.; Correa, E.N. Adaptive model for outdoor thermal comfort assessment in an Oasis city of arid climate. Build. Environ. 2015, 85, 40–51. [Google Scholar] [CrossRef]
  8. Nikolopoulou, M.; Lykoudis, S. Use of outdoor spaces and microclimate in a Mediterranean urban area. Build. Environ. 2007, 42, 3691–3707. [Google Scholar] [CrossRef] [Green Version]
  9. Mahmoud, A.H.A. Analysis of the microclimatic and human comfort conditions in an urban park in hot and arid regions. Build. Environ. 2011, 46, 2641–2656. [Google Scholar] [CrossRef]
  10. Shashua-Bar, L.; Hoffman, M.E. Vegetation as a climatic component in the design of an urban street: An empirical model for predicting the cooling effect of urban green areas with trees. Energy Build. 2000, 31, 221–235. [Google Scholar] [CrossRef]
  11. Oke, T.R. An algorithmic scheme to estimate hourly heat is land magnitude. In Proceedings of the 2nd Urban Environment Symposium, Albuquerque, NM, USA, 2–6 November 1998; pp. 80–83. [Google Scholar]
  12. Johansson, E. Influence of urban geometry on outdoor thermal comfort in a hot dry climate: A study in Fez, Morocco. Build. Environ. 2006, 41, 1326–1338. [Google Scholar] [CrossRef]
  13. Bourbia, F.; Boucheriba, F. Impact of street design on urban microclimate for semi arid climate (Constantine). Renew. Energy 2010, 35, 343–347. [Google Scholar]
  14. Qaid, A.; Ossen, D.R. Effect of asymmetrical street aspect ratios on microclimates in hot, humid regions. Int. J. Biometeorol. 2015, 59, 657–677. [Google Scholar] [CrossRef] [PubMed]
  15. Yin, S.; Lang, W.; Xiao, Y.Q. The synergistic effect of street canyons and neighbourhood layout design on pedestrian-level thermal comfort in hot-humid area of China. Sustain. Cities Soc. 2019, 49, 101571. [Google Scholar] [CrossRef]
  16. Jamei, E.; Rajagopalan, P.; Seyedmahmoudian, M.; Jamei, Y. Review on the impact of urban geometry and pedestrian level greening on outdoor thermal comfort. Renew. Sustain. Energy Rev. 2016, 54, 1002–1017. [Google Scholar] [CrossRef]
  17. De Freitas, C.R.; Grigorieva, E.A. A comparison and appraisal of a comprehensive range of human thermal climate indices. Int. J. Biometeorol. 2017, 61, 487–512. [Google Scholar] [CrossRef]
  18. Huang, J.X.; Zhou, C.B.; Zhou, Y.B.; Xu, L.Y.; Jiang, Y. Outdoor thermal environments and activities in open space: An experiment study in humid subtropical climates. Build. Environ. 2016, 103, 238–249. [Google Scholar] [CrossRef] [Green Version]
  19. Sajad, Z.; Naser, H.; Elahi, S.H.; Rasoul, H.; Keyvan, S.; Saeid, A. Comparing Universal Thermal Climate Index (UTCI) with selected thermal indices/environmental parameters during 12 months of the year. Weather Clim. Extrem. 2018, 19, 49–57. [Google Scholar]
  20. Xu, M.; Hong, B.; Mi, J.Y.; Yan, S.S. Outdoor thermal comfort in an urban park during winter in cold regions of China. Sustain. Cities Soc. 2018, 43, 208–220. [Google Scholar] [CrossRef]
  21. Chen, X.; Xue, P.N.; Gao, L.X.; Du, J.; Liu, J. Physiological and thermal response to real-life transient conditions during winter in severe cold area. Build. Environ. 2019, 157, 284–296. [Google Scholar] [CrossRef]
  22. Du, J.; Sun, C.; Xiao, Q.K.; Chen, X.; Liu, J. Field assessment of winter outdoor 3-D radiant environment and its impact on thermal comfort in a severely cold region. Sci. Total Environ. 2020, 709, 136175. [Google Scholar] [CrossRef] [PubMed]
  23. Kottek, M. World Map of the Koppen-Geiger climate classification updated. Meteorol. Z. 2006, 15, 259–263. [Google Scholar] [CrossRef]
  24. Watson, I.D.; Johnson, G.T. Graphical estimation of sky view-factors in urban environments. Int. J. Climatol. 1987, 7, 193–197. [Google Scholar] [CrossRef]
  25. Johnson, G.T.; Watson, I.D. The Determination of View-Factors in Urban Canyons. J. Appl. Meteorol. 1984, 23, 329–335. [Google Scholar] [CrossRef]
  26. Krüger, E.L.; Minella, F.O.; Rasia, F. Impact of urban geometry on outdoor thermal comfort and air quality from field measurements in Curitiba, Brazil. Build. Environ. 2011, 46, 621–634. [Google Scholar] [CrossRef]
  27. Lin, T.P.; Tsai, K.T.; Hwang, R.L.; Matzarakis, A. Quantification of the effect of thermal indices and sky view factor on park attendance. Landsc. Urban Plan. 2012, 107, 137–146. [Google Scholar] [CrossRef]
  28. Wei, R.H.; Song, D.X.; Wong, N.H.; Martin, M. Impact of Urban Morphology Parameters on Microclimate. Procedia Eng. 2016, 169, 142–149. [Google Scholar] [CrossRef]
  29. Lin, T.P.; Matzarakis, A.; Hwang, R.L. Shading effect on long-term outdoor thermal comfort. Build. Environ. 2010, 45, 213–221. [Google Scholar] [CrossRef]
  30. Matzarakis, A.; Rutz, F.; Mayer, H. Modelling radiation fluxes in simple and complex environments: Basics of the RayMan model. Int. J. Biometeorol. 2010, 54, 131–139. [Google Scholar] [CrossRef] [Green Version]
  31. Holst, J.; Mayer, H. Impacts of street design parameters on human-biometeorological variables. Meteorol. Z. 2011, 20, 541–552. [Google Scholar] [CrossRef]
  32. ISO International Standard 7726. Thermal Environment-Instruments and Method for Measuring Physical Quantities International Standard Organization; ISO: Geneva, Switzerland, 1998. [Google Scholar]
  33. Yao, J.W.; Yang, F.; Zhuang, Z.; Shao, Y.H.; Yuan, P.F. The effect of personal and microclimatic variables on outdoor thermal comfort: A field study in a cold season in Lujiazui CBD, Shanghai. Sustain. Cities Soc. 2018, 39, 181–188. [Google Scholar] [CrossRef]
  34. Xie, Y.X.; Huang, T.Y.; Li, J.N.; Niu, J.L.; Mak, C.M.; Lin, Z. Evaluation of a multi-nodal thermal regulation model for assessment of outdoor thermal comfort: Sensitivity to wind speed and solar radiation. Build. Environ. 2018, 132, 45–56. [Google Scholar] [CrossRef]
  35. Li, J.N.; Niu, J.L.; Mak, C.M.; Huang, T.Y.; Xie, Y.X. Assessment of outdoor thermal comfort in Hong Kong based on the individual desirability and acceptability of sun and wind conditions. Build. Environ. 2018, 145, 50–61. [Google Scholar] [CrossRef]
  36. Fiala, D.; Lomas, K.J.; Stohrer, M. Computer prediction of human thermoregulatory and temperature responses to a wide range of environmental conditions. Int. J. Biometeorol. 2001, 45, 143–159. [Google Scholar] [CrossRef] [PubMed]
  37. ANSI/ASHRAE. ASHRAE Handbook—Fundamentals; Chapter 24.3; ASHRAE: Atlanta, GA, USA, 2017. [Google Scholar]
  38. Huang, J.X.; Jose, G.C.; John, D.S. CityComfort+: A simulation-based method for predicting mean radiant temperature in dense urban areas. Build. Environ. 2014, 80, 84–95. [Google Scholar] [CrossRef] [Green Version]
  39. ISO International Standard 7730. Ergonomics of the Thermal Environment-Analytical Determination and Interpretation of Thermal Comfort Using Calculation of the PMV and PPD Indices and Local Thermal Comfort Criteria; ISO: Geneva, Switzerland, 2005. [Google Scholar]
  40. Chen, X.; Xue, P.N.; Liu, L.; Gao, L.X.; Liu, J. Outdoor thermal comfort and adaptation in severe cold area: A longitudinal survey in Harbin, China. Build. Environ. 2018, 143, 548–560. [Google Scholar] [CrossRef]
  41. Luo, M.H.; Richard De, D.; Ji, W.J.; Bin, C.; Lin, B.R.; Ouyang, Q.; Zhu, Y.X. The dynamics of thermal comfort expectations: The problem, challenge and implication. Build. Environ. 2016, 95, 322–329. [Google Scholar] [CrossRef]
  42. Luo, M.H.; Wang, Z.; Gail, B.; Bin, C.; Zhu, Y.X. Indoor climate experience, migration, and thermal comfort expectation in buildings. Build. Environ. 2018, 141, 262–272. [Google Scholar] [CrossRef] [Green Version]
  43. Fang, Z.S.; Xu, X.N.; Zhou, X.Q.; Deng, S.Q.; Wu, H.J.; Liu, J.L.; Lin, Z. Investigation into the thermal comfort of university students conducting outdoor training. Build. Environ. 2019, 149, 26–38. [Google Scholar] [CrossRef]
  44. Watanabe, S.; Nagano, K.; Ishii, J.; Horikoshi, T. Evaluation of outdoor thermal comfort in sunlight, building shade, and pergola shade during summer in a humid subtropical region. Build. Environ. 2014, 82, 556–565. [Google Scholar] [CrossRef]
  45. Yang, B.; Olofsson, T.; Nair, G.; Kabanshi, A. Outdoor thermal comfort under subarctic climate of north Sweden—A pilot study in Umeå. Sustain. Cities Soc. 2017, 28, 387–397. [Google Scholar] [CrossRef]
  46. Lin, T.P.; Tsai, K.T.; Liao, C.C.; Huang, Y.C. Effects of thermal comfort and adaptation on park attendance regarding different shading levels and activity types. Build. Environ. 2013, 59, 599–611. [Google Scholar] [CrossRef]
Figure 1. Monthly mean/maximum/minimum air temperature (Ta) and mean relative humidity (RH) in Harbin from 1981 to 2010.
Sustainability 12 01876 g001
Figure 2. (a) Location of Harbin; (b) Field survey location.
Sustainability 12 01876 g002
Figure 3. Measuring points information: (a) measuring points distribution and (b) fish-eye images and sky view factor (SVF) values.
Sustainability 12 01876 g003
Figure 4. Distribution of gender and activity types in the survey.
Sustainability 12 01876 g004
Figure 5. Variations in clothing insulation and mean air temperature during measurement periods.
Sustainability 12 01876 g005
Figure 6. The percentage of thermal sensation vote (TSV) at each point.
Sustainability 12 01876 g006
Figure 7. The percentage of overall comfort vote (OCV) at each point.
Sustainability 12 01876 g007
Figure 8. Correlation between overall comfort vote (OCV) and thermal sensation vote (TSV).
Sustainability 12 01876 g008
Figure 9. Correlation analysis between air temperature and globe temperature and mean thermal sensation vote value (MTSV).
Sustainability 12 01876 g009
Figure 10. Preference distribution of meteorological parameters at each measurement point.
Sustainability 12 01876 g010
Figure 11. Correlation between the universal thermal climate index (UTCI) and MTSV.
Sustainability 12 01876 g011
Figure 12. Correlation between “actual unacceptable votes (AUV)”, “predicted unacceptable votes (PUV)” and UTCI, respectively.
Sustainability 12 01876 g012
Figure 13. Regression equations between UTCI and MTSV for early and late summer.
Sustainability 12 01876 g013
Table 1. Instruments used for measurement of meteorological parameters.
ParametersSymbolInstrumentationRangeAccuracy
Air temperatureTaTesto 480−20–70 °C±0.5 °C
Relative humidityRHTesto 4800–100% (RH)±(1.0%RH + 0.7% measured value) (0–90% RH) ±(1.4%RH + 0.7% measured value) (90–100% RH)
Wind speedVaKestrel N55000.4–40 m/s±0.1 m/s
Wind direction-Kestrel N55000–360°
Globe temperatureTgTesto 4800–120 °C±0.1 °C
Table 2. Outdoor thermal comfort questionnaire adopted in this study.
Questionnaire on Outdoor Thermal Comfort of Commercial Pedestrian Streets
Date:____ / ____ / ____ Time:________ Gender: (1) Male (2) Female Age:______
1. How long do you spend outdoors on average every day?
0–30 min/30 min–1 h/1 h–2 h/More than 2 h
2. The current position you are in:
Point A (Below the high-rise buildings)
Point B (Central point)
Point C (Intersection of Jianshe street and Youzheng street)
Point D (Youzheng street)
3. Your current clothing includes (multiple choices):
Upper:  □Vest  □Underwear  □Short sleeve T-shirt  □Long sleeve T-shirt  □Pullover  □Shirt
 □Sweater  □Jacket  □Thick coat  □Thin coat  □Cotton clothes  □Down jacket
Bottom:  □Shorts  □Short skirt  □Trousers  □Long skirt  □Sweat pants  □Woolen pant  □Cotton pant
Footwear:  □Sandals  □Shoes  □Boots  □Cotton-padded shoes □Pantyhose  □Ankle-length socks  □Socks  □low-cut liners socks
Others:___________________________
4. Your intensity in outdoor activities is:
(1) Light exercising (Tai Chi, look after children, brisk walking, etc.)
(2) Medium exercising (Jogging, etc.)
(3) Heavy exercising (High-intensity ball games, high-intensity ice sports, square dancing, etc.)
(4) Standing (Chatting, viewing, playing mobile phone, etc.)
(5) Sitting (Chatting, playing mobile phone, reading, playing chess, outdoor dining, etc.)
5. Please describe your thermal sensation at present:
 □−3 Cold  □−2 Cool  □−1 Slightly cool  □0 Neutral  □1 Slightly warm  □2 Warm  □3 Hot
6. Please describe your overall comfort level at present:
 □−1 Uncomfortable  □0 Neutral  □1 Comfortable
7. Please describe your acceptable level for current thermal environment at present:
 □−2 Extremely unacceptable  □−1 Unacceptable  □1 Acceptable  □2 Extremely acceptable
8. What changes do you expect from the following meteorological data at present:
Air temperature:  □Higher  □Unchanged  □Lower
Relative humidity:  □Higher  □Unchanged  □Lower
Wind speed:  □Stronger  □Unchanged  □Weaker
Solar Radiation:  □Stronger  □Unchanged  □Weaker
Table 3. Average/maximum/minimum air temperature, relative humidity, globe temperature and 1.5-m-high wind speed (m/s) during the measurement.
Ta (°C)RH (%)Tg (°C)Va1.5m (m/s)
AAverage27.345.828.42.48
Max35.166.641.015.01
Min17.126.219.40.08
BAverage31.836.936.51.91
Max39.461.050.58.03
Min18.715.525.30.00
CAverage29.347.531.31.76
Max35.066.043.89.19
Min23.925.524.10.05
DAverage28.947.929.70.56
Max36.066.343.35.96
Min22.827.523.50.00
Table 4. Spearman correlation statistics between thermal sensation vote (TSV) and various meteorological parameters.
RH (%)Ta (°C)Tg (°C)V1.5m (m/s)
TSV−0.319 **0.577 **0.560 **−0.129 **
** Correlation is significant at the 0.01 level (2-tailed).
Table 5. Neutral UTCI and neutral UTCI range in different climate regions. MTSV: mean thermal sensation vote.
City, CountryClimatic ZoneNeutral UTCI (°C)Neutral UTCI Range (°C)SeasonsCalculation Methods
Habin, China (this study)Dwa19.315.6–23.0SummerMTSV and UTCI linear regression
Xi’an China [6]Cwa/BSK23.118.5–29.6Summer/WinterMTSV and UTCI linear regression & Probit regression
Tianjin, China [5]Dwa/BSK17.513.6–21.3All yearMTSV and UTCI linear regression
Guangzhou, China [43]Cfa26.024.0–28.1SummerMTSV and UTCI linear regression
Hong Kong, China [35]Cwa27.123.3–30.8SummerMTSV and UTCI linear regression
Nagoya, Japan [44]Cfa34.032.2–35.9SummerMTSV and UTCI linear regression
Umeå, Sweden [45]Dfc14.411.5–17.2SummerMTSV and UTCI linear regression