Optimal Express Bus Routes Design with Limited-Stop Services for Long-Distance Commuters


Abstract
1. Introduction
2. Literature Review
3. Method
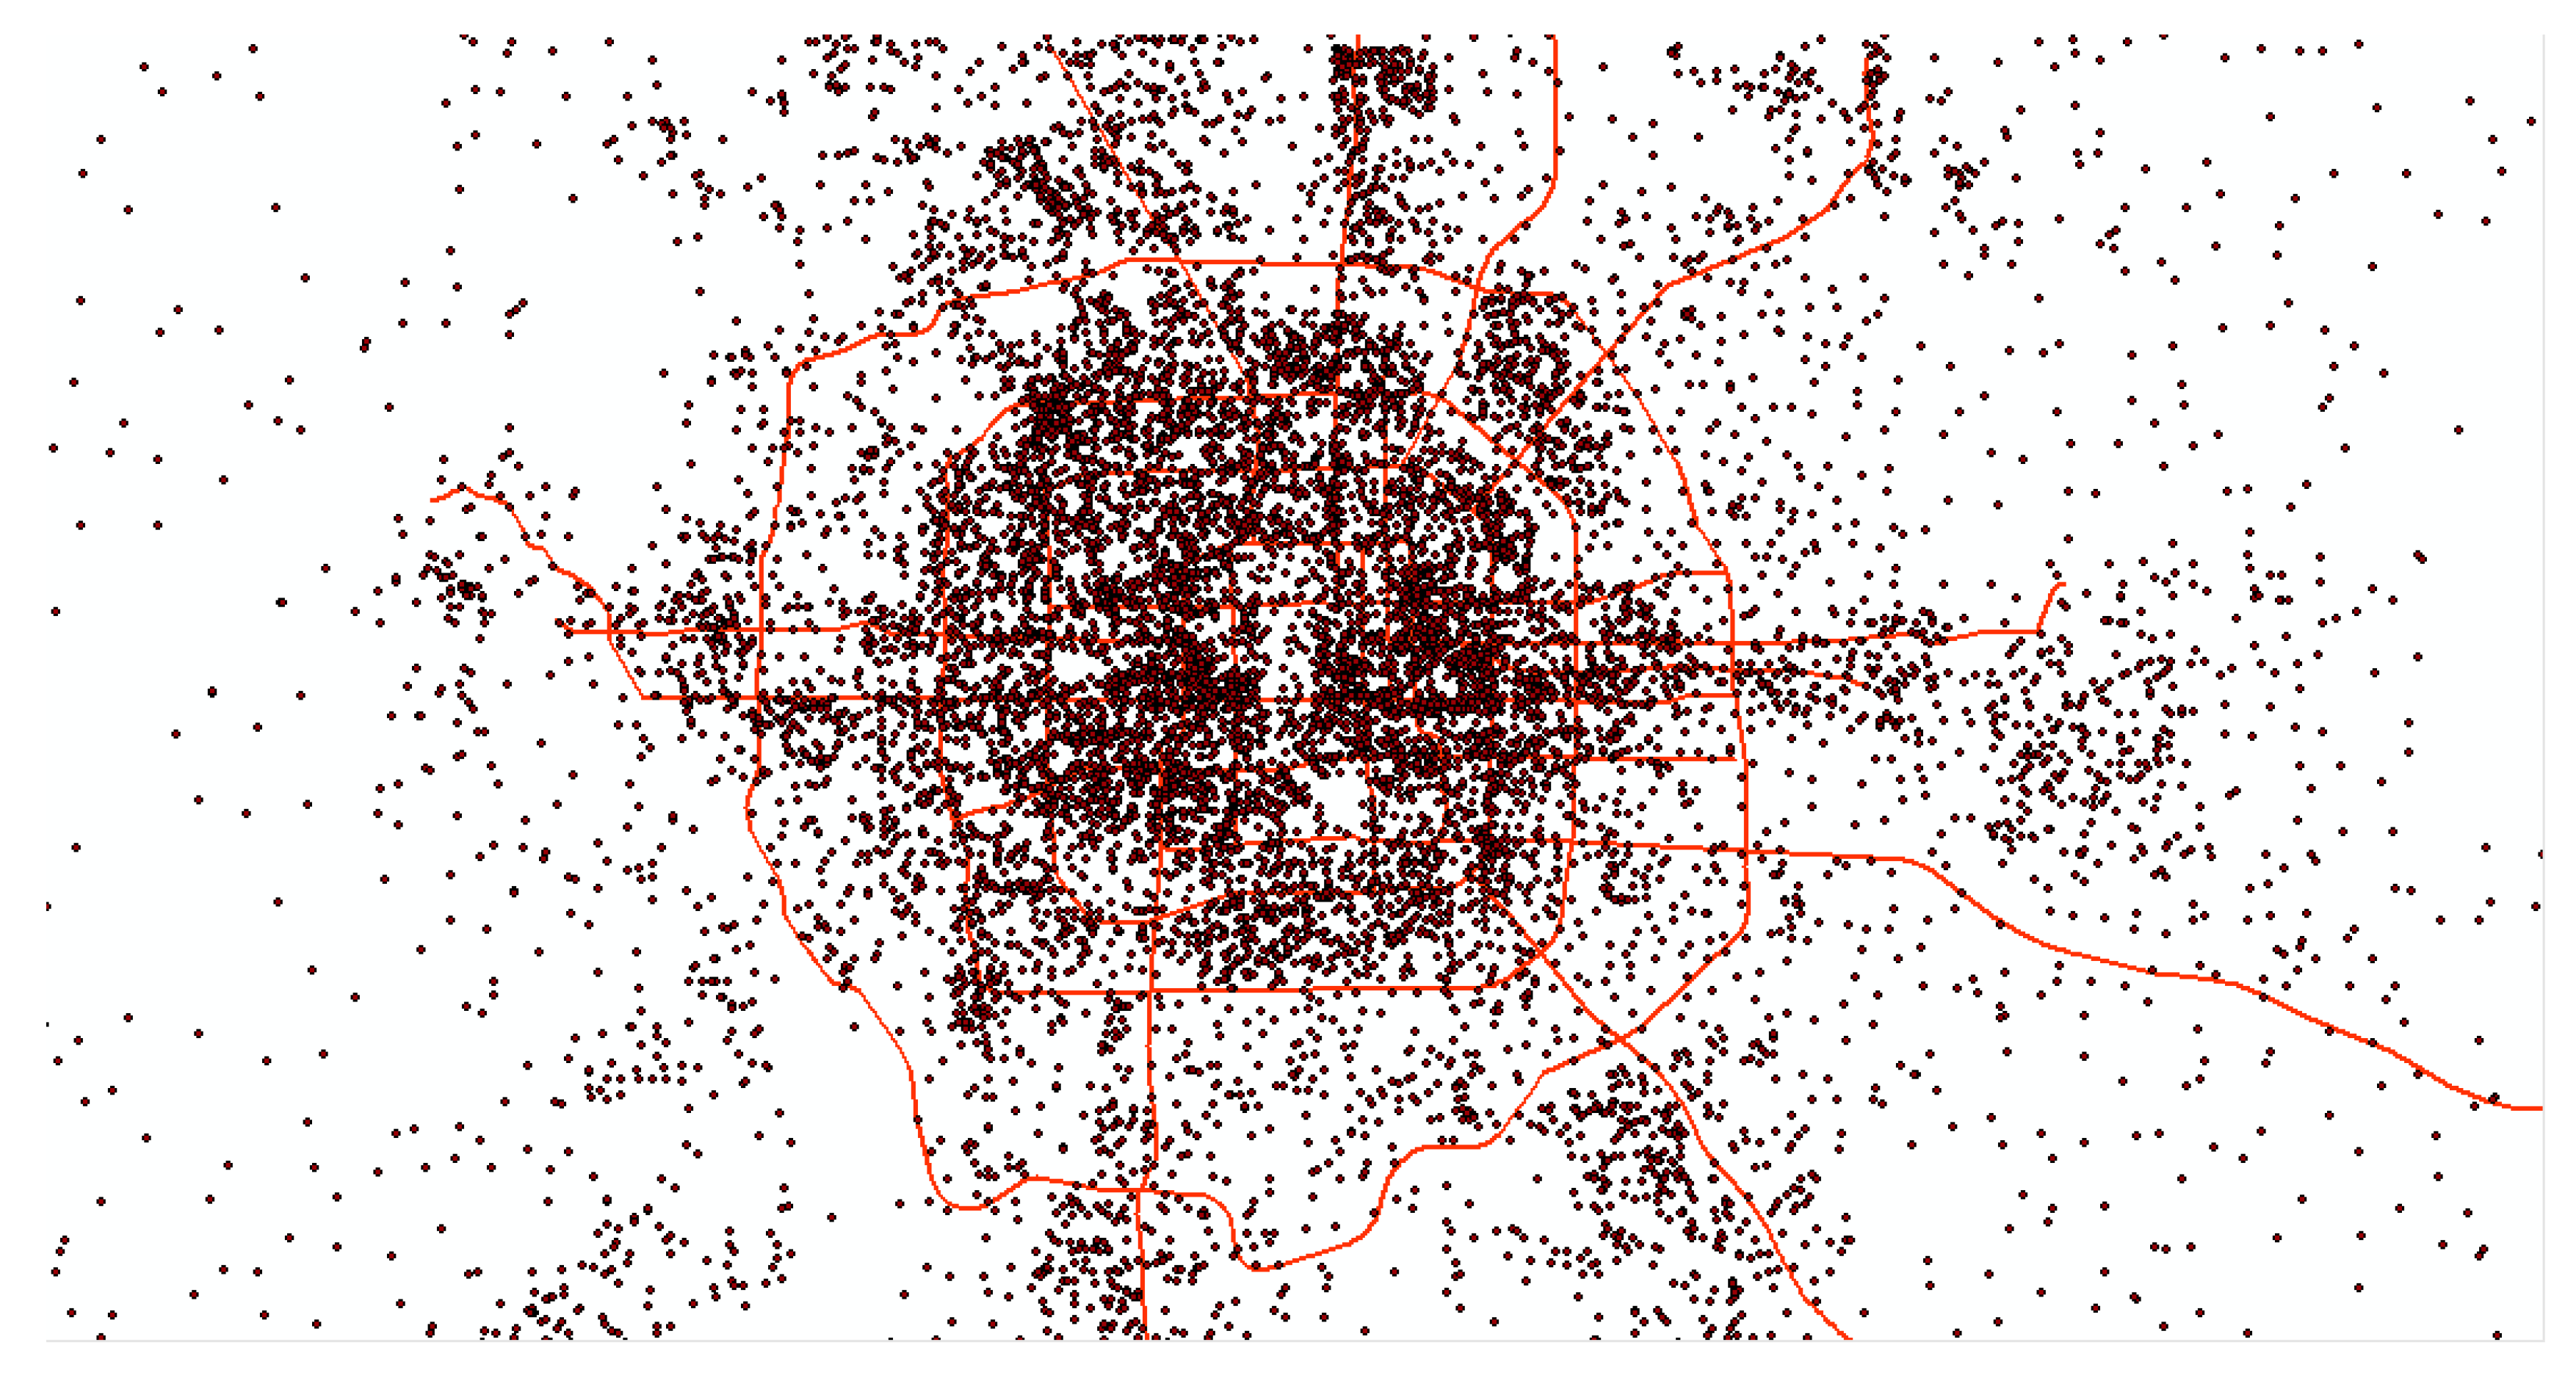
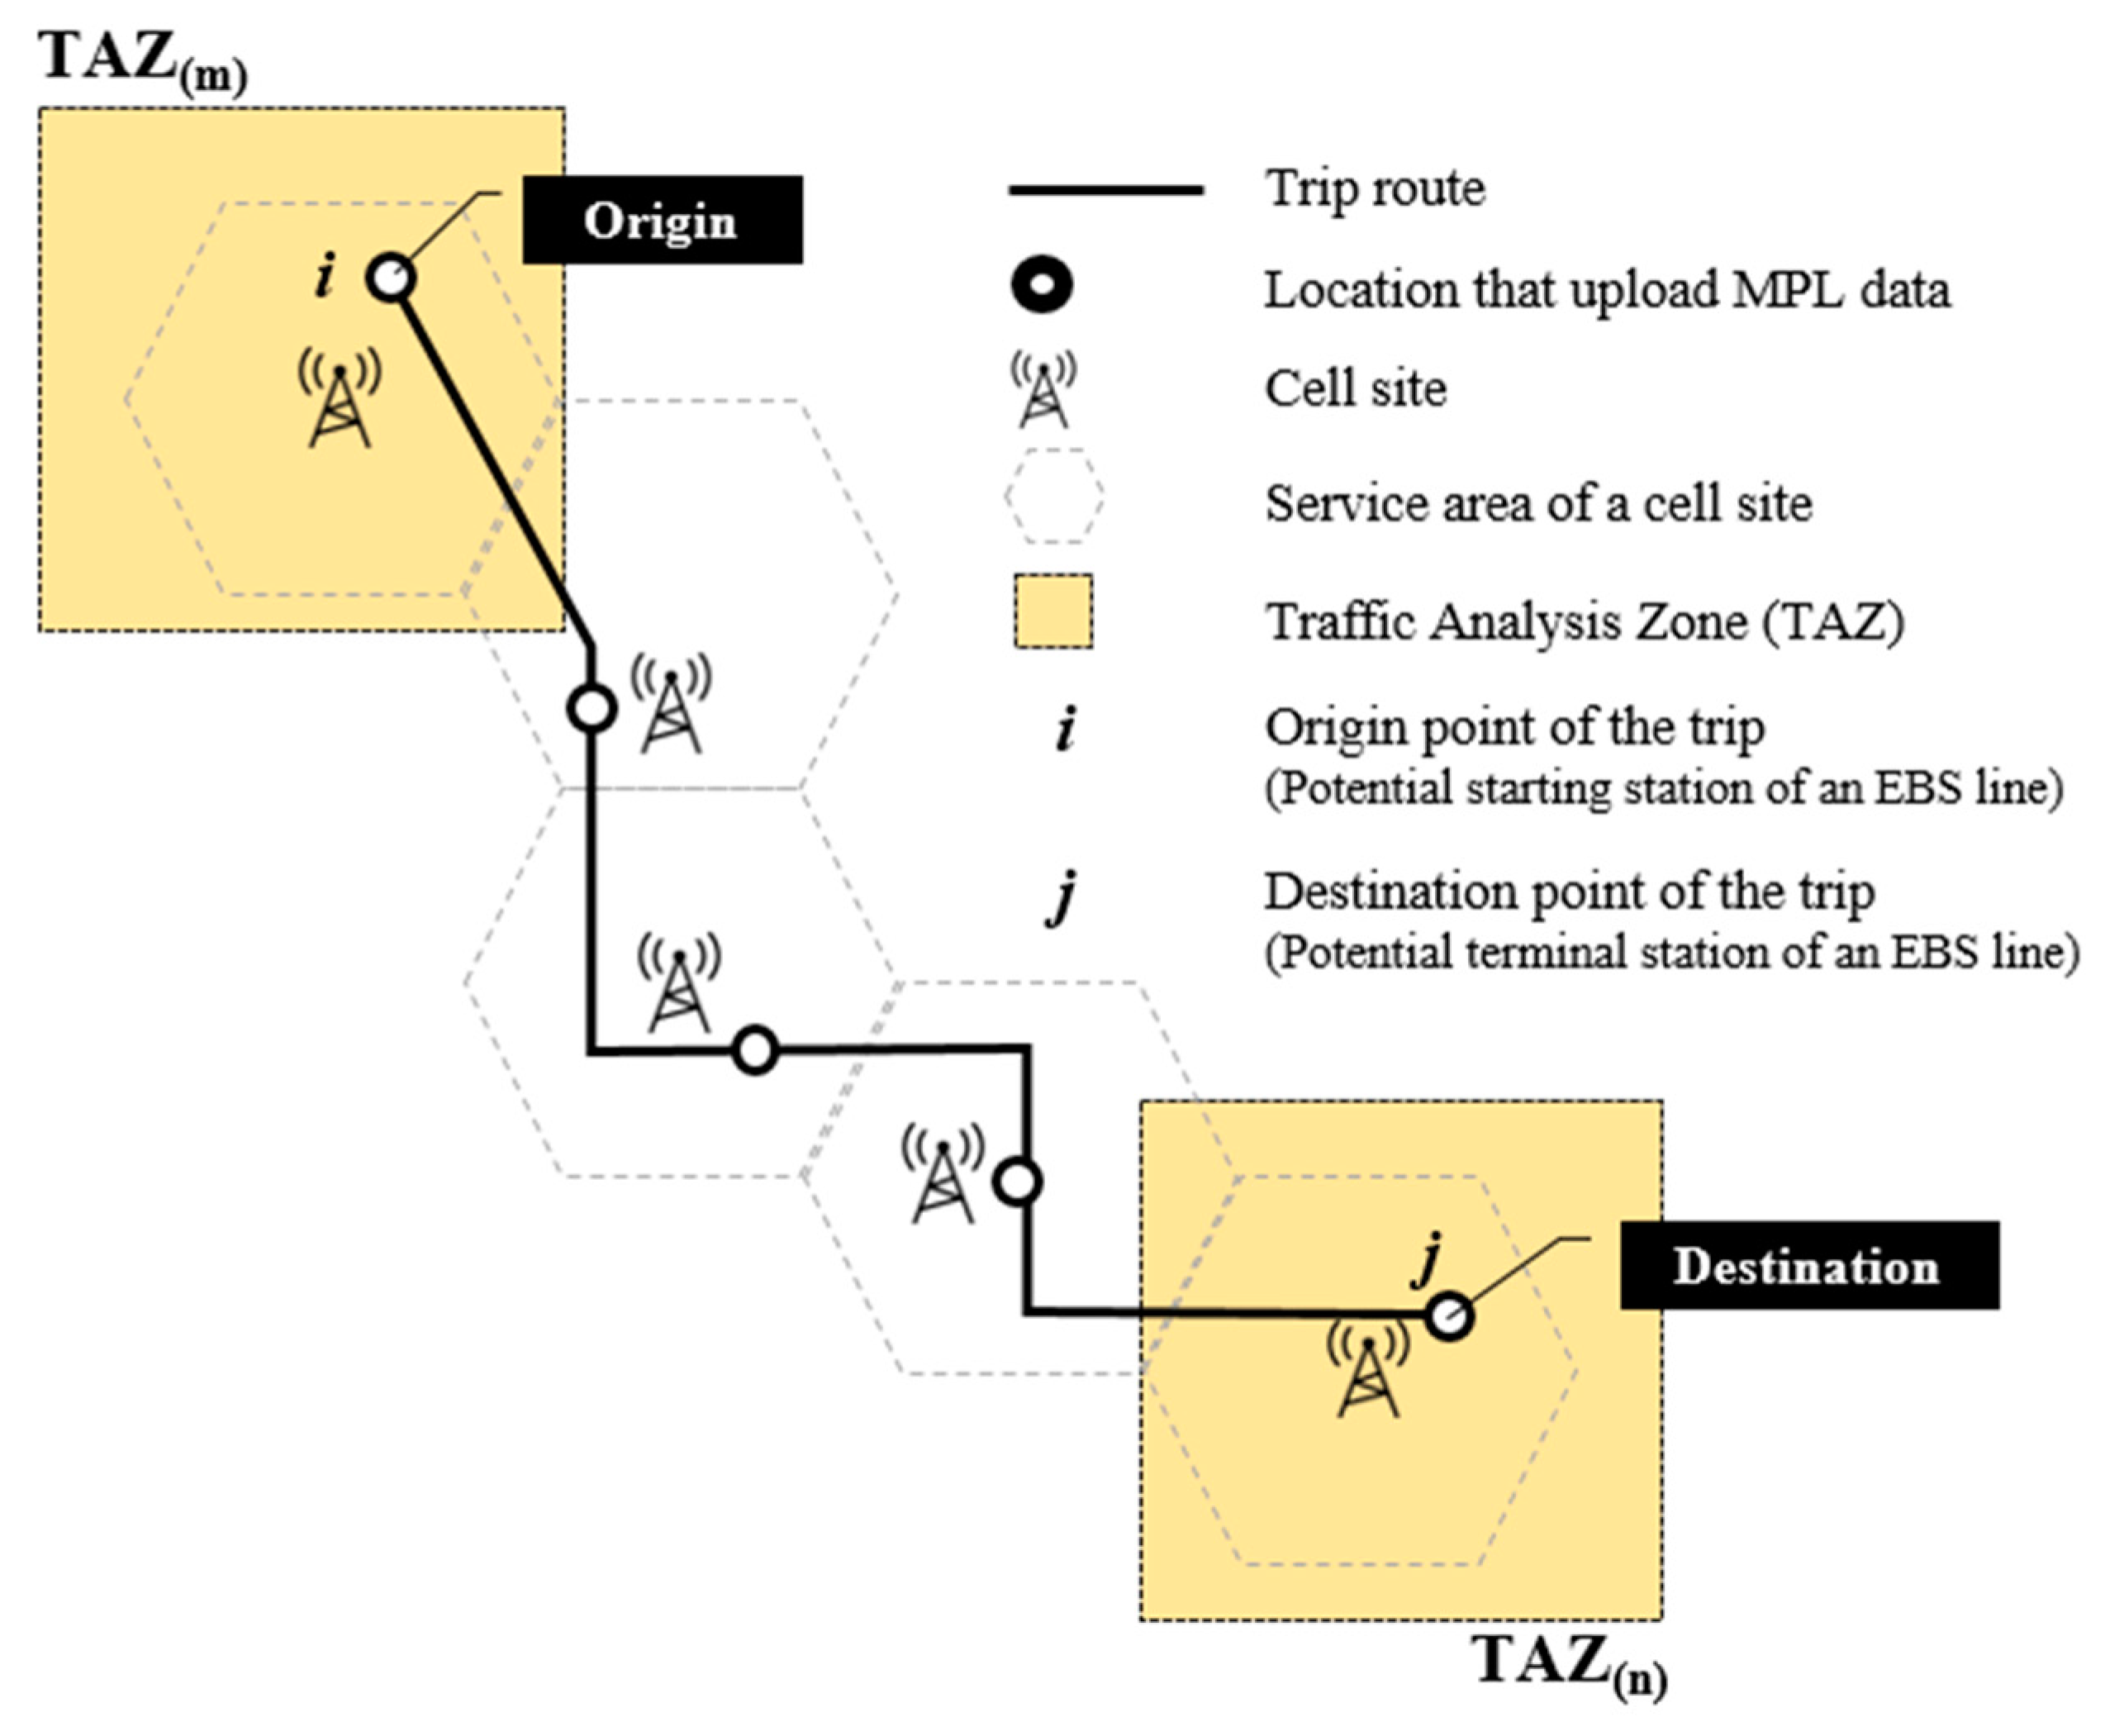
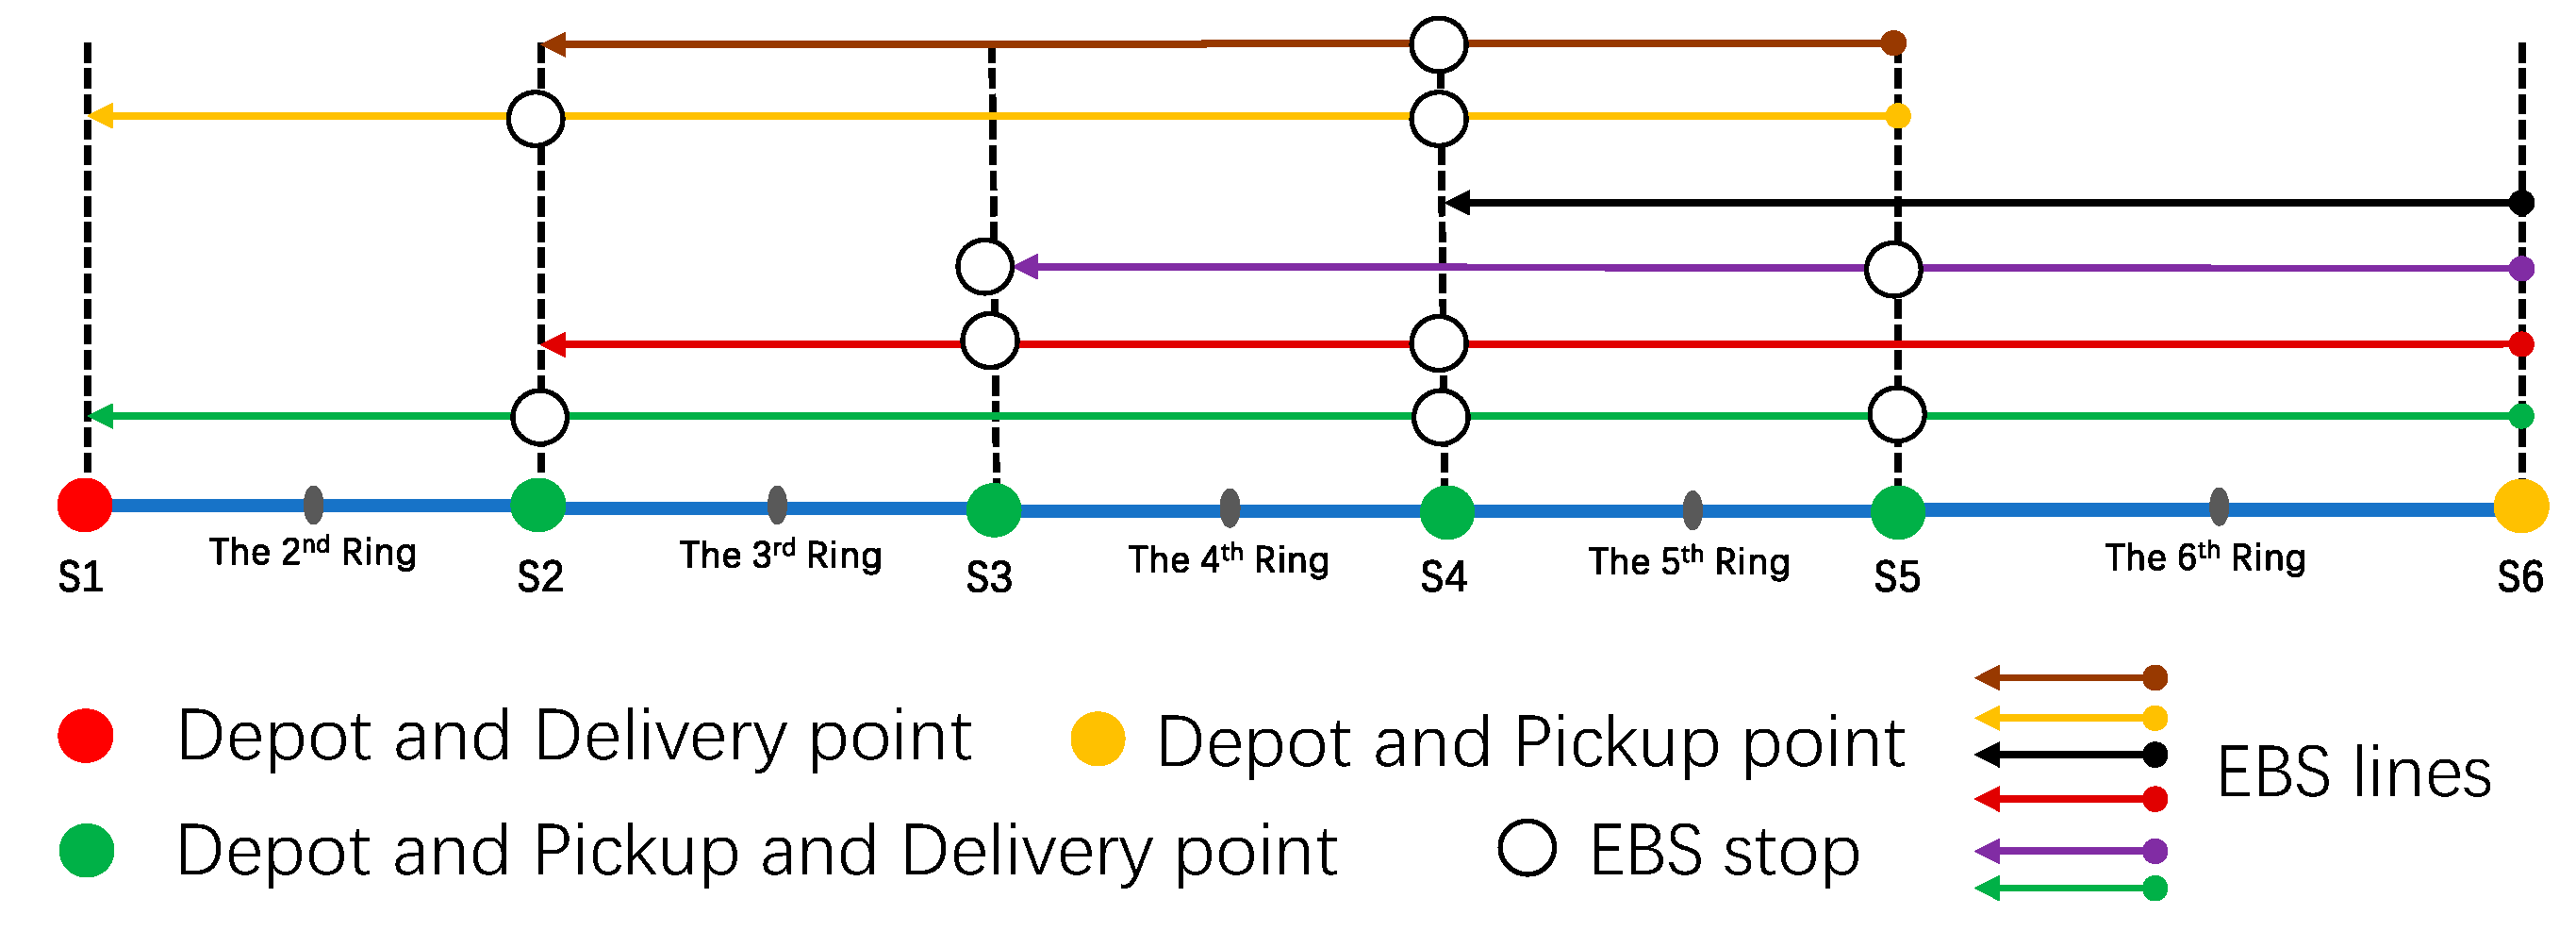
3.1. Demand Data Estimation
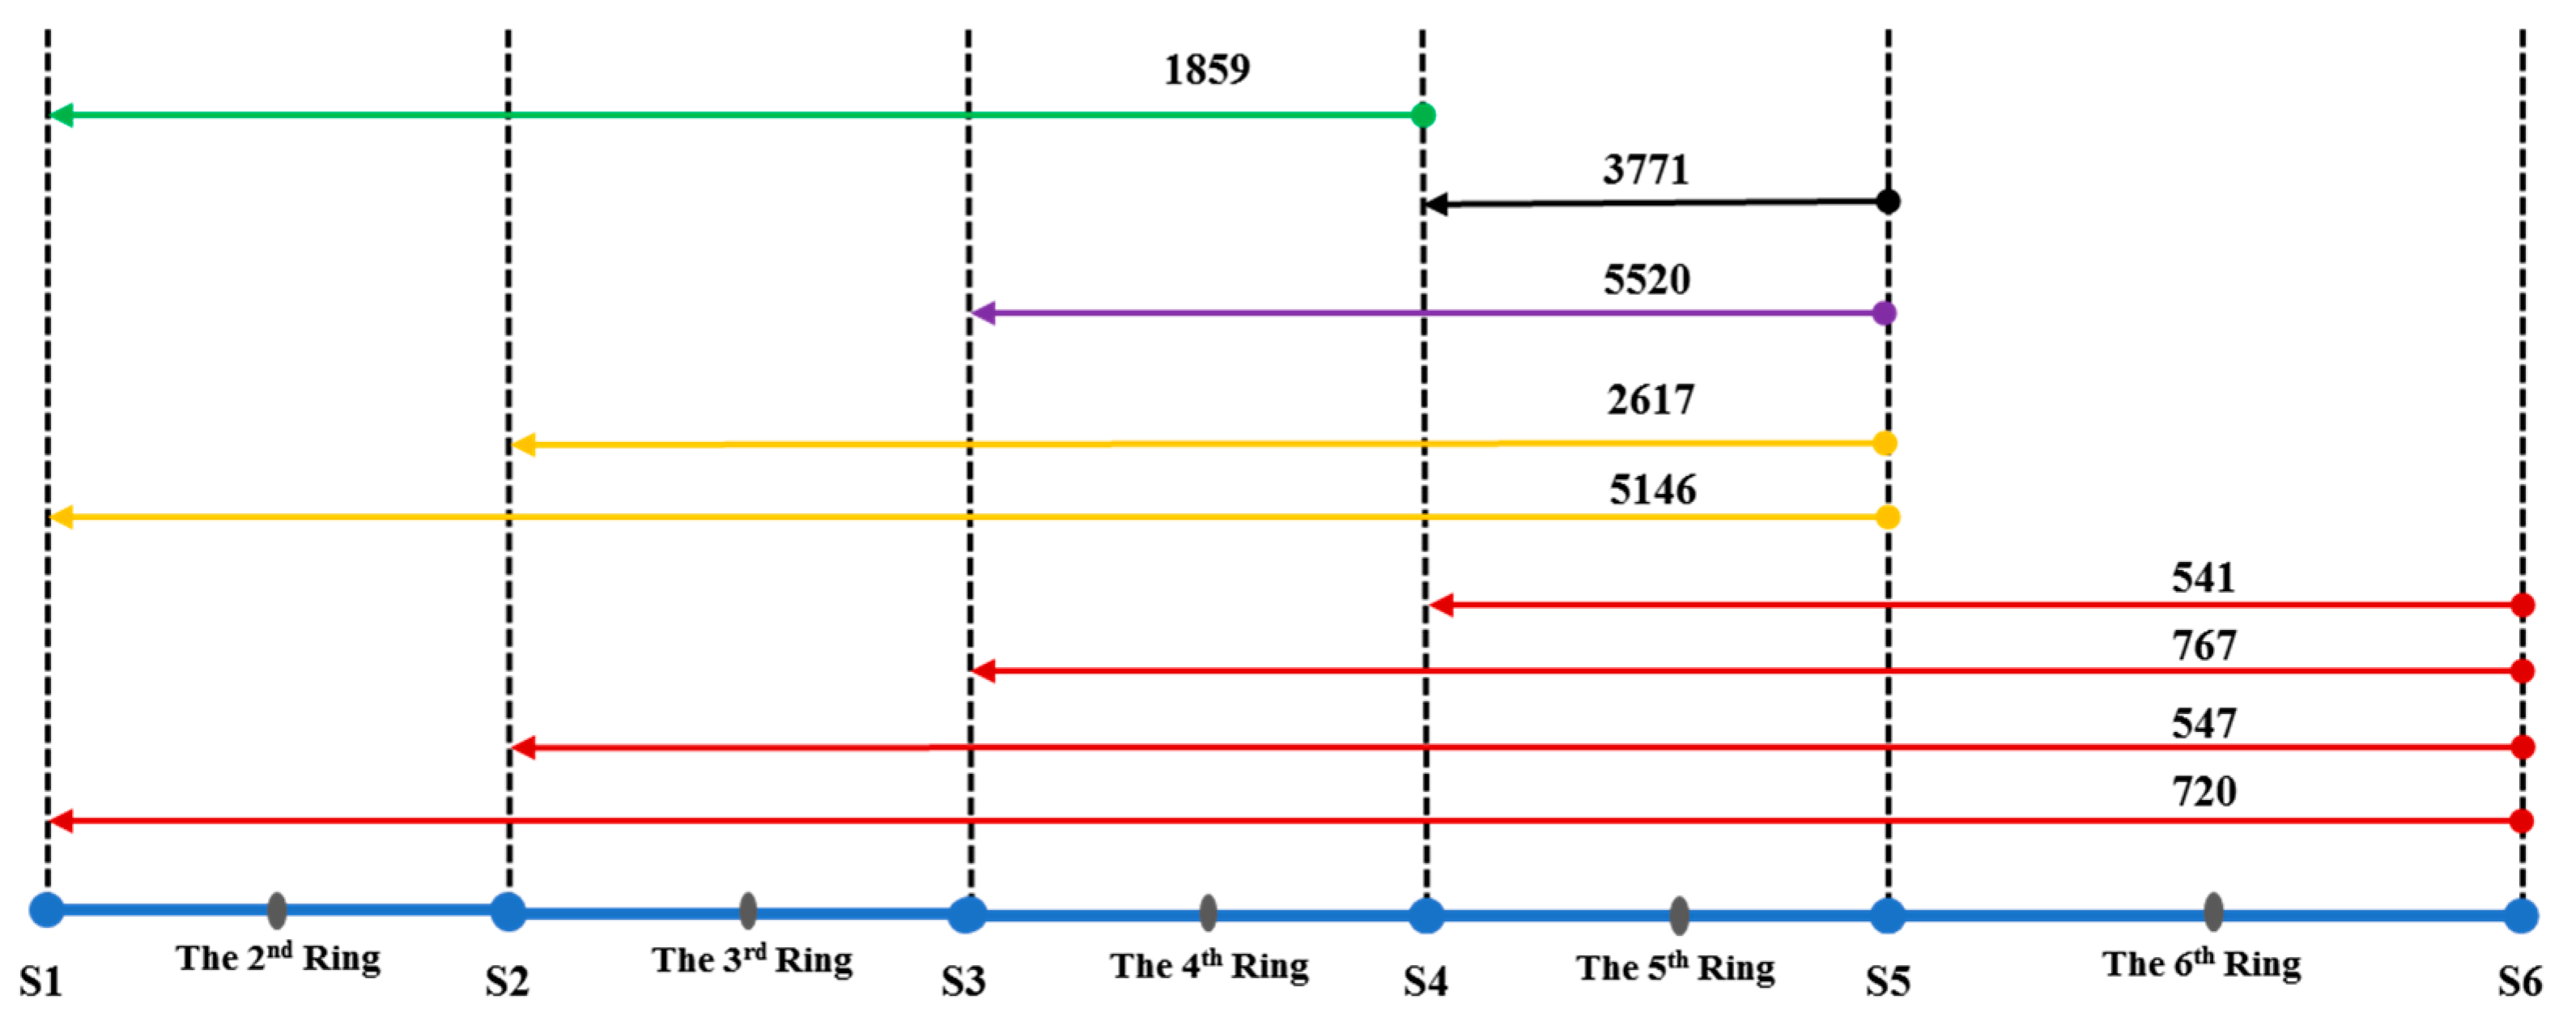
- In the 2nd Ring (abbreviated as “S1”)
- Between the 2nd Ring and the 3rd Ring (abbreviated as “S2”)
- Between the 3rd Ring and the 4th Ring (abbreviated as “S3”)
- Between the 4th Ring and the 5th Ring (abbreviated as “S4”)
- Between the 5th Ring and the 6th Ring (abbreviated as “S5”)
- Beyond the 6th Ring (abbreviated as “S6”)
3.2. Mathematics’ Model of Route Optimization for EBS
- Step 1:
- Specify the OD distribution by travel-demand analysis of MPL data or other methods.
- Step 2:
- Subsample OD demand of long-distance commuters, the threshold value of long-distance is determined based on the speed of cars, the express bus speed and last-mile travel time in the local corridor.
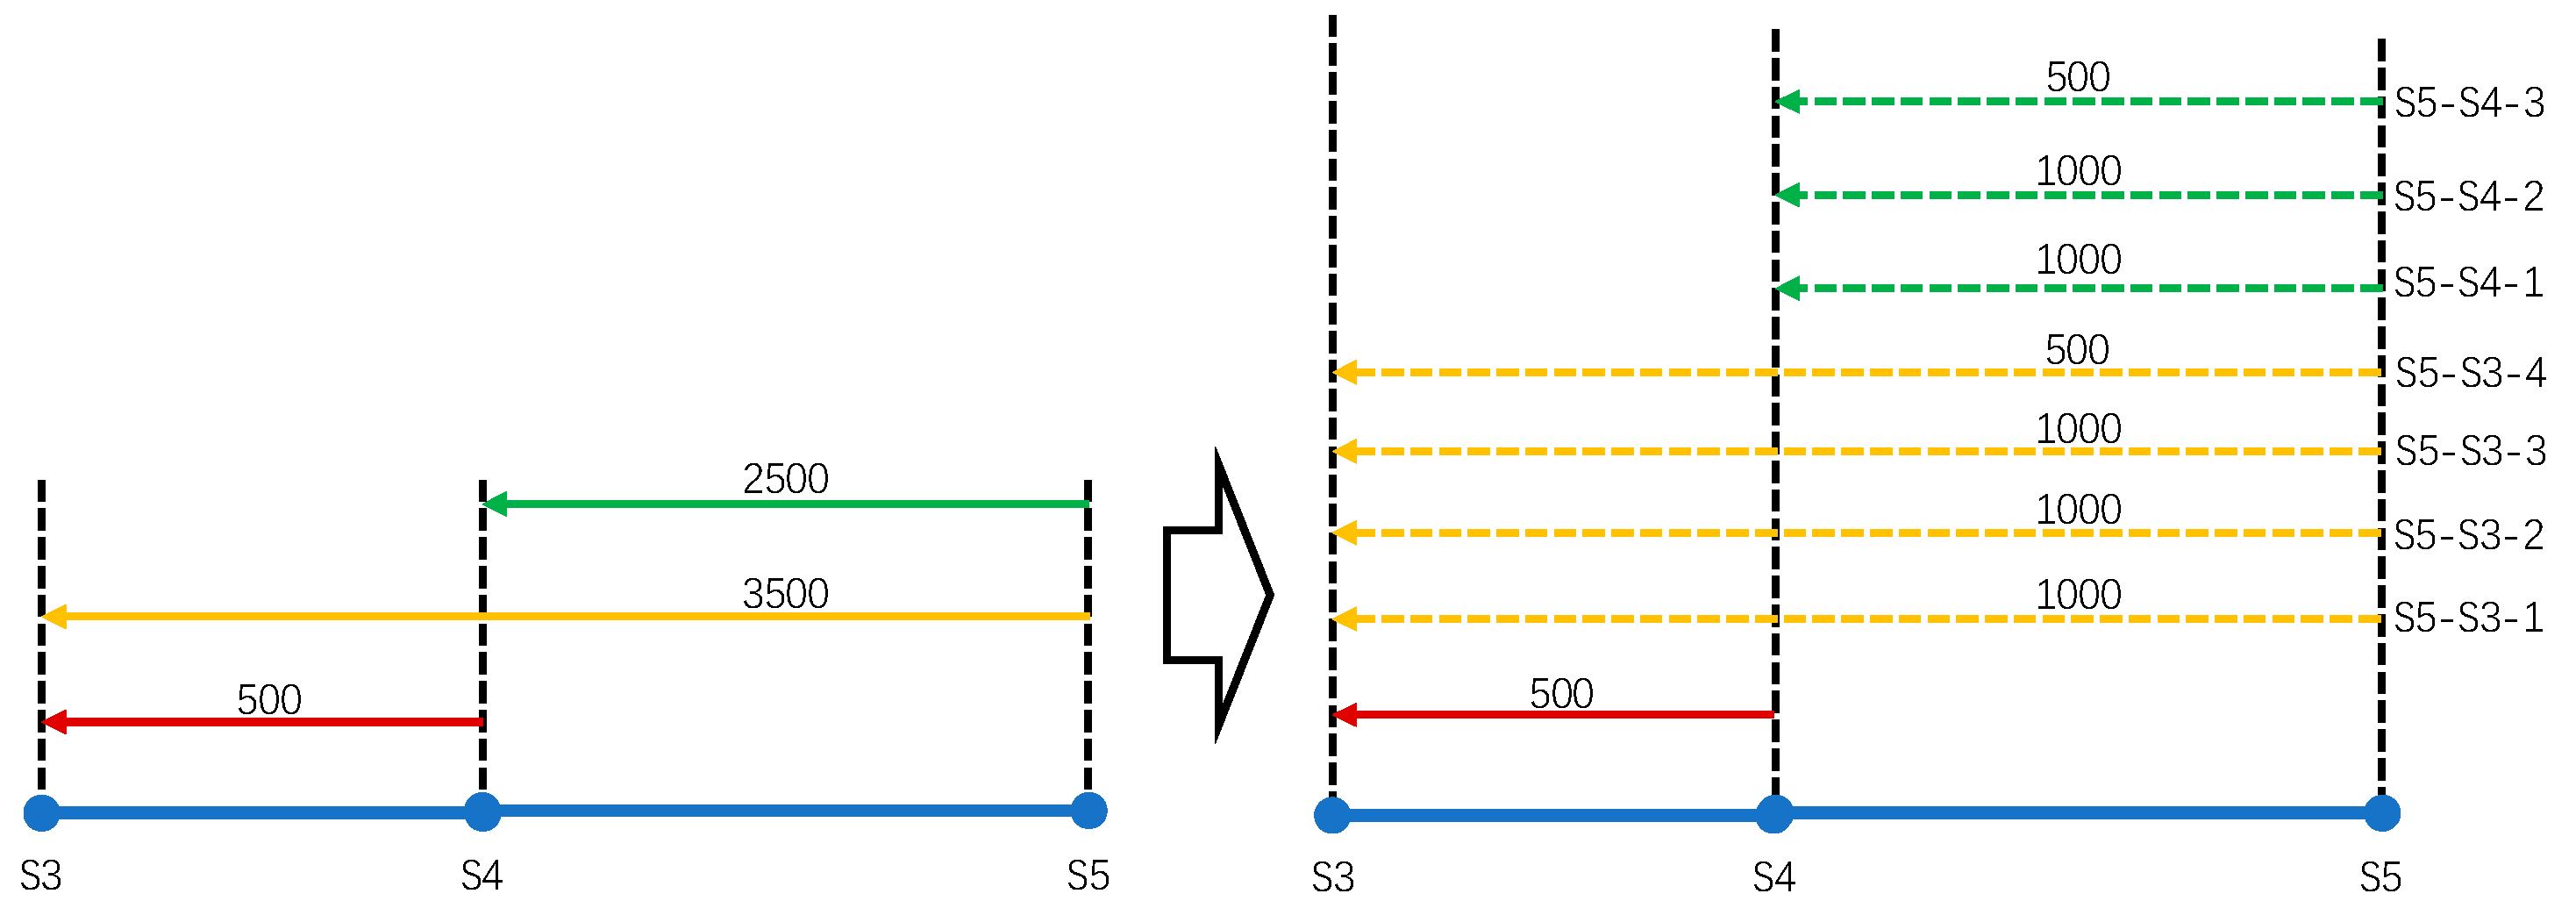
- Step 3:
- Decompose the OD distribution between two segments which exceeds the segment capacity of the EBS line.
- Step 4:
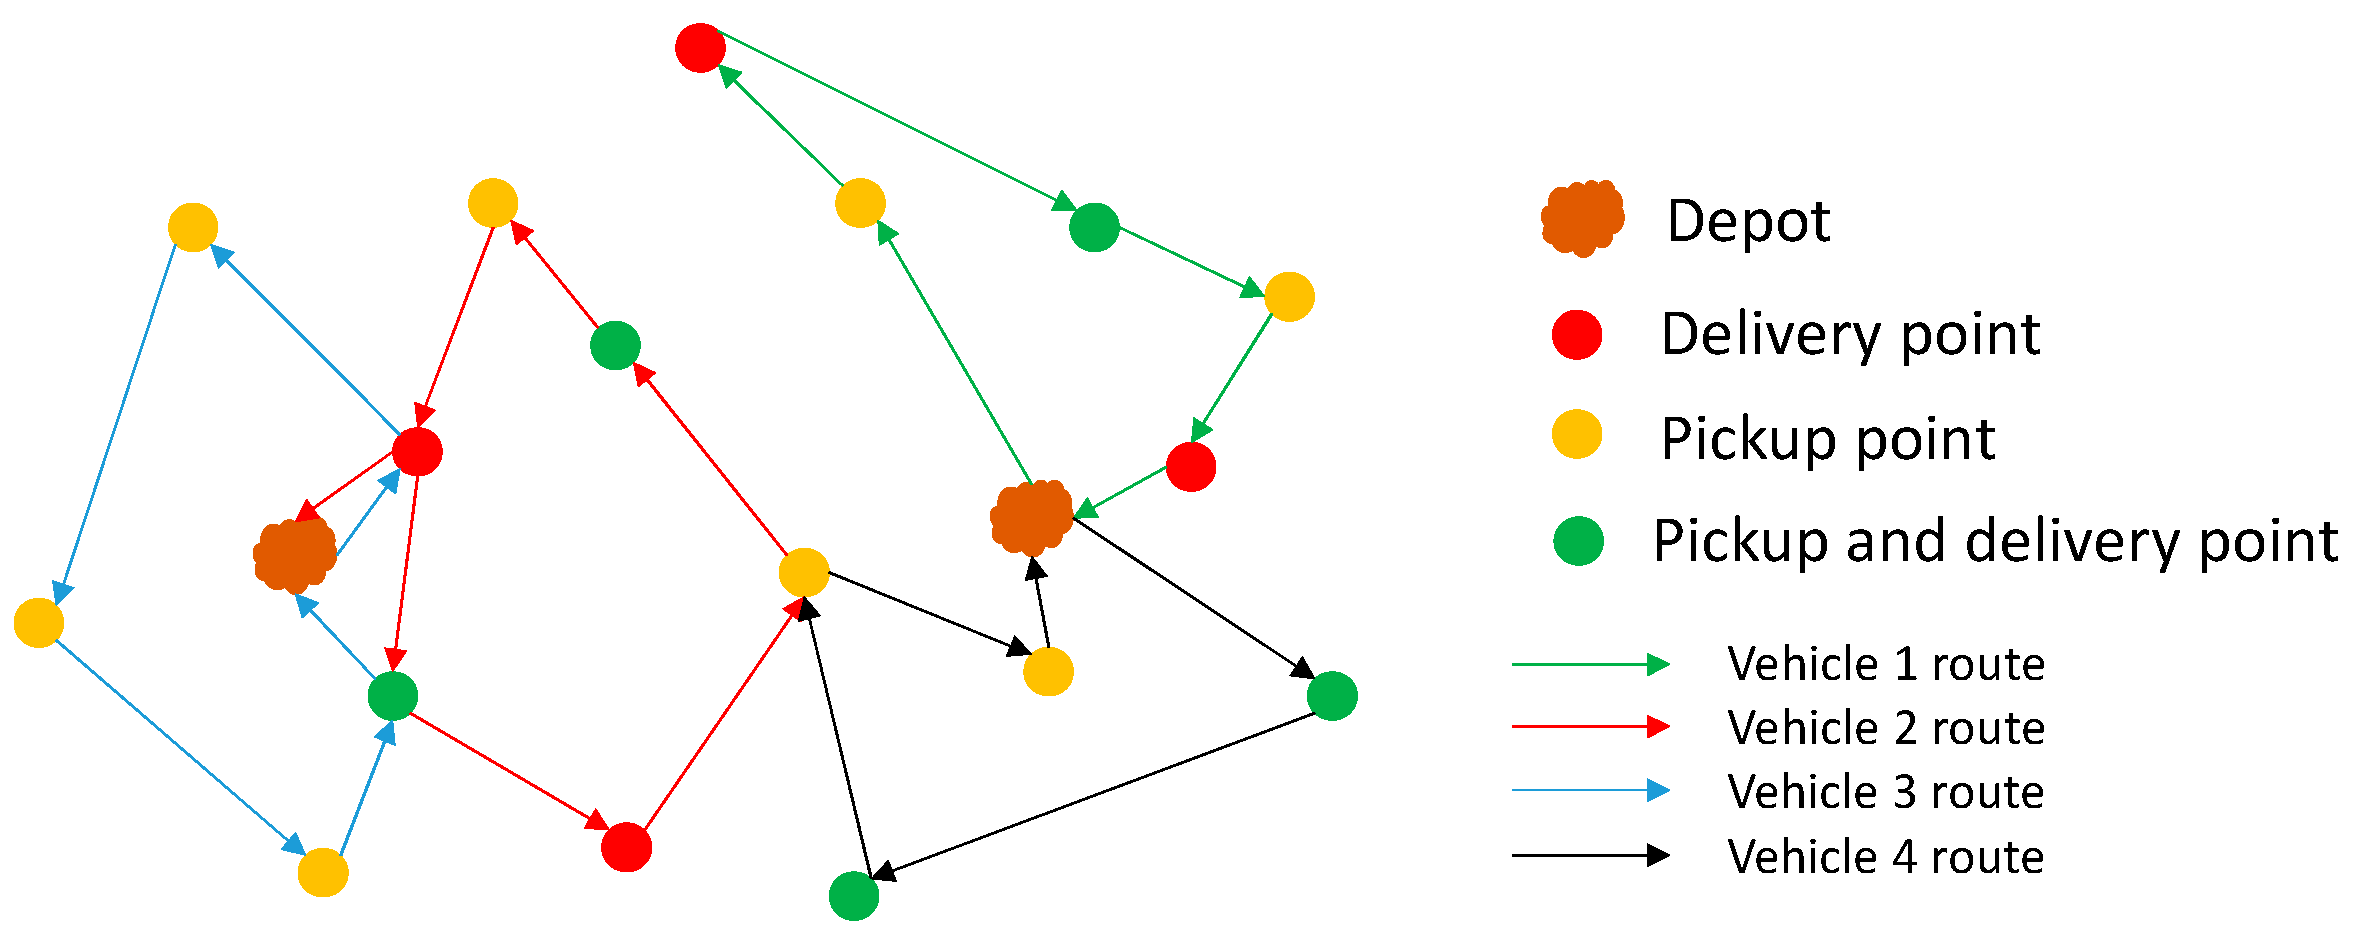
- Define on a graph where P = {1, . . ., n} is the set of pickup segments, and D = {n + 1, . . ., 2n} is the set of delivery segments. Request i is represented by segment i and i + n. K = {1, . . ., m} is the set of all EBS lines.
- Step 5:
- Assign a time window [ai, bi] to each segment i ∈ V for boarding and alighting.
- Step 6:
- Input P = {1, . . ., n}, D = {n + 1, . . ., 2n}, Request i, the time window [ai, bi], segment capacity Ck.
- Step 7:
- Solve EBSLPPD by running VrpPd software and output optimal routes result: the number of lines; start terminal, stops and destination terminal of every EBS line; total operation mileage; passengers on/off at stops.
4. Result and Discussion
5. Conclusions
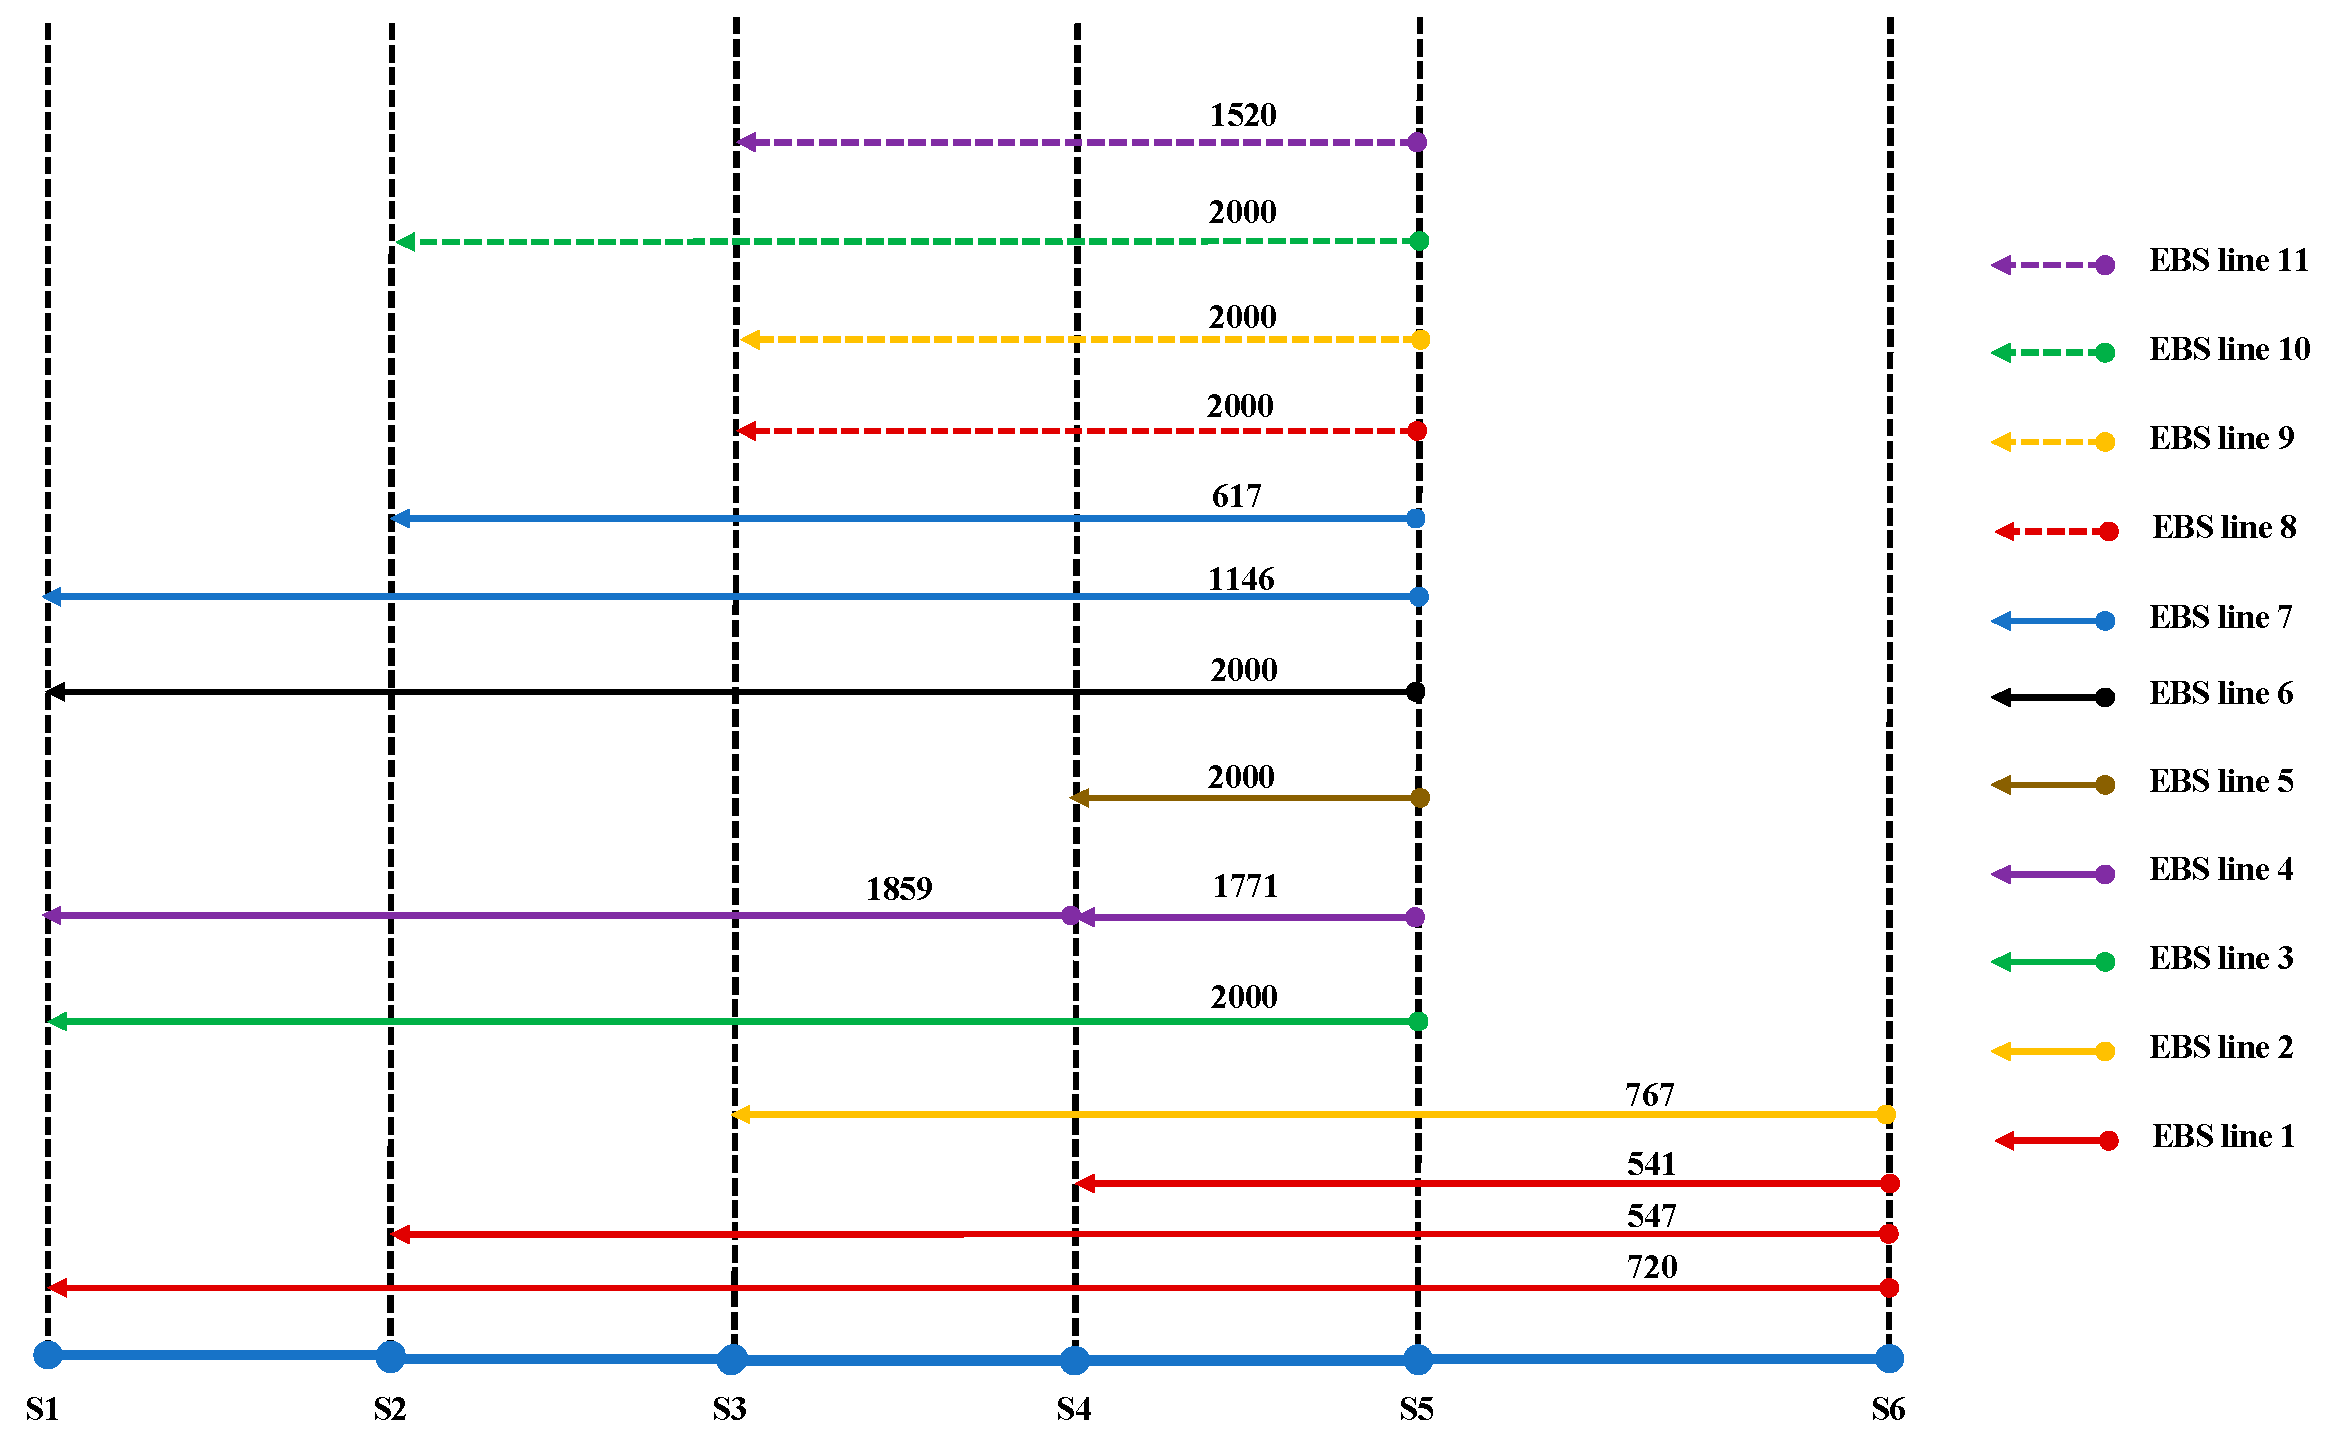
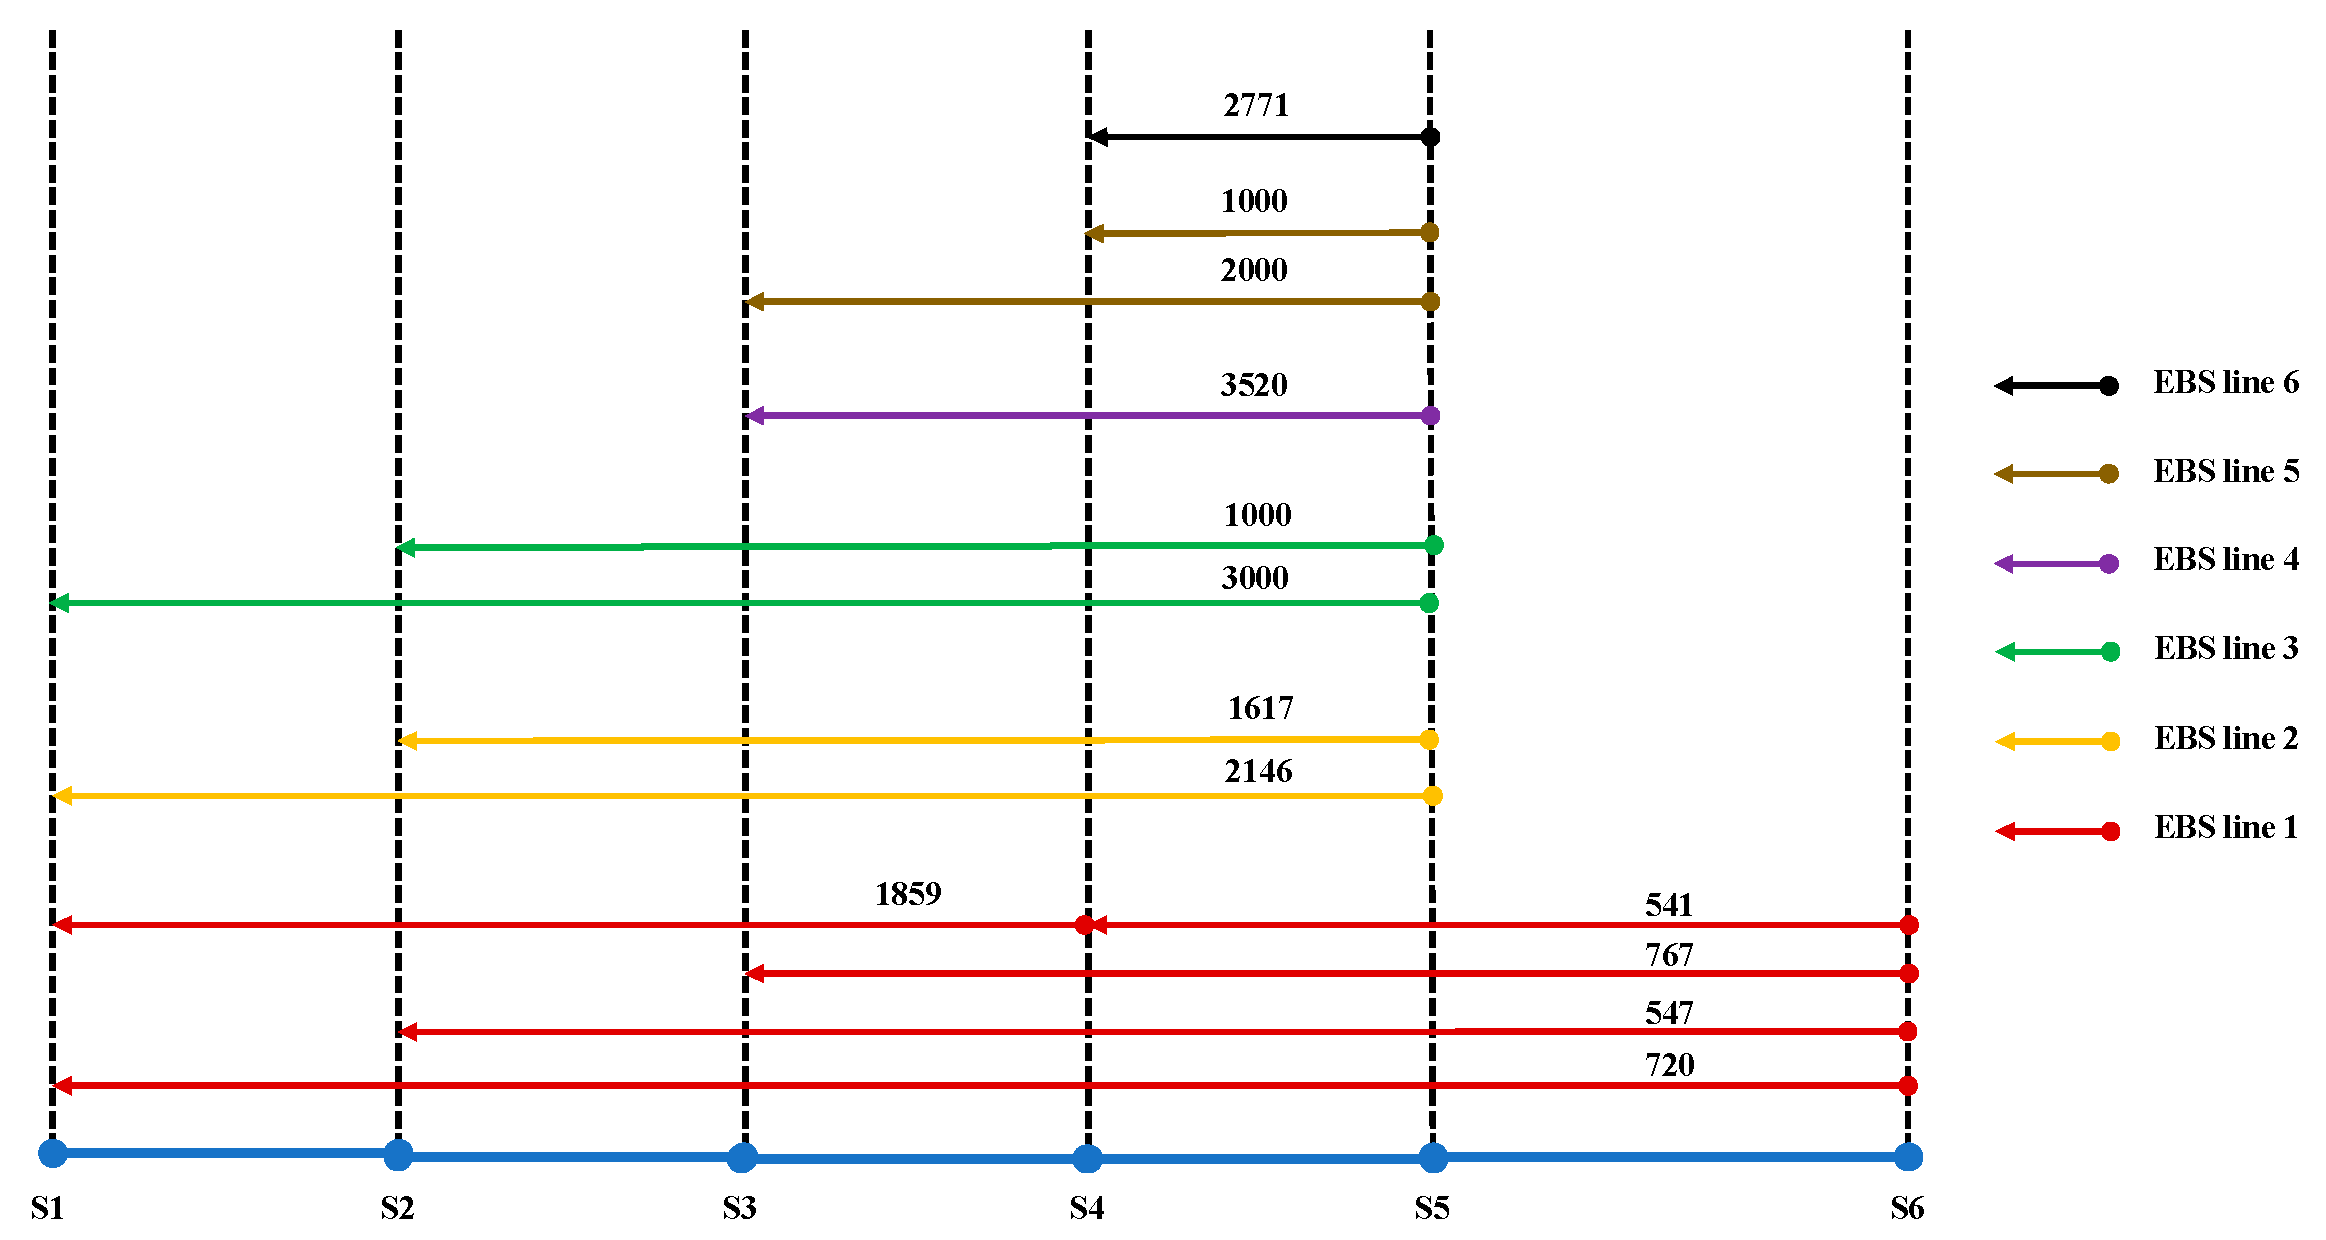
- (1)
- Using larger vehicles, larger segment capacity and shorter headways can achieve fewer EBS lines and reduce the total operation length, which would control operation costs when the route segment capacity is changed from 2000 to 3000 passengers/h. Although the scenario with a segment capacity of 4000 passengers/ h has the minimum number and line length, the fleet size and total operating mileage are increased compared with other scenarios with the segment capacity 2000 or 3000 passengers/h.
- (2)
- The increase of vehicle capacity can effectively reduce the fleet size and total operation mileage, but the larger the segment capacity, the smaller the decreased range of the fleet size and total operation mileage.
- (3)
- The increase of segment capacity may increase the total operation mileage when segment capacity is more than 3000 passengers/h.
- (1)
- The performance of the proposed routes has not been examined. Therefore, a program evaluation analysis is necessary for the future.
- (2)
- Minimizing both the passenger and operator costs as the optimization objective should be explored in future studies.
Author Contributions
Funding
Acknowledgments
Conflicts of Interest
References
- Gaubatz, P. Changing Beijing. Geogr. Rev. 1995, 85, 79–96. [Google Scholar] [CrossRef]
- Zhao, P.; Lü, B.; Woltjer, J. Conflicts in urban fringe in the transformation era: An examination of performance of the metropolitan growth management in Beijing. Habitat Int. 2009, 33, 347–356. [Google Scholar] [CrossRef]
- Zhao, P.; Lü, B.; De Roo, G. The impact of urban growth on commuting patterns in a restructuring city: Evidence from Beijing. Pap. Reg. Sci. 2011, 4, 735–754. [Google Scholar] [CrossRef]
- Xie, L. Sustainability Implications of Mass Rapid Transit on the Built Environment and Human Travel Behavior in Suburban Neighborhoods: The Beijing Case. Ph.D. Thesis, Arizona State University, Tempe, AZ, USA, August 2012. [Google Scholar]
- Fan, Y.; Allen, R.; Sun, T. Spatial mismatch in Beijing, China: Implications of job accessibility for Chinese low-wage workers. Habitat Int. 2014, 44, 202–210. [Google Scholar] [CrossRef]
- Wang, E.; Song, J.; Xu, T. From “spatial bond” to “spatial mismatch”: An assessment of Changing jobs–housing relationship in Beijing. Habitat Int. 2011, 35, 398–409. [Google Scholar] [CrossRef]
- Meng, B. The spatial organization of the separation between jobs and residential locations in Beijing. Acta Geogr. Sin. 2009, 64, 1457–1466. [Google Scholar]
- Wang, D.; Chai, Y. The jobs–housing relationship and commuting in Beijing, China: The legacy of danwei. J. Transp. Geogr. 2009, 17, 30–38. [Google Scholar] [CrossRef]
- Zhao, P.; Lü, B.; De Roo, G. Urban expansion and transportation: The impact of urban form on commuting patterns on the city fringe of Beijing. Environ. Plan. A 2010, 42, 2467–2486. [Google Scholar] [CrossRef]
- Long, Y.; Thill, J.C. Combining smart card data and household travel survey to analyze jobs–housing relationships in Beijing. Comput. Environ. Urban Syst. 2015, 53, 19–35. [Google Scholar] [CrossRef]
- Black, A. A method for determining the optimal division of express and local rail transit service. Chic. Area Transp. Stud. 1962, 347, 106–120. [Google Scholar]
- Ceder, A.; Wilson, N.H.M. Bus network design. Transp. Res. Part B 1986, 20, 331–344. [Google Scholar] [CrossRef]
- Lee, Y.; Shariat, S.; Choi, K. Optimizing skip-stop rail transit stopping strategy using a genetic algorithm. J. Public Transp. 2014, 17, 135–164. [Google Scholar] [CrossRef]
- Chiraphadhanakul, V.; Barnhart, C. Incremental bus service design: Combining limited-stop and local bus services. Public Transp. 2013, 5, 53–78. [Google Scholar] [CrossRef]
- Niu, H. Determination of the skip-stop scheduling for a congested transit line by bilevel genetic algorithm. Int. J. Comput. Intell. Sci. 2011, 4, 1158–1167. [Google Scholar] [CrossRef]
- Sun, A.; Hickman, M. The real-time stop-skipping problem. J. Intell. Transp. Syst. 2005, 9, 91–109. [Google Scholar] [CrossRef]
- Chew, J.S.C.; Zhang, L.; Gana, H.S. Optimizing limited-stop services with vehicle assignment. Transp. Res. Part E 2019, 129, 228–246. [Google Scholar] [CrossRef]
- Lin, D.; Ku, Y. Using genetic algorithms to optimize stopping patterns for passenger rail transportation. Comput.-Aided Civ. Infrastruct. Eng. 2014, 29, 264–;278. [Google Scholar] [CrossRef]
- Larrain, H.; Giesen, R.; Muñoz, J. Choosing the right express services for bus corridor with capacity restrictions. Transp. Res. Rec. 2010, 2197, 63–70. [Google Scholar] [CrossRef]
- Leiva, C.; Muñoz, J.; Giesen, R.; Larrain, H. Design of limited-stop services for an urban bus corridor with capacity constraints. Transp. Res. Part B 2010, 44, 1186–1201. [Google Scholar] [CrossRef]
- Cao, Z.; Yuan, Z.; Li, D. Estimation method for a skip-stop operation strategy for urban rail transit in China. J. Mod. Transp. 2014, 22, 174–182. [Google Scholar] [CrossRef]
- Chang, Y.; Yeh, C.; Shen, C. A multiobjective model for passenger train services planning: Application to taiwan’s high-speed rail line. Transp. Res. Part B 2000, 34, 91–106. [Google Scholar] [CrossRef]
- Chen, X.; Hellinga, B.; Chang, C.; Fu, L. Optimization of headways with stop-skipping control: A case study of bus rapid transit system. J. Adv. Transp. 2015, 49, 385–401. [Google Scholar] [CrossRef]
- Fu, L.; Liu, Q.; Calamai, P. Real-time optimization model for dynamic scheduling of transit operations. In Proceedings of the 82nd Annual Meeting of the Transportation Research Board, Washington, DC, USA, 12–16 January 2003; pp. 48–55. [Google Scholar]
- Larrain, H.; Muñoz, J.; Giesen, R. Generation and design heuristics for zonal express services. Transp. Res. Part E 2015, 79, 201–212. [Google Scholar] [CrossRef]
- Liu, Z.; Yan, Y.; Qu, X.; Zhang, Y. Bus stop-skipping scheme with random travel time. Transp. Res. Part C 2013, 35, 46–56. [Google Scholar] [CrossRef]
- Chen, J.; Liu, Z.; Zhu, S.; Wang, W. Design of limited-stop bus service with capacity constraint and stochastic travel time. Transp. Res. Part E Logist. Transp. Rev. 2015, 83, 1–15. [Google Scholar] [CrossRef]
- Wang, D.Z.; Nayan, A.; Szeto, W.Y. Optimal bus service design with limited stop services in a travel corridor. Transp. Res. Part E Logist. Transp. Rev. 2018, 111, 70–86. [Google Scholar] [CrossRef]
- Ambrosino, G.; Nelson, J.D.; Romanazzo, M. Demand Responsive Transport Services: Towards the Flexible Mobility Agency; Italian National Agency for New Technologies, Energy and the Environment: Rome, Italy, 2003. [Google Scholar]
- Byrne, B.F. Public transportation line positions and headways for minimum user and system cost in a radial case. Transp. Res. 1975, 9, 97–102. [Google Scholar] [CrossRef]
- Newell, G.F. Some issues relating to the optimal design of bus routes. Transp. Sci. 1979, 13, 20–35. [Google Scholar] [CrossRef]
- Sun, C.; Zhou, W.; Wang, Y. Scheduling combination and headway optimization of bus rapid transit. J. Transp. Syst. Eng. Inform. Technol. 2008, 8, 61–67. [Google Scholar] [CrossRef]
- Sun, F.; Zhu, W.; Wang, D. Optimal skip-stop schedule under mixed traffic conditions for minimizing travel time of passengers. Discret. Dyn. Nat. Soc. 2013, 2013, 1–8. [Google Scholar]
- Cao, Z.; Yuan, Z.; Zhang, S. Performance analysis of stop-skipping scheduling plans in rail transit under time-dependent demand. Int. J. Environ. Res. Public Health 2016, 13, 707. [Google Scholar] [CrossRef] [PubMed]
- Qi, J.; Yang, L.; Di, Z.; Li, S.; Yang, K.; Gao, Y. Integrated optimization for train operation zone and stop plan with passenger distributions. Transp. Res. Part E Logist. Transp. Rev. 2018, 109, 151–173. [Google Scholar] [CrossRef]
- Nagy, G.; Salhi, S. Heuristic algorithms for single and multiple depot vehicle routing problems with pickups and deliveries. Eur. J. Oper. Res. 2005, 162, 126–141. [Google Scholar] [CrossRef]
- Pisinger, D.; Ropke, S. A general heuristic for vehicle routing problems. Comput. Oper. Res. 2007, 34, 2403–2435. [Google Scholar] [CrossRef]
- Çolak, S.; Alexander, L.P.; Alvim, B.G.; Mehndiratta, S.R.; González, M.C. Analyzing cell phone location data for urban travel: Current methods, limitations, and opportunities. Transp. Res. Rec. J. Transp. Res. Board 2015, 2526, 126–135. [Google Scholar] [CrossRef]
- Pan, C.; Lu, J.; Di, S.; Ran, B. Cellular-based data-extracting method for trip distribution. Transp. Res. Rec. J. Transp. Res. Board 2006, 1945, 33–39. [Google Scholar] [CrossRef]
- Beijing Transportation Research Center. Beijing Transportation Annual Report 2018 (in Chinese); Beijing Transportation Research Center: Beijing, China, 2019. [Google Scholar]
- Desaulniers, G.; Desrosiers, J.; Erdmann, A.; Solomon, M.M.; Soumis, F. VRP with pickup and delivery. In The Vehicle Routing Problem, SIAM Monographs on Discrete Mathematics and Applications; Toth, P., Vigo, D., Eds.; SIAM: Philidelphia, PA, USA, 2002; Volume 9, pp. 225–242. [Google Scholar]


| No. | Length of Line (km) | Number of Stations | Number of Intersections | Station Spacing (m) | Speed (km/h) | Maximum Segment Ridership (Passengers/h) |
|---|---|---|---|---|---|---|
| 1 | 15.65 | 17 | 22 | 978 | 27 | 6009 |
| 2 | 16.00 | 20 | 21 | 842 | 23 | 2312 |
| 3 | 22.95 | 23 | 18 | 1043 | 24 | 3366 |
| 4 | 25.50 | 19 | 15 | 1417 | 26 | 2116 |
| Scenario Number | Vehicle Capacity | Route Segment Capacity (passengers/h) | Headway (min) | The Number of Lines | Route Length (km) | Fleet Size | Total Operation Mileage (km) |
|---|---|---|---|---|---|---|---|
| 1 | 100 | 2000 | 3 | 11 | 204 | 220 | 4080 |
| 2 | 3000 | 2 | 7 | 133 | 210 | 3990 | |
| 3 | 4000 | 1.5 | 6 | 109 | 240 | 4360 | |
| 4 | 150 | 2000 | 4.5 | 11 | 204 | 154 | 2856 |
| 5 | 3000 | 3 | 7 | 133 | 140 | 2660 | |
| 6 | 4000 | 2 | 6 | 109 | 180 | 3270 |
© 2020 by the authors. Licensee MDPI, Basel, Switzerland. This article is an open access article distributed under the terms and conditions of the Creative Commons Attribution (CC BY) license (http://creativecommons.org/licenses/by/4.0/).
Share and Cite
Ren, H.; Wang, Z.; Chen, Y. Optimal Express Bus Routes Design with Limited-Stop Services for Long-Distance Commuters. Sustainability 2020, 12, 1669. https://doi.org/10.3390/su12041669
Ren H, Wang Z, Chen Y. Optimal Express Bus Routes Design with Limited-Stop Services for Long-Distance Commuters. Sustainability. 2020; 12(4):1669. https://doi.org/10.3390/su12041669
Chicago/Turabian StyleRen, Hongguo, Zhenbao Wang, and Yanyan Chen. 2020. "Optimal Express Bus Routes Design with Limited-Stop Services for Long-Distance Commuters" Sustainability 12, no. 4: 1669. https://doi.org/10.3390/su12041669
APA StyleRen, H., Wang, Z., & Chen, Y. (2020). Optimal Express Bus Routes Design with Limited-Stop Services for Long-Distance Commuters. Sustainability, 12(4), 1669. https://doi.org/10.3390/su12041669