1. Introduction
Economic policy uncertainty (EPU) is a collection of economic risk where the evolution of government policy is uncertain. It may refer to uncertainty about monetary or fiscal policy, the tax regime or regulatory institutions, or uncertainty over electoral outcomes. Its harmful effect on the sustainable growth of economy has been acknowledged by academic scholars, media and policymakers. For example, Baker et al. [
1] find that an increase in EPU during the 2005–2012 period led to a decrease of 1.1% in the US industrial production. Business media sources have reported that the real gross domestic product (GDP) declined by over 1% and that more than 1 million jobs were lost after a large positive EPU shock in the US over the 2011–2012 period [
2].
EPU affects numerous aspects of the economy, both at the macro- and micro-levels. In this study, we consider trade credit provision as the dependent variable in empirical analyses. Trade credit, facilitating trade without immediate payment, is extended by suppliers when their customers buy goods and services depending upon their creditworthiness. Trade credit is a crucial financial option worldwide, only second to bank credit. The Bank for International Settlements [
3] shows that trade credit implements two-thirds of global trade. In our sample covering almost 4000 firms from 16 economies, trade credit provided accounts for 20% of total assets on average. As a crucial sustainable resource of firms [
4], trade credit helps maintain firms’ R&D investment [
5], alters the degree of financial riskiness [
6], and has substantial impacts on the profitability and sustainable growth of enterprises [
7,
8].
In literature, increasing attention has been paid to the resilience of firms to changes in EPU. Although many countries experience periods of high EPU, firms’ responses are heterogeneous. For instance, Julio and Yook [
9] show that firms in countries with common law origins reduce corporate investment less in response to an EPU shock due to national elections. Kaviani et al. [
10] find a significant positive relation between EPU and corporate credit spreads, and this relation is greater for firms with higher industry-level exposure to government policies. Drobetz et al. [
11] report that EPU reduces the sensitivity of investment to the cost of capital, and the magnitude of this reduction effect is dependent on several firm and country characteristics including the industries’ dependence on government, the opaqueness of countries, firms’ situations of analyst coverage, credit rating and size. Besides those factors discussed in previous literature, some other factors might also shape firms’ behaviors in response to EPU shocks.
In this article, we examine whether social trust affects firms’ provision of trade credit under EPU. Social trust is a belief that others are honest, reliable and have integrity. It is a “faith in people”. People in regions with high levels of social trust are likely to behave honestly and cooperatively and interact with each other in ways that reflect the norms of trustworthiness and reciprocity [
12,
13]. Based on the existing research, we conjecture that social trust facilitates the provision of trade credit under EPU. The inference consists of two steps. (1) Theoretically, the impact of EPU on trade credit is ambiguous, since there are two opposite effects. On the one hand, suppliers bear the risk that their customers will not repay the debt in the future. A high level of EPU will exacerbate this risk, and thus, firms become more reluctant to offer trade credit. This is a negative effect. On the other hand, firms may extend trade credit as a substitute for formal credit, to maintain a long relationship or to reduce increasing transaction costs under EPU. This is a positive effect. The net effect of EPU on trade credit depends on which effect dominates. (2) Regarding the former effect, social trust can reduce firms’ concern that their customers will not repay the debt. As for the latter effect, Guiso et al. [
14] and Wu et al. [
15] find that firms prefer to provide more trade credit to trustworthy customers. Hence, social trust could mitigate the negative effect of EPU on the provision of trade credit and enhance the positive effect. Overall, social trust encourages high-trust suppliers to offer more trade credit to their customers under EPU than that offered by the low-trust suppliers.
In our analyses, we use the EPU index developed by Baker et al. [
1]. This index captures “who will make economic policy decisions, what economic policy actions will be undertaken and when, and the economic effects of policy actions” (p. 1598). Based on these criterion, they derive the EPU index for several countries by counting the number of articles containing textual terms related to EPU. Since EPU is outside of the firms’ controls and is considered exogenous to any specific firm [
16,
17], a regression estimate on the impact of EPU on corporate microeconomic behavior might not suffer severe endogeneity problem. The other important variable in our study is social trust. Following La Porta et al. [
18], we measure it using the share of respondents whose answer is “
most people can be trusted” to the question “
Generally speaking, would you say that most people can be trusted or that you need to be very careful in dealing with people?” in the World Values Survey [
19]. Additionally, we control for several firm- and country-level variables related to the provision of trade credit. In our analyses, we use accounts receivable as the firms’ provision of trade credit and scale it by total assets at the beginning of the period.
Using a sample of approximately 4000 firms across 16 economies from 1995Q1 to 2015Q1, we show that firms provide less trade credit to their customers after an increase in EPU. In our preferred econometric specification, when EPU rises by one standard deviation, the trade credit to asset ratio will on average decline by 0.18 percentage points. This size is economically significant, as it implies a half-million-dollar reduction in an average firm’s accounts receivable. More importantly, we find that under EPU, firms in regions with higher social trust provide more trade credit than similar firms in regions with lower social trust. We compare a hypothetical “average” country with the mean level of social trust with a hypothetical “high-trust” country whose social trust is one-standard-deviation higher than the average. Firms in the high-trust country provides trade credit as a share of total assets that is 0.22 percentage points higher than firms in the average country, which is indeed a large benefit, as this economic magnitude completely offsets the average negative impact of EPU. Our result is robust if we isolate the impact of other country-level factors that may affect social trust, or exclude the business cycle impacts.
Changes in trade credit usually involve general equilibrium effects. In our analyses, we face a concern that the changes in firms’ trade credit provision under EPU is due to their customers’ demand for trade credit. We exploit firms’ industry-level financial constraints to address this concern. Firms with higher levels of financial constraints are less likely to offer trade credit. In other words, the supply of trade credit largely depends on the degree of financial constraints faced by the firms. On the demand side, however, there is no direct link between the customers’ demand for trade credit and the financial constraints of the trade-credit-supplying firms. Therefore, if we observe that in response to a positive EPU shock the trade credit provision of financially constrained firms declines more largely (or increases less largely) than those less constrained firms, we can confirm that the correlation between EPU and trade credit is caused by the changes in the supply side of trade credit.
In addition to dealing with the concern of general equilibrium effects, comparing the financially constrained firms with those less constrained firms enables us to examine the disproportionate effects of EPU in different industries. Since firms with larger financial constraints are less likely to offer trade credit, we hypothesize that in response to a positive EPU shock the trade credit provision of financially constrained firms declines more largely (or increases less largely) than those less constrained firms. Regarding the interactive role of social trust, we hypothesize that social trust facilitates the provision of trade credit for financially constrained firms more than financially unconstrained firms under EPU. Using two different measures of financial constraints, our empirical analyses show that financial constraints indeed aggravate the negative impact of EPU on trade credit, and in response to a positive EPU shock the financially constrained firms in high-trust countries provide more trade credit than similar firms in low-trust countries. These results are in favor of our predictions.
The rest of this article proceeds as follows.
Section 2 presents a brief literature review. In
Section 3 we discuss the data used in the analyses.
Section 4 describes the empirical methodology and results.
Section 5 discusses the implications of the findings in the study. Finally,
Section 6 concludes and talks about the directions for future research.
2. Literature Review
Our paper contributes to the body of research on how social trust affects economic behaviors. The relevant literature can be divided into two parts. One part focuses on the influence of social trust at the macroeconomic level, for example, on economic development. The other part studies the impact of social trust at the microeconomic level. Our work belongs to the latter group. Wu et al. [
15] use province-level social trust and Chinese listed non-state firm-level data and find that firms located in high-trust regions extend more trade credit to their customers. Levine et al. [
20] use the same country-level measure of social trust with us, and they show that liquidity-dependent firms with high levels of social trust receive more trade credit and experience smaller contractions in profitability and employment during banking crises than similar firms in low-trust countries. Our paper also explores how social trust influences trade credit but pays close attention to periods of high policy uncertainty. In addition to trade credit, trust can also influece several important aspects of firms’ behaviors. For instance, it is reported that social trust reduces agency cost [
21,
22], increases the proportion and likelihood of foreign ownership [
23], increases ADR liquidity [
24], and mitigates stock price crash risk [
25]. As for the impact at the macroeconomic level, social trust is found to be positively associated with the performance of government [
26], economic development [
18,
27] and financial development [
14].
We test the relation between EPU and firms’ trade credit provision, which links our paper to the emerging research on the impact of policy uncertainty at the firm level. In this work, the BBD [
1] index is the most popular EPU measure. Gulen and Ion [
28] show that EPU has a significant negative impact on corporate capital expenditures. This negative impact is amplified by higher levels of investment irreversibility, greater industry-level exposure to government policy [
28] and lower degrees of asset redeployability [
29]. Moving beyond capital expenditures, Nguyen and Phan [
30] and Bonaime et al. [
31] investigate the relation between EPU and a specific type of corporate investment: mergers and acquisitions (M&As). They point out that a high level of EPU is negatively associated with M&As, and this impact is exacerbated for more irreversible deals and acquirers whose product demand or stock returns are more sensitive to government policy. In addition to corporate investment, the BBD EPU index is significantly associated with risk premia [
32], excess market returns [
33], corporate bond credit spreads [
10], sensitivity of investment to the cost of capital [
11], and firms’ voluntary disclosures [
17] and internal controls [
34]. In addition to the BBD index, election dummies are widely used to study the impact of policy uncertainty. Julio and Yook [
9] show that firms reduce their rate of capital expenditures by 4.8%, on average, during years in which national elections are held. Using US gubernatorial elections, Jens [
35] obtains similar results: firms that are more sensitive to political uncertainty reduce their investment more. Moreover, fewer IPOs originate from states when there is an election scheduled [
36].
Finally, our paper is related to literature about the provision of trade credit. Existing studies suggest that suppliers provide trade credit to their customers mainly for the following reasons: (i) suppliers have an advantage in providing liquidity to their customers relative to formal financial institutions, as they have better knowledge of their customers’ financial and business conditions and can better judge firms’ capacity to repay the debt [
37]; (ii) trade credit reduces the transaction cost of paying bills by scheduling deliveries and payments more freely [
38]; and (iii) firms offer trade credit to maintain long relationships with their customers [
39]. From the demand side, a common view is that customers use trade credit as a substitute for bank credit when bank credit is blocked [
20] or becomes more costly [
40]. Obviously, all these incentives of trade credit provision and usage are contingent on the specific economic and social circumstances. In this study, we consider the economic policy uncertainty and social trust as potential influential factors.
It is notable that D’Mello et al. [
41] investigate the relationship between EPU and trade credit of American firms and document a negative correlation. Our study is highly relevant to their work but differs in two crucial aspects. First, their study exclusively concentrates on the companies in the US, but our research examines a distinct sample covering firms in 16 economies including both developed and developing districts. Second, our research pays particular attention to the role of social trust in shaping the relationship between EPU and trade credit, which has not been explored previously. Overall, our study will show that the provision of trade credit is negatively affected by EPU, on the basis of an international sample. Moreover, it will be demonstrated that the correlation between EPU and trade credit is mediated by social trust. The negative impact of EPU on trade credit is strong in low-trust regions but weak in high-trust regions. Our findings are novel and have important practical relevance.
3. Data
In this study, we examine how social trust affects firms’ provision of trade credit in response to the changes in policy uncertainty. Our sample covers 16 economies: Australia, Brazil, Chile, Colombia, Germany, Spain, France, the UK, the Hong Kong SAR of China, India, Italy, Mexico, the Netherlands, Russia, Singapore, and Sweden. (For convenience, in this article we sometimes use the word “countries” to refer to these economies, while keeping in mind that Hong Kong is not a country.) We select these economies based on the following four standards. First, each economy has at least one value (for a 5-year period) of social trust after 1995 in the World Values Survey (WVS). Next, the economy’s EPU index is available from Baker et al. [
1]. Third, we exclude observations from Mainland China because it has a considerable number of publicly listed state-owned enterprises (SOEs) that are highly regulated by the government. Finally, in the robustness check section, we try to exclude the impacts of some country-level macroeconomic variables on firms’ trade credit provision, such as the level of financial development. These country-level variables are drawn from the World Bank database and Penn World Table. Some economies are excluded due to data limitations in the robustness check section.
We then clean the dataset by the sample country’s firm-level data obtained from the Compustat Global dataset. First, the sample period extends from 1995Q1 to 2015Q1. Our period starts in 1995Q1 because the WVS includes most sample countries’ social trust values from 1995. We restrict the sample to 2015Q1 because of the limitation of data availability when we started this research. Next, we drop firms in the utilities (SIC code 4900-4999), financial (SIC code 6000-6799), and nonclassifiable (SIC code 9900-9999) industries. Third, we eliminate the top and bottom 1% values of every firm-level variable, including both dependent and explanatory variables, to reduce the disturbance of possible outliers. Finally, we ensure that every sample firm should have observations for at least 12 quarters.
Ultimately, the selection criteria produce a sample of 3882 firms, adding up to 106,509 firm-quarter observations. Each firm in the sample, on average, has over 27 observations.
3.1. Trade Credit
In this paper, we want to examine firms’ provision of trade credit in response to an increase in EPU. We are interested in accounts receivable (
), which captures the amount of services and goods owed to the firm by customers. This variable is a stock entry on the firm’s balance sheet and measures the total amount of trade credit that the firm provides to its customers. We follow Choi and Kim [
42] employing the ratio of accounts receivable to total assets (
) at the beginning of the period. Descriptive statistics of trade credit are reported in
Table 1. The mean and median of this ratio are 20.44% and 18.23%, respectively, with a standard deviation of 0.1343.
3.2. Economic Policy Uncertainty
In our framework, economic policy uncertainty shocks are a driving force of adjustments to firms’ financial decisions and, thus, their outcomes. An reliable measure of EPU is essential for our analysis. Baker et al. [
1] develop an EPU index for several countries based on news from the corresponding countries’ major newspapers. First, they count the number of articles containing at least one “economic” term, at least one “policy” term and at least one “uncertainty” term by automatically searching the digital archives of the relevant country’s major newspapers at a monthly frequency. Next, the count of articles related to EPU is scaled by the count of articles containing the common and neutral term “today” other than for the US for each newspaper and each month. The authors then normalize these time series to unit standard deviation and sum the normalized series within each month and each country to exclude the impact of changing volumes of news over time and across countries. For more details on the EPU index across countries, please refer to
http://www.policyuncertainty.com/index.html.
This index is at a monthly frequency. We transform it into a quarterly one by computing the arithmetic mean value of the corresponding quarter for each economy.
Table 1 indicates that the mean and median values of EPU index are 128.94 and 114.41, respectively, with a standard deviation of 63.25. In the regressions, we normalize this measure to zero mean and unit standard deviation.
EPU is outside of the firms’ controls and is considered exogenous to any specific firm [
16,
17]. Indeed, EPU is a macroeconomic level variable that may influence firms’ microeconomic behaviors, but any single firm’s decisions can hardly affect EPU. This property mitigates the concern about the problem of endogeneity in our regressions. Furthermore, following the literature (e.g., [
43]), the value of EPU in the last period rather than the current period is used as explanatory variable. This selection also helps mitigate the potential endogeneity, since trade credit today should not reversely affect the EPU in the past.
3.3. Social Trust
The WVS includes a subsection on “social capital, trust and organizational membership” that helps policymakers and scholars examine “people’s beliefs, values and motivations” around the world over 6 survey waves. The 6 waves were conducted for the periods of 1981–1984, 1990–1994, 1995–1998, 1999–2004, 2005–2009, and 2010–2014, respectively. We measure country-level social trust based on the answer to the following question:
Generally speaking, would you say that most people can be trusted or that you need to be very careful in dealing with people?
The WVS questionnaire allows participants to select one of three possible responses: (i)
Most people can be trusted; (ii)
You cannot be too careful in dealing with people; and (iii)
I have no answer. Following La Porta et al. [
18] and Levine et al. [
20], we compute social trust within one country in the corresponding wave as the number of respondents who answer “
most people can be trusted” scaled by the number of total respondents.
Williamson [
44] and Bilodeau and White [
45] document that a country’s social trust is persistent over time. We present the correlations of social trust across the four waves after 1995 in
Table 2 and see that these values are highly correlated. Thus, we measure each country’s social trust over the whole period as its value in the initial period. Using the initial value of social trust as the regressor helps mitigate the potential endogeneity in the econometric estimates.
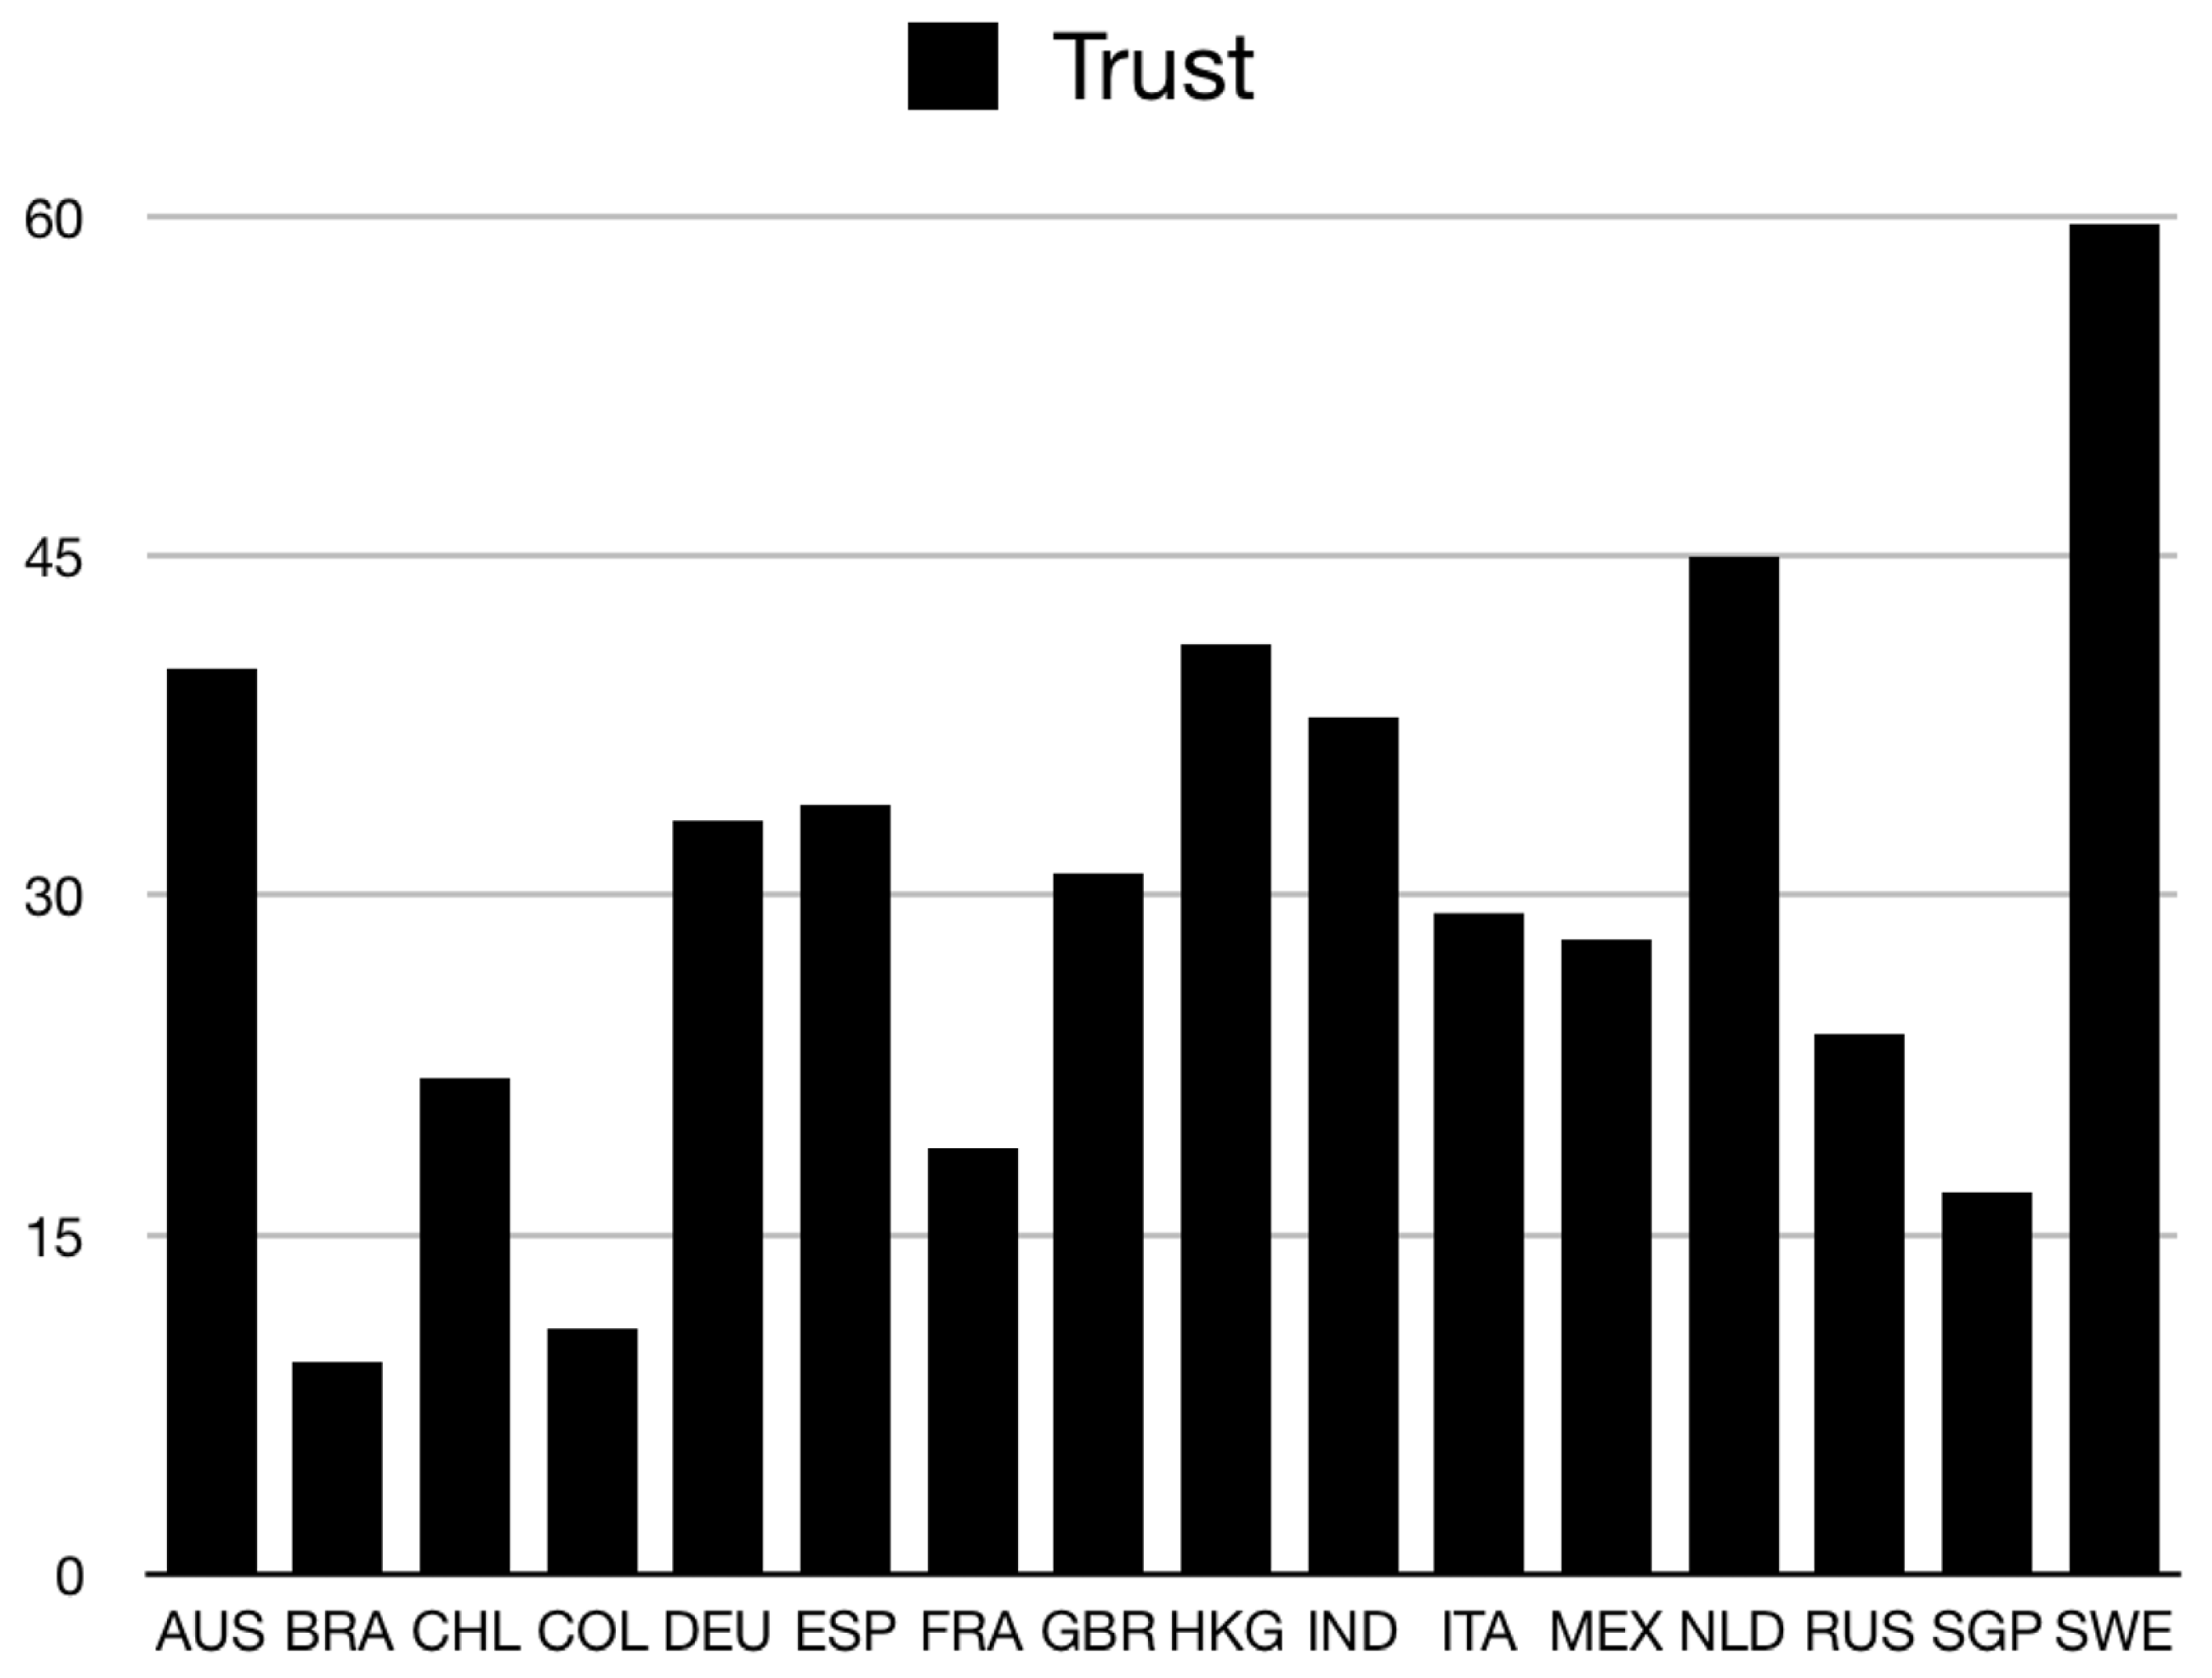
Table 1 reports the summary descriptive statistics of social trust. Its mean and median are 29.74 and 31, respectively, with a standard deviation of 10.61. We present each sample economy’s value of social trust in
Figure 1. We can see that the value of social trust is quite varied across the sample. Among the economies included in our sample, Brazil has the lowest value of social trust, 9.4, whereas Sweden has the highest value of social trust, 59.7. In the regressions, we normalize the variable of trust to zero mean.
3.4. Industry-Level Financial Constraints
In this study, building on our benchmark results, we test the additional implication that the influence of social trust is heterogeneous across various industries with different financial constraints. Some industries face tighter financial constraints for some technical reasons, such as a longer production process. Firms in industries with relatively high financial constraints may have weaker incentives to offer trade credit to their customers, and social trust may thus have a larger impact.
We follow the approach by Raddatz [
46] and use the US data from Compustat to construct the measure of industry-level financial constraints. We use US data because the US has one of the most mature markets in the world and the variation in financial constraints across industries majorly reflects technical differences in demand for external credit. In our analyses, financial constraints (
) are proxied by the ratio of inventories (
) to total sales (
). Calculating the industry-level
is based on the following two steps. First, we calculate the sum of firms’ inventories and total sales in the relevant periods, and then compute the ratio of inventories to total sales. Next, we utilize the median value of the distribution of this ratio in the corresponding industry as a measure of industry-level liquidity needs. The higher the liquidity needs are, the higher the financial constraint. In this study, we divided firms into 61 industries on the basis of two-digit SIC codes. We restrict the sample from 1979 to 1995 because the data for the regressions start in 1996. (If the study period is extended to 2015 and we construct the measure using the same procedures as before, we find that the former measure, based on data during 1979–1995, is highly correlated with the latter one, based on data during 1979–2015). The summary statistics of industry-level financial constraints are reported in
Table 1. This variable’s mean and median values are 0.12 and 0.13, respectively, with a standard deviation of 0.084. The industry group of Building Construction-General Contractors & Operative Builders (SIC code 15) has the highest level of liquidity needs, 0.60, whereas the industry group of Transportation Services (SIC code 47), Legal Services (SIC code 81), and Social Services (SIC code 83) have the lowest liquidity needs, 0.
There is a concern that our results may depend on the particular measure of industry-level financial constraints we use. To address this concern, we follow the approach by Richards and Laughlin [
47] to construct another measure of industry-level financial constraints, cash conversion cycles (
), to inspect the robustness of our results. This measure corresponds to the value of the average age of inventories (the ratio of inventories (
) over costs of goods sold (
) times 365) plus the average age of accounts receivable (the ratio of accounts receivable (
) over total sales (
) times 365), and minus the average age of accounts payable (the ratio of accounts payable (
) over costs of goods sold (
) times 365). Richards and Laughlin [
47] argue that this measure can reflect the length of the production process which starts from the point a firm pay for its raw materials and ends at the moment it is paid for the final sales of its output during its regular course of operations. The more time period one firm needs, the more it depends on external liquidity and the higher level of liquidity constraints it faces. We follow the same procedure to construct the industry-level cash conversion cycle,
, as that used for
. The higher
is, the higher the financial constraint. This variable’s mean and median are 80.08 and 82.77, respectively, with a standard deviation of 45.66. The industry group of Oil and Gas Extraction (SIC code 13), Eating and Drinking Places (SIC code 58), and Amusement and Recreation Services(SIC code 79) have the lowest value, 0, whereas the industry group of Forestry (SIC code 08), has the highest value of cash conversion cycles, 286.80. In the regressions, we normalize the measure of financial constraints to zero mean and unit standard deviation.
3.5. Firm-Level Control Variables
In our regressions, we control for firm fixed effects. Several time-varying firm-level characteristics, however, are also thought to affect firms’ incentives to supply trade credit. We follow Long et al. [
48], Petersen and Rajan [
49] and Choi and Kim [
42] for these firm-specific variables. To mitigate endogeneity concerns due to the use of their current values, we lag some regressors by one period.
Firm Size. We control for firm size, a proxy for market power, measured as the nature logarithm of one-period-lagged total assets (
) in conjunction with firm fixed effects since firm size varies over time. Its impact on trade credit is theoretically and empirically unclear. Long et al. [
48] and Wu et al. [
15] find a negative relationship between market power and trade credit provided (i.e., accounts receivable), while Petersen and Rajan [
49] show that market power has a positive impact on trade credit. On the one hand, financial theories suggest that large firms have more incentives to offer trade credit as they are likely to have a liquidation advantage. On the other hand, trade credit provides a warranty for quality. Long et al. [
48] document that small firms offer more trade credit than large and more established firms as a way to provide product quality guarantees. In addition, we include the squared term of firm size,
, to capture a possible nonlinear effect of firm size following Choi and Kim [
42] and Wu et al. [
15].
Operating Scale and Sales Change. Since the provision of trade credit occurs via transactions, the firm’s operating scales are one determinant of the volume of trade credit. Therefore, we include sales scaled as a ratio to the one-period-lagged total assets to exclude the impact of operating scale. In addition, suppliers may extend more trade credit to customers to promote sales, resulting in a positive relationship between changes in sales and the provision of trade credit relative to the beginning-of-period value of total assets. Thus, the ratio of sales change to total assets is also included as a control variable.
Stock of Inventory. Both accounts receivable and inventory are part of current assets and are substitutes in terms of asset management. Thus, firms may reduce the provision of trade credit when they hold too much inventory. However, firms with more inventory are likely to offer more trade credit for inventory management purposes. Petersen and Rajan [
49] find a positive relationship between the percentage of inventory variability over that of sales and the provision of trade credit. They interpret this positive relationship as evidence that one purpose of trade credit is inventory management. To exclude the impact of inventory, we add the one-period-lagged ratio of inventory to total assets in the empirical specification.
Retained Earnings. Firms that have more internal capital have stronger incentives to offer more trade credit, as they may worry less about the default risks. In this paper, we control for the ratio of retained earnings to total sales at the beginning of the period to address this concern.
Short-term Debt. Long et al. [
48] show that the ratio of short-term debt to total sales is positively associated with accounts receivable, and Choi and Kim [
42] find that the nature logarithm of the one-period-lagged ratio of short-term debt to total assets has a significant positive impact on the ratio of accounts receivable to total asset. These results indicate that firms use short-term debt to finance accounts receivable. In this paper, we include the ratio of short-term debt to total assets at the beginning of the period.
3.6. Country-Level Control Variables
In this paper, the key variable of interest, the EPU index, is at the country level and time varying. Thus, we cannot control for country-specific time fixed effects in the regressions. However, some country- specific characteristics may impact the provision of trade credit. For instance, Choi and Kim [
42] find that firms offer more trade credit in response to a monetary contraction shock. Better access to the domestic credit market amplifies this positive response [
50]. In the absence of country-specific time fixed effects, we control for possible underlying macroeconomic factors that may explicitly influence firms’ provision of trade credit.
Economic Development. Firms in more developed countries may perform better and thus have more room to offer trade credit. To control for the impact of economic development, we include the natural logarithm of GDP per capita in the regression equations. GDP per capita is equal to real GDP divided by population, whose data are available from the Penn World Table 9.0, in which real GDP refers to the expenditure-side real GDP at chained PPPs. These data are available at a yearly frequency. We extend the data to a quarterly frequency by letting the quarterly GDP per capita be identical to the value in the corresponding year. Additionally, we lag this variable by one year to mitigate the endogeneity problem.
Financial Market. Existing economic theories suggest that the financial system plays an important role in firms’ financing behaviors, as well as in business performance [
51,
52]. We intend to control for the impact of the development of financial institutions and stock markets. Financial institution development is captured by the ratio of private credit by banks and other financial institutions to GDP, and stock market development is measured by stock market capitalization as a ratio to GDP.
Liquidity Conditions. Firms make financing decisions partly based on current aggregate external liquidity conditions. Lin and Ye [
50] use the growth rate of M2 to denote domestic credit conditions. Here, we measure liquidity conditions using a similar index, the growth rate of broad money (M3), to control for the impact of liquidity shocks.
Table 1 summarizes the descriptive statistics of the macroeconomic variables mentioned above. One concern is that these country-level characteristics also affect the transmission of uncertainty shocks. For instance, Aghion et al. [
53] find that a higher degree of financial development can reduce the negative impact of exchange rate volatility on productivity growth. To address this concern, we add interactions between EPU and country-level characteristics to check the robustness of our main results.
In addition to the concerns related to the aforementioned macroeconomic variables, one concern in our analyses is that a high level of trust is just a result of people’s high confidence in government, a high degree of contract enforcement, a high-quality institutional system, or a good legal system to protect minority shareholders. To isolate their impacts on the transmissions of EPU shocks, we interact the BBD index with the level of people’s confidence in their government (), the effectiveness of the legal system in enforcing contracts (), the index of institutional quality (), and the degree to which the formal legal system protects minority shareholders (), respectively, in our robustness check analyses. We obtain these four country-level variables from various sources. We develop the index of residents’ confidence in government based on the answers to the following question in the WVS:
I am going to name a number of organizations. For each one, could you tell me how much confidence you have in them: a great deal of confidence, quite a lot of confidence, not very much confidence or none at all?
We measure people’s confidence in government using the percentage of respondents who answer “a great deal of confidence” or “quite a lot of confidence” of the number of total respondents. The index of rule of law comes from the Worldwide Governance Indicator provided by the World Bank. The index of institution quality comes from Kunčič [
54]. An “anti-self-dealing” index reflects the extent to which the legal systems can protect minority shareholders from expropriation by corporate insiders. We obtain this index from the research by Djankov et al. [
55].
4. Empirical Analyses
In this section, we present the empirical analyses in detail. We start by examining the impact of EPU on the corporate provision of trade credit. We then check whether this impact is affected by the corresponding country’s social trust. Finally, we carefully examine the robustness of our results.
4.1. The Impact of EPU on Trade Credit
As mentioned in the literature review, existing studies show that EPU has a considerable impact on areas of corporate finance, such as corporate investment and credit spreads. In this subsection, we now consider a different perspective by investigating its role in corporate trade credit provision.
The impact of EPU is unclear based on the existing theory of trade credit. First, firms may provide less trade credit because high EPU aggravates their concerns about their customers’ abilities to repay debts. We call this the negative effect. Second, customers obtain less formal credit, such as bank loans, during periods of high policy uncertainty. Firms might be willing to provide more trade credit to their customers to keep their sales. A long relationship is more valuable under EPU, and firms would like to offer more trade credit in order to maintain this relationship. High EPU entails high transaction costs. Firms are willing to use more trade credit to reduce this cost. We call this the positive effect. Thus, the net impact of EPU on the provision of trade credit depends on which effect dominates. The net effect is negative if the former dominates and vice versa.
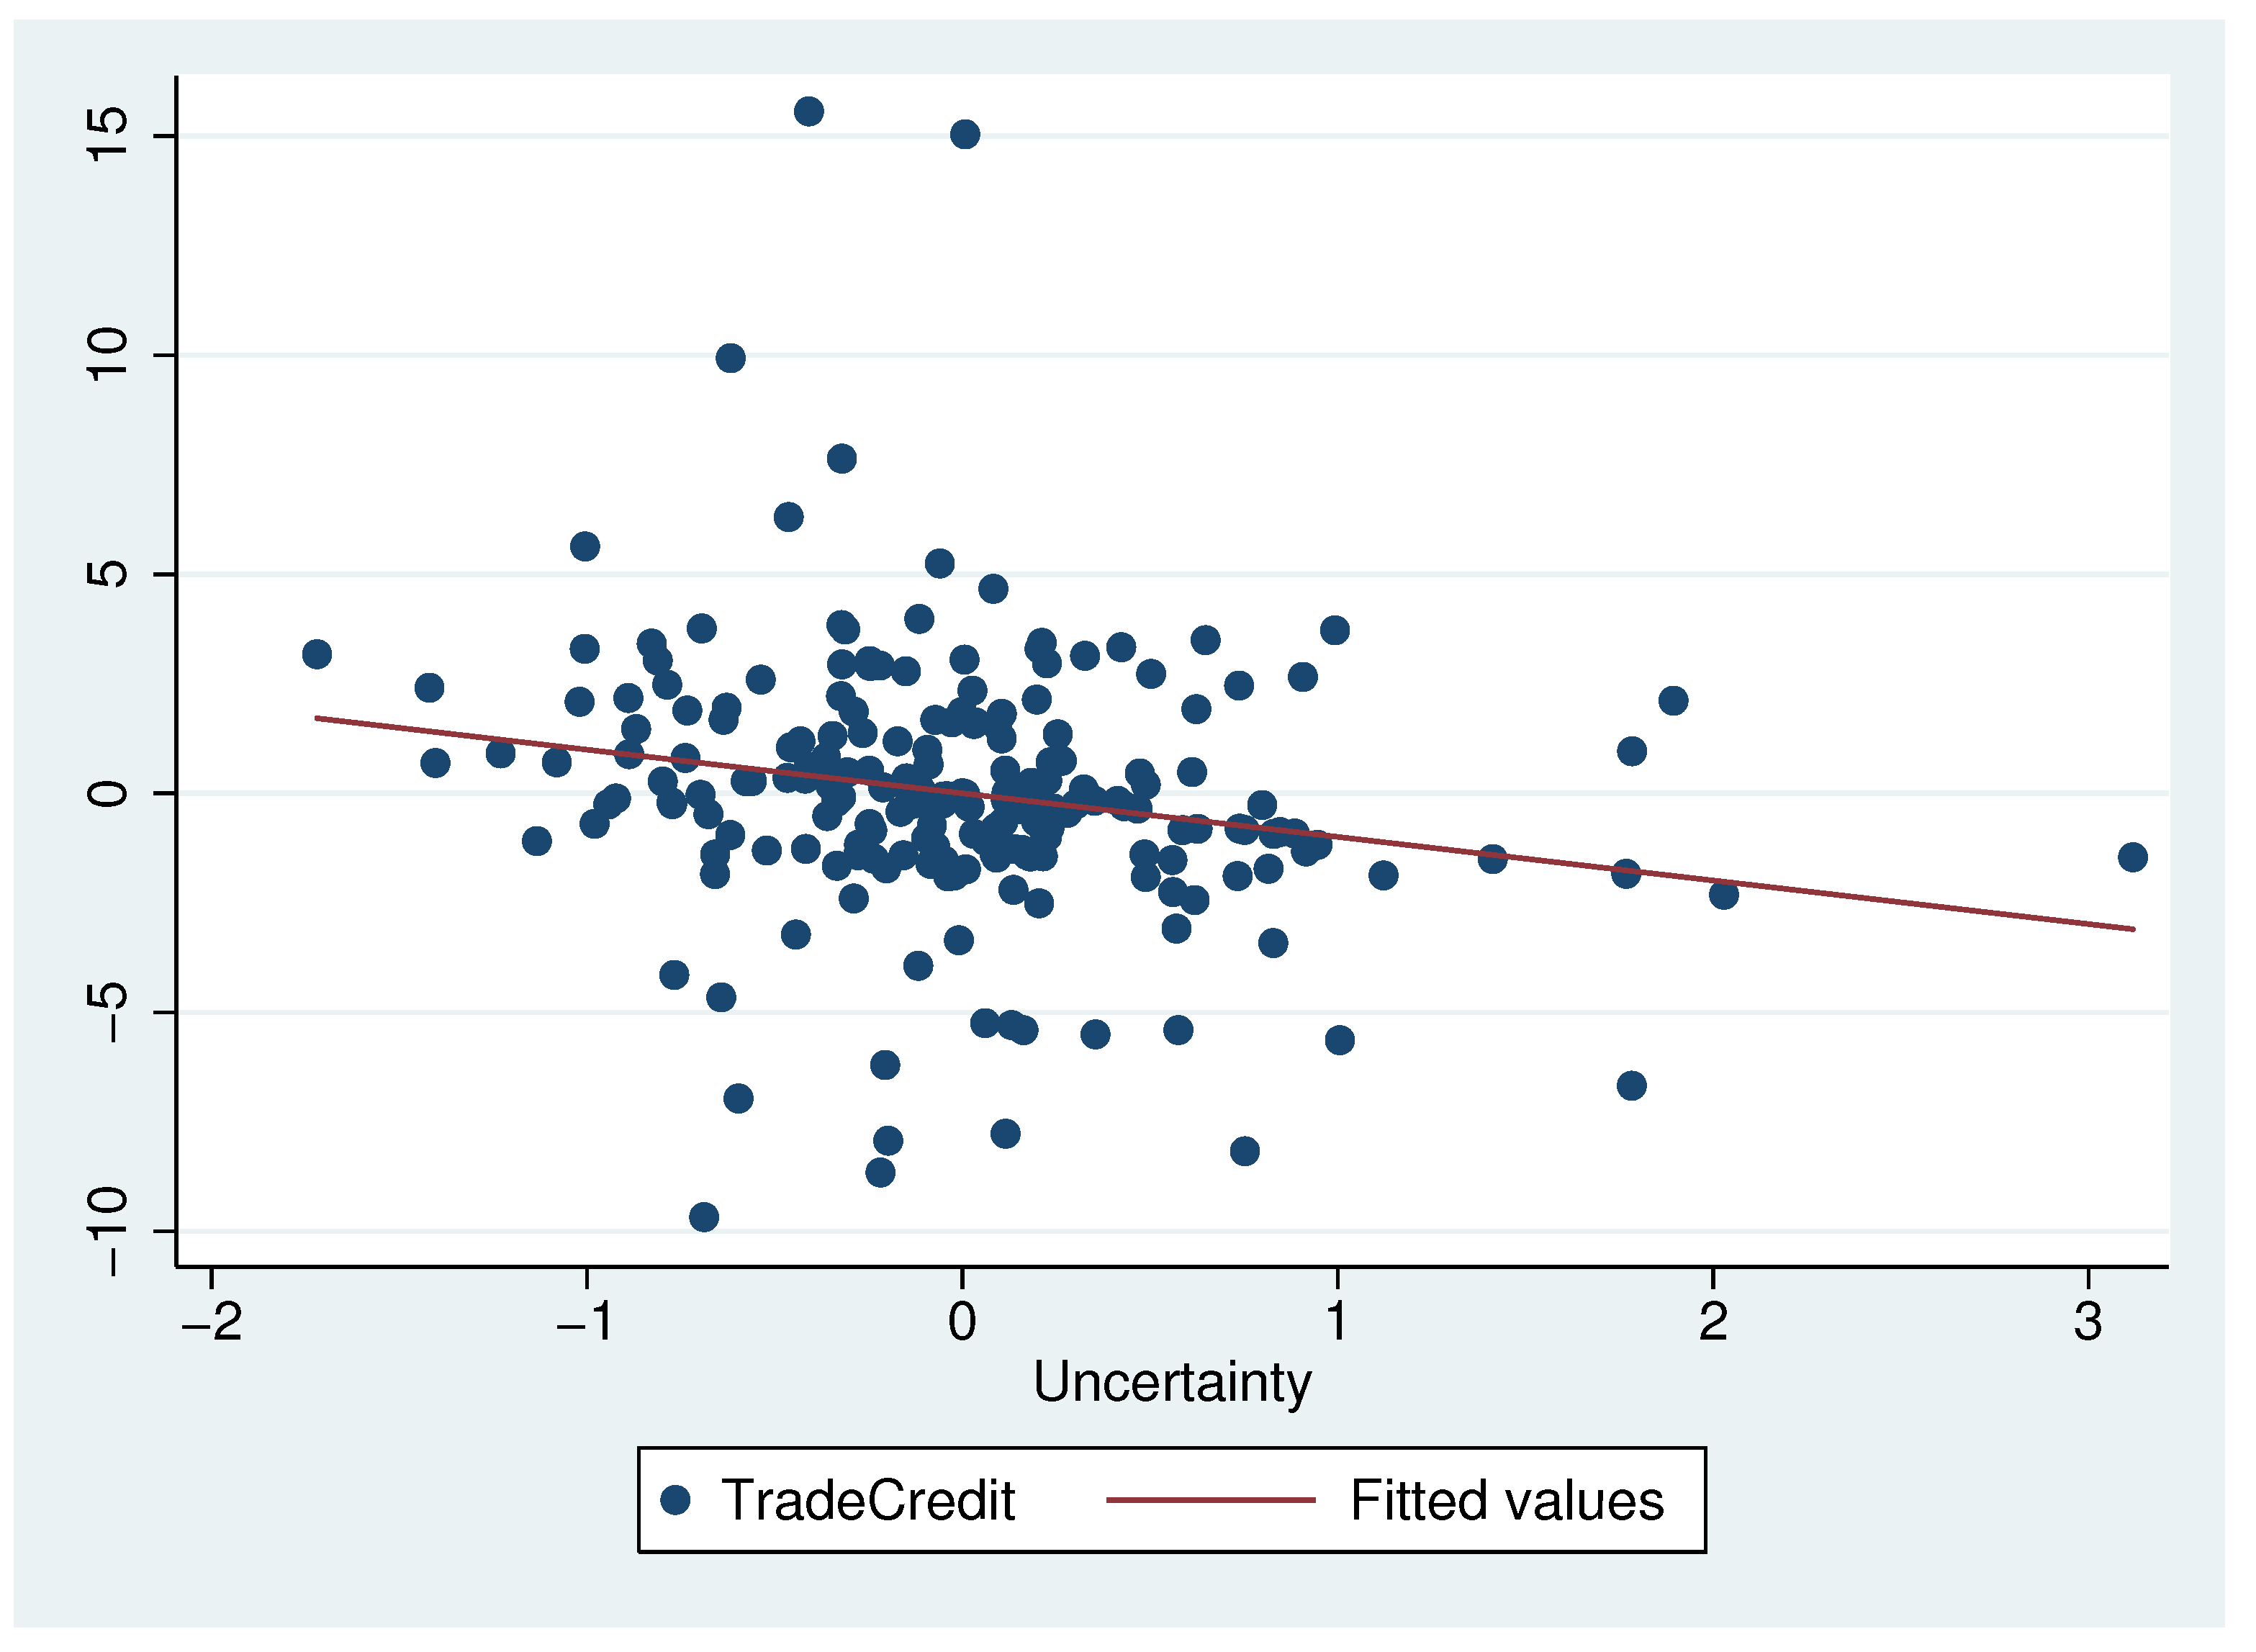
First, we show some preliminary visual results.
Figure 2 displays the relationship between EPU and the country-quarter mean of the ratio of accounts receivable to one-period-lagged total assets. We can see that corporate trade credit provision is negatively associated with EPU. Thus, we conjecture that the negative effect of EPU dominates its positive effect, and hypothesize that the aggregate impact of policy uncertainty on trade credit is negative.
To test this hypothesis, we estimate the following econometric regression specification:
where
is the accounts receivable of firm
i in country
c in period
t and
denotes firm
i’s total assets in period
.
is the one-quarter-lagged index of economic policy uncertainty in country
c.
represents a set of firm-level time-variant characteristics. It contains firm size (
)) and its square, total sales (
), changes in total sales (
), inventory (
), retained earnings (
), and short-term debt (
). All firm-level controls except the firm size and its square are scaled by one-period-lagged total assets (
). Since we want to see the impact of economic policy uncertainty, we cannot control for country-specific quarter fixed effects. To isolate the impact of EPU, we should consider the impact of other macroeconomic factors as comprehensively as possible. We add a vector of time-varying macroeconomic predictors of country
c in period
t,
, in the regression equation. It consists of real GDP per capita (
), the index of financial development (
) and stock market capitalization (
) and the growth rate of broad money M3 (
). The macroeconomic variables are in a yearly frequency. We lag them for one year, expect for the growth rate of broad money, to mitigate the endogeneity concerns. Some firm characteristics are persistent over time. For instance, Lemmon et al. [
56] find that the corporate capital structure is stable over a long period. These time-invariant unobservable firm-level factors may have considerable impacts on firms’ capacities to obtain trade credit from their suppliers. For example, firms with longer relationships with their suppliers may receive more trade credit, reflecting the importance of the corresponding customers [
57,
58]. To address these concerns, we include firm fixed effects,
, in our regressions.
denotes the time fixed effects.
is the error term.
,
,
and
are coefficients to be estimated. Standard errors of estimates are clustered at the country and quarter levels, since the variable of EPU is at these levels.
We are interested in the coefficient on EPU,
, which captures the impact of economic policy uncertainty on the provision of trade credit. A negative estimated value of
supports our hypothesis.
Table 3 reports the estimation results of Equation (
1). The only difference between column (i) and column (ii) is whether the macroeconomic variables are excluded from the regression equations. According to the estimates, the coefficients on economic policy uncertainty are negative and significant at the
level at least, implying that policy uncertainty has a negative impact on firms’ provision of trade credit. This is consistent with our prediction from
Figure 2. To understand the magnitude of this negative impact, we use the regression result in column (ii) as an example. If the index of economic policy uncertainty increases by one standard deviation, the ratio of accounts receivable to one-period-lagged total assets will decrease by 0.18 percentage points, corresponding to 0.88% of the mean value of the ratio (20.44). In monetary terms, on average, this implies a half-million-dollar reduction in trade credit for a firm in our sample.
4.2. The Role of Social Trust
Having established that policy uncertainty has a net negative impact on firms’ provision of trade credit to their customers, our main empirical analyses test how social trust affects this negative impact. Prior to the formal regression analyses, we can qualitatively analyze the role of social trust from the perspective of two contrary effects of policy uncertainty—a negative effect and a positive effect as discussed previously. Firms in countries with higher levels of social trust are more likely to believe their customers are trustworthy. On the one hand, this belief alleviates the negative effect of EPU by reducing lenders’ concern that customers will not pay in the future. On the other hand, existing studies show that social trust facilitates trade credit [
14,
15], especially when formal credit channels, such as bank credit, are frozen [
20]. Social trust enhances the positive effect of EPU. Overall, the argument above suggests that social trust mitigates the net negative impact of EPU on trade credit provision.
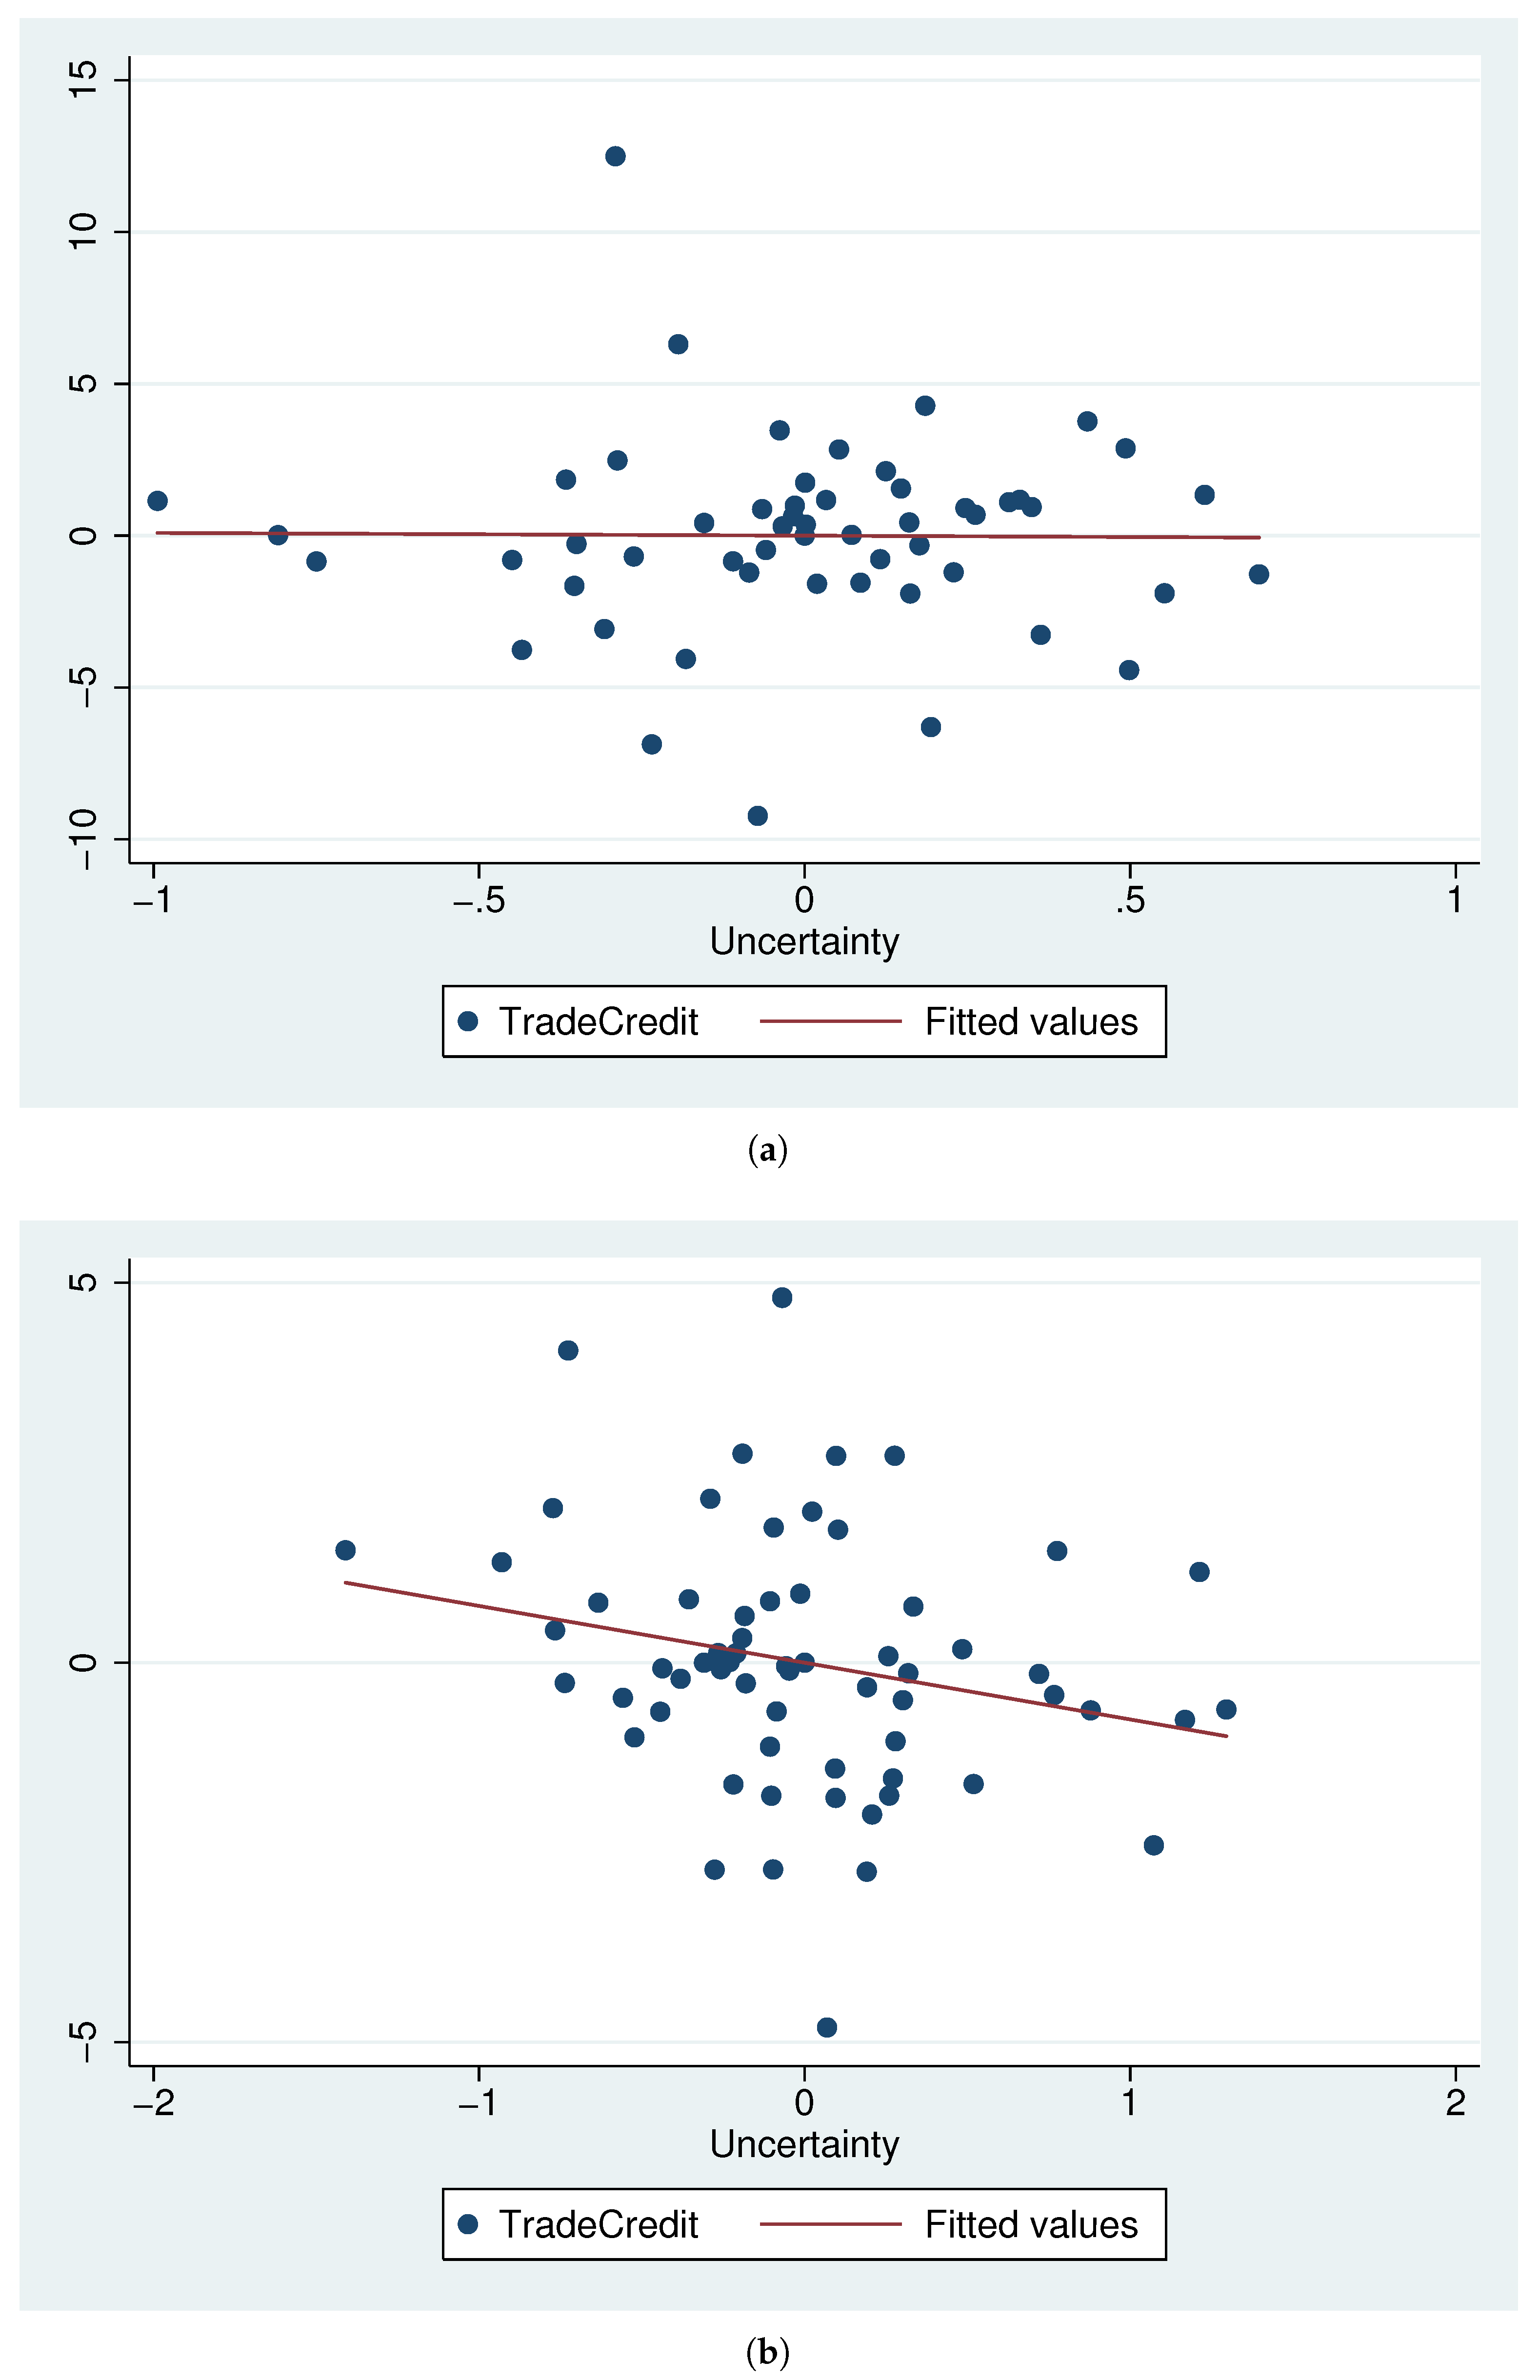
We first demonstrate some preliminary visual results in
Figure 3. We construct two subsamples of countries. One is the high-trust group whose social trust is above the median level, whereas the other is the low-trust group with trust below the median level.
Figure 3a shows the relationship between EPU and the country-quarter mean of trade credit provision in the high-trust group, and
Figure 3b shows the low-trust group. As shown in the graph, in the low-trust group, the provision of trade credit declines more as EPU increases, which is in line with our conjecture.
To test the conjecture, we estimate the main regression equation:
where
is the value of social trust in the initial sample period in country
c, and the other variables are as in Equation (
1).
,
,
,
and
are coefficients to be estimated. Standard errors are still clustered at the country and quarter levels. It is notable that in Equation (
2) the social trust
is not included as an independent variable, because its influence is absorbed in the fixed effect. A positive value of
favors our conjecture.
Columns (i)–(iii) in
Table 4 report our benchmark estimates of whether social trust facilitates trade credit financing when economic policy uncertainty exists in the economy. In column (i), the regression does not include macroeconomic control variables. In column (ii), sets of firm-level and macroeconomic control variables are included. A body of literature has documented that country-specific characteristics, such as financial development, might affect the transmissions of macroeconomic shocks. To isolate the effects of these country-level features, we interact the EPU index with these variables and add them to the estimation. The results are presented in column (iii). There are two findings from our estimation results. First, the coefficients on economic policy uncertainty are negative and significant at the
level at least, implying that economic policy uncertainty has a negative impact on the provision of trade credit, in line with the results in
Table 3. Next, we obtain significant positive coefficients for the interaction term
. This finding implies that given a level of economic policy uncertainty, an increase in social trust enables firms to provide more trade credit. This finding is consistent with our conjecture that social trust improves the provision of trade credit.
The economic magnitudes of the results are substantial. We consider a hypothetical “average” country with at the sample average value (29.74) and a hypothetical “high-trust” country with one standard deviation (10.61) higher than average. Holding everything else about these two countries constant, the estimated coefficient in column (iii) indicates that a typical firm in the high-trust country provide trade credit as a share of its total assets 0.22 (= 0.021 × 10.61) percentage points higher than that in the average country when the aggregate economy suffers a positive one-standard-deviation EPU shock. This is indeed a large benefit, corresponding to of the mean value of the trade credit to assets ratio (20.44), and is almost equal to the magnitude of EPU’s average impact (−0.24).
Changes in trade credit usually involves general equilibrium effects. In our analyses, there still exists a concern that reductions in trade credit under EPU could be due to customers’ unwillingness to take on more credit. We exploit industry-level financial constraints to address this concern. Naturally, firms with tighter financial constraints have weaker incentives to provide trade credit. The impact of EPU on the provision of trade credit is larger in industries with tighter financial constraints. Thus, we infer that the impact of social trust on firms’ provision of trade credit under EPU is disproportionate. Firms in industries with tighter financial constraints benefit more from high levels of social trust. We test these conjectures by the following two steps. First, we define financial constraints using the index of liquidity needs—the ratio of inventories to sales. We construct this measure of industry-level liquidity needs based on Raddatz [
46]. The lower the liquidity needs are, the higher the financial constraints of the firms in the corresponding industry. Next, we test our conjectures using the following empirical specification:
where
is the time-invariant index of financial constraint in industry
j. In Equation (
3),
is not contained as an independent variable because its effect is absorbed in the fixed effect. A negative
and positive
favor our predictions.
Column (iv) in
Table 4 reports our estimation results. There are three findings from our estimation results. First, the coefficient on
is still significantly negative, and the coefficient on the interaction term
is still significantly positive. These are in line with the results in columns (i)–(iii). Next, we obtain significant negative coefficient for the interaction term
. This indicates that financial constraints intensify the negative influence of EPU on trade credit provision. Thirdly, the coefficient for the triple interaction term
is significantly positive. This positive coefficient implies that given a level of EPU, an increase in social trust enables financially constrained firms to provide more trade credit. This positive coefficient also supports our conjecture that after a positive EPU shock social trust improves the provision of trade credit more for the financially constrained firms, compared to those less constrained firms.
The economic magnitudes of the results are substantial. Other than the hypothetical average and high-trust countries, we further consider a hypothetical “average” industry with financial constraints equal to the sample mean and a hypothetical “financially constrained” industry with financial constraints one standard deviation higher than the average. Holding everything else constant, the estimated coefficient in column (iv) indicates that among firms in the financially constrained industry, those firms in the high-trust country provide trade credit as a share of its total assets 0.098 (= 0.0092 × 10.61) percentage points higher than similar firms in the average country, after a one-standard-deviation increase in EPU. This is indeed a large benefit, corresponding to of the magnitude of EPU’s average impact (−0.15).
4.3. Robustness Checks
In this section, we provide some robustness checks of our main results. The first concern is that the impact of social trust is just a result of other country characteristics, for example, good economic institutions. To deal with this concern, we control for the interactions of EPU with four alternative channels that may affect social trust. The next concern is that our estimates might be sensitive to the measure of financial constraints. We use an alternative measure of financial constraints to see if our results hold. Another concern is that our regressions just reflect firms’ resilience to economic downturns. We add a recession dummy and its interaction with social trust to our benchmark regression.
4.3.1. Other Country Characteristics
A high level of social trust may just be the result of a country’s other social characteristics, such as high confidence in government, a system that protects shareholders, a high-quality economic system, and an effective legal system to enforce contracts. These features can affect the economy. For example, Hasan et al. [
59] find that legal environment and awareness of property rights are associated with stronger growth. Our estimation results with respect to social trust may merely reflect the impact of other social characteristics. To address this concern, we add interactions between economic policy uncertainty and other country characteristics to empirical specification (2). The new empirical specification is as follows:
Compared to our benchmark regression, we now control for other country characteristics
that may be correlated with social trust. The variable
is the level of people’s confidence in their government.
is the effectiveness of the legal system in enforcing contracts.
is the quality of economic institutions, and
refers to the index of shareholder protection, which is a measure of the extent to which the legal system can protect minority shareholders from expropriation by corporate insiders. The measurements and sources for these country characteristic variables are presented in
Section 3.6.
We present the corresponding regression results in
Table 5. Column (i) includes the interaction between policy uncertainty and government trust to exclude the effect of people’s confidence in their government, column (ii) excludes the influence of the effectiveness of the legal system, column (iii) excludes institutional quality, and column (iv) excludes protections for shareholders.
First, we find that the coefficients on EPU are still negative and significant at the 10% level at least, suggesting that policy uncertainty indeed has a negative impact on the provision of trade credit. Next, the key coefficients on the interaction term,
, are still positive and significant at the 1% level. If we add the interactions between EPU and
to exclude the impact of other country-level characteristics, our results hold; those estimates are presented in the
Supplementary Material Table S1.
To test whether the heterogenous impacts of social trust across industries with different financial constraint levels are persistent if we exclude the influence of other country characteristics related to social trust, we estimate the following equation:
We present the corresponding regression results in
Table 6. Column (i) includes the triple interaction among EPU, index of financial constraints and government trust to exclude the impact of residents’ confidence in their government, column (ii) excludes the impact of the effectiveness of the legal system, column (iii) excludes institutional quality, and column (iv) excludes protections for shareholders.
The key coefficients on the triple interaction term,
, are still positive and significant at the 10% level at least. In the financially constrained industry, firms in the high-trust country extend more trade credit under EPU than similar firms in the average country. When we consider the impact of
on the transmissions of uncertainty shocks, our results still hold. We report them in the
Supplementary Material Table S2.
4.3.2. Alternative Measure of Financial Constraints
To inspect whether the estimates are sensitive to the measure of financial constraints, we use the indicator of cash conversion cycles (
) to replace
in Equation (
3). This selection of indicator is based on Richards and Laughlin [
47]. The industry with
above the median value is considered to have a high level of financial constraints. Then, the new empirical specification is as follows:
where
is the cash conversion cycles of industry
j. The other variables are as in Equation (
2).
We present the estimation results for this alternative measure in column (i) of
Table 7. We can see that the coefficients on the interaction,
, are positive and significant at the 1% level, and those on the triple interaction,
, are positive and significant at the 1% level. Our previous findings still hold for the new measure of financial constraints. Among firms in the financially constrained industry, those firms in the high-trust country experience smaller contractions in trade credit provision than similar firms in the average country. Our results hold if we repeat the robustness checks of
Section 4.3.1, where we control for additional country characteristics. We present these results in columns (ii)–(v) of
Table 7.
The economic magnitudes of estimates in
Table 7 are similar to those in our benchmark results. We consider a financially constrained industry whose
is one standard deviation higher the sample mean. Similar to the previous discussion, we compare the situation in a hypothetical “average” country with a “high-trust” country. Holding everything else constant, the estimated coefficients in column (i) indicate that in the financially constrained industry, those firms in the high-trust country provide trade credit as a proportion of its total assets that is 0.093 (= 0.0088 × 10.61) percentage points higher than similar firms in the average country, after a one-standard-deviation rise in EPU. This magnitude is 37.2% of the magnitude of the average impact of social trust (0.25 = 0.024 × 10.61).
4.3.3. Business Cycle Effects
Economic policy uncertainty is often high during recession periods. Levine et al. [
20] report that firms in countries with higher levels of social trust receive more trade credit during banking crises. The impact of social trust on the propagation of policy uncertainty shocks on trade credit provision may just reflect firms’ varying resiliences to recessions under different levels of social trust. To address this concern, we add a recession dummy (
) and its interaction with social trust to empirical specification (2):
where
is a dummy indicator that equals to 1 if country
c is in a recession during period
t and 0 otherwise. (We obtain a monthly recession indicator from the Federal Reserve Bank of St. Louis. These data are available for 14 countries: Australia, Brazil, Chile, Germany, Spain, France, the UK, India, Italy, South Korea, Mexico, the Netherlands, Russia, and Sweden. We translate these data into quarterly frequencies by assuming that the relevant quarter is in a recession if at least one month of this quarter is in a recession.)
To test whether the heterogenous effects of social trust on firms with different levels of financial constraints are robust, we add a recession dummy, its interaction with social trust, its interaction with financial constraints, and the triple interaction among the recession dummy, social trust and financial constraint to empirical specification (3):
Table 8 displays the results of our robustness checks. Compared to
Table 3 and
Table 4, the sample size is smaller because data for the recession indicator in some countries are not available. We first check whether our estimation results hold if we use the subsample of countries for which the recession indicator is available. Columns (i) and (iii) show the estimation results for Equations (2) and (3), respectively. We see that the coefficients on the interaction term
in both columns are positive and significant at the 1% level, and that the triple interaction term
in column (iii) is significantly positive at the 1% level. We present the results of Equations (7) and (8) in columns (ii) and (iv), respectively. After considering economic recessions and their interactions with social trust, we obtain the same results. First, social trust facilitate the provision of trade credit under EPU. Next, in the financially constrained industry, firms in the high-trust country provide more trade credit than similar firms in the average country.
4.3.4. Other Robustness Checks
We are concerned that the differential response of trade credit to EPU among countries may just reflect the different time trends of these countries. To address this concern, we add variables indexing the country-level time trends following Levine et al. [
20]. We add the time trends interacted with 16 country dummies, to exclude the pre-existing time trends across countries. We reestimate Equations (2) and (3) and report the results in the
Supplementary Material Table S3. Our main results hold.
Finally, social trust and economic policy uncertainty may be highly correlated. Countries with high levels of social trust are likely to have low levels of policy uncertainty. The significant coefficients on the interaction term may result from a high correlation between social trust and policy uncertainty. To address this concern, we test the relationship between social trust and policy uncertainty by estimating the following empirical specification:
where
and
refer to economic policy uncertainty in country
c during period
t and the social trust in country
c, respectively. A nonsignificant
implies that the two variables are not significantly correlated. The regression results are presented in the
Supplementary Material Table S4.
5. Discussions
Our research extends the scope of studies about EPU’s influences on firms’ financing channels. Previous literature has documented a substantial reduction in bank loans when EPU rises. For instance, Bordo et al. [
60] report such a phenomenon in the US; Chi and Li [
61], Hu and Gong [
62], and Jiang et al. [
63] report that in China. After observing this, it is necessary to examine whether and how other corporate financing channels change during high EPU periods. As a crucial type of informal financing, trade credit is particularly important. However, the impact of EPU on trade credit is not well explored in literature. According to our study, firms significantly shrink their provision of trade credit to their customers, in response to increases in EPU. This finding is consistent with the recent study by D’Mello et al. [
41], who report a reduction in trade credit of American firms when EPU is high. While they focus on the US, our research shows that the negative correlation between EPU and trade credit exists over a wide range of both developed and developing economies. Thus, we can actually infer that firms would generally experience a difficult time in both formal and informal financing if EPU rises. This warns that firms and financial policy makers should be particularly cautious about the problem.
The analyses in this study show that the impact of EPU on trade credit is not uniform for all firms. Firms’ reactions of trade credit provision are heterogeneous, depending on the degrees of social trust and financial constraints. Especially, the firms located in regions of low social trust and in industries with high financial constraints would heavily reduce the supply of trade credit to their customers. From the perspective of economic theory, this finding reminds researchers that the effects of EPU on firms’ decisions are mediated by some factors such as trust and financial constraint. From the perspective of business practice, this finding indicates that firms should pay attention to the characteristics of their trade credit suppliers. If their major trade credit suppliers have features of low social trust and high financial constraints, the firms had better seek for diversified financing channels or, at least, prepare to face a much tighter credit constraint during high EPU periods.
Moreover, our empirical finding about the helpful role of social trust emphasizes the importance of a good social environment during periods when economic activities are depressed by high policy uncertainty. According to our estimates, in regions with sufficiently high levels of social trust, the negative correlation between EPU and trade credit provision disappears. On the contrary, if social trust is low, the harmful impact of EPU on trade credit becomes a severe issue. Therefore, we can expect that if effective social and economic policies can be implemented to enhance social trust, the adverse effects of EPU would be largely mitigated. The sociological literature has identified several determinants of social trust, including the degree of income inequality and social conflicts. For example, Bjørnskov [
64] and Rothstein and Uslaner [
65] report that social trust is low in regions with large income inequality; Delhey and Newton [
66] report that the occurrence of social conflicts and the sense of public unsafety reduce the level of social trust. The endeavours of governments and social organizations to tackle these social problems will have beneficial economic outcomes.
6. Conclusions, Limitations, and Directions for Future Research
In this study, we investigate whether social trust facilitates firms’ provision of trade credit in an environment of EPU. Although there is a growing body of literature on the impacts of EPU and social trust, our study is the first to study the role of social trust in affecting the transmission of EPU shocks.
Our analyses are based on a wide sample of of approximately 4000 firms across 16 economies from 1995Q1 to 2015Q1. Our empirical results suggest that (i) there exists a large, negative and highly significant relation between EPU and the provision of trade credit; (ii) social trust greatly mitigates the negative impact of EPU on trade credit; and (iii) the effects of EPU and social trust are both stronger for more financially constrained firms. The impact of social trust is not a result of people’s high confidence in government, an excellent system of protecting shareholders, a high-quality institutional system or an effective legal system of enforcing contracts. Moreover, our result still holds if we exclude business cycle effects or use an alternative measure of financial constraints.
This study has several limitations that offer opportunities for future research. First, as limited by our data source, most firms included in our study sample are large firms that may not sufficiently reflect the circumstances in many small enterprises. Therefore, it is unknown whether and to what extent the findings in this study hold for small firms. For instance, as small firms usually have fewer financing channels and smaller capacity to bear risks compared to large firms, they may be more sensitive to economic volatilities and have special business strategies in response to EPU shocks. In the future, the researchers can collect data and focus on the corporates with small or even micro scale to see whether the conclusion in this study is verified. Second, although this study carefully documents the impact of EPU on trade credit provision and the role of social trust in the relationship between EPU and trade credit, we do not provide more insights about the effects of the documented phenomena on corporate business performance. For example, we do not know whether the firms’ behaviours of reducing trade credit when EPU rises is wise from the perspectives of long-term supplier–customer relationship, financial riskiness, profitability and sustainable growth. Indeed, these aspects present important research questions that can be studies in the future. More elaborate empirical models should be designed to analyse the relevant mechanisms and consequences.


