Stimulating Implementation of Sustainable Development Goals and Conservation Action: Predicting Future Land Use/Cover Change in Virunga National Park, Congo


Abstract
1. Introduction
Problem Statement and Research Questions
- Have there been major land cover changes within the study area in the last 10 years? And if so, what kind of land cover changes?
- What has the spatial extent of the land cover change been and which areas have experienced the highest rate of changes?
- What are the major driving forces behind these changes?
- What will the extent of land change be by 2030?
- How can the future land cover prediction for the Virunga study area be used to support and underpin policy frameworks towards achieving the SDG’s?
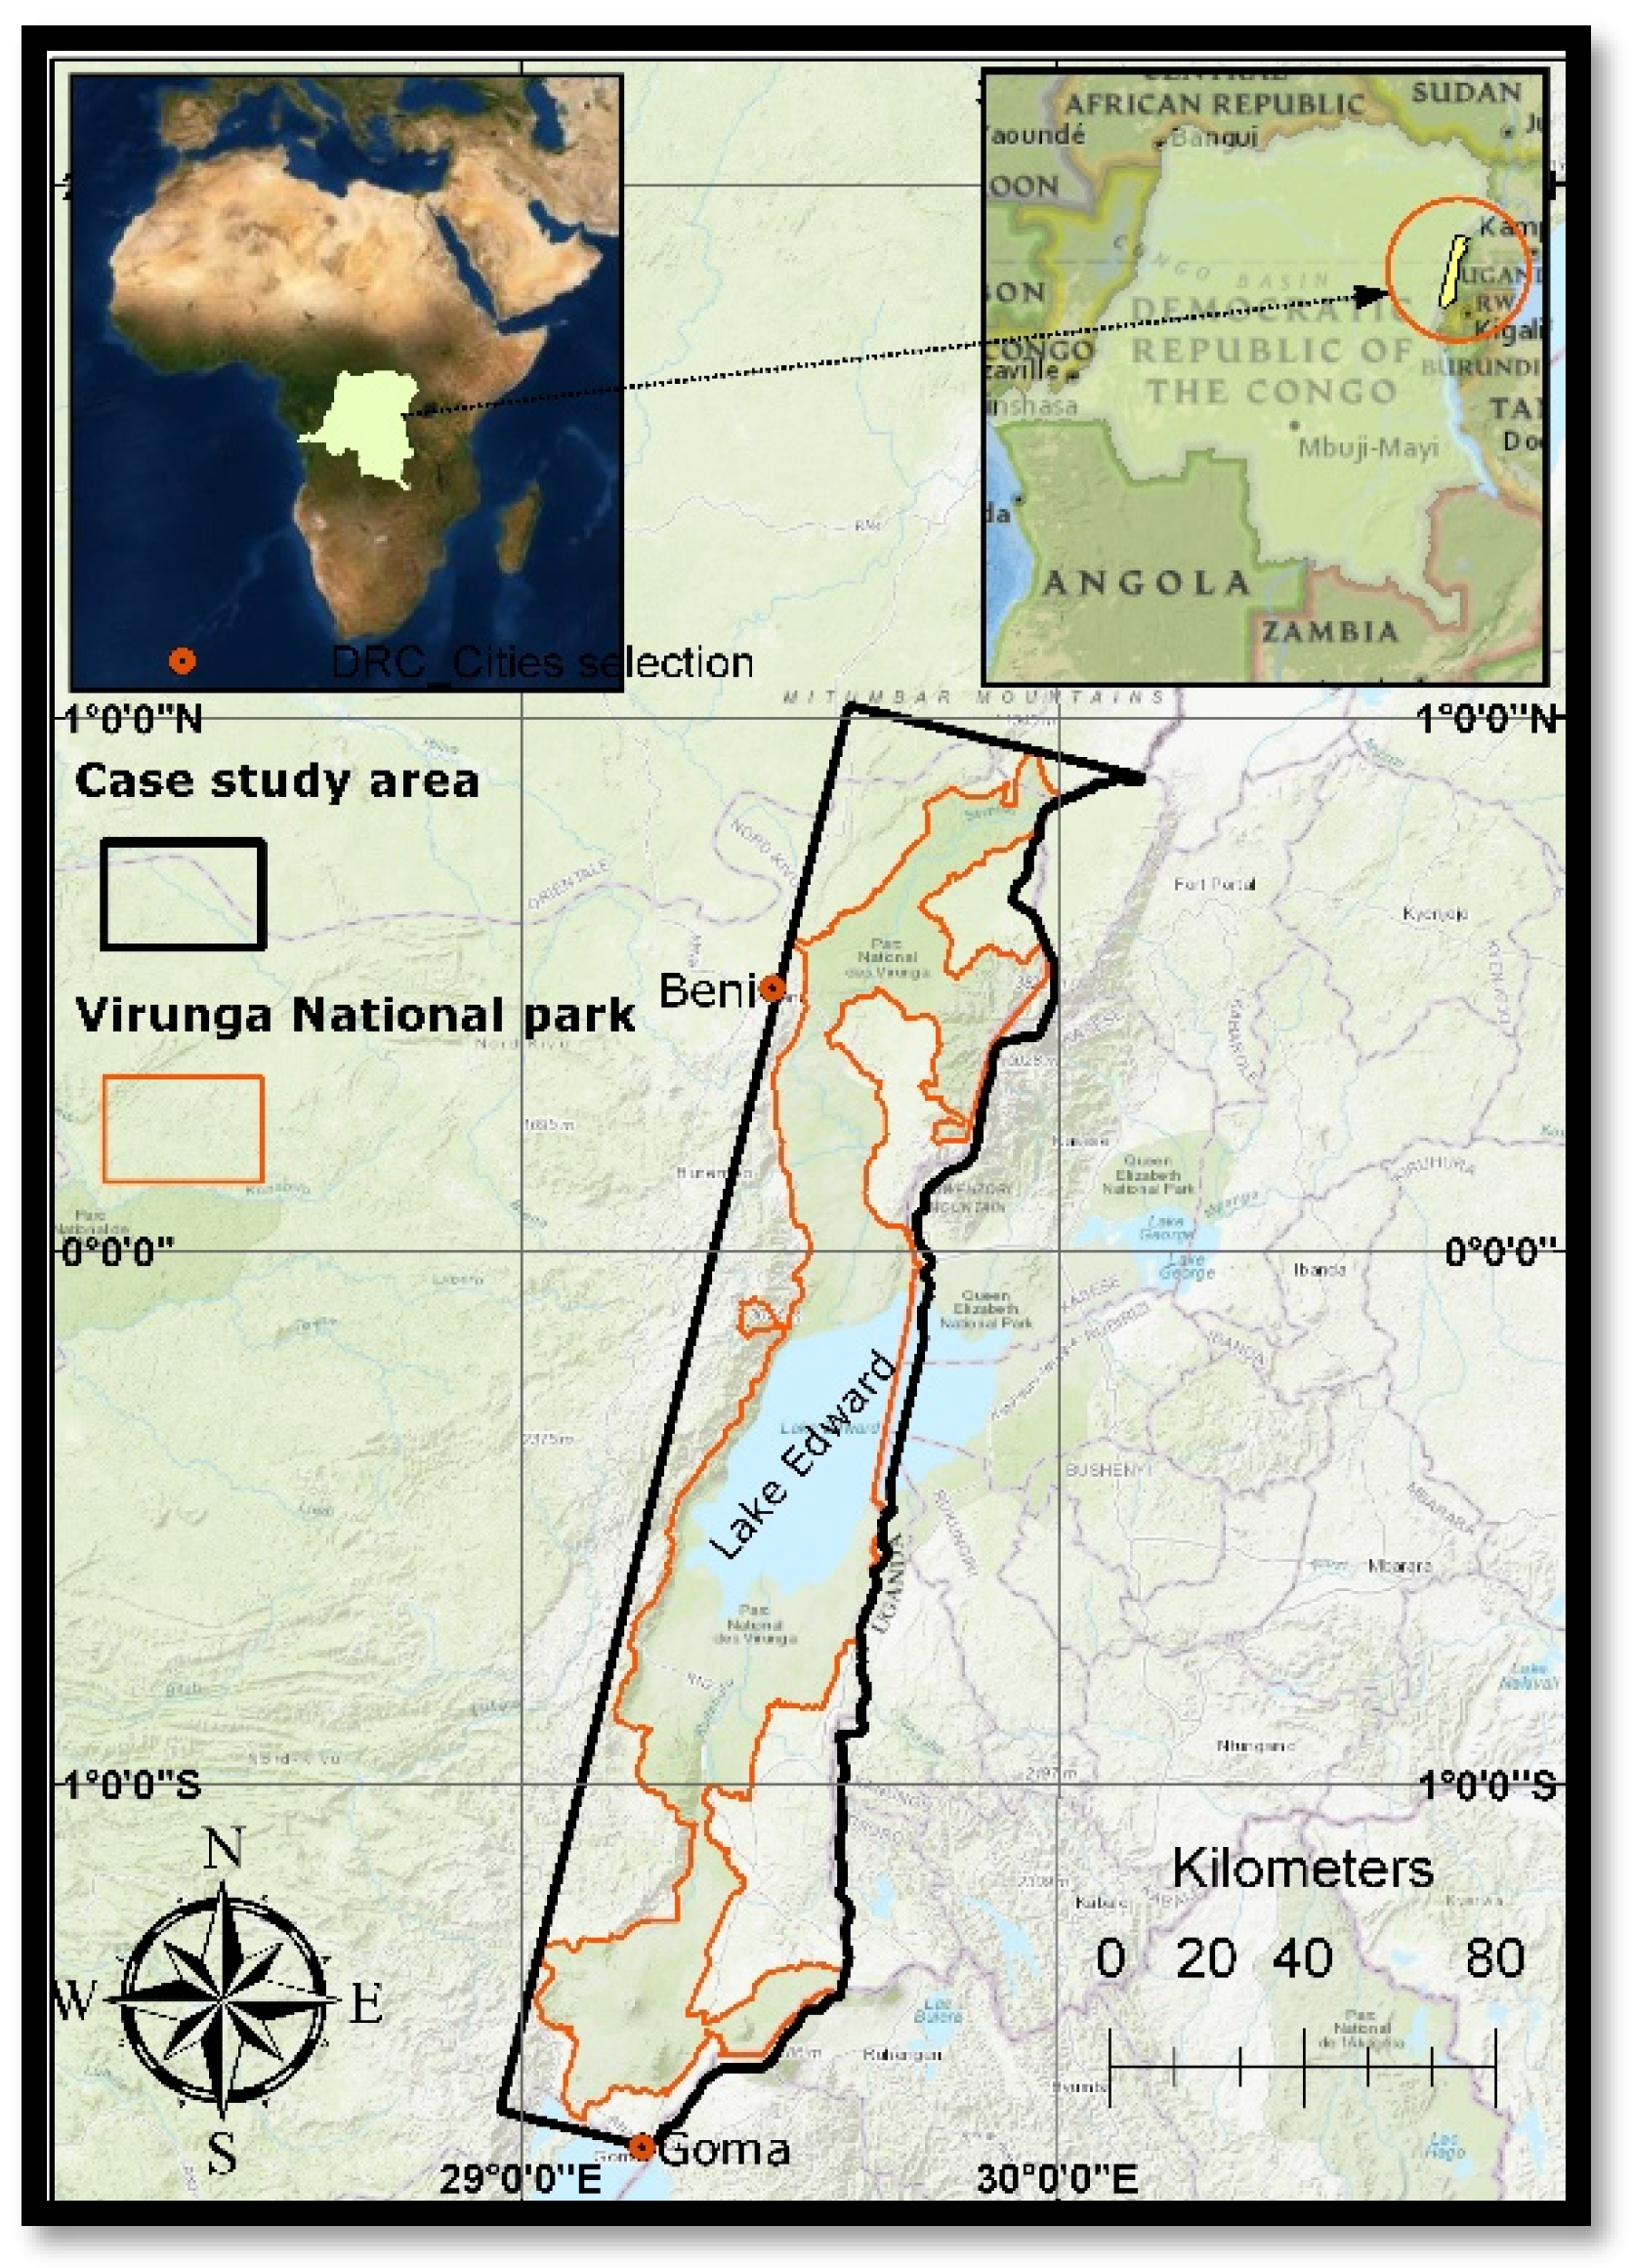
2. Study Area
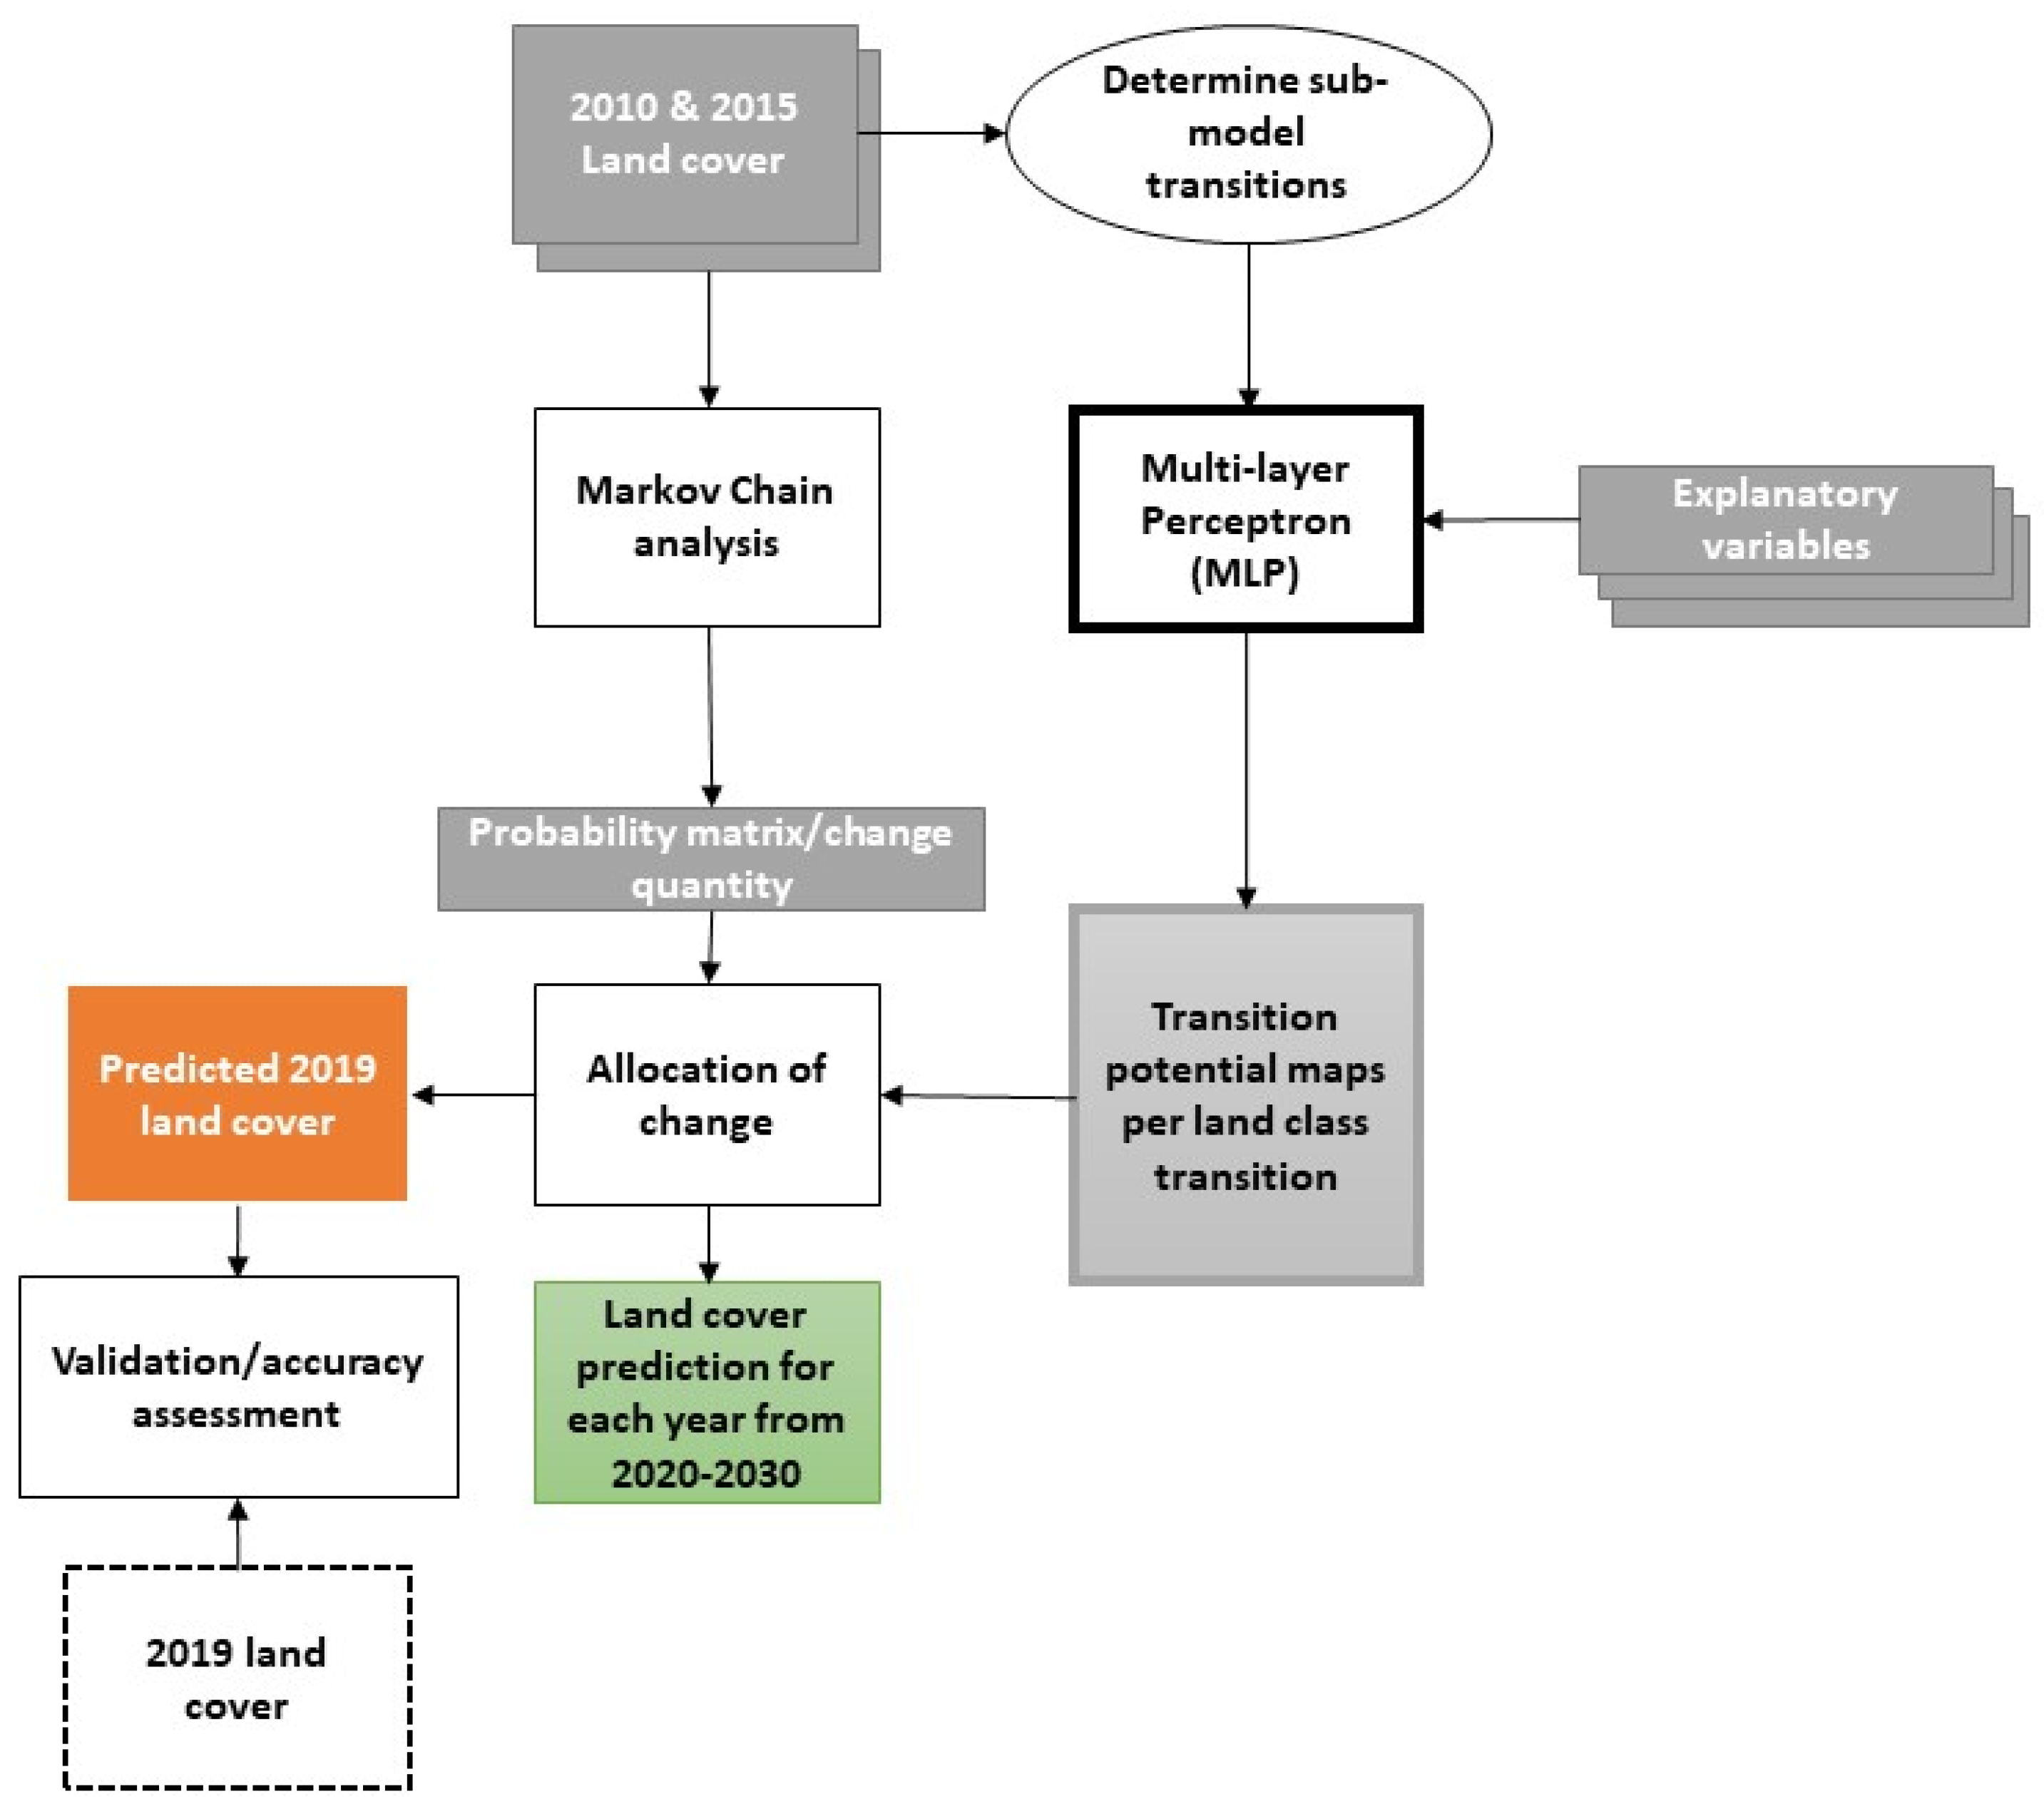
3. Methodology
3.1. Land Cover Classification
- Choosing an appropriate satellite imagery dataset, fitting the objective of the study,
- Define land cover classes and collect training data to train the supervised classification algorithm,
- Developing a JavaScript code to acquire, process and classify the satellite imagery based on the choice of classification algorithm.
3.1.1. Satellite Imagery
3.1.2. Collecting Training/Validation Data
- Forest: afforested and primary forest areas. (Note: While the authors acknowledge the significant difference between afforested areas and primary forest, further separation of the two classes would have caused significant classification errors, due to the spectral similarity of the two classes. Accordingly, the two classes were merged into a combined forest cover class to increase classification accuracy of forest cover.)
- Water: lakes and rivers.
- Urban areas: developed residential or industrial areas, roads and urban fringes.
- Cropland: planted or bare crop fields.
- Open land/grassland: areas with sparse vegetation, characterized by open grasslands, bare soil or volcanic ash.
3.1.3. Land Cover Classification within the Google Earth Engine IDE
3.2. LULC Modelling and Prediction
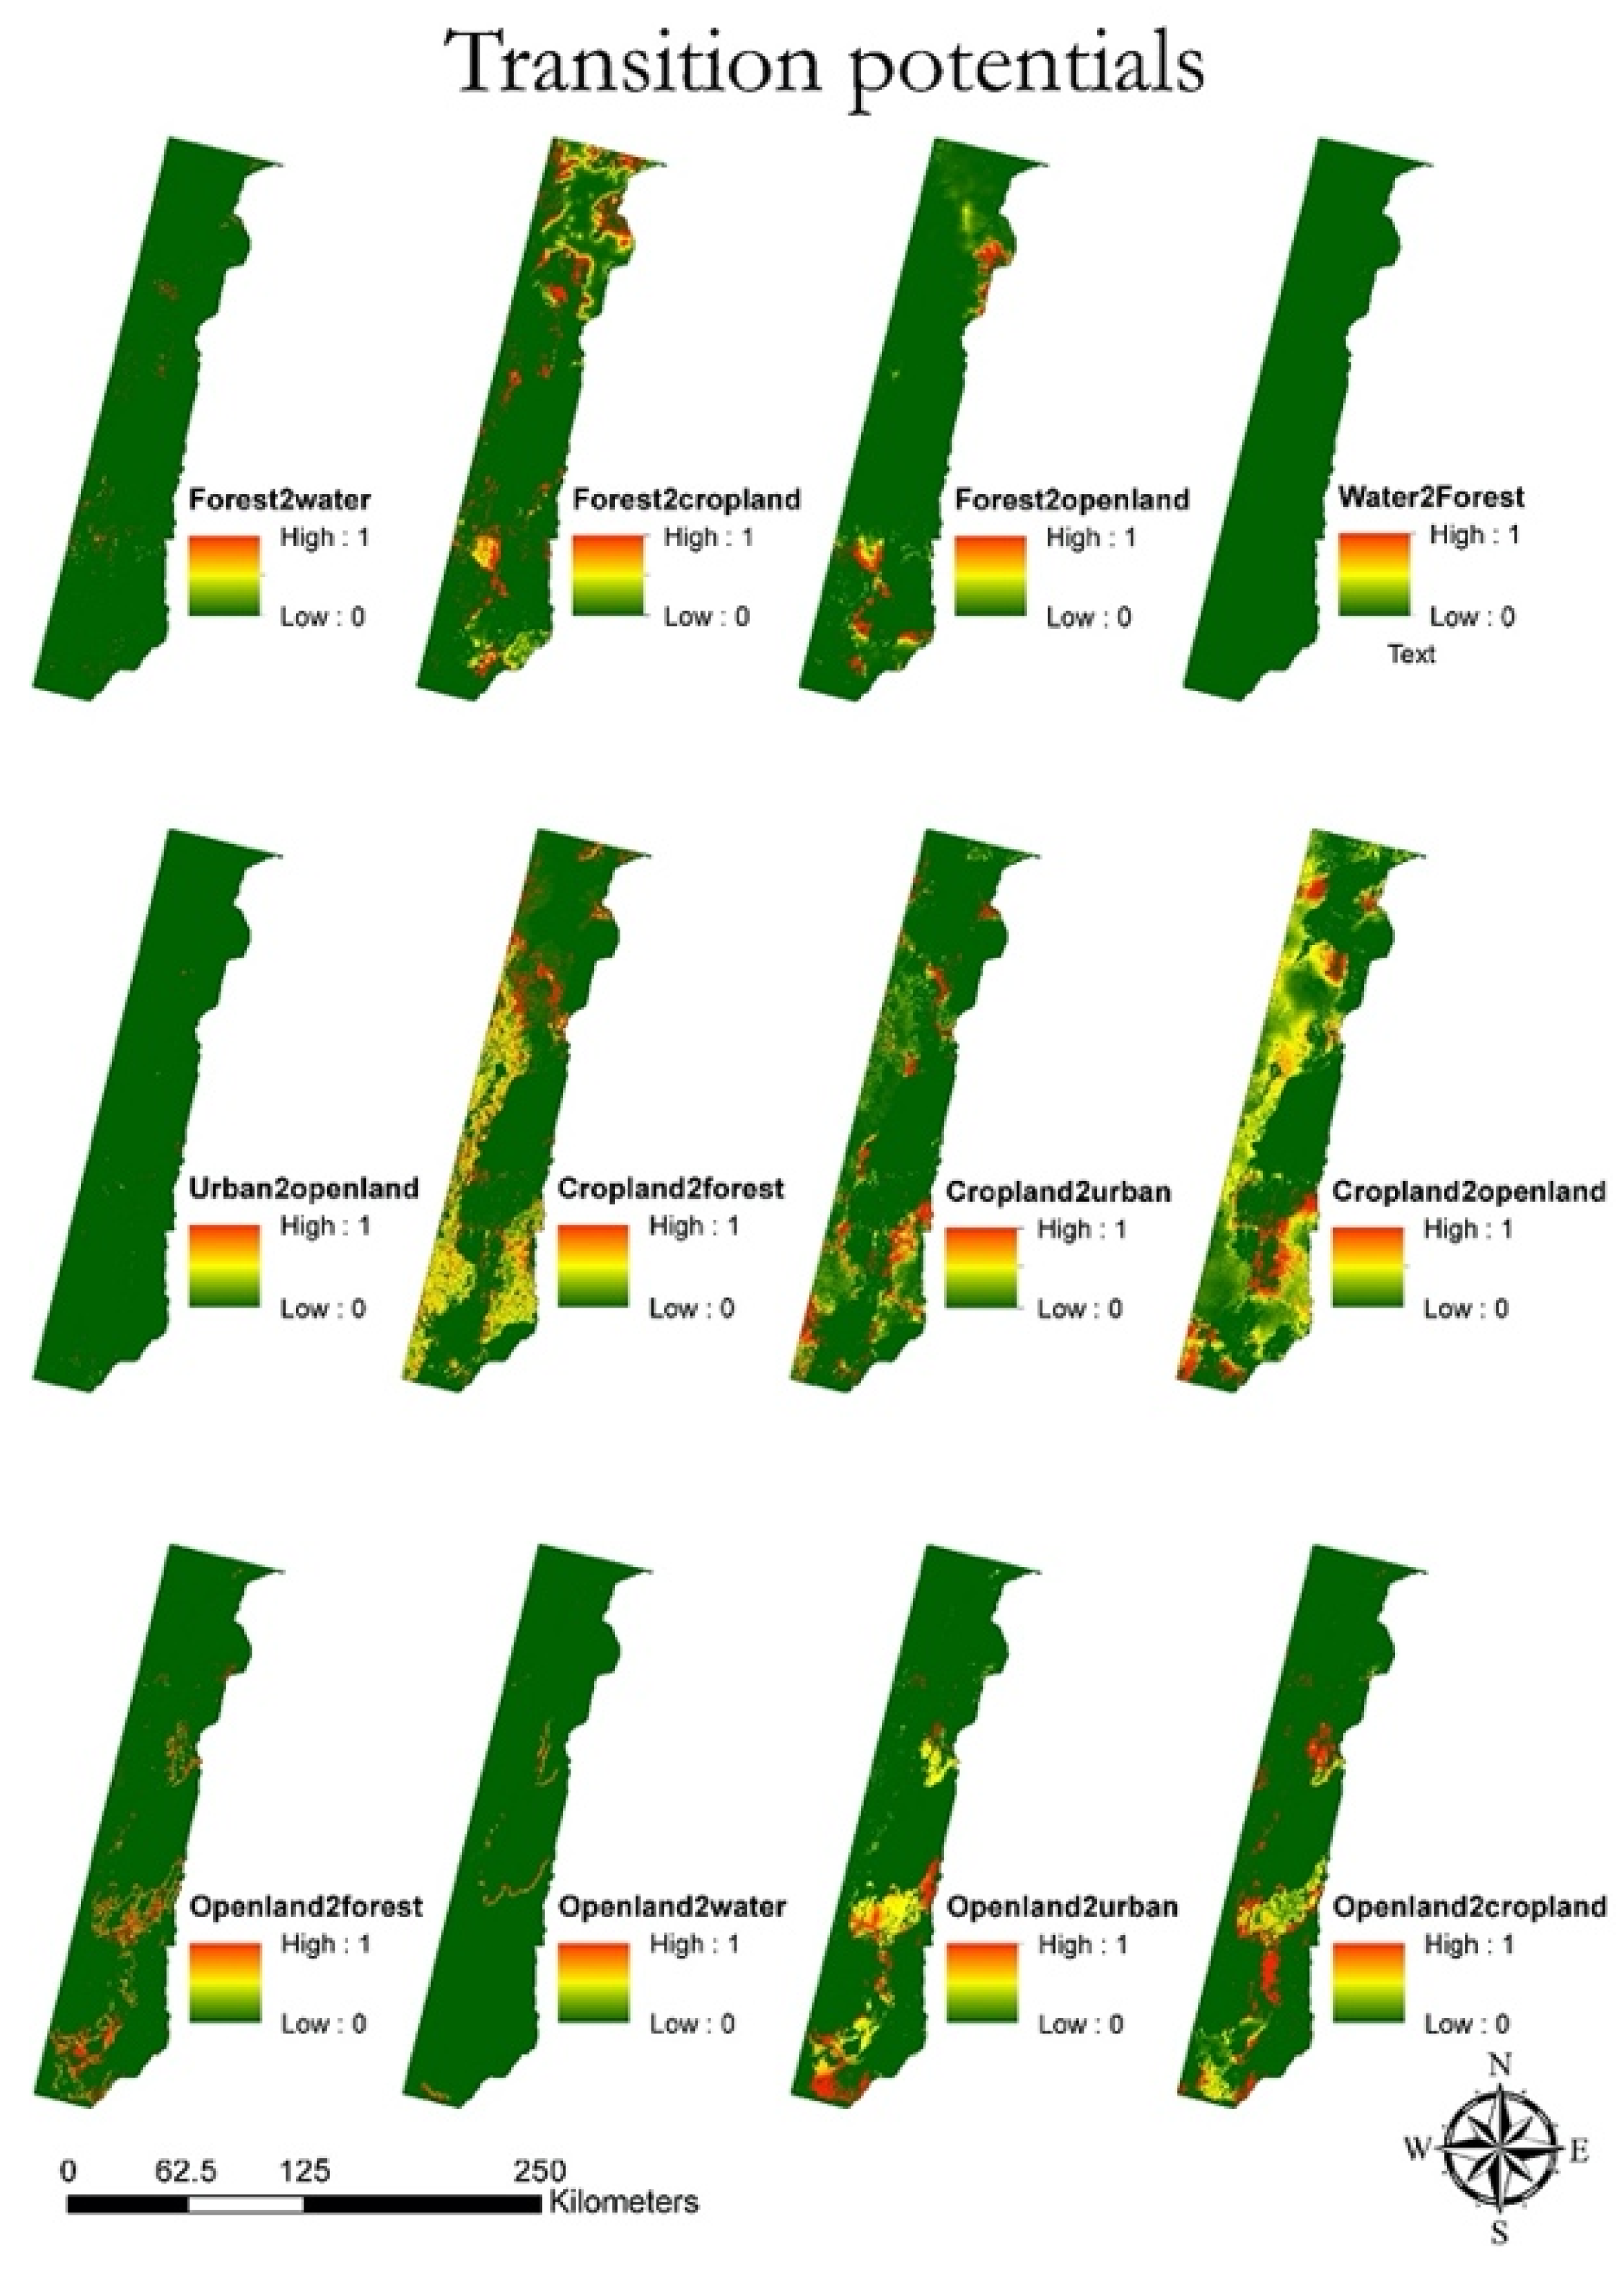
3.2.1. Modelling Transition Potentials: Submodels
3.2.2. Explanatory Variables
3.2.3. Modelling Transition Potential—MLP Calibration
3.2.4. Change Prediction and Model Validation
4. Results
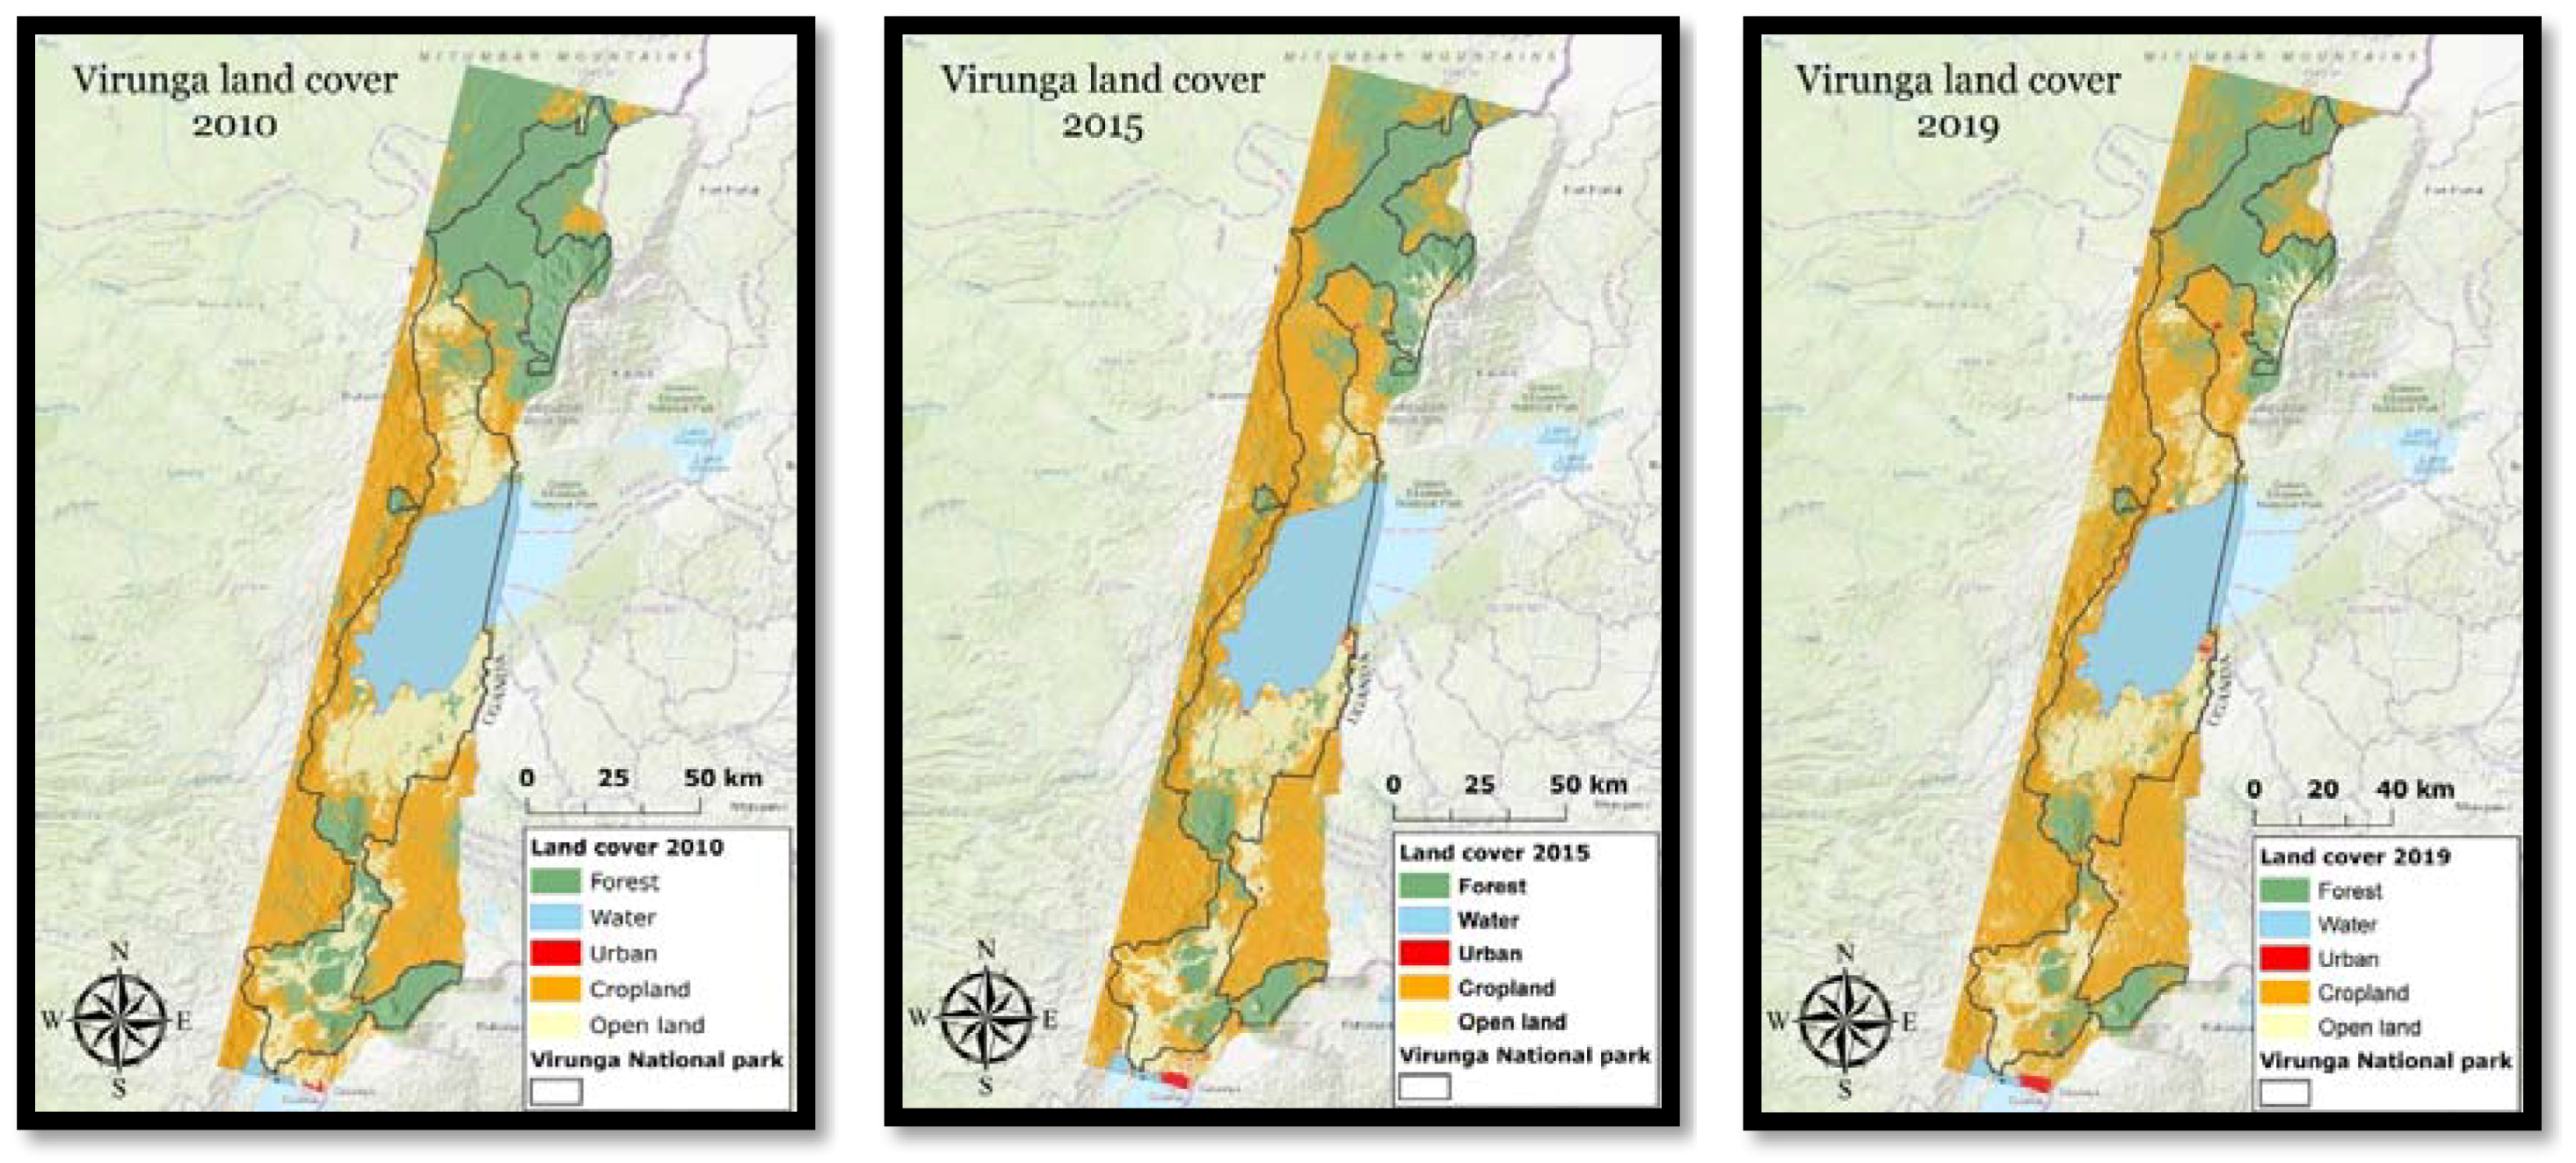
4.1. Land Cover Classification
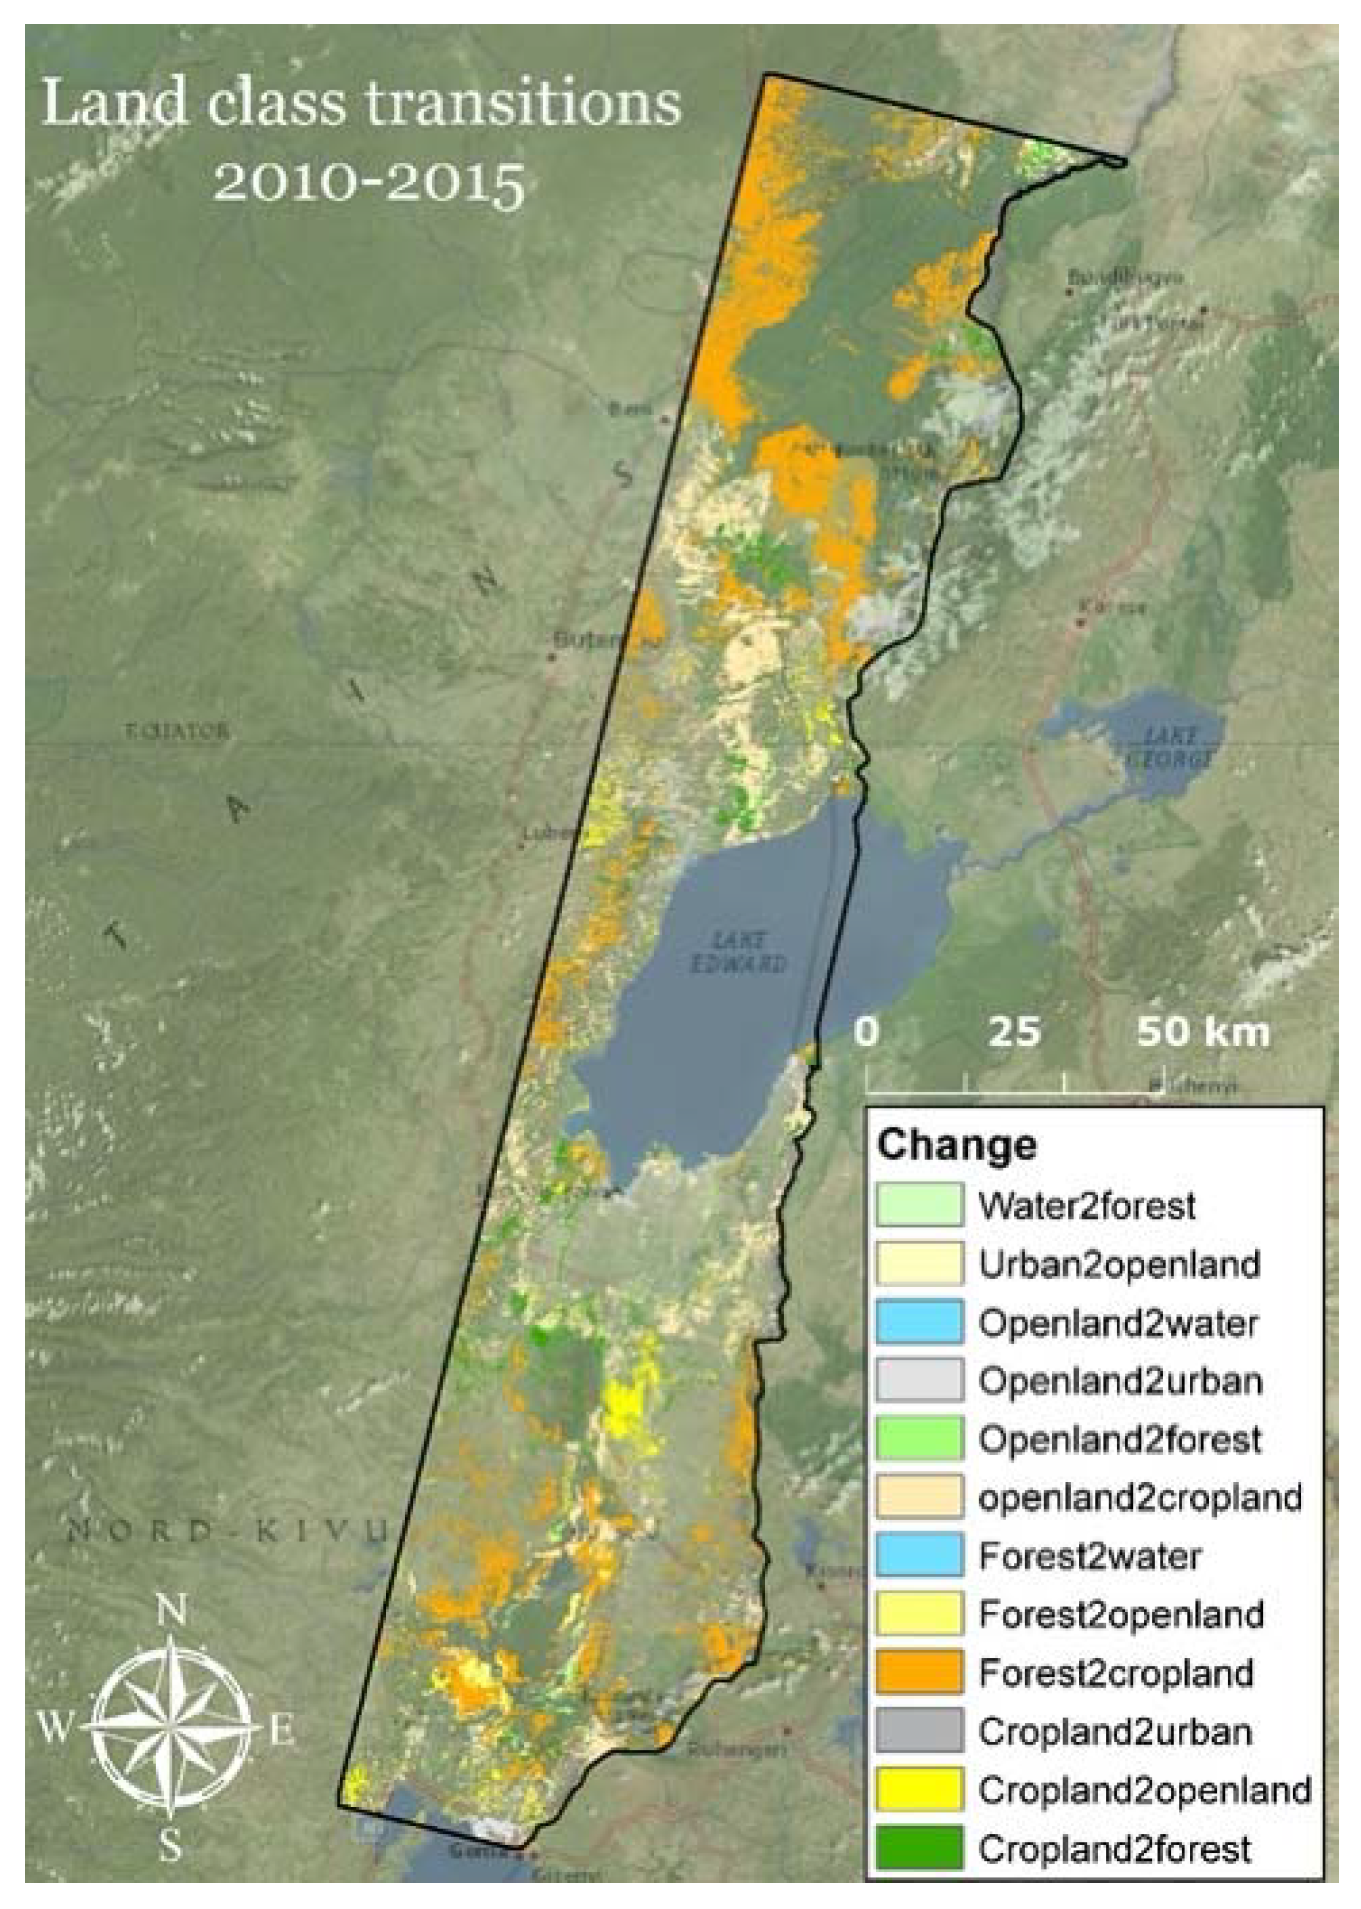
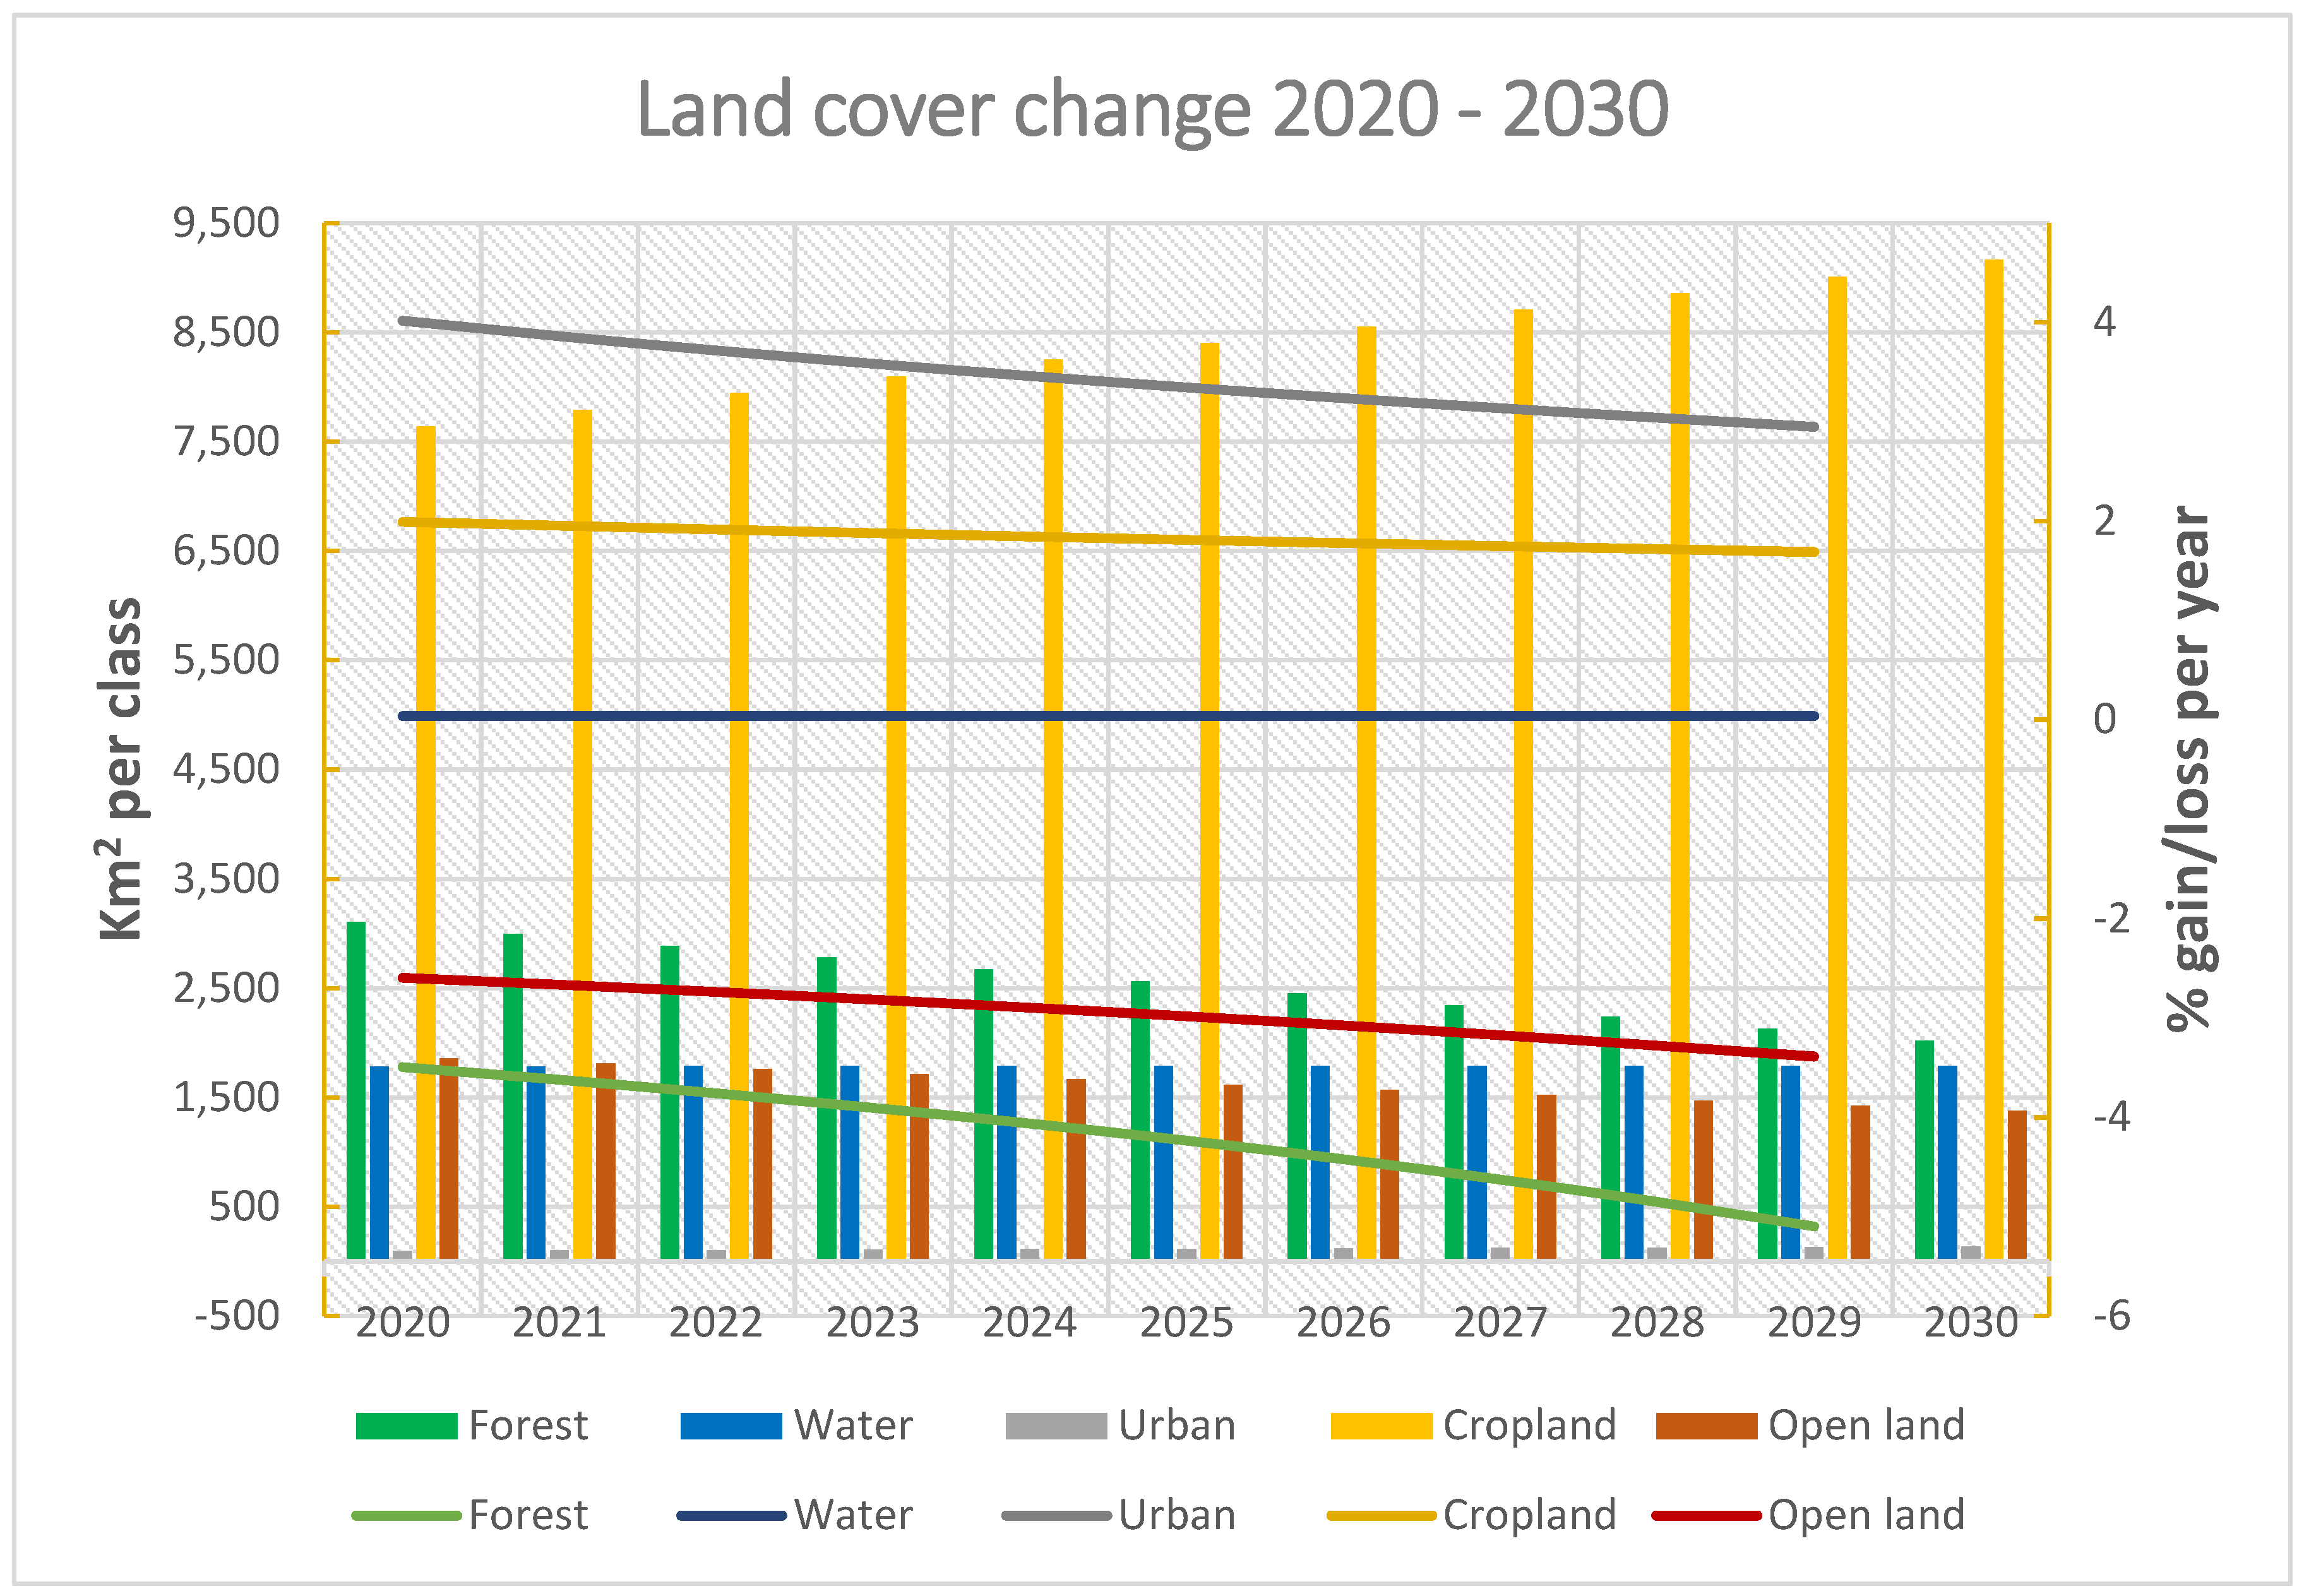
Land Changes
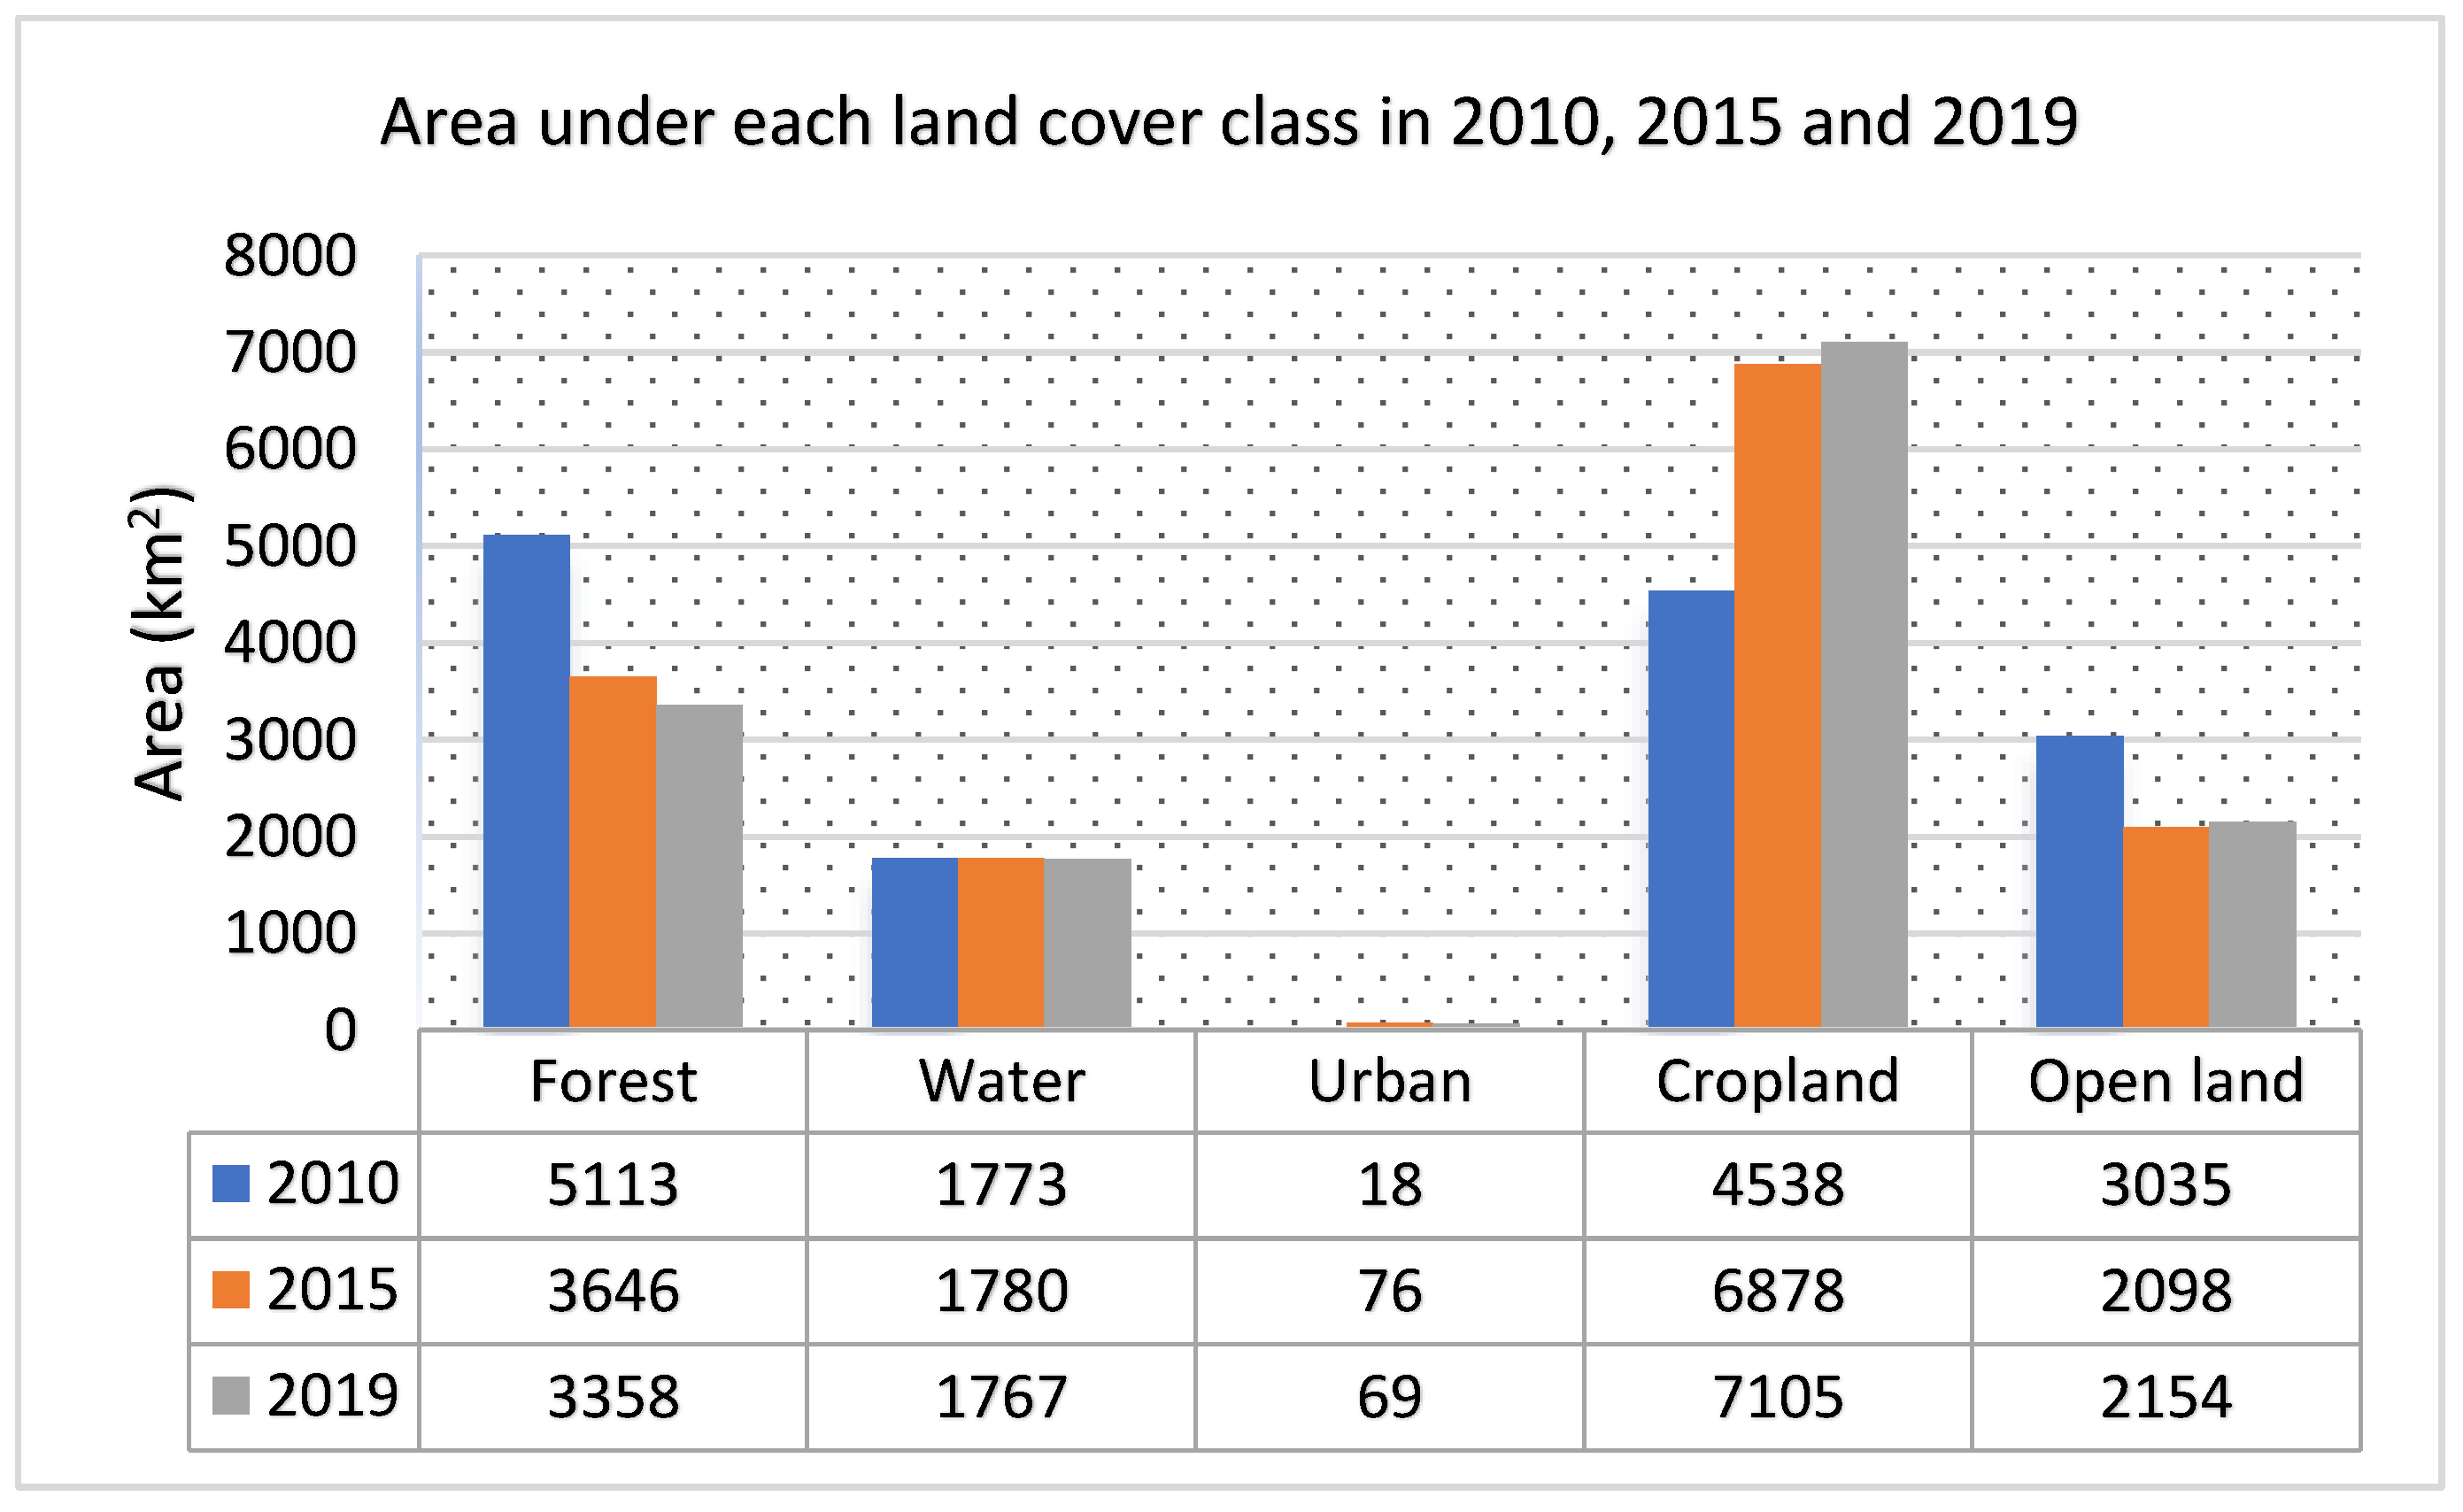
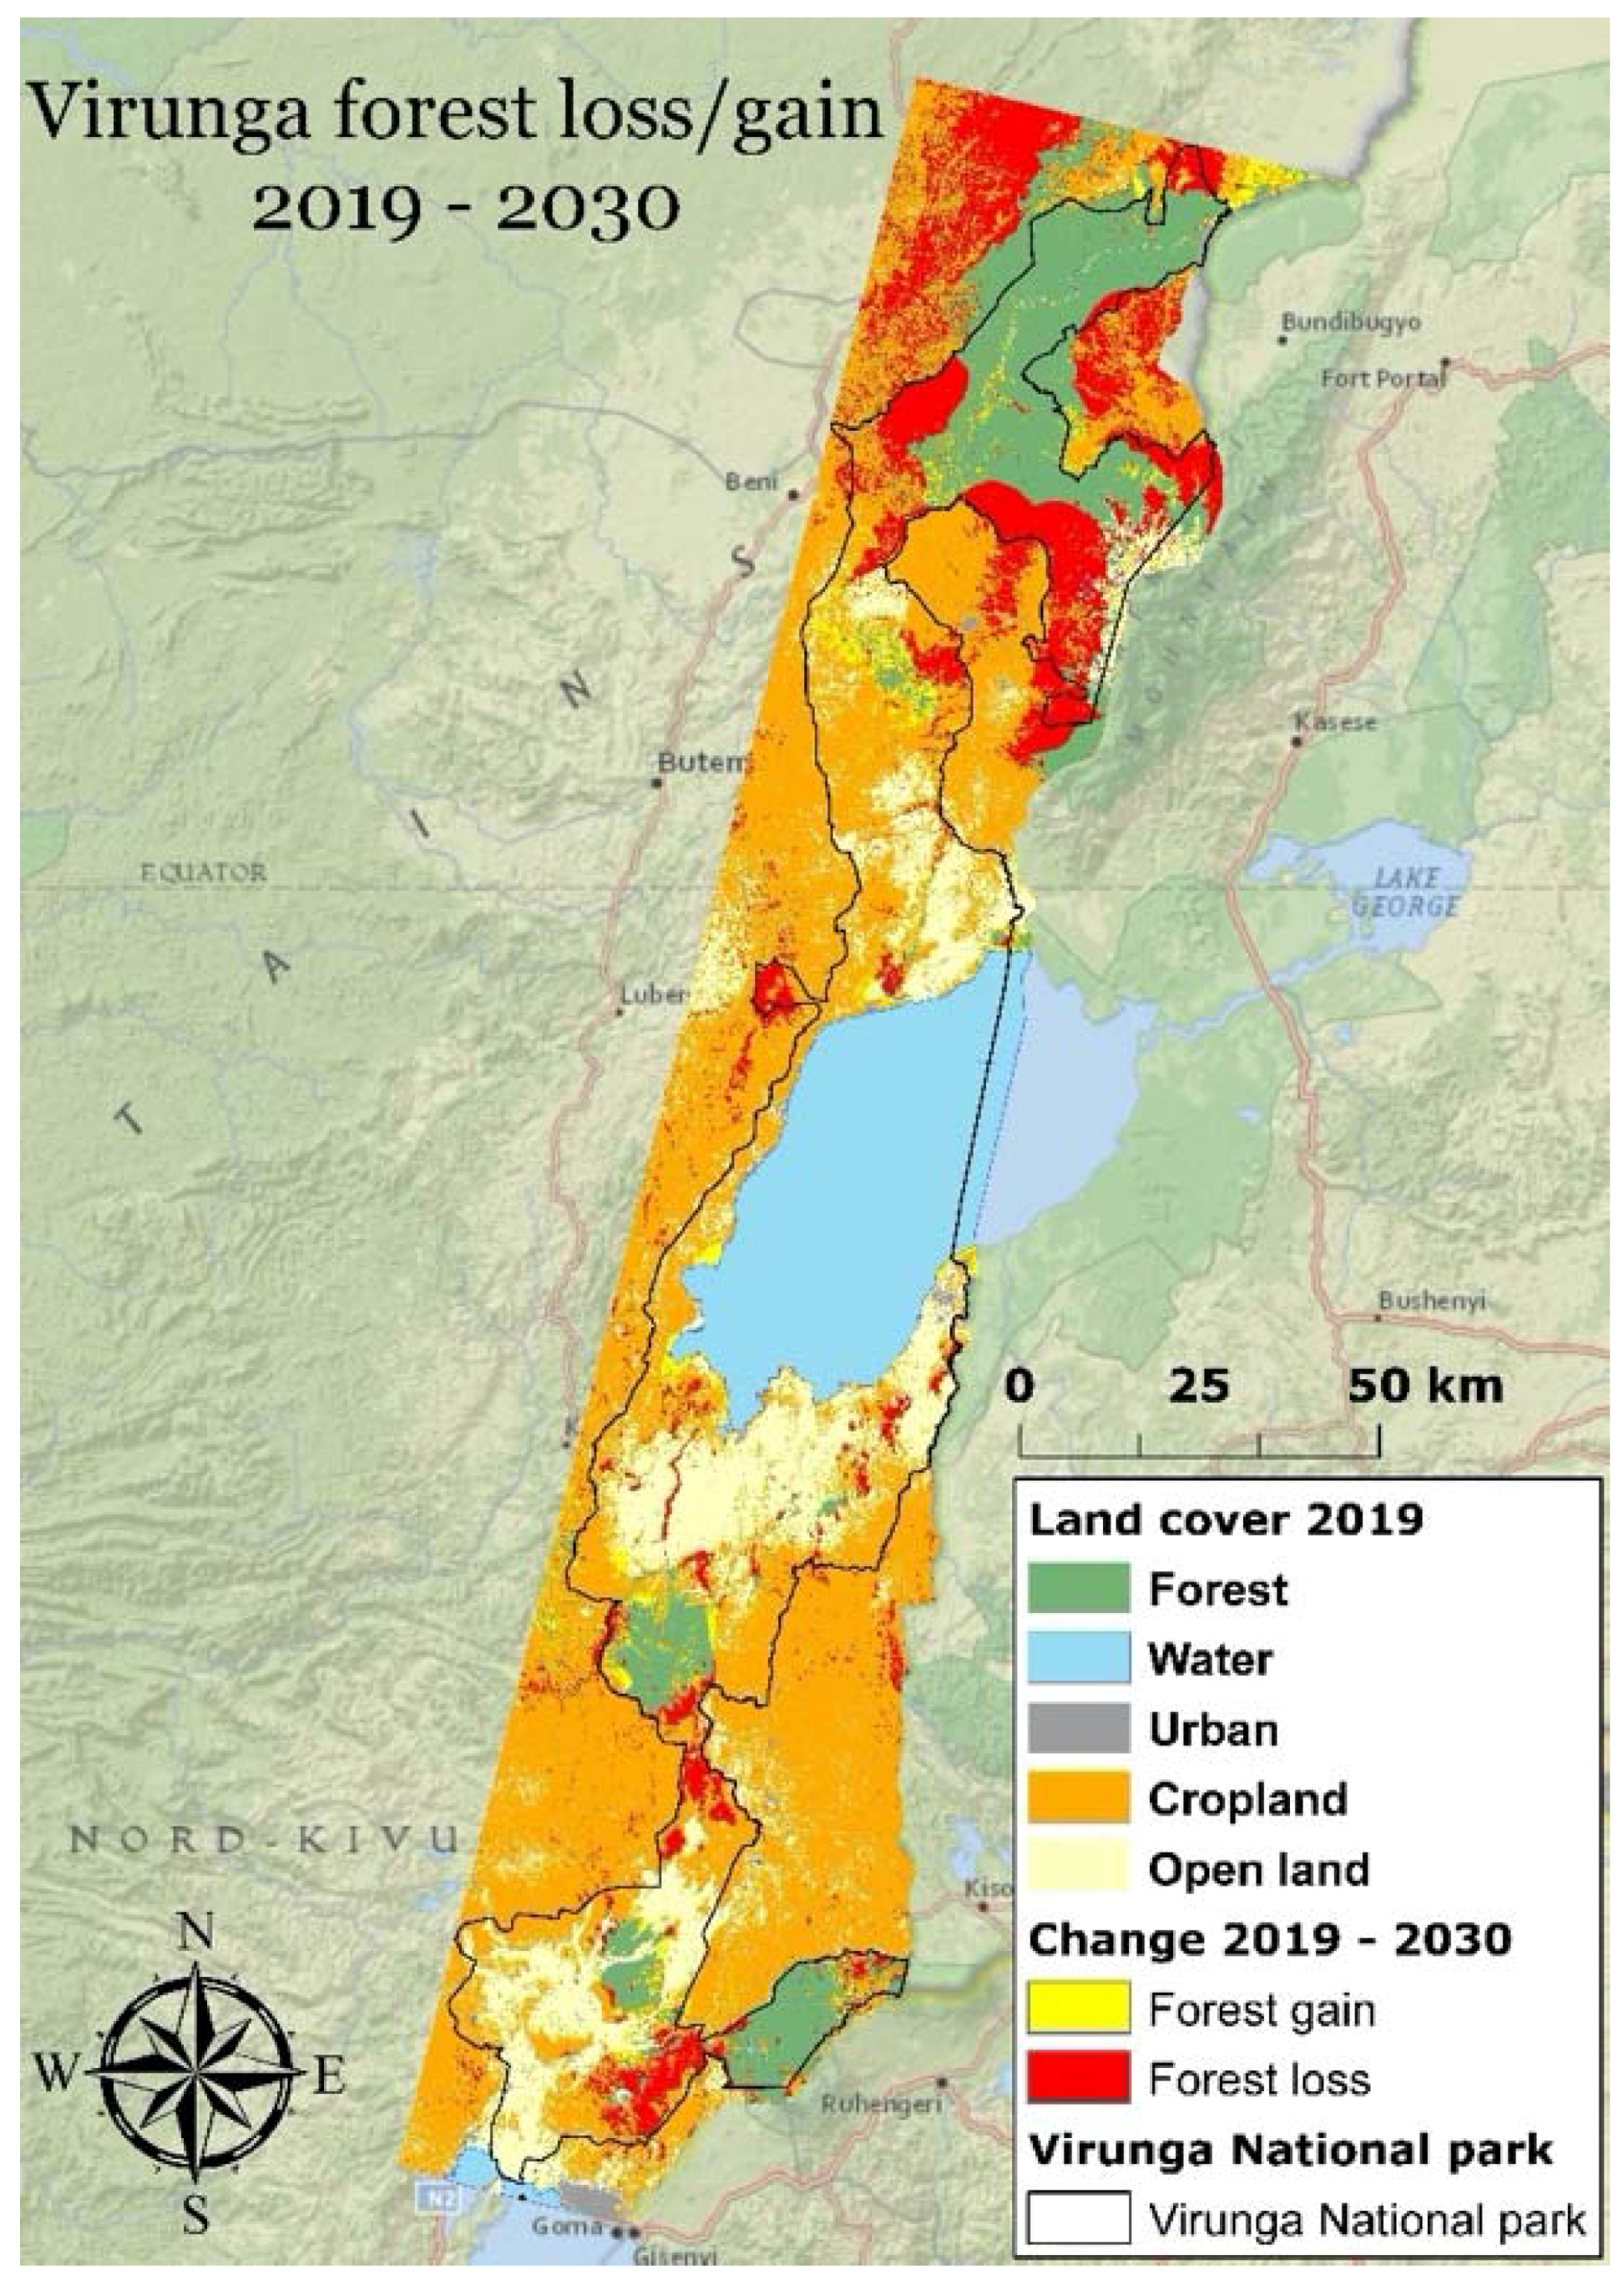
- Between 2010 and 2015 the forest cover was reduced by 28.7% from 5113.4 km2 in 2010 to 3646.4 km2 in 2015. Even though there was a forest gain of 318.9 km2 largely caused by afforestation from cropland and open land, the net loss of 1467 km2 is almost exclusively attributed to forest conversion into cropland.
- Accounting for the least prevalent land class in the case study area, urban areas have experienced a large increase between 2010 and 2015, from 17.8 km2 to 75.6 km2, resulting in a 57.9 km2 net gain. This is largely attributed with rapid urbanisation processes in the Democratic Republic of Congo in general, which has an estimated average annual urban population growth rate of 4.3% [20]. The population of the capital city in the North Kivu province, Goma, located in the south-eastern corner of the case study area, increased from 150,000 people in 1990 to more than one million in 2017 [6]. Thus, the majority of the urban class increase is caused by the expansion of Goma.
- Cropland is the most dynamic land class in the case study area and represents the most dominant land cover type. The total area under cultivation increased by 51.5%, from 4538.4 km2 in 2010 to 6877.6 km2 in 2015. As mentioned previously, cropland is the main driver of deforestation and thus the majority of the agricultural expansion is caused by forest conversion. However, another 47% of cropland expansion is attributed with the cultivation of previously open land/grassland areas.
- The open land cover class was reduced by 30.8%, from 3035.0 km2 in 2010 to 2098.3 km2 in 2015. Even though the open land class received a total net loss, 236.2 km2 was gained, caused by agricultural abandonment. Another 66 km2 gain of open land is attributed to deforestation. The majority of the net loss of the open land class (1109.2 km2) is associated with agricultural expansion, while another 59,5 km2 is attributed to urbanisation processes. A net loss of 69.8 km2 is associated with afforestation processes.
- The water bodies remained largely unchanged, which is to be expected as there has been no waterworks (e.g., dam construction) in the study period. Thus, the water bodies, largely consisting from the two major lakes in the study area, Lake Édouard and Lake Kivu, have remained relatively consistent.
4.2. LULC Model
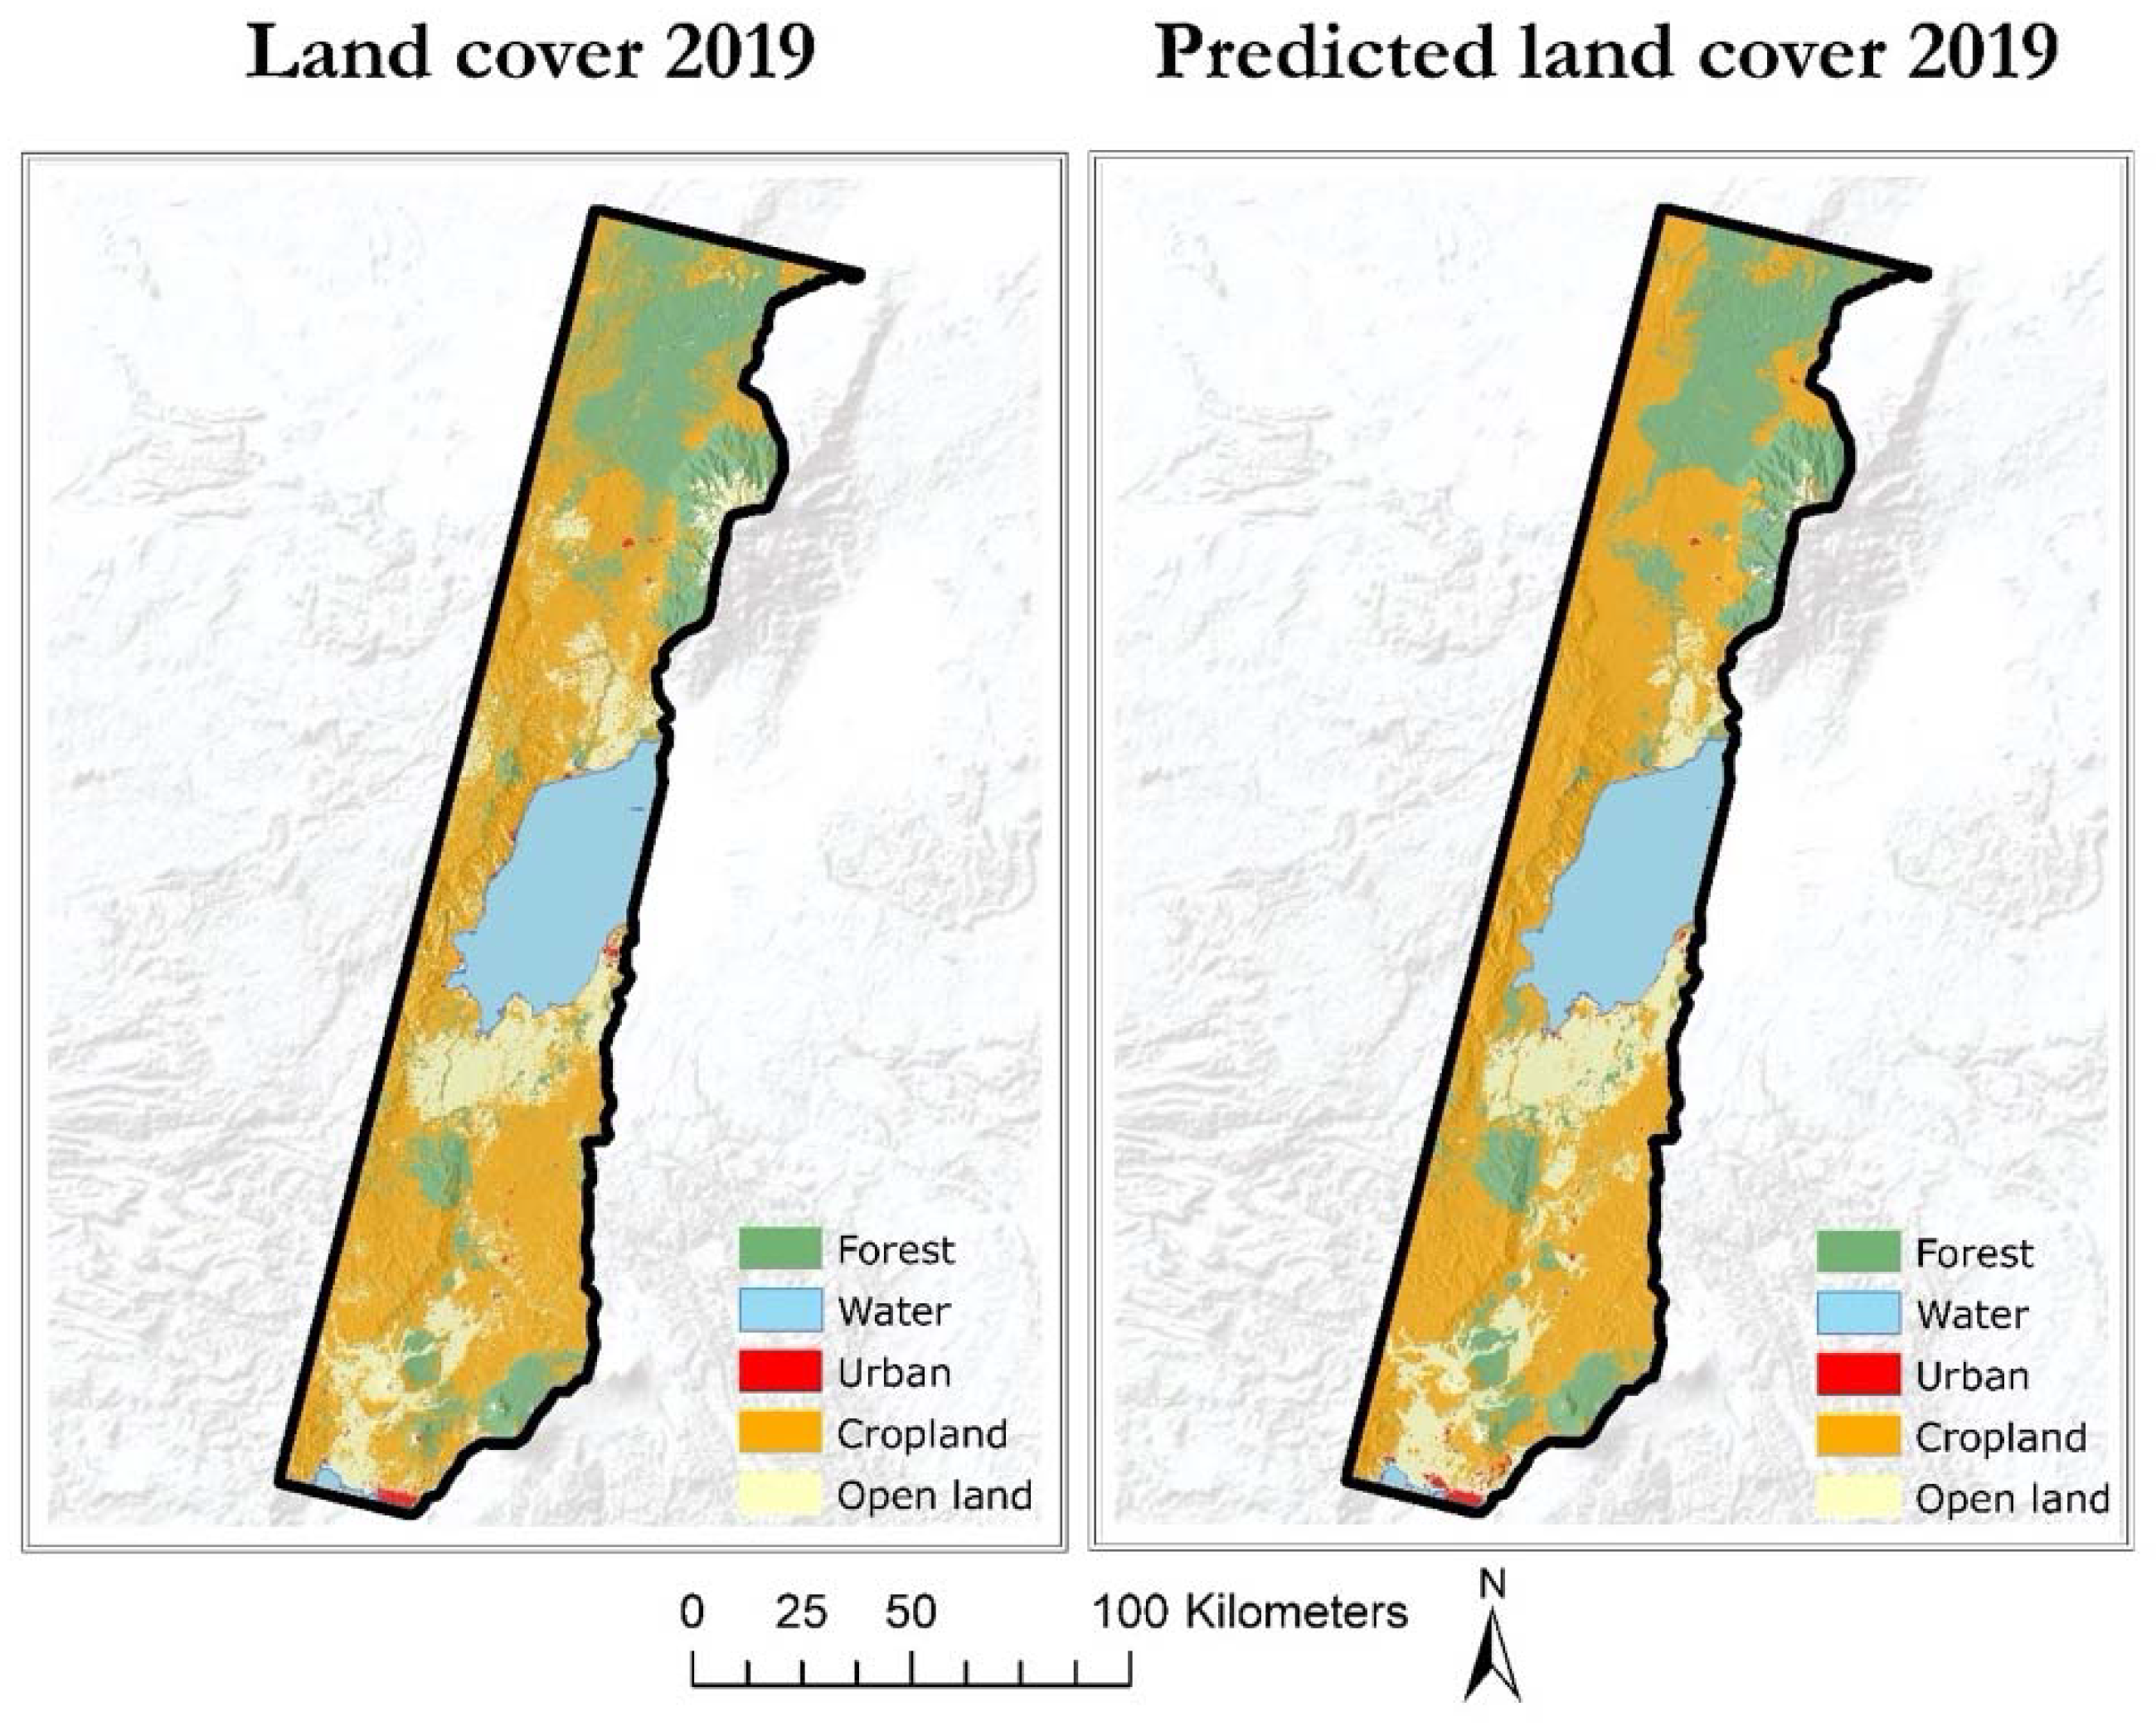
4.2.1. Validating Results
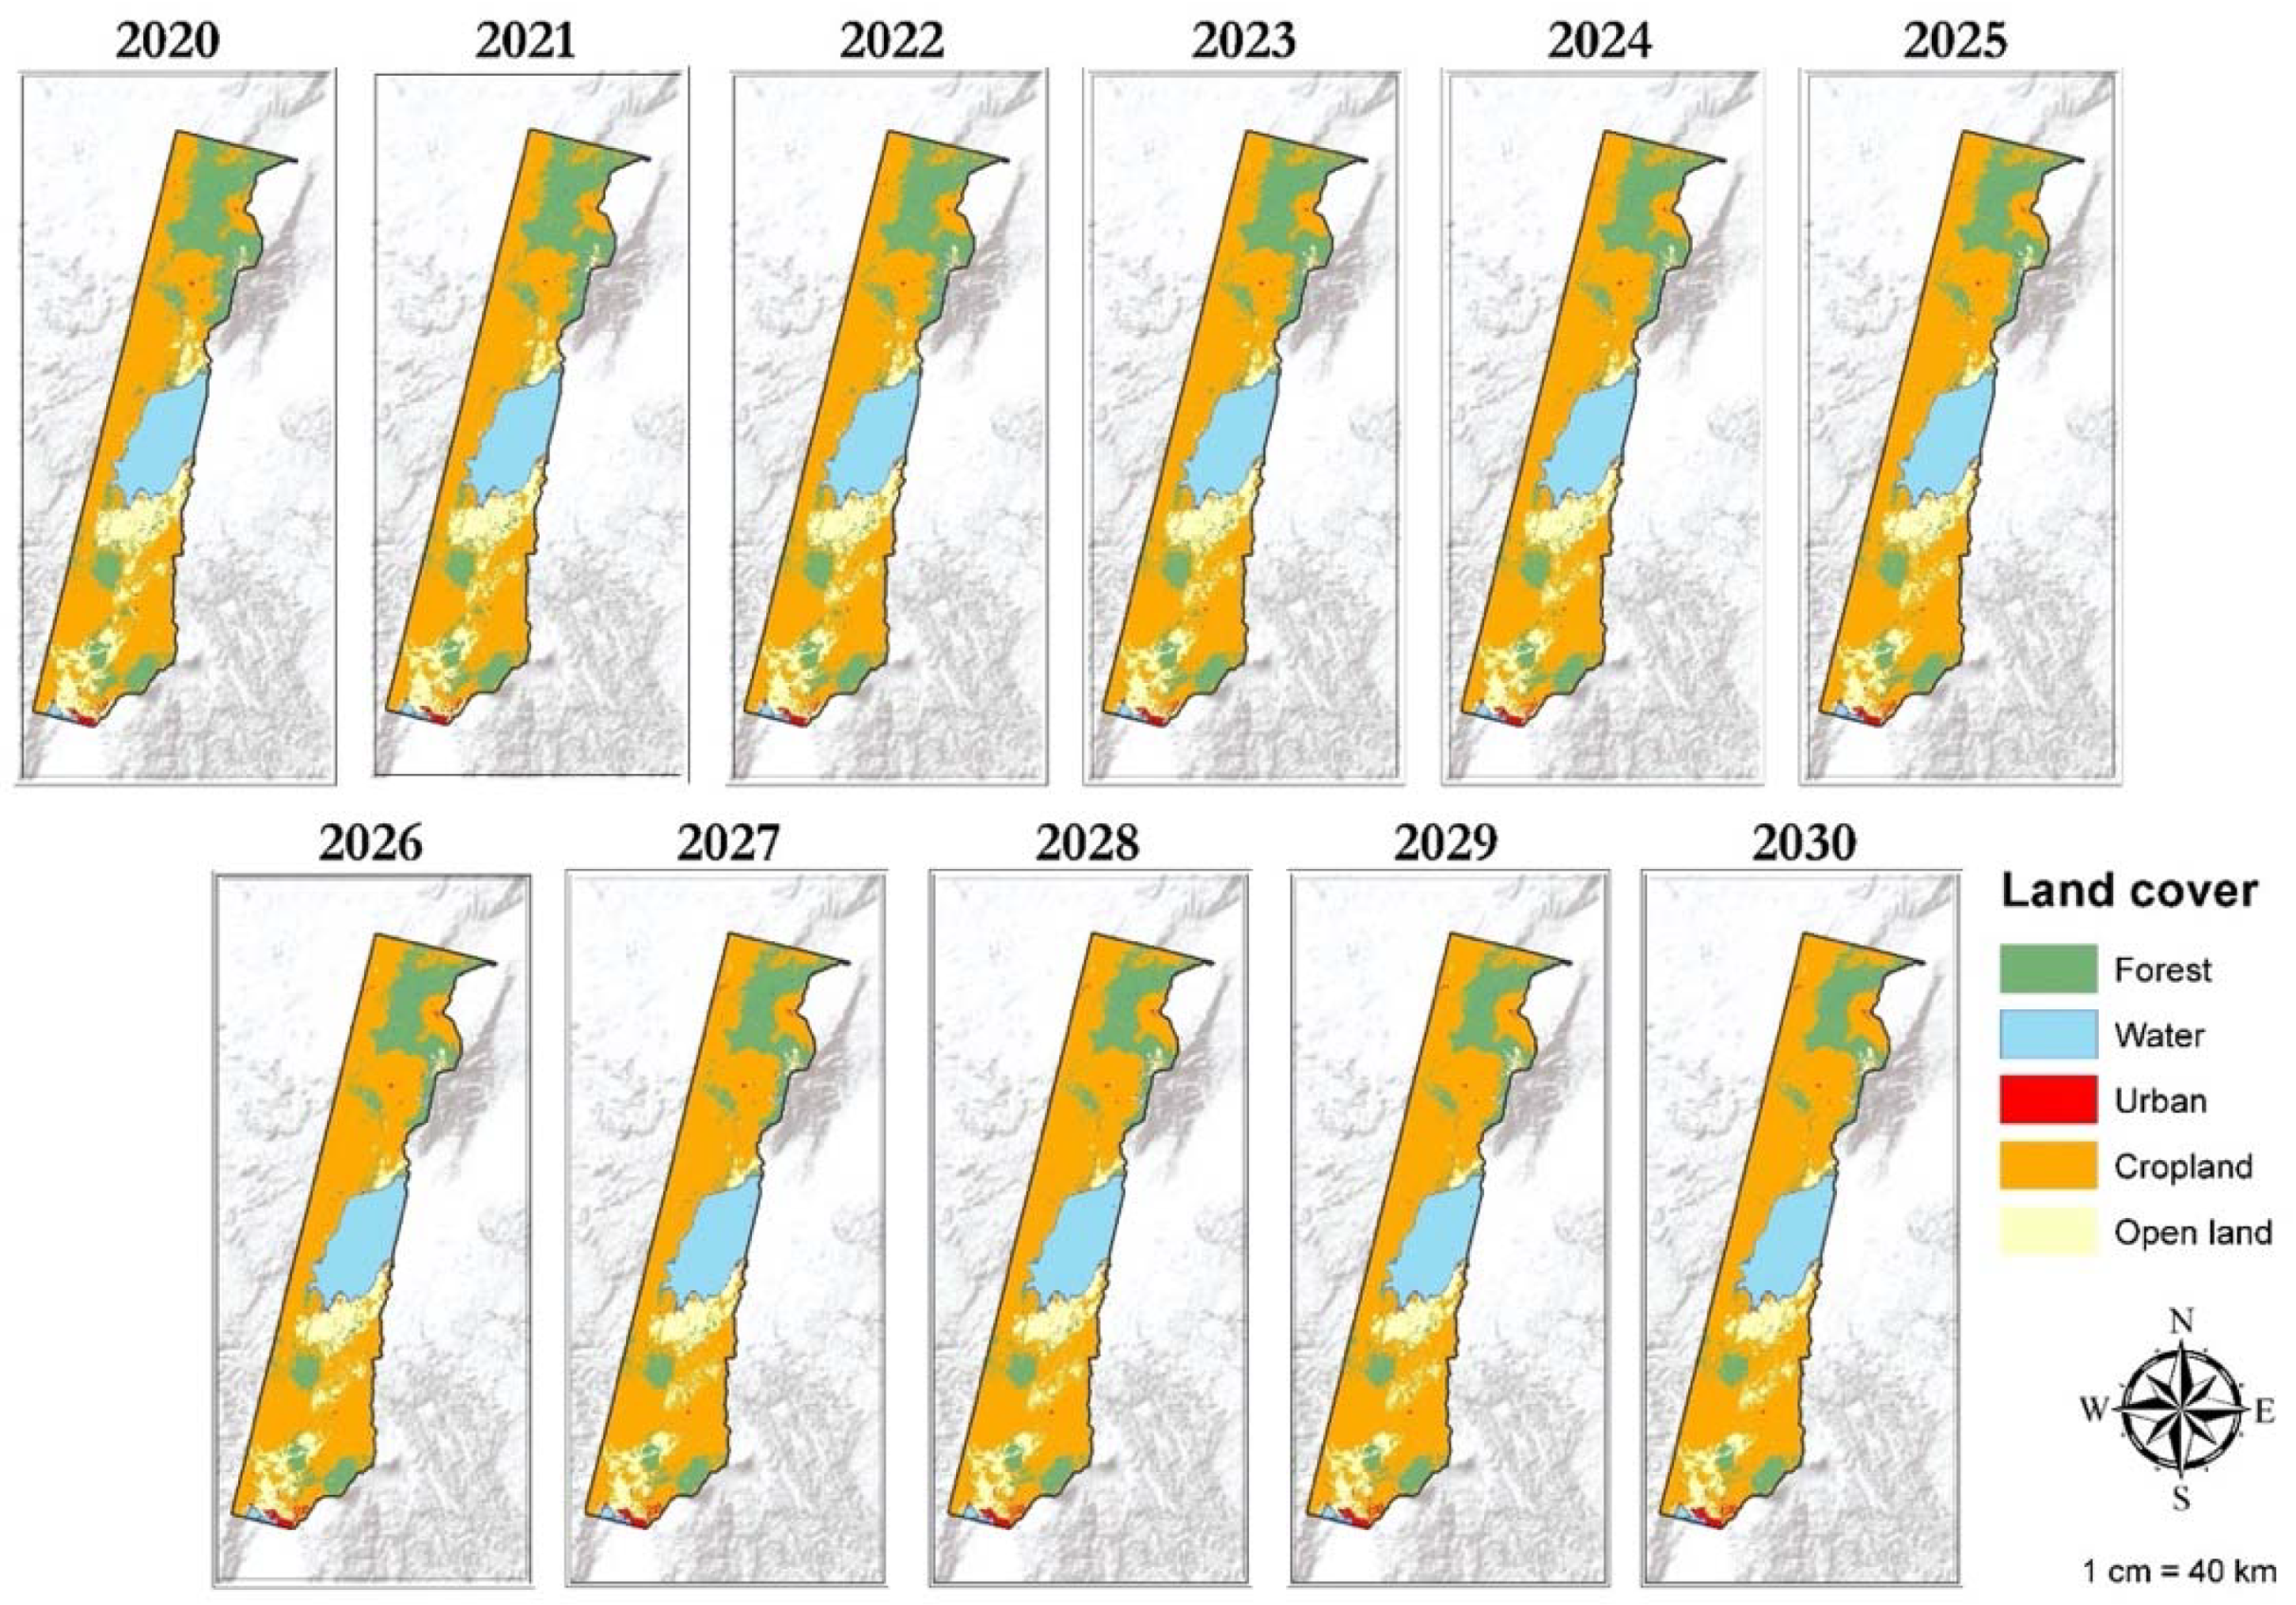
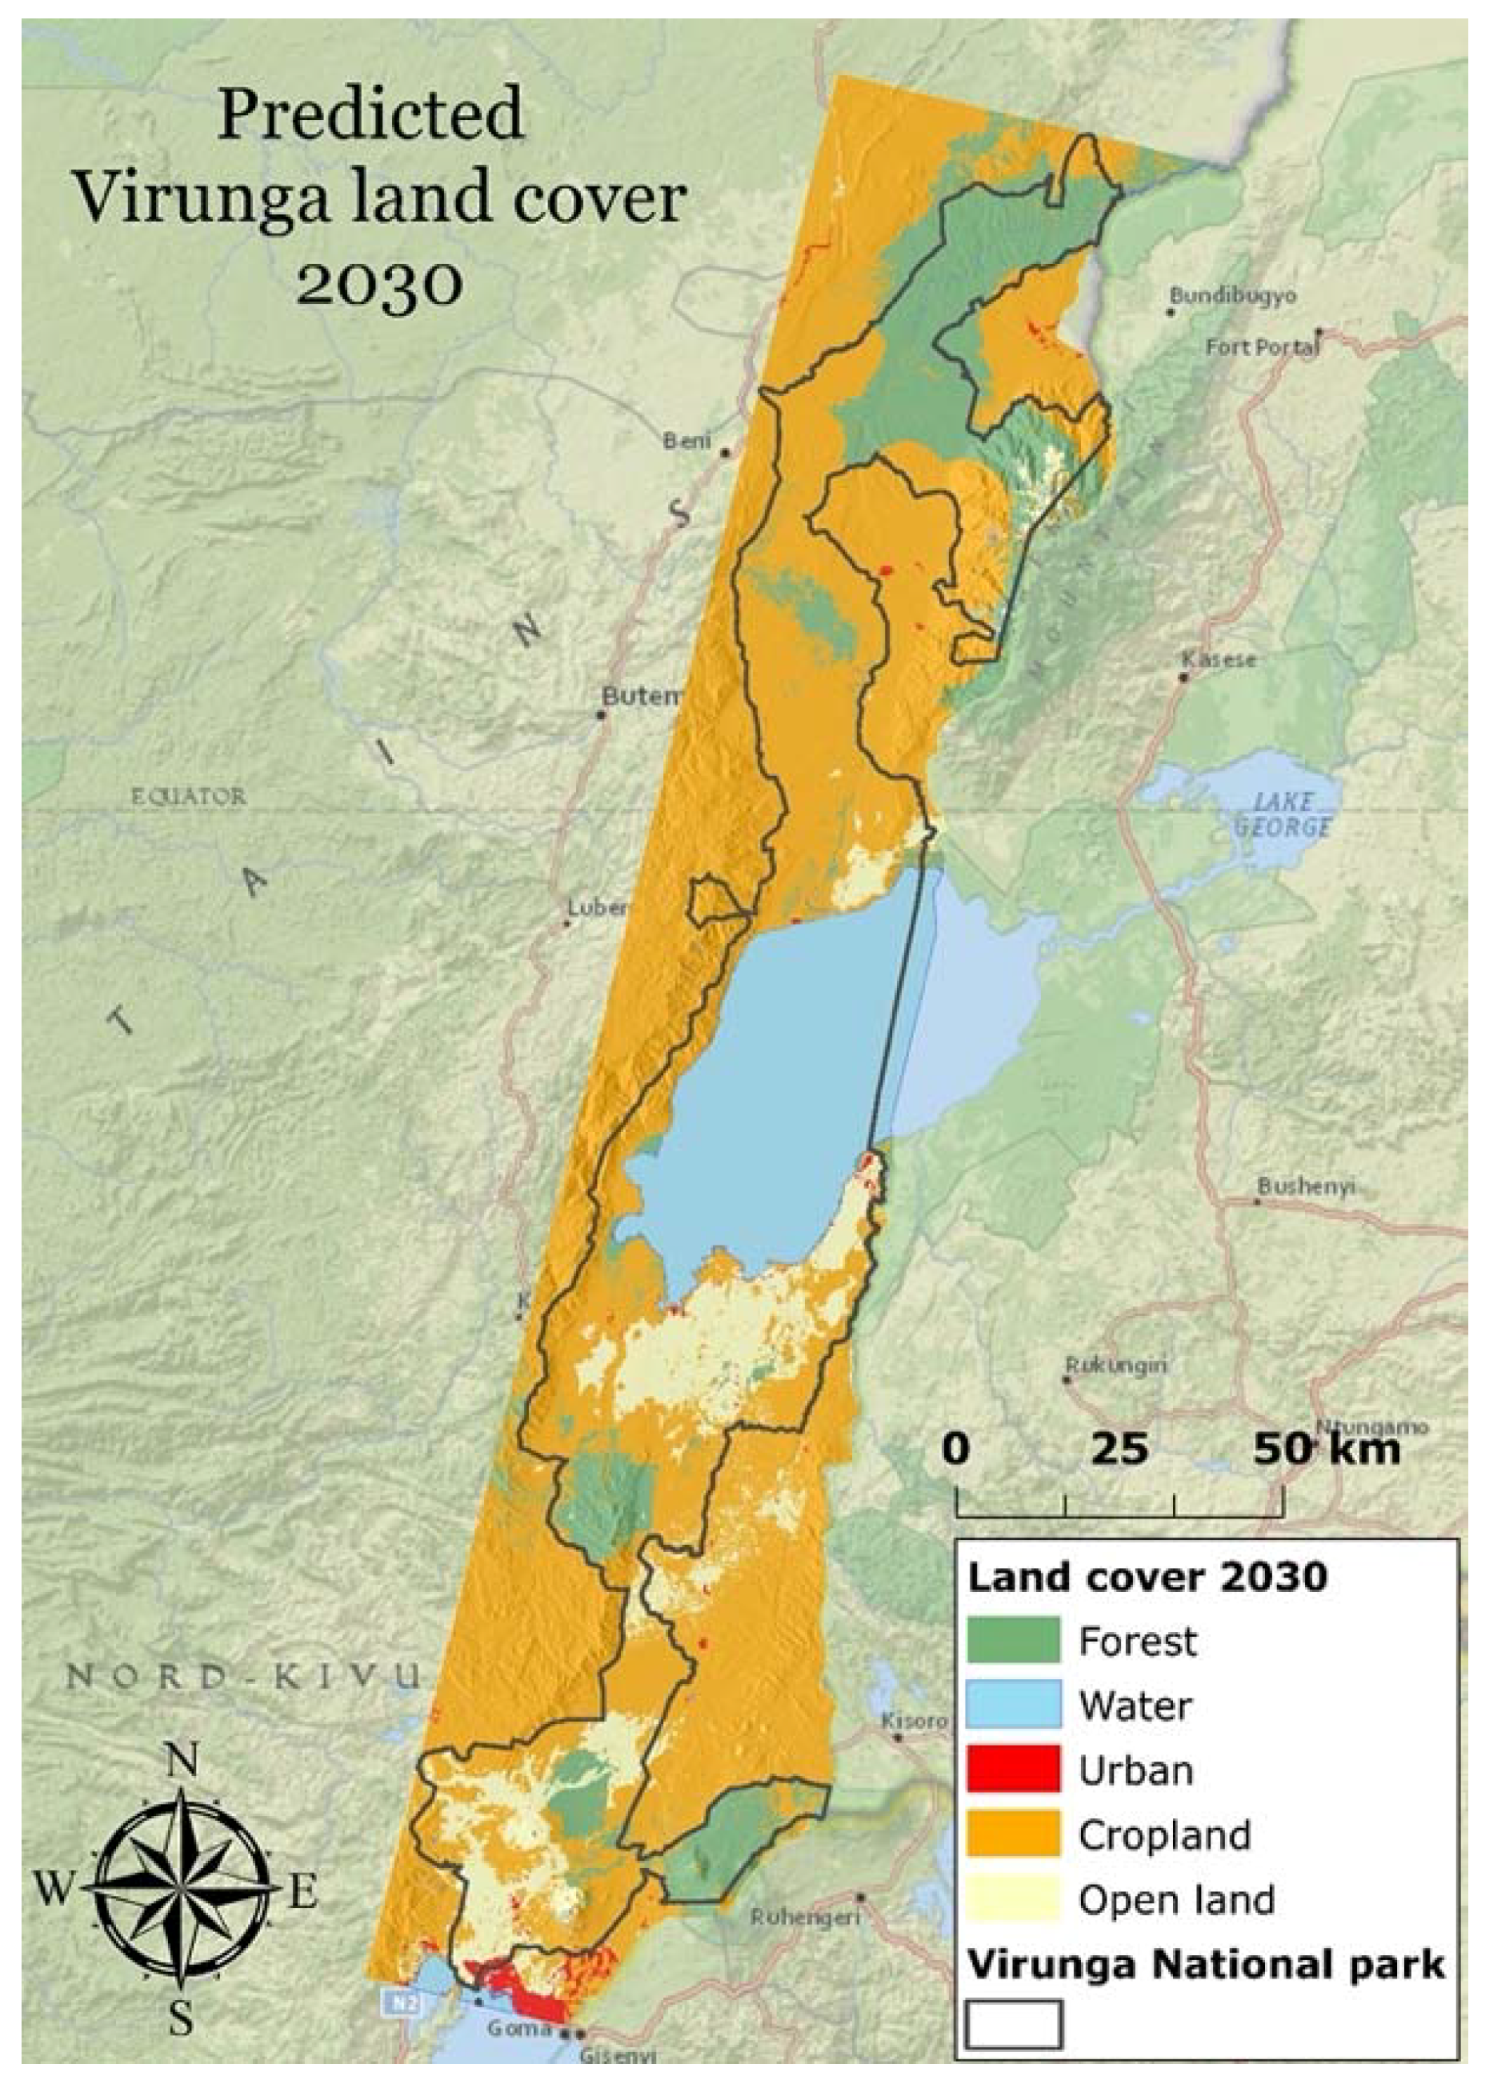
4.2.2. Land Cover Prediction
5. Discussion
5.1. Policy Response Options, Planning Interventions and SDG Implementation
5.1.1. Incentivising Alternatives to Charcoal
5.1.2. Community Development
5.1.3. Utilising the LULC Change Model to Gain Intergovernmental Support and Mobilise Resources
6. Conclusions
Author Contributions
Funding
Conflicts of Interest
Appendix A
| Map.centerObject(AOI, 9); |
| Map.addLayer(AOI, {}, ’aoi’); |
| //For Landsat surface reflectance product cloud masking |
| function maskclouds(image) { |
| var cloudShadowBitMask = 1 << 3; // cloud shadow |
| var cloudsBitMask = 1 << 5; // cloud |
| var qa = image.select(’pixel_qa’); |
| var date = image.get(’system:time_start’); |
| var mask = qa.bitwiseAnd(cloudShadowBitMask).eq(0) |
| .and(qa.bitwiseAnd(cloudsBitMask).eq(0)); |
| var ndvi = image.normalizedDifference([’B5’,’B4’]).multiply(10000).rename(’NDVI’); |
| return image.addBands(ndvi).updateMask(mask).divide(10000).set(’system:time_start’,date); |
| } |
| //Landsat 8 image collection |
| var L8collection = ee.ImageCollection(’LANDSAT/LC08/C01/T1_SR’) |
| .filterDate(’2017-01-01’, ’2019-03-23’) |
| .filterBounds(AOI) |
| .filter(ee.Filter.lt(’CLOUD_COVER’, 35)) |
| .map(maskclouds); |
| print (L8collection); |
| var testimage = L8collection.median().clip(AOI); |
| Map.addLayer(testimage.select([’B5’, ’B4’, ’B3’]), {min:0, max:0.4}, ’false color’); |
| Map.addLayer(testimage.select([’B4’, ’B3’, ’B2’]), {min:0, max:0.4}, ’true color color’); |
| // Subsample training polygons with random points |
| // this ensures all classes have same sample size |
| // also EE can’t handle too many cells at once |
| var trainingLayers = [forest, water, city, cropland, openland2]; |
| var n = 500; |
| // loop over training layers |
| for (var i = 0; i < trainingLayers.length; i++) { |
| // sample points within training polygons |
| var pts = ee.FeatureCollection |
| .randomPoints(trainingLayers[i].geometry(), n); |
| // add class |
| var thisClass = trainingLayers[i].get(’class’); |
| pts = pts.map(function(f) { |
| return f.set({class: thisClass}); |
| }); |
| // extract raster cell values |
| var training = testimage.sampleRegions(pts, [’class’], 30); |
| // combine trainging regions together |
| if (i === 0) { |
| var trainingData = training; |
| } else { |
| trainingData = trainingData.merge(training); |
| } |
| } |
| print (trainingData); |
| //// classify with random forests |
| // use bands 1-7+NDVI |
| var bands = [’B1’, ’B2’, ’B3’, ’B4’, ’B5’,’B6’, ’B7’, ’NDVI’]; |
| // fit a random forests model |
| var classifier = ee.Classifier.randomForest(500) |
| .train(trainingData, ’class’, bands); |
| // produce the land cover map |
| var classified = testimage.classify(classifier); |
| var p = [’00ff00’, ’ff0000’, ’000000’, ’0000ff’, ’orange’,]; |
| // display |
| Map.addLayer(classified, {palette: p, min: 1, max: 5}, ’classification’); |
| //Accuracy assessment |
| //Test the classifiers’ accuracy. (data, y, X) |
| var trainingClassifier = classifier.train(training, ’class’, bands); |
| //Separate validation |
| var testingsep = forestvali.merge(watervali).merge(cityvali).merge(croplandvali).merge(openlandvali); |
| // Add reducer output to the Features in the collection. |
| testingsep = testimage.sampleRegions(testingsep, [’class’], 30); |
| //print (testingsep) |
| var validation_sep = testingsep.classify(trainingClassifier); |
| //print (validation_sep) |
| var errorMatrix_sep = validation_sep.errorMatrix(’class’, ’classification’); |
| //print(’Error Matrix:’, errorMatrix_sep); |
| var ft = ee.FeatureCollection([ee.Feature(null, {’Accuracy’: errorMatrix_sep.accuracy(), ’Producer Accuracy’:errorMatrix_sep.producersAccuracy(), ’User Accuracy’:errorMatrix_sep.consumersAccuracy(), ’Kappa’: errorMatrix_sep.kappa(), ’Error Matrix’:errorMatrix_sep.array()})]); |
| // Define customization options. |
| var options = { |
| title: ’Landsat 8’, |
| hAxis: {title: ’Wavelength (micrometers)’}, |
| vAxis: {title: ’Reflectance’}, |
| lineWidth: 1, |
| pointSize: 4, |
| series: { |
| 0: {color: ’00FF00’}, // forest |
| 1: {color: ’0000FF’}, // water |
| 2: {color: ’FF0000’}, // city |
| 3: {color: ’orange’}, // openland1 |
| 4: {color: ’grey’}, // cropland |
| 5: {color: ’yellow’}, // openland2 |
| }}; |
| // Define a list of Landsat 8 wavelengths for X-axis labels. |
| var wavelengths = [0.44, 0.48, 0.56, 0.65, 0.86, 1.61, 2.2, 2.5]; |
| // Create the chart and set options. |
| var spectraChart = ui.Chart.image.regions( |
| testimage.select(bands), trainingLayers, ee.Reducer.mean(), 30, ’class’, wavelengths) |
| .setChartType(’ScatterChart’) |
| .setOptions(options); |
| // Display the chart. |
| print(spectraChart); |
| Export.table.toDrive({collection: ft, description: ’accu_2018’, |
| fileNamePrefix: ’accu_2018’, folder: ’Master thesis’, selectors: [’User Accuracy’, ’Producer Accuracy’, ’Accuracy’,’Kappa’, ’Error Matrix’]}); |
| // Export the image, specifying scale and region. |
| Export.image.toDrive({ |
| image: classified, |
| description: ’VirungaLC_2018’, |
| scale: 30, |
| folder: ’Master thesis’, |
| region: AOI.geometry().bounds(), |
| maxPixels: 2091108075, |
| crs:’EPSG:4051’ |
| }); |
References
- Andersen, F. Virunga National Park, the heart of darkness as UNESCO World Heritage. Cont. Manuscr. 2018, 11, 1–15. [Google Scholar] [CrossRef]
- Kayijamahe, E. Spatial Modelling of Mountain Gorilla (Gorilla Beringei Beringei) Habitat Suitability and Human Impact Virunga Volcanoes Mountains, Rwanda, Uganda and Democratic Republic of Congo; International Institute for Geo-information Science and Earth Observation: Enschede, The Netherlands, 2008. [Google Scholar]
- UNESCO. Virunga National Park. 2019. Available online: https://whc.unesco.org/en/list/63/ (accessed on 9 May 2019).
- Rainer, H.; Lanjouw, A.; Kayitare, A.; Rutagarama, E.; Sivha, M.; Asuma, S.; Kalpers, J. Beyond Boundaries: Transboundary Natural Resource Management for Mountain Gorillas in the Virunga-Bwindi Region; Biodiversity Support Program: Washington, DC, USA, 2001. [Google Scholar]
- UNESCO. Virunga National Park (Democratic Republic of the Congo). 2018. Available online: https://whc.unesco.org/en/soc/3815 (accessed on 9 May 2019).
- Yee, A. In Africa’s Oldest Park, Seeking Solutions to A Destructive Charcoal Trade; YaleEnvironment360: New Haven, CT, USA, 14 September 2017. [Google Scholar]
- Liping, C.; Yujun, S.; Saeed, S. Monitoring and predicting land use and land cover changes using remote sensing and GIS techniques-A case study of a hilly area, Jiangle, China. PLoS ONE 2018, 13, e0200493. [Google Scholar] [CrossRef]
- National Research Council. Advancing Land Change Modeling: Opportunities and Research Requirements; National Academies Press: Washington, DC, USA, 2014. [Google Scholar] [CrossRef]
- Shade, C.; Kremer, P. Predicting land use changes in philadelphia following green infrastructure policies. Land 2019, 8, 28. [Google Scholar] [CrossRef]
- Gibson, L.; Münch, Z.; Palmer, A.; Mantel, S. Future land cover change scenarios in South African grasslands—Implications of altered biophysical drivers on land management. Heliyon 2018, 4, e00693. [Google Scholar] [CrossRef] [PubMed]
- Guerrero, G.; Masera, O.; Mas, J.-F. Land use/Land cover change dynamics in the Mexican highlands: Current situation and long term scenarios. In Modelling Environmental Dynamics; Springer: Berlin/Heidelberg, Germany, 2008; pp. 57–76. [Google Scholar] [CrossRef]
- Jokar Arsanjani, J.; Helbich, M.; Kainz, W.; Bloorani, A.D.; Darvishi Boloorani, A. Integration of logistic regression, Markov chain and cellular automata models to simulate urban expansion. Int. J. Appl. Earth Obs. Geoinf. 2013, 21, 265–275. [Google Scholar] [CrossRef]
- Eastman, R.J. TerrSet Geospatial Monitoring and Modeling System—Manual; Clark University: Worchester, MA, USA, 2016. [Google Scholar]
- Pérez-Vega, A.; Mas, J.-F.; Ligmann-Zielinska, A. Comparing two approaches to land use/cover change modeling and their implications for the assessment of biodiversity loss in a deciduous tropical forest. Environ. Model. Softw. 2012, 29, 11–23. [Google Scholar] [CrossRef]
- Allan, R.; Förstner, U.; Salomons, W.; Paegelow, M.; Olmedo, M.T.C. Model Environmental Dynamics: Advances in Geomatic Solutions; Springer: Berlin/Heidelberg, Germany, 2008. [Google Scholar]
- Eastman, R.J. Terrset Geospatial Monitoring and Modelling System—Tutorial; Clark University: Worchester, MA, USA, 2016. [Google Scholar]
- Mirici, M.E. Land use/cover change modelling in a mediterranean rural landscape using multi-layer perceptron and markov chain (mlp-mc). Appl. Ecol. Environ. Res. 2018, 16, 467–486. [Google Scholar] [CrossRef]
- Institute for Environmental Security. Mining, Forest Change and Conflict in the Kivus, Eastern Democratic Republic of Congo—Outcome of a Short Study within the IES-ESPA Programme; Institute for Environmental Security: The Hague, The Netherlands, 2008. [Google Scholar]
- Yang, Z.R. Multi-layer perceptron. In Machine Learning Approaches to Bioinformatics; Yang, Z.R., Ed.; World Scientific: Singapore, 2010; pp. 133–153. [Google Scholar] [CrossRef]
- Central Intelligence Agency. The World Factbook 2020; Central Intelligence Agency: Washington, DC, USA, 2020.
- Zadbagher, E.; Becek, K. Modeling land use/land cover change using remote sensing and geographic information systems: Case study of the Seyhan. Environ. Monit. Assess. 2018, 190, 494. [Google Scholar] [PubMed]
- Jones, B. Deforestation surges in Virunga National Park in the wake of violence. Mongabay. 2018. Available online: https://news.mongabay.com/2018/10/deforestation-surges-in-virunga-national-park-in-the-wake-of-violence/ (accessed on 17 February 2020).
- World Wildlife Fund (WWF). The Economic Value Of Virunga National Park Report; WWF: Grand, Switzerland, 2013. [Google Scholar]
- Crawford, A.; Bernstein, J. MEAs, Conservation, and Conflict—A Case Study of Virunga National Park, DRC; International Institute for Sustainable Development: Winnipeg, MB, Canada, 2008; Volume 1. [Google Scholar]


| Transition Submodel | Description | Land Cover Transitions |
|---|---|---|
| Abandonment/reclamation | Urban and agricultural areas converted to grassland and open land |
|
| Afforestation | Land cover classes converted to tree plantation |
|
| Agricultural intensification | Agricultural areas substituting grasslands and open land areas |
|
| Deforestation | Forested areas converted into other land class types |
|
| Natural dynamics | Areas where natural changes cause land conversion |
|
| Urban intensification | Urban areas substitute other land classes |
|
| Variable | DEM | Asp | Slope | EL | D_am | D_disturb | D_cities | D_forests | D_mining | D_roads | D_water |
|---|---|---|---|---|---|---|---|---|---|---|---|
| Data origin | SRTM 90m Digital Elevation Database v4 | Land cover 2010 + 2015 | International Peace Information Service (IPIS) | Land cover 2010 | World Resources Institute | Land cover 2010 | World Resources Institute | ||||
| Data format | Raster (GeoTiff) | Raster (GeoTiff) | Shapefile (points) | Raster (GeoTiff) | Shapefile (points) | Raster (GeoTiff | Shapefile (polygons) | Shapefile (lines) | Shapefile (lines) | ||
| Native coordinate system | WGS 84 | EPSG:4051 | WGS 84 | EPSG:4051 | WGS 84 | EPSG:4051 | WGS 84 | ||||
| Spatial resolution (m) | 90 m cell resolution resampled to a 30 m resolution | 30 m | 1: 50 000 vector scale converted to 30 m cell resolution | 30 m | 1: 50 000 vector scale converted to 30 m cell resolution | 30 m | 1: 50 000 vector scale converted to 30 m cell resolution | ||||
| Temporal resolution | 2008 | 2010–2015 | 2009–2016 | 2010 | 2009 | 2010 | 2013 | 2009 | 2009 | ||
| Geoprocessing | Reproject | Reproject; computed from DEM | Computed from land cover maps | Reproject; clip to AOI; Euclidian distance from all artisanal mines (rasterize) | Reclassify boolean (urban/cropland); Euclidian distance from disturbed areas | Reproject; clip to AOI; Euclidian distance from all cities (rasterize) | Reclassify boolean (forest); Euclidian distance from forest areas | Reproject; clip to AOI; Euclidian distance from all mining concessions (rasterize) | Reproject; clip to AOI; Euclidian distance from all roads (rasterize) | Reproject; clip to AOI; Euclidian distance from all waterways (rasterize) | |
| Given: | Probability of Changing to: | ||||
|---|---|---|---|---|---|
| Forest | Water | Urban | Cropland | Open Land | |
| Forest | 0.3169 | 0.0017 | 0.0014 | 0.6271 | 0.0528 |
| Water | 0.019 | 0.9953 | 0.0000 | 0.0017 | 0.0011 |
| Urban | 0.0208 | 0.0016 | 0.4025 | 0.2786 | 0.2965 |
| Cropland | 0.1029 | 0.0005 | 0.0035 | 0.8022 | 0.0910 |
| Open land | 0.0701 | 0.0035 | 0.0268 | 0.6451 | 0.2545 |
| Overall Accuracy | Producer’s Accuracy | User’s Accuracy | |||||||
|---|---|---|---|---|---|---|---|---|---|
| Land Cover Class | 2010 | 2015 | 2019 | 2010 | 2015 | 2019 | 2010 | 2015 | 2019 |
| Forest | 96 | 90.9 | 100 | 96 | 100 | 86 | |||
| Water | 100 | 100 | 100 | 100 | 100 | 100 | |||
| Urban | 95.5 | 97.8 | 97.9 | 84 | 90 | 92 | |||
| Cropland | 91.8 | 100 | 80 | 90 | 82 | 88 | |||
| Open Land | 82.5 | 84.5 | 85.5 | 94 | 98 | 94 | |||
| Total (in %) | 92.8 | 94 | 92 | 93.2 | 94.6 | 92.7 | 92.8 | 94 | 92 |
| LC_2010 | |||||||
|---|---|---|---|---|---|---|---|
| Land Class | Forest | Water | Urban | Cropland | Open Land | Total (km2) | |
| LC_2015 | Forest | 3327.5 | 1.6 | 0.0 | 247.5 | 69.8 | 3646.4 |
| Water | 3.8 | 1770.2 | 0.0 | 0.3 | 5.2 | 1779.5 | |
| Urban | 0.6 | 0.0 | 13.0 | 2.5 | 59.5 | 75.6 | |
| Cropland | 1715.4 | 0.3 | 0.9 | 4051.8 | 1109.2 | 6877.6 | |
| Open land | 66.1 | 0.9 | 3.8 | 236.2 | 1791.2 | 2098.3 | |
| Total (km2) | 5113.4 | 1773.0 | 17.8 | 4538.4 | 3035.0 | 14,477.5 | |
| Variable | DEM | Asp | Slope | EL | D_am | D_disturb | D_cities | D_forests | D_mining | D_roads | D_water | |
|---|---|---|---|---|---|---|---|---|---|---|---|---|
| Cramer’s V | Forest | 0.52 | 0.21 | 0.26 | 0.68 | 0.17 | 0.40 | 0.17 | 0.43 | 0.14 | 0.26 | 0.27 |
| Water | 0.61 | 0.83 | 0.57 | 0.42 | 0.32 | 0.68 | 0.54 | 0.82 | 0.27 | 0.57 | 0.30 | |
| Urban | 0.14 | 0.07 | 0.06 | 0.10 | 0.08 | 0.04 | 0.06 | 0.04 | 0.09 | 0.09 | 0.07 | |
| Cropland | 0.42 | 0.32 | 0.34 | 0.29 | 0.31 | 0.52 | 0.20 | 0.32 | 0.31 | 0.34 | 0.29 | |
| Open land | 0.23 | 0.17 | 0.24 | 0.65 | 0.20 | 0.15 | 0.18 | 0.30 | 0.24 | 0.11 | 0.08 | |
| Overall | 0.42 | 0.42 | 0.33 | 0.48 | 0.22 | 0.42 | 0.28 | 0.46 | 0.22 | 0.32 | 0.20 | |
| Backwards Stepwise Constant Forcing | |||
|---|---|---|---|
| Model | Variables Included | Accuracy (%) | Skill Measure |
| With all variables | All variables | 72.25 | 0.6300 |
| Step 1: var.[5] constant | [1,2,3,4,6,7,8,9,10] | 72.25 | 0.6300 |
| Step 2: var.[5,10] constant | [1,2,3,4,6,7,8,9] | 72.23 | 0.6298 |
| Step 3: var.[5,10,7] constant | [1,2,3,4,6,8,9] | 72.06 | 0.6275 |
| Step 4: var.[5,10,7,9] constant | [1,2,3,4,6,8] | 69.86 | 0.5981 |
| Step 5: var.[5,10,7,9,4] constant | [1,2,3,6,8] | 65.48 | 0.5397 |
| Step 6: var.[5,10,7,9,4,8] constant | [1,2,3,6] | 62.59 | 0.4999 |
| Step 7: var.[5,10,7,9,4,8,3] constant | [1,2,6] | 54.55 | 0.3940 |
| Step 8: var.[5,10,7,9,4,8,3,1] constant | [2,6] | 47.77 | 0.3036 |
| Step 9: var.[5,10,7,9,4,8,3,1,6] constant | [2] | 29.40 | 0.0587 |
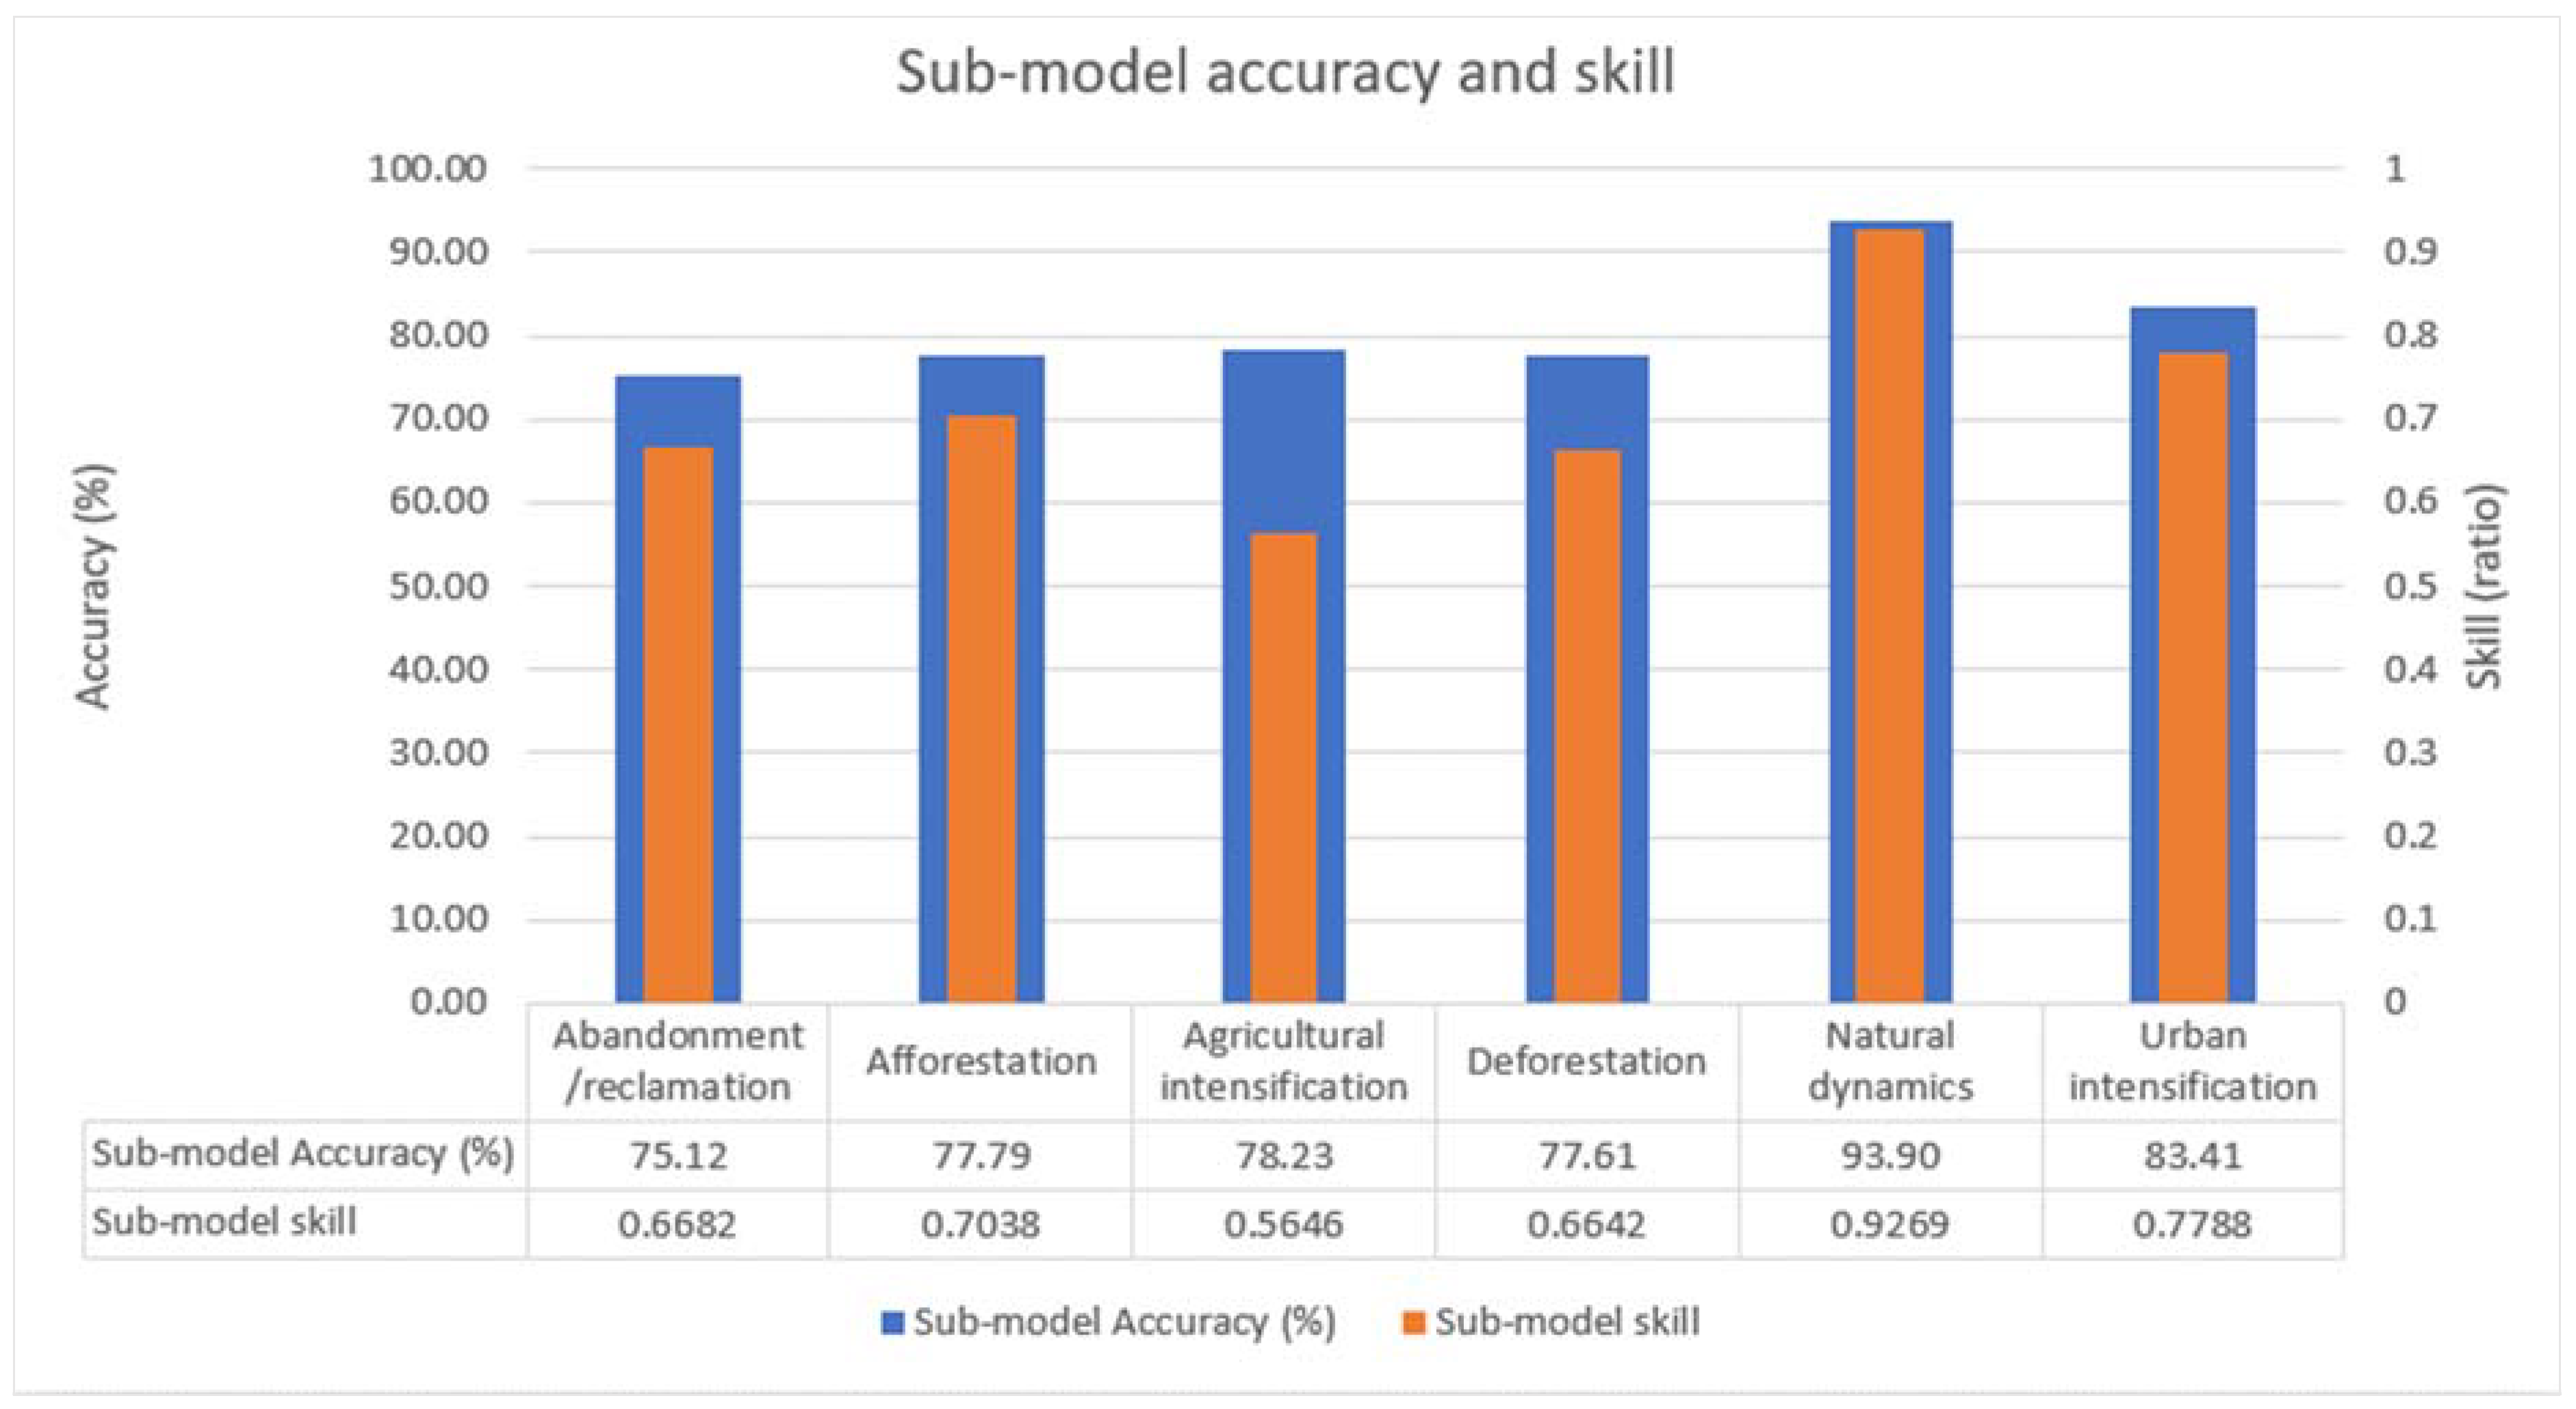
| Submodel | Explanatory Variables | Transition/Persistence Class | Class Skill Measure (ratio) | Submodel Accuracy | Submodel Skill | RMS | |
|---|---|---|---|---|---|---|---|
| Training | Testing | ||||||
| Abandonment/reclamation | DEM; Slope; D_am; D_cities; D_mining; D_water | Urban to Openland | 0.8134 | 75.12% | 0.6682 | 0.2980 | 0.3071 |
| Cropland to Openland | 0.5741 | ||||||
| Persistence: Urban | 0.7401 | ||||||
| Persistence: Cropland | 0.5398 | ||||||
| Afforestation | DEM; Slope; EL; D_disturb; D_forests; D_water | Cropland to Forest | 0.5181 | 77.79% | 0.7038 | 0.2751 | 0.2737 |
| Openland to Forest | 0.8918 | ||||||
| Persistence: Cropland | 0.6536 | ||||||
| Persistence: Openland | 0.7515 | ||||||
| Agricultural intensification | DEM; D_am; D_disturb; D_mining; D_roads; D_water | Openland to Cropland | 0.5961 | 78.23% | 0.5646 | 0.3899 | 0.3906 |
| Persistence: Openland | 0.5329 | ||||||
| Deforestation | DEM; D_am; D_disturb; D_mining; D_roads; D_water | Forest to Cropland | 0.6103 | 77.61% | 0.6642 | 0.3358 | 0.3369 |
| Forest to Openland | 0.8300 | ||||||
| Persistence: Forest | 0.5516 | ||||||
| Natural dynamics | DEM; Slope; EL; D_forests; D_water | Forest to Water | 0.9848 | 93.90% | 0.9269 | 0.1207 | 0.1281 |
| Water to Forest | 0.9096 | ||||||
| Openland to Water | 0.8707 | ||||||
| Persistence: Forest | 0.8677 | ||||||
| Persistence: Water | 0.9849 | ||||||
| Persistence: Openland | 0.9441 | ||||||
| Urban intensification | Slope; EL; D_am; D_cities; D_mining; D_roads | Cropland to Urban | 0.8664 | 83.41% | 0.7788 | 0.2536 | 0.2489 |
| Openland to Urban | 0.6564 | ||||||
| Persistence: Cropland | 0.8294 | ||||||
| Persistence: Openland | 0.7630 | ||||||
| K INDICATORS | 2019 |
|---|---|
| KSTANDARD | 0.8828 |
| KNO | 0.9224 |
| KLOCATION | 0.9001 |
| KLOCATIONSTRATA | 0.9001 |
| LC_2019 | |||||||
|---|---|---|---|---|---|---|---|
| Land Class | Forest | Water | Urban | Cropland | Open Land | Total (km2) | |
| Simulated LC_2030 | Forest | 1707.2 | 0.2 | 0.5 | 289.7 | 15.8 | 2019.1 |
| Water | 4.8 | 1766.3 | 0.3 | 3.6 | 13.9 | 1789.6 | |
| Urban | 0.9 | 0.0 | 45.7 | 34.0 | 51.3 | 132.7 | |
| Cropland | 1579.6 | 0.5 | 15.7 | 6469.5 | 1081.8 | 9161.3 | |
| Open land | 65.8 | 0.2 | 6.3 | 308.3 | 991.3 | 1374.9 | |
| Total (km2) | 3358.3 | 1767.2 | 68.5 | 7105.1 | 2154.0 | 39,605.0 | |
© 2020 by the authors. Licensee MDPI, Basel, Switzerland. This article is an open access article distributed under the terms and conditions of the Creative Commons Attribution (CC BY) license (http://creativecommons.org/licenses/by/4.0/).
Share and Cite
Christensen, M.; Jokar Arsanjani, J. Stimulating Implementation of Sustainable Development Goals and Conservation Action: Predicting Future Land Use/Cover Change in Virunga National Park, Congo. Sustainability 2020, 12, 1570. https://doi.org/10.3390/su12041570
Christensen M, Jokar Arsanjani J. Stimulating Implementation of Sustainable Development Goals and Conservation Action: Predicting Future Land Use/Cover Change in Virunga National Park, Congo. Sustainability. 2020; 12(4):1570. https://doi.org/10.3390/su12041570
Chicago/Turabian StyleChristensen, Mads, and Jamal Jokar Arsanjani. 2020. "Stimulating Implementation of Sustainable Development Goals and Conservation Action: Predicting Future Land Use/Cover Change in Virunga National Park, Congo" Sustainability 12, no. 4: 1570. https://doi.org/10.3390/su12041570
APA StyleChristensen, M., & Jokar Arsanjani, J. (2020). Stimulating Implementation of Sustainable Development Goals and Conservation Action: Predicting Future Land Use/Cover Change in Virunga National Park, Congo. Sustainability, 12(4), 1570. https://doi.org/10.3390/su12041570