Article

Tax or Subsidy? Optimal Carbon Emission Policy: A Supply Chain Perspective

1
School of Management Science and Engineering, Nanjing University of Finance and Economics, Nanjing 210023, China
2
School of Marketing and Logistics Management, Nanjing University of Finance and Economics, Nanjing 210023, China
3
School of Business, Nanjing University, Nanjing 210093, China
4
School of Management and Engineering, Nanjing University, Nanjing 210093, China
*
Author to whom correspondence should be addressed.
Sustainability 2020, 12(4), 1548; https://doi.org/10.3390/su12041548
Submission received: 24 January 2020 / Revised: 7 February 2020 / Accepted: 7 February 2020 / Published: 19 February 2020
(This article belongs to the Special Issue Optimal Decisions and Risk Assessment in Sustainable Supply Chains)

Abstract

:
With a rigid requirement for environment protection, governments need to make appropriate policies to induce firms to adopt green technology in consideration of the rapidly increasing demand for environmentally friendly products. We investigated the government policy from the perspective of a supply chain, which consisted of the upstream government (she) and the downstream manufacturing firm (he). The government decided on the policy (tax or subsidy) to maximize the social welfare, while the firm decided on the greenness level of the product, which affects the consumers’ choice behavior and hence his own demand. Assuming else being equal, the government should adopt the tax policy if consumers are very sensitive to the greenness, the cost of greening is high, or the negative impact due to carbon emission is large, and subsidize the firm otherwise. We also conduct some numerical studies when price is endogenous. The main insights can be carried over.

1. Introduction

Environment protection is receiving increasing attention nowadays. In Beijing, China, the local residents are against the establishment of a new steel factory due to the concerns of greenhouse effect and pollution damage [1]. As a result, the regulatory policy of the government became rigid to the firms. The carbon emission exchange platform was very active in 2018 and China’s carbon trading market had a total transaction volume of roughly $985 million U.S. by the end of May, according to the official data [2]. On the other hand, consumers are becoming more conscious about the carbon emission of the final products sold in supermarkets. Based on the survey by China Daily [3], consumers are willing to pay more for the product with the label “organic” compared to the generic products. According to the BBMG (a brand and social innovation consulting company) conscious consumer report, 67% of Americans think that when buying products, a customer needs to consider whether it is good for the environment, and 51% are willing to pay higher prices for environmentally friendly products [4]. However, firms are reluctant to adopt new green technology to produce products with less carbon emissions in general [5].
To entice the firms to reduce carbon emissions, governments in different countries implement different policies, which can be classified as tax or subsidy policies. In 2018, China gave BYD (Build Your Dreams), an electric vehicle manufacturer, a subsidy of up to 50,000 RMB per vehicle [6]. However, carbon emissions in the auto industry are not as good as expected [7]. In contrast, the US passed CAFE (corporate average fuel economy) regulations, which requires the manufacturer to pay a penalty of $5.50 per 0.1 mpg for each product. After Finland and Sweden introduced a carbon dioxide tax in 1990s, carbon pricing systems, including taxes and cap-and-trade measures (which work similarly), have been adopted or planned in 40 countries and more than 20 cities, according to the World Bank. In Canada, carbon emissions in British Columbia dropped between 5% and 15% because of the tax [8]. Therefore, how to make appropriate policy to reduce carbon emissions is a big challenge facing governments.
We investigated this problem from a supply chain perspective. Specifically, we considered a two-tier supply chain consisting of one government policy-maker and one manufacturer. The key questions we aimed to answer included: (i) Which policy (tax or subsidy) should be adopted by the government? (ii) How will different factors (e.g., environment externality, the cost of new technology, etc.) affect the policy making? (iii) How will the manufacturer react in response to the government policy?
We established a stylized model setting to investigate the above questions. The government, as the Stackelberg leader, decides whether to tax or subsidize the firm in a particular industry, considering his possible reactions to different policies. The firm, as the Stackelberg follower, decides greening degree of his product, considering the consciousness of consumers to environmental protection (e.g., carbon emissions, pollutants, etc.). Our main findings are three-fold: Firstly, the government should adopt a tax policy if consumers are rather sensitive to the greenness level of products, the cost of greening is high, or the negative impact due to carbon emission is large, and subsidize the firm otherwise. Secondly, the firm will adopt a greener technology no matter the which policy (tax or subsidy) the government adopts compared with the situation without any government intervention. Lastly, the less sensitive consumers are toward the greenness of products, or the lower the cost of greening, the higher the consumers’ surplus.
In Section 2, we discuss the body of literature relating to this subject. In Section 3, we conceptualize and formulate the model used in this article and give the main results. In Section 4, we extend our model setting, incorporating the endogenous pricing issue. We conclude the paper in Section 5.

2. Literature Review

Our paper mainly relates to the following three streams of literature: (1) consumer behavior to the greenness of products (e.g., environmentally friendly products); (2) green supply chain management; and (3) government policy on operations and supply chain.
Consumer awareness regarding the greenness of products has received increasing attention. Among early works, Bei and Simpson [9] investigated consumer preferences for environmentally friendly products and evaluated the factors influencing consumer decision-making when purchasing recyclable products: price, expected quality and psychological benefits. Chen [10] established a quality-based model for products with both traditional and environmentally friendly attributes and segmented the market based on the environmental awareness of consumers. Interestingly, the development of green products and strict environmental standards are not necessarily environmentally beneficial. Ghosh and Shah [11] analyzed a structure where both the retailer and manufacturer benefit out of green initiatives (which results in an increase in market demand of the green product), however the cost of greening falls on the manufacturer. Nduneseokwu et al. [12] conducted an empirical survey in Onitsha and developed a theoretical framework based on the theory of planned behavior (TPB), finding that attitude, subjective norms and environmental knowledge are the major influencing factors in developing intentions to engage in formal e-waste collections. In this paper we assume that consumers are green-sensitive and the greening level of a product is of a quantifiable attribute.
The second stream that closely related to ours is on green supply chain management. Appolloni et al. [13] carried out a comprehensive literature review between 1996 and 2013 on three themes of environmental supply chain management and developed a conceptual framework of green procurement for future empirical research. Zhang et al. [14] focused on the optimal production decision of the manufacturer under stochastic demand with a total emission cap in the trading system. Swami and Shah [15] showed that both manufacturers and retailers invested in greening, which led to demand expansion. They analyzed the optimality of greening effort and proposed a two-part tariff contract to coordinate the green supply chain. Ren et al. [16] investigated the allocation of carbon emission reduction targets relating to products in a decentralized make-to-order production supply chain. Ghosh et al. [17] studied the impact of product greening costs and government regulations on a single firm and duopoly in a green-sensitive consumer market. Green supply chain management also includes those investigating the remanufacturing related activities such as product design, recovery, collection and reverse logistics (see e.g., Atasu et al.; Mitra and Webster [18,19]). Different from the above-mentioned literature, we considered a green supply chain consisting of one government policy-maker and one manufacturing firm. The government endogenously decides her policy (tax or subsidy) to maximize the total social welfare.
Our work is also closely related to those literature investigating government policies on firm’s greening behavior. Barnett [20] discussed the case of a monopolist who produces a single polluting product and incurs a tax as a consequence. Gouda et al. [21] surveyed the impact of composite regulatory plans on automobile manufacturers product development. Krass et al. [22] established a price-dependent demand model focusing on the role of environmental taxes in reducing environmental pollution. Yu et al. [23] considered government subsidy polies on different subjects, (i.e., manufacturers, consumers or both). The optimal policy depends on two factors: whether the products have a well-established market price, and how the government weighs on consumer welfare versus the manufacturer’s profit. Taking into account the expected and undesired output, Qu et al. [24] use the EBM (epsilon-based measure) model to measure the green growth efficiency of China’s manufacturing industry putting forward that an environmental policy can guide green technology innovation. Furthermore, other environmental government policies such as Green Public Procurement (GPP) have also been investigated (see Cheng et al.; Rizzi et al. [25,26]). Our paper considers the optimal government policy making from a supply chain perspective, considering both the manufacturer’s profit and consumers’ surplus as well as the social externalities due to carbon emission. The main factors driving different government policies depend on the greening cost, the sensitivity of consumers on the greenness of products and (perceived) negative effects taken by the production process.

3. Modeling

3.1. Basic Model Settings

In this model, the consumer demand is positively affected by the greenness of products produced by the manufacturer which we define as a quantifiable, measurable attribute. Swami and Shah (2012) refer to this phenomenon as the demand expansion effect of greening efforts. Consumers are more inclined to buy appliances with lower energy consumption levels and vehicles with higher fuel efficiency, which are examples of product greening improvements that have contributed to increased demand.
This paper considers the single choice decision-making process of product greenness, assuming that a is the total market demand faced by enterprises, and p is the price of green products. Further, θ is defined as the greening level of the product and is assumed to be continuous; both positive and negative values of θ are acceptable. In addition, b and γ are consumers’ green-sensitivity and price sensitivity coefficients, respectively. We assume that market demand is linearly decreasing in price and increasing in the ‘greening level of products’. Linear demand models are often used in research because of their processability, and can draw interesting conclusions about model parameters. Therefore, market demand for products is as follows:
d = a + b θ γ p
where a + b θ > γ p and b , γ > 0 .
The above expression reflects the phenomenon of increasing consumer demand caused by product greenness. The cost per unit of products produced by an enterprise is c + λ θ , in which constant c is the production cost per unit of a product when the level of greening is 0 and λ is the greening cost per unit, showing that the unit cost to the enterprise increases with the greenness of products. Product costs decrease if θ is less than 0, and product costs increase otherwise.
Enterprises must decide the level of greening for their own products. We next analyze decision-making under the influence of consumer demand expansion with and without government carbon emission policies in existence. We also explore the amount of tax or subsidies that should be set by the government alongside carbon emission policies. In this way, we are able to measure the effect of demand expansion and the influence of government policies on business’ decision-making. Based on this, we explore the optimal level of government decision-making.

3.2. Demand Expansion Effect Only

The objective of the firm is
M a x π B ( θ ) = [ p ( c + λ θ ) ] d = [ p ( c + λ θ ) ] ( a + b θ γ p )
Subscript B denotes the benchmark, meaning only the effect of demand expansion is considered. That is, there is no government carbon emission policy. Since d 2 π B ( θ ) d θ 2 = 2 b λ < 0 , we can derive the following optimal values:
θ B = b ( p c ) λ ( a γ p ) 2 b λ
d B = b ( p c ) λ ( a γ p ) 2 λ
π B = [ b ( p c ) + λ ( a γ p ) ] 2 4 b λ

3.3. Demand Expansion Effect and Carbon Emission Policy Exist Together

We model government policy in a similar way to CAFE standards. In order to further study the existence of government carbon emission policies, we consider penalty and subsidy policies within the scope of government regulations in this model. Therefore, in addition to the previous parameters, t denotes the penalty or subsidy levied per unit in greening standards for products produced by the enterprise. From a practical point of view, we assume t < λ . For simplicity and generality, it is assumed that the environmental standards set by the government is 0 (unless otherwise stated). Thus, the objective function of the firm is:
M a x π ( t | s ) ( θ ) = [ p ( c + λ θ ) + t θ ] d = [ p ( c + λ θ ) + t θ ] ( a + b θ γ p )
The index ( t | s ) denotes the tax or subsidy. The expression above articulates an interesting phenomenon. The government levies a linear tax for every unit of greening that the enterprise falls short of, which is multiplied by total production quantity t θ d ( θ ) . On the contrary, when the greening level of products is higher than normal, the government subsidizes a proportion of the greening difference t θ d ( θ ) .
The goal of firms is to determine the greening level of products according to carbon emission policies and production costs so as to maximize the objective function (6). Therefore, decision-making follows this sequence: firstly, the firm determines the level of greening improvement of their products and then realizes demand by setting greening level. By solving this problem, we draw the following conclusions (refer to the Appendix A for proof):
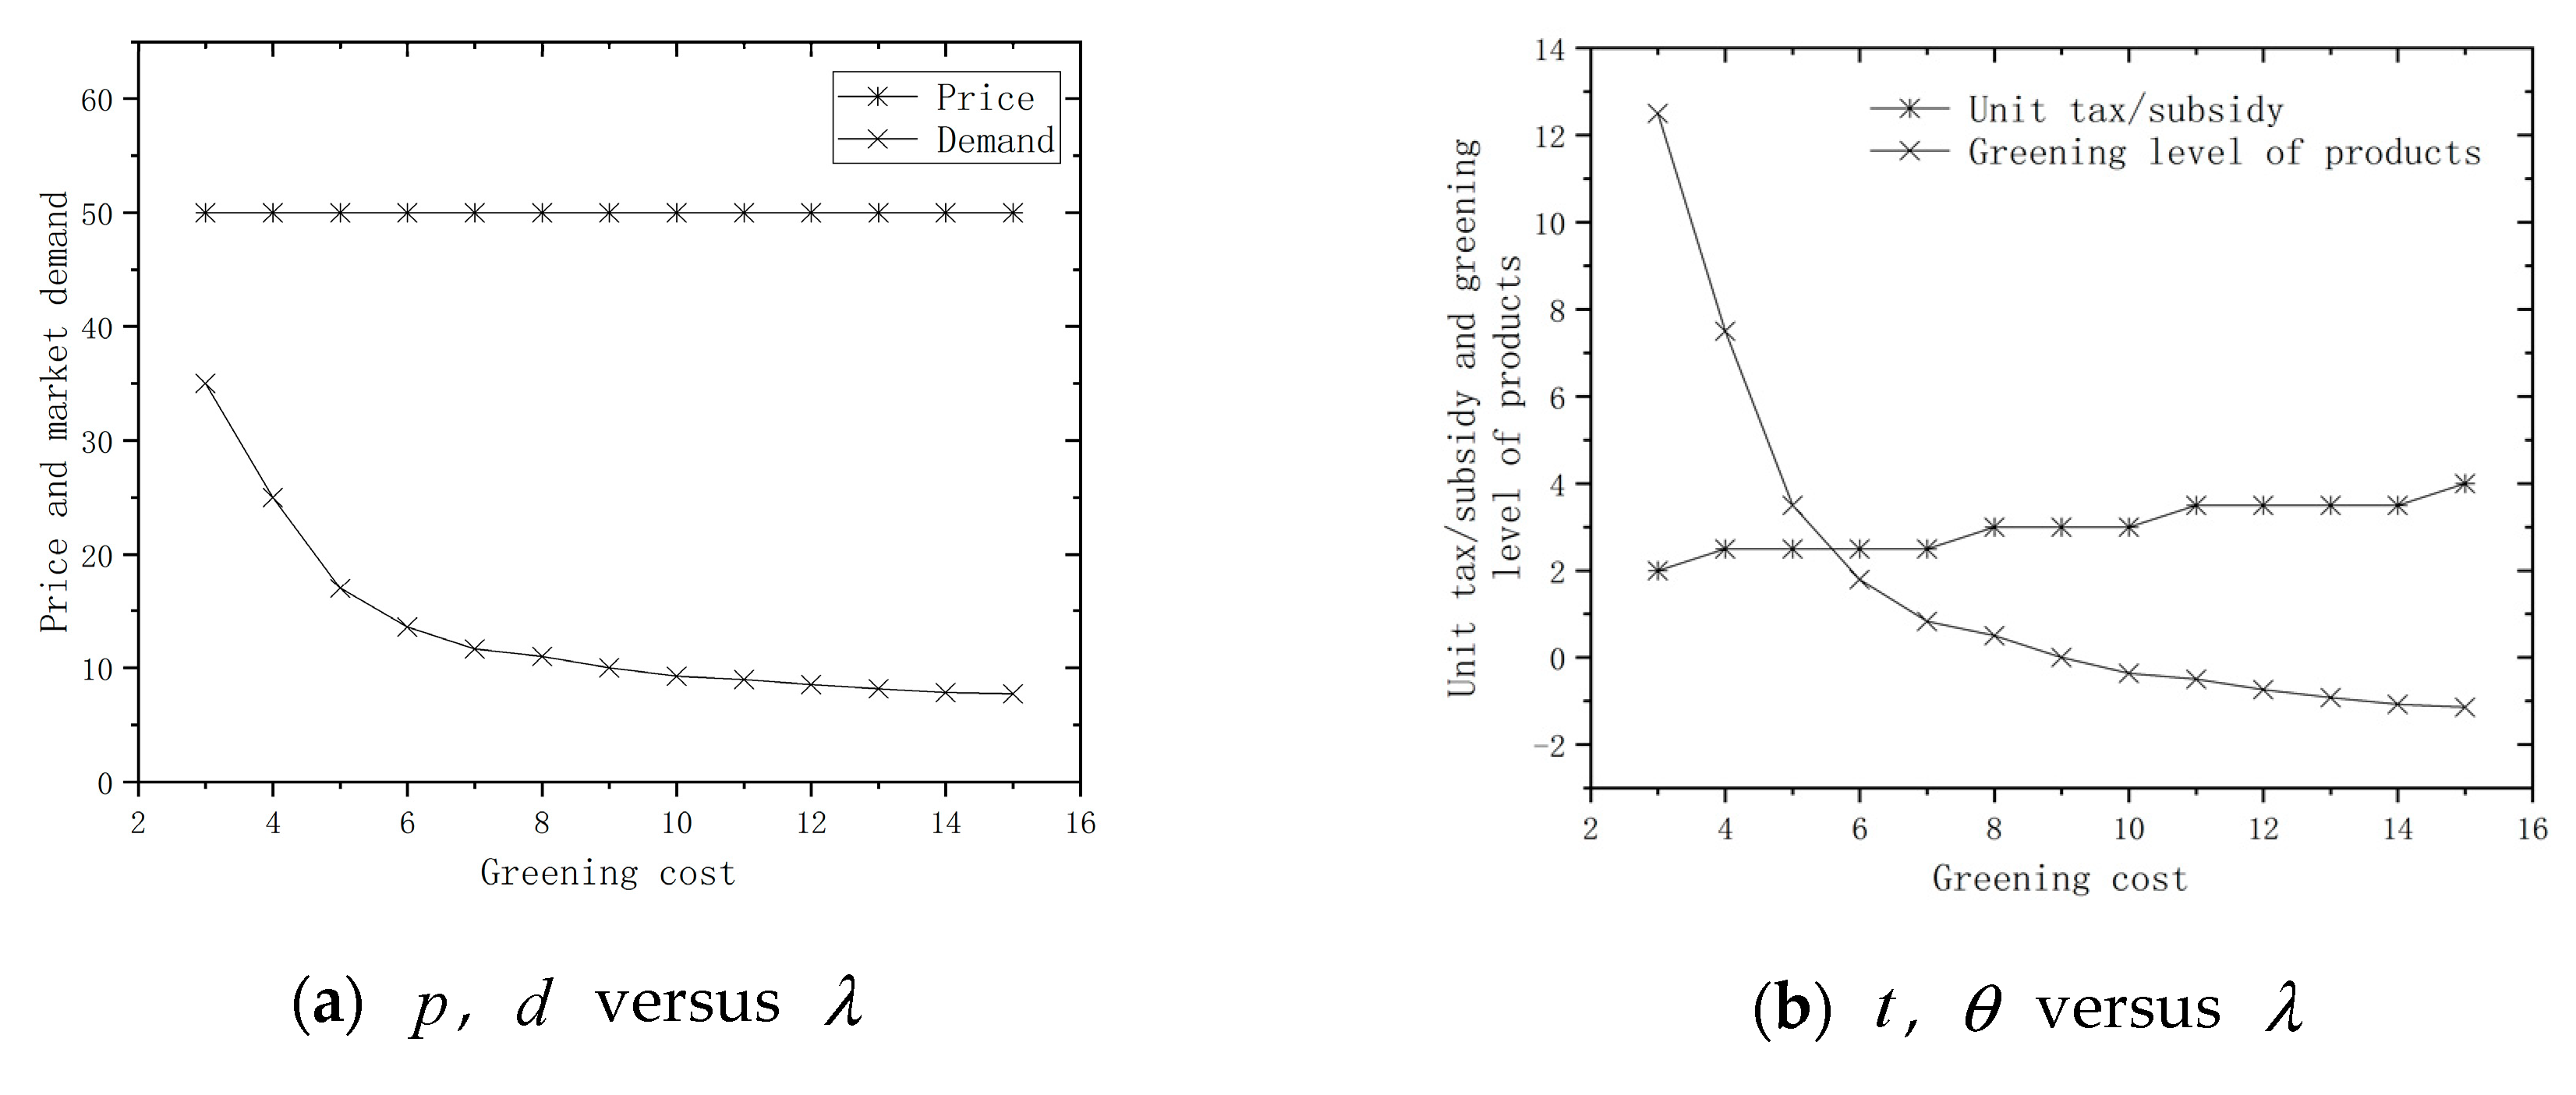
Proposition 1. 
The optimal level of greening achieved by the firm is:
θ ( t | s ) = b ( p c ) ( λ t ) ( a γ p ) 2 b ( λ t ) { < 0 , λ > Δ 1 0 , t < λ Δ 1
where Δ 1 = t + b ( p c ) ( a γ p ) .
It can be inferred from the above proposition that when the greening cost λ is higher than the limit denoted by Δ 1 , the greening level of products does not meet the standard set by the government. Note that Δ 1 is increasing in t , indicating that with the increase of government taxes, firms struggle to achieve a higher level of greening ( Δ 1 t > 0 ). Obviously, in the process of determining the best greening level of products, costs and taxes remain the most prominent challenges faced by firms.
Under the given assumptions, substituting θ ( t | s ) for Equations (1) and (6) can express market demand and the profit of the firm as follows
{ d ( t | s ) = b ( p c ) + ( λ t ) ( a γ p ) 2 ( λ t ) π ( t | s ) = [ b ( p c ) + ( λ t ) ( a γ p ) ] 2 4 b ( λ t )
Lemma 1.
(i) The optimal greening level θ ( t | s ) and the optimal total output d ( t | s ) of the firm decreases in greening cost λ and increases in demand sensitivity to greening b ; (ii) the optimal profit of the firm decreases first when t < λ < Δ 1 then increases in λ and b .
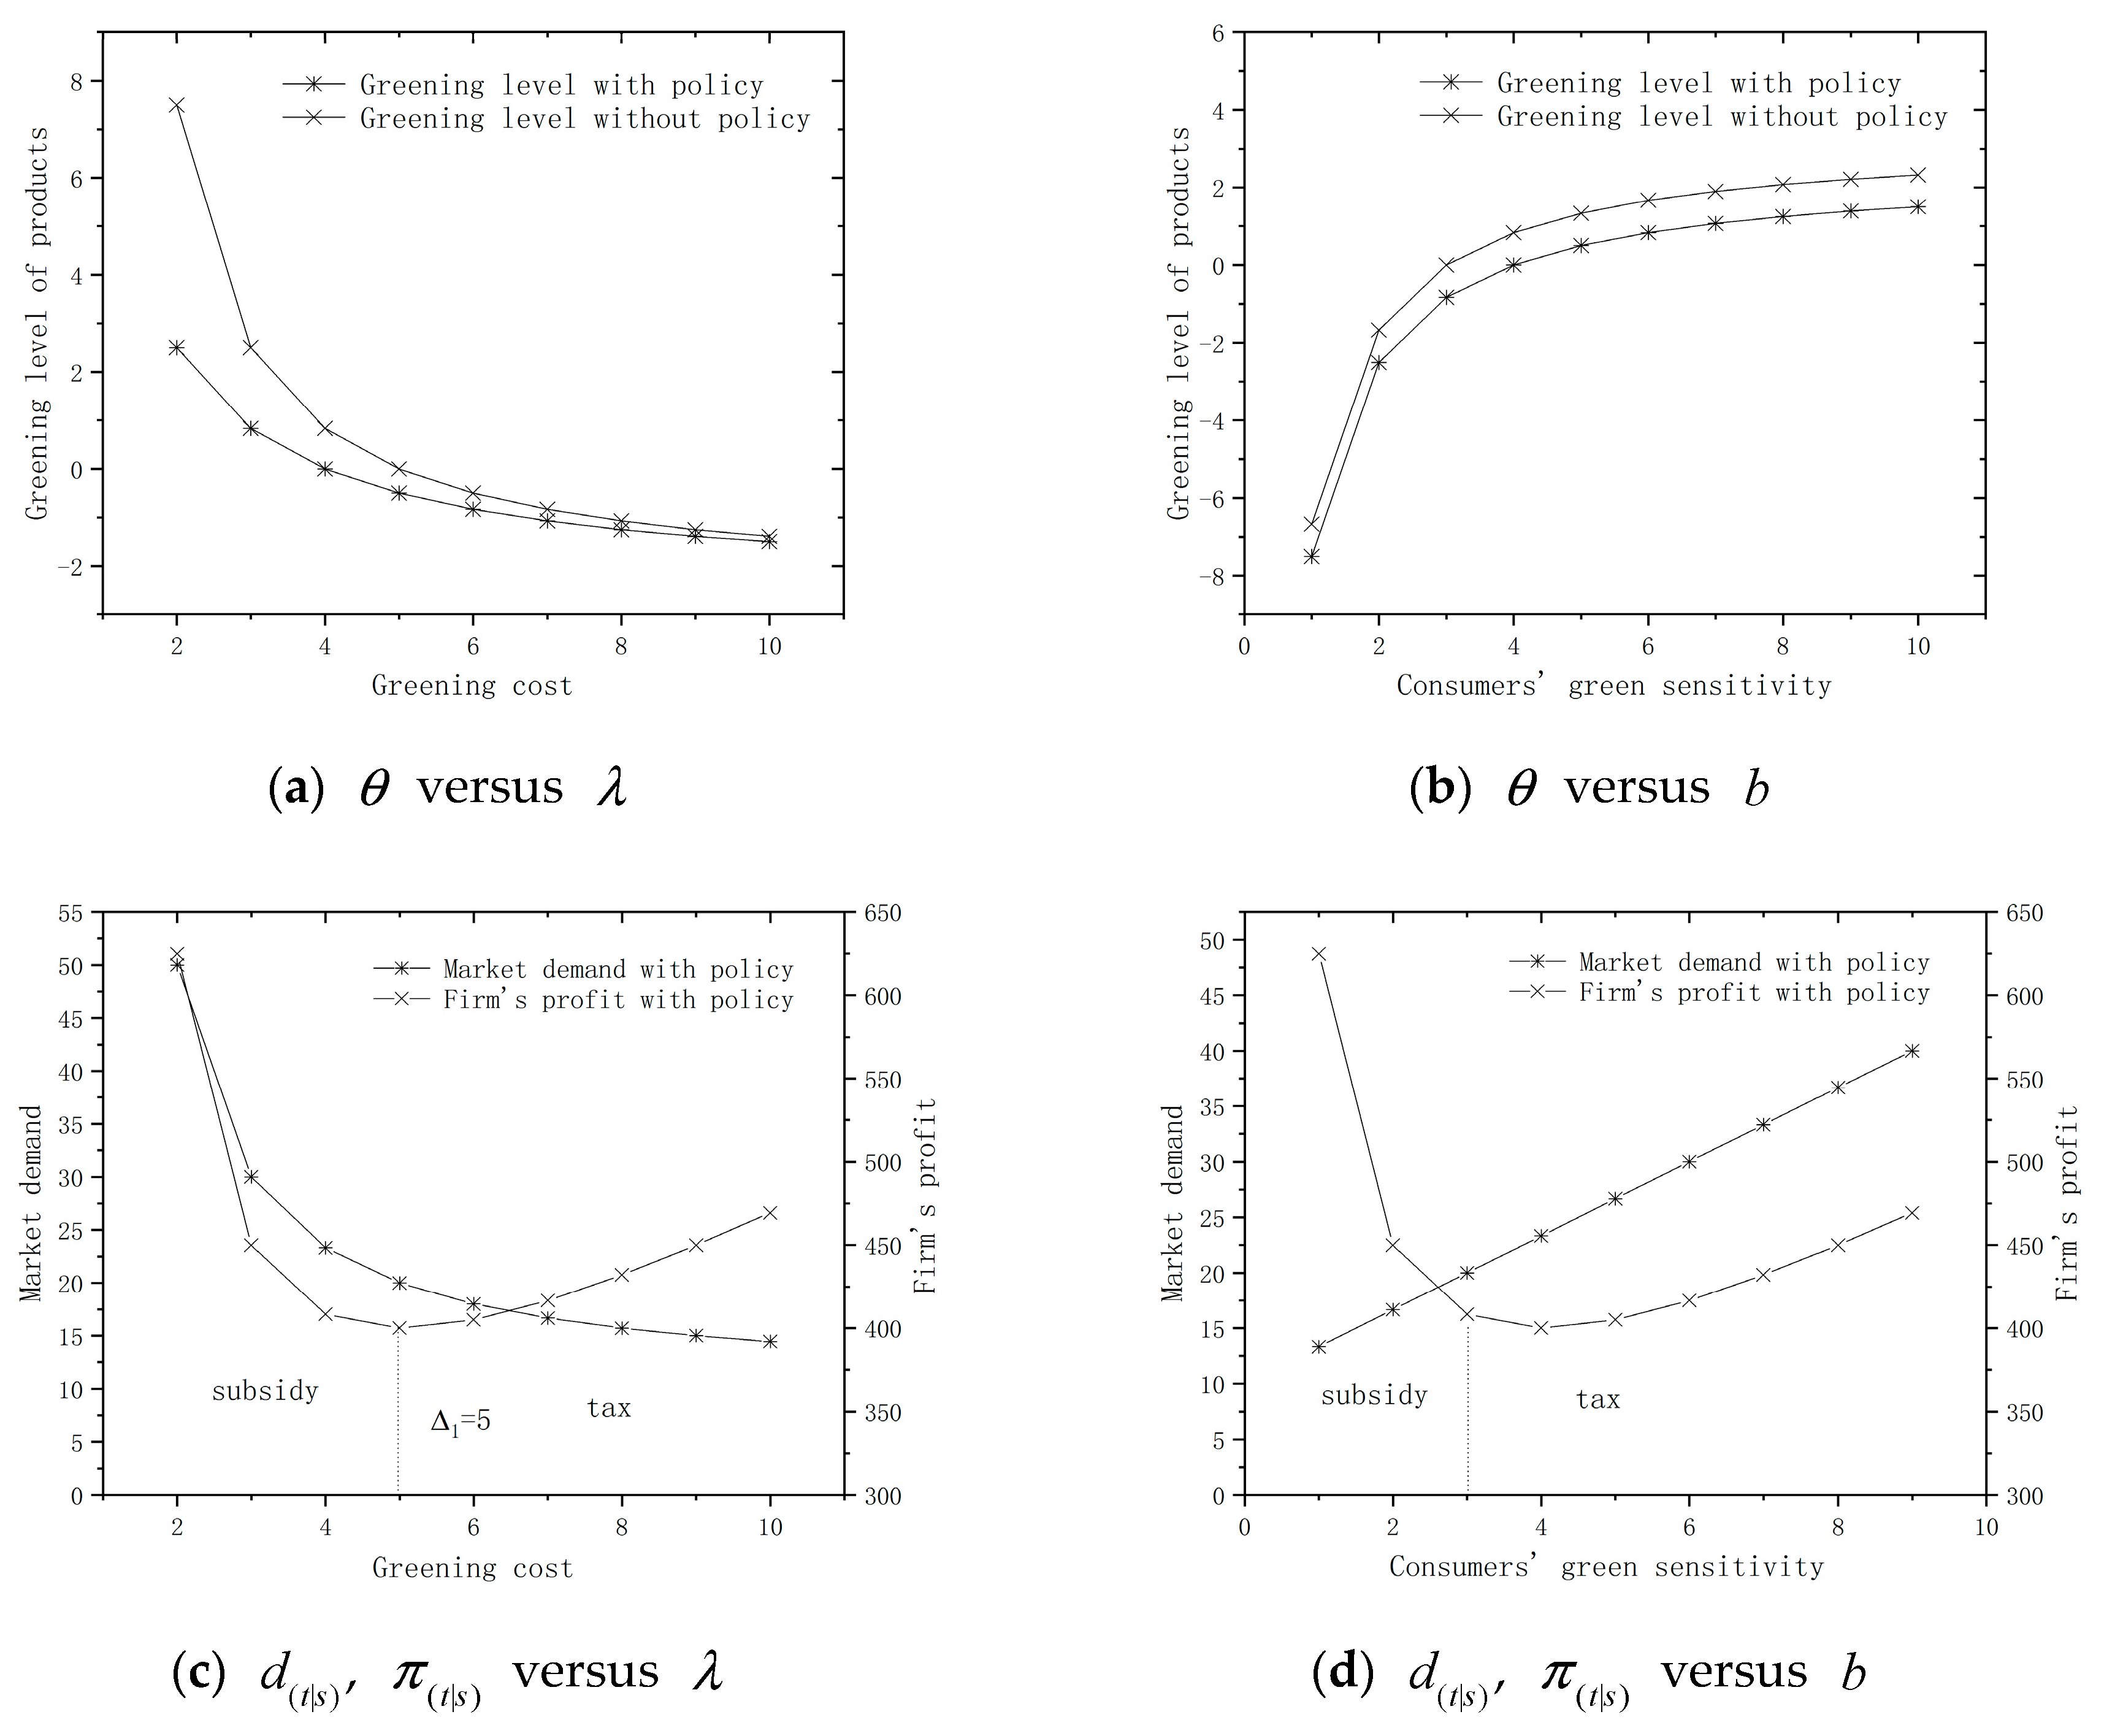
When the cost of greening rises, the firm will take the initiative to reduce the greening level of their products to reduce costs (see Figure 1a). At the same time, due to the existence of government-guided price, greening level of the product declines, resulting in lower product demand, so the production of the firm is also reduced (see Figure 1c). When t < λ < Δ 1 , that is, when the greening level of the firm’s product is higher than the standard set by the government, the government must subsidize the firm. In this case, with the increase of λ , the decrease of revenue and subsidies caused by the decrease of product output is greater than the reduction of cost caused by the decrease of greening level. Therefore, when t < λ < Δ 1 , the profit of the firm is decreasing in greening cost; when λ > Δ 1 , that is, the greening level of the firm’s products is lower than the standard set by the government, the firm must pay tax for their choice. In this case, when λ increases, both demand and the greening level of the product will decrease, resulting in a reduction in tax greater than the reduction in profit. Therefore, when λ > Δ 1 , the profit of the firm increases with the greening cost (see Figure 1c).
When the green-sensitivity of consumers increases, the firm will strive to improve the greening level of their products to cater to the market (see Figure 1b). As the greening level of products increases, so too will market demand and product output (see Figure 1d). When t < λ < Δ 1 , that is, the greening level of products is higher than the standard set by the government, the government must subsidize the firm. In this case, with the increase of b, greater profit and subsidies for higher output outweighs the associated increase in greening costs. Therefore, profit is positively influenced by the increase in consumers’ green-sensitivity. When λ > Δ 1 , that is, the greening level of the firms’ products is lower than the standard set by the government, the firm is penalized with taxes. In this case, when b increases, both demand and the greening level of the product will increase, resulting in increased costs greater than the sum of increase of income and reduction of taxes. Therefore, profit is negatively influenced by the increase in consumers’ green-sensitivity (see Figure 1d).
The analysis above shows the effect of greening costs and consumers’ green-sensitivity to the strategic decisions of the firm. Profitability is deeply affected by the cost of greening. Therefore, the government must help consumers build green awareness so that businesses can benefit from the green market. Whether taxes or subsidies are levied, the aim is to publicize green awareness and encourage consumers to focus on more environmentally friendly products.
Although this analysis proves the influence of greening costs and consumers’ green-sensitivity on business decision-making, it is also of great significance to analyze the role of government policies. In the following section, we assess the enterprise’s optimal outcome in the presence of government policies. This helps to distinguish the impact of government policies on the firm’s decision-making and illustrates the role of government policies in influencing product greening.

3.4. The Impact of Government Policy

In this section, we assess and analyze the optimal outcome for the firm in two situations to analyze the role of government policy, that is, how to implement government policy when demand expansion effect exists. By calculating this, we have obtained the conditions for the government to impose taxes or subsidies on the firm. By analyzing the impact of government policy on consumer surplus and social welfare, we study the influence of government policy in detail and then analyze optimal government policy.
Proposition 2. 
The greenness of products in the presence of government policy is higher than that in the absence of government policy, that is, θ ( t | s ) θ B .
Comparing θ ( t | s ) and θ B , we can come to the conclusion above. Government policy (taxes or subsidies) plays a necessary role in forcing manufacturers to offer greener products than when government policy does not exist (notice that θ ( t | s ) is increasing in t ). The above analysis identifies that with the increase of t , the greening level of products increases. This means that only manufacturers will benefit from green-sensitive markets in the absence of government policy, but additional government policy will result in increased greening levels of products, thereby improving the environment. Therefore, from an environmental perspective, the existence of government policies is necessary. Voluntary measures taken by firms to maximize profits and green conscious consumers needs may promote greening measures, but the existence of government policy can further enhance this.
In the past, government policy has been thoroughly analyzed in associated literature. We next analyze the impact of government policy on consumer surplus and social welfare. Consumer surplus is represented by CS [27]:
C S ( t | s ) = 0 d ( t | s ) p ( x , θ ( t | s ) ) d x p d ( t | s ) = [ b ( p c ) + ( λ t ) ( a γ p ) ] 2 8 γ ( λ t ) 2
where p ( x , θ ( t | s ) ) is the inverse demand function, expressed by a + b θ x γ and x denotes the production output.
Proposition 3. 
Consumer surplus in the presence of government policy is higher than that in the absence of government policy, that is, C S ( t | s ) > C S B .
From the analysis above, although manufacturers may not benefit from government policy, consumer surplus increases after the implementation of government policy. Therefore, leaving aside the environmental perspective, from a consumer perspective, government policy is also necessary.
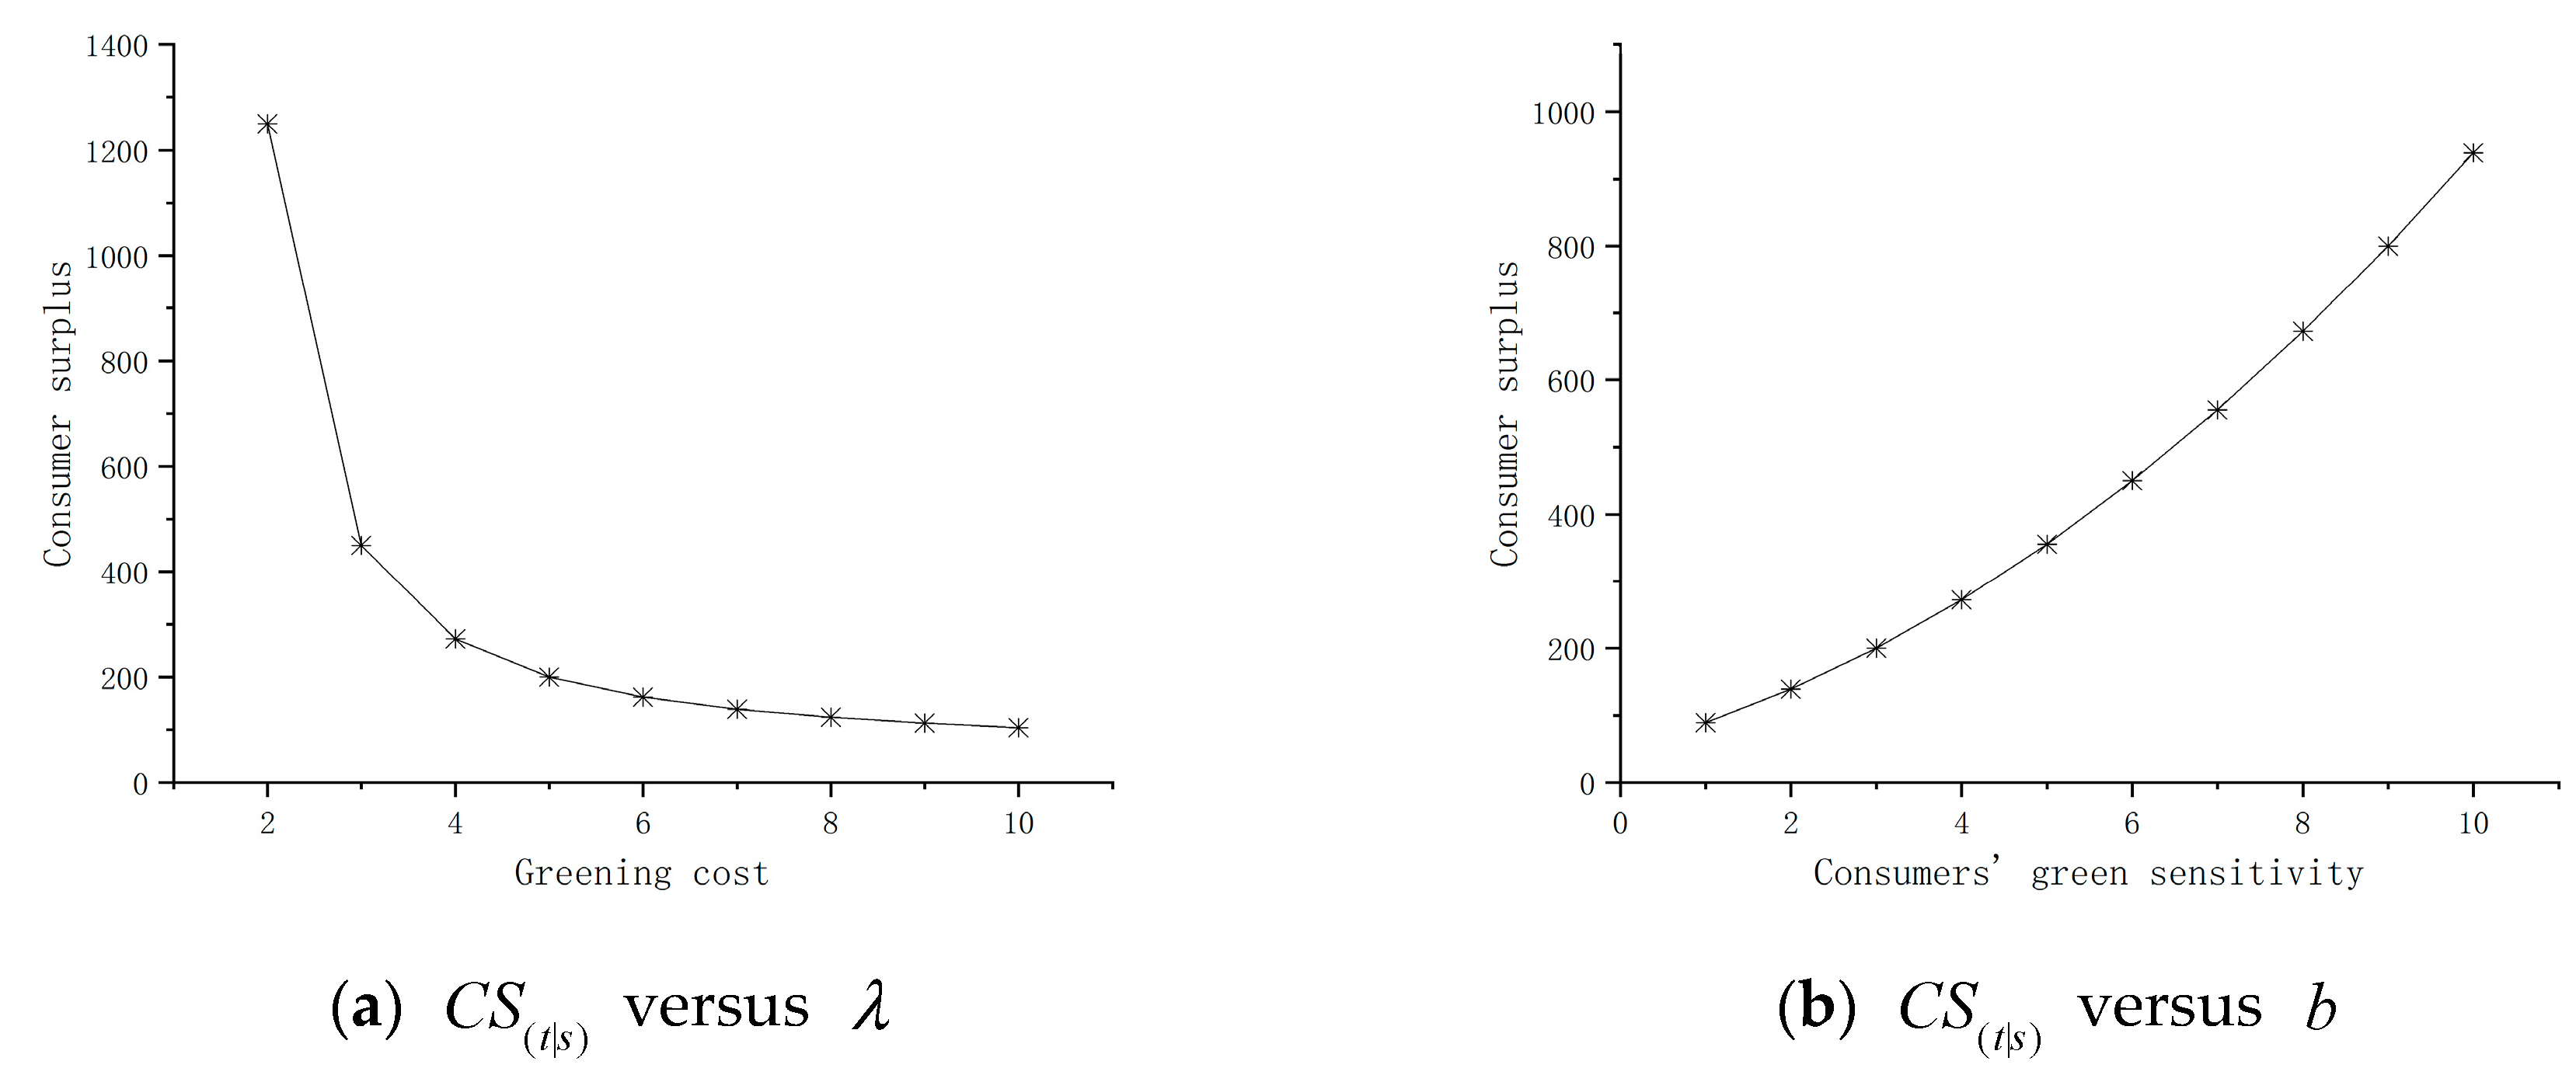
Lemma 2.
Consumer surplus C S ( t | s ) decreases in greening cost λ and increases in consumers’ green sensitivity b .
Figure 2 shows that the increase in greening costs reduces consumer surplus, which poses a major challenge to consumers and the government (see Figure 2a). However, consumers with higher green-sensitivity can alleviate the impact of cost (see Figure 2b). Thus, the government is now focusing on fostering consumers’ green awareness. Previous analysis shows that in the green market, the existence of government carbon emission policies enables firms to provide greener products. Although the government can influence strategic decisions by formulating carbon emission policies to improve greening levels, at the same time, the government should also support firms by cultivating green consumer markets.
The government is concerned with the overall maximization of social welfare (SW). Social welfare comes from a comprehensive consideration of profit, consumer surplus, government revenue and environmental externality [20] expressed as:
S W = π ( t | s ) + C S t θ d + E θ d = [ b ( p c ) + ( λ t ) ( a γ p ) ] 8 b γ ( λ t ) 2 { [ 2 γ ( λ + E 2 t ) + b ] b ( p c ) + [ 2 γ ( λ E ) + b ] ( λ t ) ( a γ p ) }
where E is environmental damage per unit of greening level for each product produced. It is exogenously determined. We suppose that environmental damage is linear and is a function of the difference in greening levels and production.
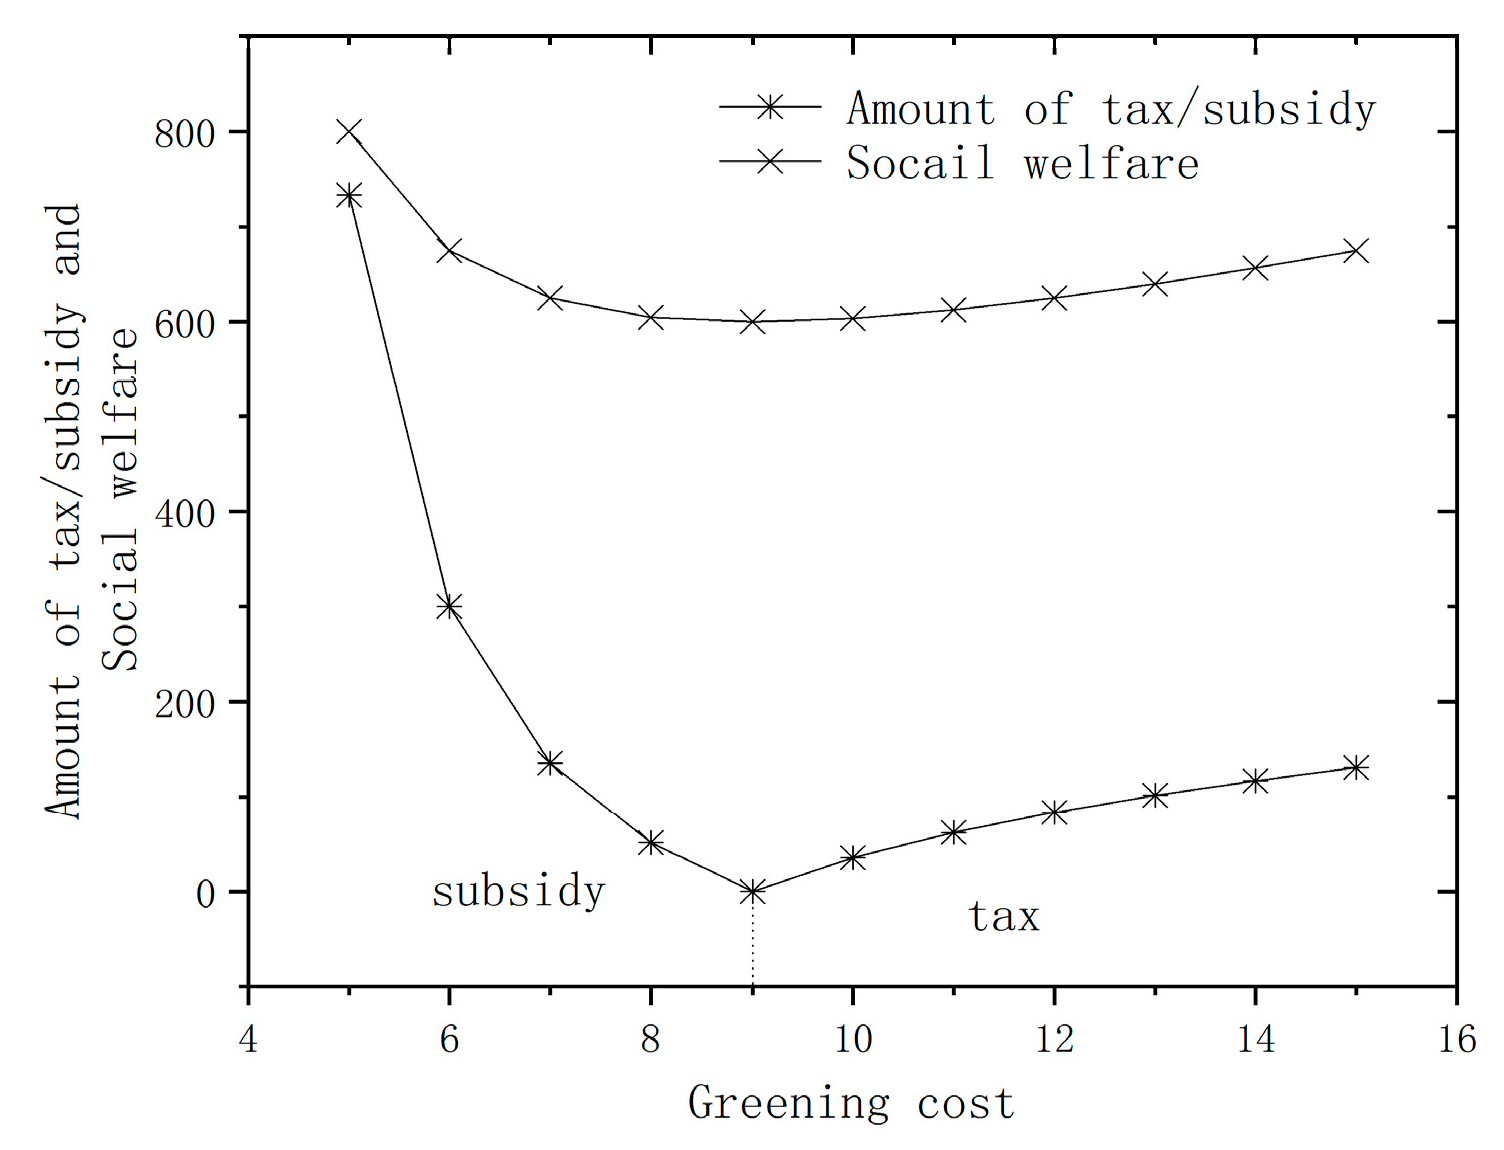
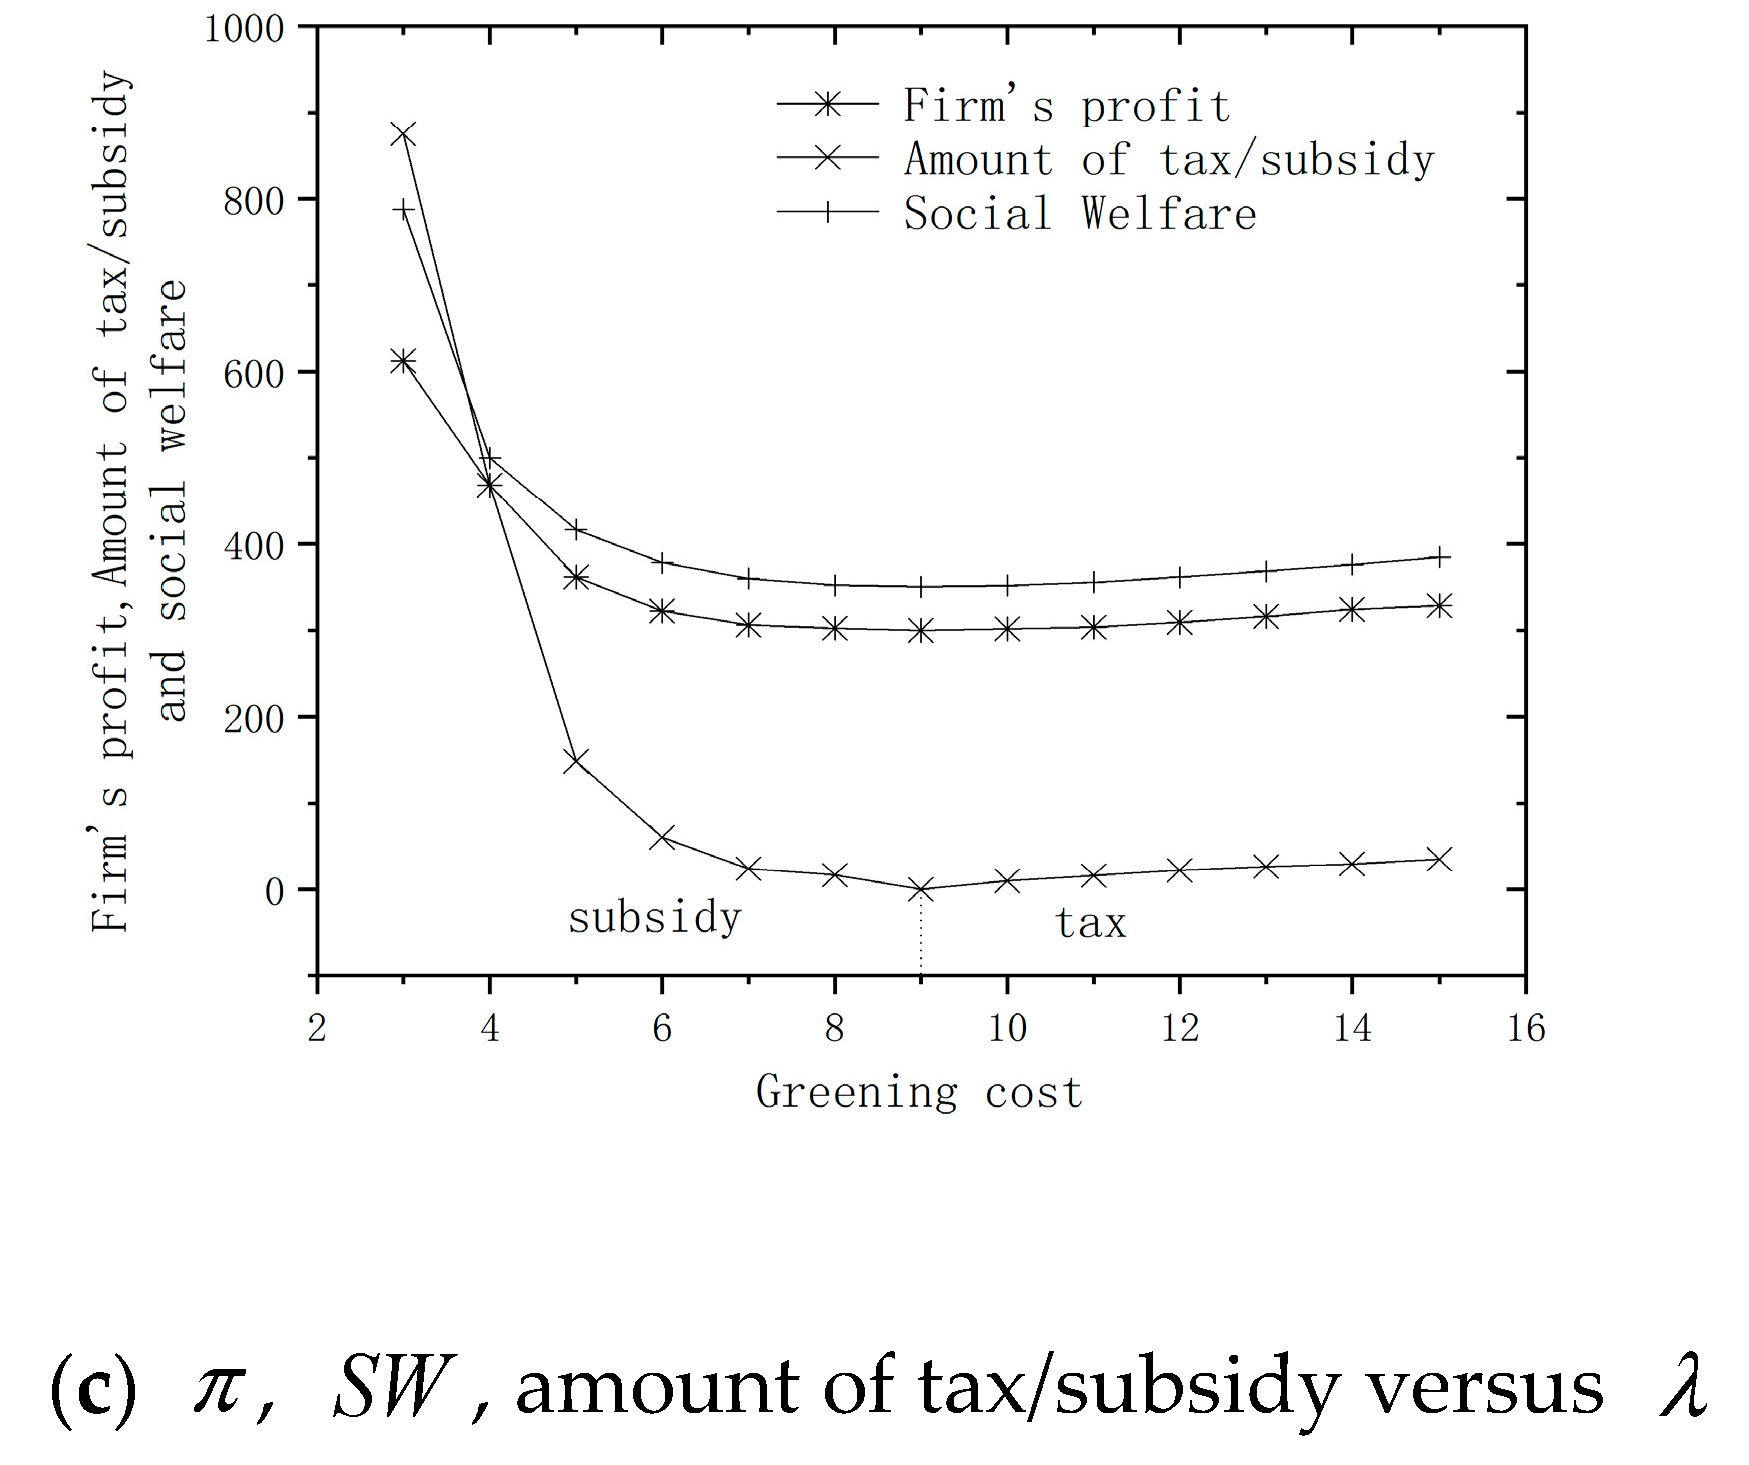
Proposition 4. 
When λ < E + b γ + b ( p c ) a γ p , the government adopts a policy of subsidies; when λ > E + b γ + b ( p c ) a γ p , the government adopts a tax policy.
From Proposition 4, we can see that when the cost of greening λ is low, the cost of improving greening levels is also low. The greening level of products is relatively high. The firm has a strong willingness to produce more and higher greening level products. According to Richard Thaler’s nudge theory [28], the government should subsidize firms that produce green products, and guide and encourage them to meet market demand (see Figure 3). When the cost of greening λ is relatively high, the cost of improving greening levels is also high, so the greening level of products is low and market demand is limited. This creates a problem for the government. Therefore, the government should punish firms by implementing tax policy, warn them and guide them to increase investment in green technology research, carry out technological innovation and strive to reduce greening costs.
Corollary 1. 
When b > ( a γ p ) + γ ( p c ) γ ( a γ p ) ( λ E ) , the government adopts a subsidy policy; when b < ( a γ p ) + γ ( p c ) γ ( a γ p ) ( λ E ) , the government adopts a tax policy.
This conclusion can be deduced from the condition of Proposition 4. It can be seen from Corollary 1 that when consumers’ green-sensitivity b is relatively limited, the greening level of products has little influence on demand, so firms will produce products with lower greening levels, because, as Lemma 1 shows, improving the greening level of products will not increase profits. The government should adopt tax policies to punish firms for adopting low greening levels, make them aware of the importance of improving the greening level of products and guide the firm to produce greener products. When consumers are more sensitive to greening levels, there is a greater impact on demand, so the firm will produce products with higher greening levels to achieve higher profits. In this case, the government should reward firms, subsidize the cost of improving the greening level of products, develop positive models and encourage firms to produce greener products.
Corollary 2. 
When E < λ b γ b ( p c ) a γ p , the government adopts a subsidy policy; when E > λ b γ b ( p c ) a γ p , the government adopts a tax policy.
This conclusion can also be deduced from the condition of Proposition 4. It can be concluded from Corollary 2 that when environmental sensitivity is low, the difference in greening levels per product will cause less damage to the environment. If the firm produces products with lower greening levels, the impact on the environment will be relatively small. The government should implement tax policies to prevent firms from profiteering by producing products with low greening levels. When environmental sensitivity is relatively large, the difference in greening levels per product will cause greater environmental harm. Therefore, from an environmental protection perspective, the government hopes firms will produce greener products. In this case, the government should implement policies to subsidize investment in greening to encourage firms to produce greener products.

4. Model Extensions

We have analyzed and concluded on a series of situations in which the firm must decide the greening level of their products where price is exogenous. When the price of green products is endogenous, that is, when the firm makes decisions on greening and price, does the conclusion drawn above still hold?
Now the objective of the firm is
M a x   π ( p , θ ) = [ p ( c + λ θ ) + t θ ] d = [ p ( c + λ θ ) + t θ ] ( a + b θ γ p )
Proposition 5. 
There is no optimal analytic solution to the case when the enterprise makes a decision on price and greening levels.
As evidenced in this calculation, price and greening level decision-making optimization cannot be modelled together for a number of reasons. For instance, numerical conditions relating to government decisions are unavailable, thus, we use simulations to analyze the problem. The structure is M a x   π ( p , θ | t ) , given p , t , then we can get θ * ( p , t ) . Substituting θ * ( p , t ) to the objective function, M a x   π ( p , θ | t ) = M a x   π ( p , θ * ( p , t ) | t ) . The optimal solution is p * ( t ) , θ * ( p * ( t ) , t ) . Similarly, substituting p * ( t ) , θ * ( p * ( t ) , t ) to the S W , we can get the optimal t * from M a x   S W ( t ) , thus p * = p * ( t * ) , θ * = θ * ( p * ( t * ) , t * ) . So π * , the amount of tax/subsidy, S W * is obtained accordingly. The results are shown in Figure 4.
As can be seen from Figure 4, with the increase of λ , the cost of improving the greening of products also increases, meaning enterprises will lower the greening level of their products to reduce costs. At the same time, the effect of product prices on profit is more obvious; businesses set prices as high as possible within the scope of government regulations. These two factors lead to reduced demand (see Figure 4a). When greening costs rise, the government will increase t . When the greening level of the enterprise meets government standards, subsidies will be increased to encourage continuous improvement to the level of greening of products. When the greening level of products does not comply with standards, government policy is to impose taxes. The government will raise taxes, t , to increase the cost of lowering greening levels to the enterprise, thus preventing it from lowering the greening level of its products (see Figure 4b).
When greening cost increases, the enterprise will reduce the greening level of its products. When it drops by a certain amount, it becomes lower than the standard set by the government, meaning subsidy is replaced with tax. When government policy is to subsidize and greening cost increases, the enterprise will reduce greening and set higher prices for higher profit, resulting in lower demand and production. Government subsidies are reduced and profit decreases. Simultaneously, the greening level of the product is reduced, resulting in a lower consumer surplus and environmental externalities, leading to lower social welfare (see Figure 4c). When government policy is to tax and greening cost increases, similar to subsidy policy, the manufacturer will lower the greening level of its products so it will cost less and lead to high profits. In this case, the consumer surplus and environmental externality decreases while the manufacturer’s profits and the tax revenues increase, leading to an increase in overall social welfare.

5. Conclusions

In this paper, we have investigated the government policy from a supply chain perspective. Specifically, we consider a Stackelberg game with the government policy maker being the leader, and the downstream manufacturer being the follower. Given the government policy (tax or subsidy) and its corresponding scale, the manufacturer decides the greenness of the product (or equivalently the greening level of technology), taking into account consumer’s consciousness regarding the greenness of the product (we assume that consumers prefer environmentally friendly products in general). In anticipation of the manufacturer’s possible responses to different policies, the government policy-makers decide which policy should be taken. We find that the tax policy is preferred by the government if consumers are very sensitive to the greenness, or the cost of greening is high, or the negative impact due to carbon emission is large; otherwise the government should subsidize the firm. These insights can be carried over to the situation when the selling price is endogenously determined by the manufacturers, illustrated by our numerical study.
Based on our study, we found that the government should carefully design and implement the carbon emission reduction policy. In general, there is no one-size-fit-all panacea. The policy (tax, subsidy or mix) depends on the advancement of technology, the magnitude of the negative consequences taken by carbon emission and consumers’ attitude to environment protection. To encourage the adoption of green technology, possible mechanisms should also include: Green Public Procurement (GPP), joint R&D activities and support for inter-firm cooperation in design and development of green products. In addition, our study shows that the consumers’ consciousness on the environment friendliness of products could play an important role in the government policy selection. As a result, the government tool kit for carbon emission reduction should include how to cultivate the people’s consciousness on green products and environment production.
Several future directions are worth exploring. The demand function we consider is deterministic, which applies in a long-term horizon. However, as products are upgraded in a fast speed nowadays, it is worth considering the demand uncertainty on the decisions involved in the supply chain. The cost function in our model setting is of linear format. It is quite challenging to consider other, more general formats (e.g., convex), and to investigate the optimal government policy in depth. We primarily considered the effect of policy on the manufacturer’s side. Therefore, possible extensions also include investigating the optimal policy on consumers’ side.

Author Contributions

Methodology, X.X.; validation, X.C., X.X. and L.Z.; formal analysis, X.C.; writing—original draft preparation, X.Y.; writing—review and editing, L.Z.; visualization, X.Y.; supervision, X.X. All authors have read and agreed to the published version of the manuscript.

Funding

This research was funded by National Science Foundation of China (Nos.71871114, 71471085, 71732003), the Leading Talent Program of Guangdong Province (No. 2016LJ06D703) and the Science and Technology Development Fund, Macau SAR (File no. FDCT/027/2016/A1).

Conflicts of Interest

The authors declare no conflict of interest.

Appendix A

Proof of Proposition 1. 
The second order conditions with respect to (w.r.t) θ is given by d 2 π ( t | s ) ( θ ) d θ 2 = 2 b ( t λ ) < 0 , which implies the firm’s profit function is concave in θ . Thus, according to the first order condition, we get,
θ ( t | s ) = b ( p c ) ( λ t ) ( a γ p ) 2 b ( λ t ) { < 0 , λ > Δ 1 0 , t < λ Δ 1
where Δ 1 = t + b ( p c ) ( a γ p ) . □
Proof of Lemma 1. 
The derivatives of θ ( t | s ) w.r.t λ and b are θ ( t | s ) λ = p c 2 ( λ t ) 2 < 0 and θ ( t | s ) b = a γ p 2 b 2 > 0 , respectively. Similarly, the derivatives of d ( t | s ) w.r.t λ and b are d ( t | s ) λ = p c 2 ( λ t ) 2 < 0 , d ( t | s ) b = p c 2 ( λ t ) > 0 .
Further, taking the partial derivatives of π ( t | s ) w.r.t λ and b , we have π ( t | s ) λ = [ ( a γ p ) ( λ t ) + b ( p c ) ] [ ( a γ p ) ( λ t ) b ( p c ) ] 4 b ( λ t ) 2 { > 0 , λ > Δ 1 < 0 , t < λ Δ 1 , π ( t | s ) b = [ ( a γ p ) ( λ t ) + b ( p c ) ] [ b ( p c ) ( a γ p ) ( λ t ) ] 4 b ( λ t ) 2 { < 0 , λ > Δ 1 > 0 , t < λ Δ 1 . □
Proof of Proposition 3. 
C S ( t | s ) = 0 d ( t | s ) p ( x , θ ( t | s ) ) d x p d ( t | s ) = [ b ( p c ) + ( λ t ) ( a γ p ) ] 2 8 γ ( λ t ) 2 , C S B = 0 d B p ( x , θ B ) d x p d B = [ b ( p c ) + λ ( a γ p ) ] 2 8 γ λ 2 .
Comparatively, we can see C S ( t | s ) > C S B . □
Proof of Lemma 2. 
The derivative of C S ( t | s ) w.r.t λ gives C S ( t | s ) λ = [ b ( p c ) + ( λ t ) ( a γ p ) ] b ( p c ) 4 γ ( λ t ) 3 < 0 . Similarly, the derivative of C S ( t | s ) w.r.t b gives C S ( t | s ) b = [ b ( p c ) + ( λ t ) ( a γ p ) ] ( p c ) 4 γ ( λ t ) 3 > 0 . □
Proof of Proposition 4. 
Let d S W d t = { [ 4 γ ( p c ) + 2 ( a γ p ) ] t + ( 4 γ E + 2 b ) ( p c ) + 2 λ ( a γ p ) } b 2 ( p c ) 8 b γ ( λ t ) 3 = 0 . Thus, we have t * = ( 2 γ E + b ) ( p c ) + λ ( a γ p ) 2 γ ( p c ) + ( a γ p ) . When 2 b ( 2 γ λ 2 γ E b ) < 0 , that is λ < E + b 2 γ , we have d S W d t > 0 , which implies S W is increasing in t . As a result, the government should implement the subsidy policy and put all the subsidy budgets into the firm to achieve the overall maximization of social welfare. □
In contrast, if λ > E + b 2 γ , S W increases first and then decreases with respect to t. Therefore, there exists t = t * so that S W reaches its maximum value S W ( t * ) = γ [ ( λ E ) ( a γ p ) + b ( p c ) ] 2 2 b [ 2 γ ( λ E ) b ] . If θ ( t | s ) > 0 we have E + b 2 γ < λ < E + b γ + b ( p c ) a γ p , which means the government should adopt subsidy policy; In contrast, if θ ( t | s ) < 0 , we have λ > E + b γ + b ( p c ) a γ p , which implies the government should adopt tax policy.
To sum up, the government should adopt subsidy policy when λ < E + b γ + b ( p c ) a γ p and tax policy when λ > E + b γ + b ( p c ) a γ p .
Proof of Proposition 5. 
Taking the second order derivatives of the profit function, we have 2 π ( p , θ ) θ 2 = 2 b λ , 2 π ( p , θ ) θ p = 2 π ( p , θ ) p θ = b + γ λ , 2 π ( p , θ ) p 2 = 2 γ .
As a result, the determinant of Hessian matrix is | 2 b λ b + γ λ b + γ λ 2 γ | = ( b γ λ ) 2 < 0 , and hence the optimal value condition is not satisfied. □

References

  1. Sohu. Beijing Enterprise Build Circular Economy Park in Jingtang Port. 2017. Available online: http://www.sohu.com/a/210602023_200899 (accessed on 22 January 2020).
  2. Xinhua. China’s Carbon Trading Deals Reach Nearly 7 Bln Yuan. 2019. Available online: http://www.xinhuanet.com/english/2019-06/19/c_138156566.htm (accessed on 22 January 2020).
  3. China Daily. Organic Vegetables with ‘Gossip’ are Still Sought, the Key is Safety and Health. 2018. Available online: http://caijing.chinadaily.com.cn/chanye/2018-05/24/content.36262275 (accessed on 22 January 2020).
  4. Bemporad, R.; Baranowski, M. Conscious consumers are changing the rules of marketing. Are you ready? In Highlights BBMG Conscious Consum Rep; BBMG: New York, NY, USA, 2007. [Google Scholar]
  5. Cohen, M.C.; Lobel, R.; Perakis, G. The Impact of Demand Uncertainty on Consumer Subsidies for Green Technology Adoption. Manag. Sci. 2016, 62, 1235–1258. [Google Scholar] [CrossRef]
  6. China Daily. What Changes will Happen to the Automotive Industry under the New Energy Vehicle Subsidy Policy? 2018. Available online: http://che.chinadaily.com.cn/2018-11/26/content_37315201.htm (accessed on 22 January 2020).
  7. China Daily. A New Round of Brand Shuffling and Acceleration of New Energy Vehicles. 2019. Available online: https://cnews.chinadaily.com.cn/a/201906/27/WS5d1435c4a3108375f8f2ccaa.html (accessed on 22 January 2020).
  8. Sutter, J.D. There’s A Cheap, Proven Fix to the World’s Biggest Problem. 2016. Available online: https://edition.cnn.com/2016/04/19/opinions/sutter-carbon-tax-washington-british-columbia/index.html (accessed on 22 January 2020).
  9. Bei, L.T.; Simpson, E.M. The determinants of consumers purchase decision for recycled products: An application of acquisition-transaction utility theory. Consum. Res. 1995, 22, 257–261. [Google Scholar]
  10. Chen, C. Design for the environment: A quality-based model for green product development. Manag. Sci. 2001, 47, 250–263. [Google Scholar] [CrossRef]
  11. Ghosh, D.; Shah, J. A comparative analysis of greening policies across supply chain structures. Int. J. Prod. Econ. 2012, 135, 568–583. [Google Scholar] [CrossRef]
  12. Nduneseokwu, K.C.; Qu, Y.; Appolloni, A. Factors Influencing Consumers’ Intentions to Participate in a Formal E-Waste Collection System: A Case Study of Onitsha, Nigeria. Sustainability 2017, 9, 881. [Google Scholar] [CrossRef] [Green Version]
  13. Appolloni, A.; Sun, H.; Fu, J.; Li, X. Green Procurement in the Private Sector: A State of the Art Review between 1996 and 2013. J. Clean. Prod. 2014, 85, 122–133. [Google Scholar] [CrossRef]
  14. Zhang, J.J.; Nie, T.F.; Du, S.F. Optimal emission-dependent production policy with stochastic demand. Int. J. Syst. Sci. 2011, 3, 21–39. [Google Scholar] [CrossRef]
  15. Swami, S.; Shah, J. Channel coordination in green supply chain management. J. Oper. Res. Soc. 2012, 64, 336–351. [Google Scholar] [CrossRef]
  16. Ren, J.; Bian, Y.; Xu, X.; He, P. Allocation of product-related carbon emission abatement target in a make-to-order supply chain. Comput. Ind. Eng. 2015, 80, 181–194. [Google Scholar] [CrossRef]
  17. Ghosh, D.; Shah, J.; Swami, S. Product greening and pricing strategies of firms under green sensitive consumer demand and environmental regulations. Ann. Oper. Res. 2018. [Google Scholar] [CrossRef]
  18. Atasu, A.; Guide, V.D.R.; Wassenhove, L.N. Product reuse economics in closed-loop supply chain research. Prod. Oper. Manag. 2008, 17, 483–496. [Google Scholar] [CrossRef]
  19. Mitra, S.; Webster, C. Competition in remanufacturing and the effect of government subsidies. Int. J. Prod. Econ. 2008, 111, 287–298. [Google Scholar] [CrossRef]
  20. Barnett, A.J. The Pigouvian tax rule under monopoly. Am. Econ. Rev. 1980, 70, 1037–1041. [Google Scholar]
  21. Gouda, S.K.; Jonnalagedda, S.; Saranga, H. Design for the environment: Impact of regulatory policies on product development. Eur. J. Oper. Res. 2015, 248, 558–570. [Google Scholar] [CrossRef]
  22. Krass, D.; Nedorezov, T.; Ovchinnikov, A. Environmrntal Taxes and the Choice of Green Technology. Prod. Oper. Manag. 2013, 22, 1035–1055. [Google Scholar]
  23. Yu, J.Y.; Christopher, S.T.; Shen, Z.J. Improving Consumer Welfare and Manufacturer Profit via Government Subsidy Programs: Subsidizing Consumers or Manufacturers? Manuf. Serv. Op. 2018, 20, 752–766. [Google Scholar] [CrossRef]
  24. Qu, Y.; Yu, Y.; Appolloni, A.; Li, M.; Yue, L.Y. Measuring Green Growth Efficiency for Chinese Manufacturing Industries. Sustainability 2017, 9, 637. [Google Scholar] [CrossRef] [Green Version]
  25. Cheng, W.; Appolloni, A.; D’Amato, A.; Zhu, Q. Green Public Procurement, Missing Concepts and Future Trends – A Critical Review. J. Clean. Prod. 2017, 176, 770–784. [Google Scholar] [CrossRef]
  26. Rizzi, F.; Frey, M.; Testa, F.; Appolloni, A. Environmental value chain in green SME networks: The threat of the Abilene paradox. J. Clean. Prod. 2014, 265, 265–275. [Google Scholar] [CrossRef]
  27. Spence, A. Monopoly, Quality, and Regulation. Bell. J. Econ. 1975, 6, 417–429. [Google Scholar] [CrossRef]
  28. Thaler, R.H. Nudge; PHAIDON PRESS: New, York, NY, USA, 2009. [Google Scholar]
Figure 1. Optimal value of θ , d ( t | s ) , π ( t | s ) versus λ , b .
Sustainability 12 01548 g001
Figure 2. Optimal value of consumer surplus C S ( t | s ) versus λ , b .
Sustainability 12 01548 g002
Figure 3. Optimal value of social welfare S W versus λ .
Sustainability 12 01548 g003
Figure 4. Optimal values versus λ .
Sustainability 12 01548 g004aSustainability 12 01548 g004b

