Article

Household Food Waste: A Case Study in Southern Italy

Department of Economic and Legal Studies, University of Naples Parthenope, 80133 Naples, Italy
*
Author to whom correspondence should be addressed.
Sustainability 2020, 12(4), 1495; https://doi.org/10.3390/su12041495
Submission received: 29 January 2020 / Revised: 11 February 2020 / Accepted: 14 February 2020 / Published: 17 February 2020

Abstract

:
To achieve the goal of reducing consumer-related food waste in developed countries, it is necessary to have an in-depth understanding of the factors shaping food waste, both in the household as well as at the point of purchase. Despite a growing number of studies on the subject, especially in recent years, the evidence on drivers of food waste and barriers to its reduction is somewhat conflicting. The current paper contributes to existing knowledge on food waste behaviour at the consumer level, providing original results from a direct survey conducted with a sample randomly selected in southern Italy to reveal consumer awareness, concerns and intentions towards food waste and to ascertain the existence of different consumer profiles with similar food waste behaviour. Since southern Italian regions have been shown to produce lower levels of food waste than regions in northern Italy, an in-depth analysis of the drivers behind food waste in this area could be considered an interesting case study. Our findings showed the existence of several consumer behaviour profiles that influenced household food waste generation. Strategies to reduce waste should take such differences into account in order to promote changes in food waste behaviour.

1. Introduction

The aim of Goal 12 of the United Nations (UN) 2030 Agenda for Sustainable Development is to “ensure sustainable consumption and production patterns”. Its stated targets are to "halve per capita global food waste at the retail and consumer level, and reduce food losses along production and supply chains by 2030” (United Nation, 2015) [1]. Reducing food waste has also been included within the European strategy for the Circular Economy, and ambitious objectives have been assigned to member states [2].
In the European Union, around 88 million tonnes of food waste are produced annually, with associated costs estimated at €143 billion [3]. According to Canali et al., food waste represents a multidimensional issue interconnected across all stages of the food supply chain, from primary production to final consumption [4]. It is possible to identify three different contexts that represent potential food waste sources: (a) technological; (b) institutional, related to organisational factors such as business management or legislation and policy; and (c) social, connected to consumers’ lifestyles and behaviours [4,5]. Even if food waste occurs in these three main contexts and along all steps of the food supply chain, in developed countries, private households have been identified as key actors in food waste generation and a priority segment towards which policy interventions should be addressed in order to reduce food waste [4,5]. Indeed, in Europe, households represent the supply chain segment contributing the most to food waste, accounting for 47 million tonnes or the equivalent of 92 kg per person per year [3]. It has been shown that the complex causes of consumer food waste at the household level make it difficult for commercial actors as well as policy makers to develop effective food waste reduction campaigns [6].
In order to reduce food waste in developed countries, it is necessary to gain an in-depth understanding of the factors determining food waste at the consumer level, both in the household as well as at the point of purchase. Identified social drivers connected to consumer behaviour and lifestyles are related to (a) unconscious preferences, such as preferences for certain aesthetic standards or food types, that can be difficult to modify; (b) individual behaviour that may be modifiable through information and strengthened awareness; and (c) sociodemographic factors [3,4,7].
Regarding individual behaviour, consumers’ routines related to shopping and consumption constitute one of the main drivers of food waste, such as food overprovisioning during shopping, overpreparation and incorrect storage [8]. Among the causes identified for overprovisioning, the literature includes bulk purchases but also marketing and sales strategies implemented by producers and retailers [7,9]. Extensive research shows that communication strategies as well as promotional offers have a considerable negative effect on individual wasteful behaviour, prompting consumers to buy more than actually needed [5,10,11,12]. Other studies have highlighted that individual wasteful behaviour is also driven by factors related to current legislation or policy. Misinterpretation of date labels, for example, or lack of understanding and following labelling instructions for proper storage are recognised as prominent drivers [4,5]. Previous studies showed that European consumers seem to be very confused and show difficulty in interpreting the actual meaning of the expiration date and the date of minimum durability (as required by Regulation 1169/2001/EU) [7,13,14,15].
By contrast, planning food shopping with a shopping list or checking existing provisions before shopping may contribute to lowering the amount of food wasted [16] as well as the use of leftovers [8,17]. However, the literature highlights the existence of several factors limiting this practice linked to consumers’ risk perception about leftovers safety or lack of knowledge on how to reuse it [18,19].
Another stream of the literature highlights the central role of concerns in influencing wasteful behaviour. Some authors highlight the role of personal concerns (i.e., concerns with saving money and time) as a stronger motivation to reduce food waste [20,21]. Others rank concerns related to environmental as well as social impacts of food waste as prominent drivers [8,11,12,22].
Studies by Stefan et al. [16] and Visschers at al. [23] also found that a higher intention to reduce food waste is significantly related to a lower amount of food waste produced. However, intention may not lead to the actual behaviour due to a lack of control, which is linked, for example, to other family members’ behaviour [24].
Regarding sociodemographic characteristics, several studies found that younger consumers tend to waste more food than older consumers [8,17,23] and that women generate a lower level of food waste than men [17,18]. Furthermore, research underlines that a lower level of education corresponds to a smaller quantity of food waste, assuming that people with a higher level of education are more likely to have a higher level of income and thus tend to spend and waste more [18]. Other studies indicate that food wastage is higher among employed individuals than unemployed [17,18]. Finally, the literature proves that the amount of food waste increases with the number of occupants in a household [25,26] and that households with more children produce more food waste [7,25].
So, according to the existing literature, food waste is the result of multiple, interacting consumer-related factors [7,27]. This makes food waste analysis particularly interesting at the consumer level, as there are great opportunities to reduce and prevent such waste [28]. In addition, profiling consumers can help to better understand what kinds of policies and tools could be used to stimulate behavioural changes [29]. Even though numerous studies have been carried out in recent years, there are still several knowledge gaps with respect to drivers of food waste and barriers to its reduction [7,10].
Based on the above consideration, the current paper contributes to existing knowledge on food waste behaviour at the consumer level, providing original results from a direct survey conducted in southern Italy. The objective of the present research was twofold: (i) to gain insight into consumer awareness, concerns and intentions regarding food waste; (ii) to ascertain the existence of different consumer profiles with similar food waste behaviour. Profiling consumers can help to better understand what kinds of policies and tools could be employed to stimulate behavioural changes [29].
Compared with the recent research carried out in Italy [10,15,28,29], this paper presents original in-depth contributions regarding the geographical area considered and the methodology chosen. Since southern Italian regions, according to previous studies [30], have been shown to produce lower levels of food waste than regions in northern Italy, an in-depth analysis of the drivers behind food waste in this area could be considered an interesting case study.

2. Materials and Method

2.1. Questionnaire Design and Data Collection

In order to collect data, a structured questionnaire survey was designed, tested and distributed via computer-assisted web interviewing. The questionnaire was divided into five sections: (a) food-related behaviour, (b) awareness and concerns about food waste, (c) self-reported food waste amount and food waste frequency, (d) motivations that drive food waste behaviour, (e) intentions and motivations to prevent and reduce FW and (f) sociodemographic and household characteristics.
For the measurement of food-related behaviours, 15 statements from the Food-Related Lifestyle Questionnaire [31] related to shopping and consumption behaviour were selected. Participants had to indicate their level of agreement with each statement on a Likert scale ranging from 1 = totally disagree to 5 = totally agree. In order to measure consumers’ awareness and concerns about food waste, the second section of the questionnaire started with a brief definition of food waste such as “all food and drink which at some point prior to being thrown away was edible (e.g., slices of bread, apples, cooked food)”. Then, respondents were asked to indicate their self-reported degree of awareness about this problem and their level of concern on a six-item scale related to environmental, social and economic impacts of FW previously used in the literature [8,11,12]. Participants had to indicate their level of concern about each item on a Likert scale ranging from 1 = not at all concerned to 5 = very concerned. The third section of the questionnaire included questions and scales concerning the frequency of food waste behaviour, motivations that drive FW behaviour [28], food categories most wasted and the percentage of FW weekly produced, measured using a four-item scale from less than 10% to 50%. Respondents’ intentions to reduce FW and motivations to prevent FW were measured respectively using two scales from previous research [8,16]. Participants had to indicate their level of agreement with each item on a Likert scale ranging from 1 = totally disagree to 5 = totally agree. The final section included questions related to sociodemographic and household characteristics. The internal consistency and reliability of the scales used were measured with Cronbach’s alpha coefficients. The items of scale used and Cronbach’s alpha coefficients are reported in the results section.
The questionnaire was pretested on a pilot sample of 30 individuals and minor changes were made. Data collection was conducted between January 2019 and March 2019 in the southern Italian region of Campania (Figure A1, Appendix A). According to the Italian National Institute of Statistics official data (2018), the population of the Campania Region consists of 5,801,692 inhabitants, ranking third among the most populous regions nationwide. Women constitute 51.2% of the population, the mean age is 42.2 years and the average family size is 2.65 members [32].
The sample was randomly selected and individuals participated on a voluntary basis. Participants had to be responsible for their household food shopping, living in the Campania Region and aged between 18 and 70 years. Survey participation was advertised via social networks, blogs, email and word of mouth. In all, 420 responses to the survey were received, but 108 were discarded due to their incompleteness. Therefore, the final sample consisted of 312 respondents. Although the sample was self-selected, it reflected the composition of the regional population in terms of mean age, gender and household size.

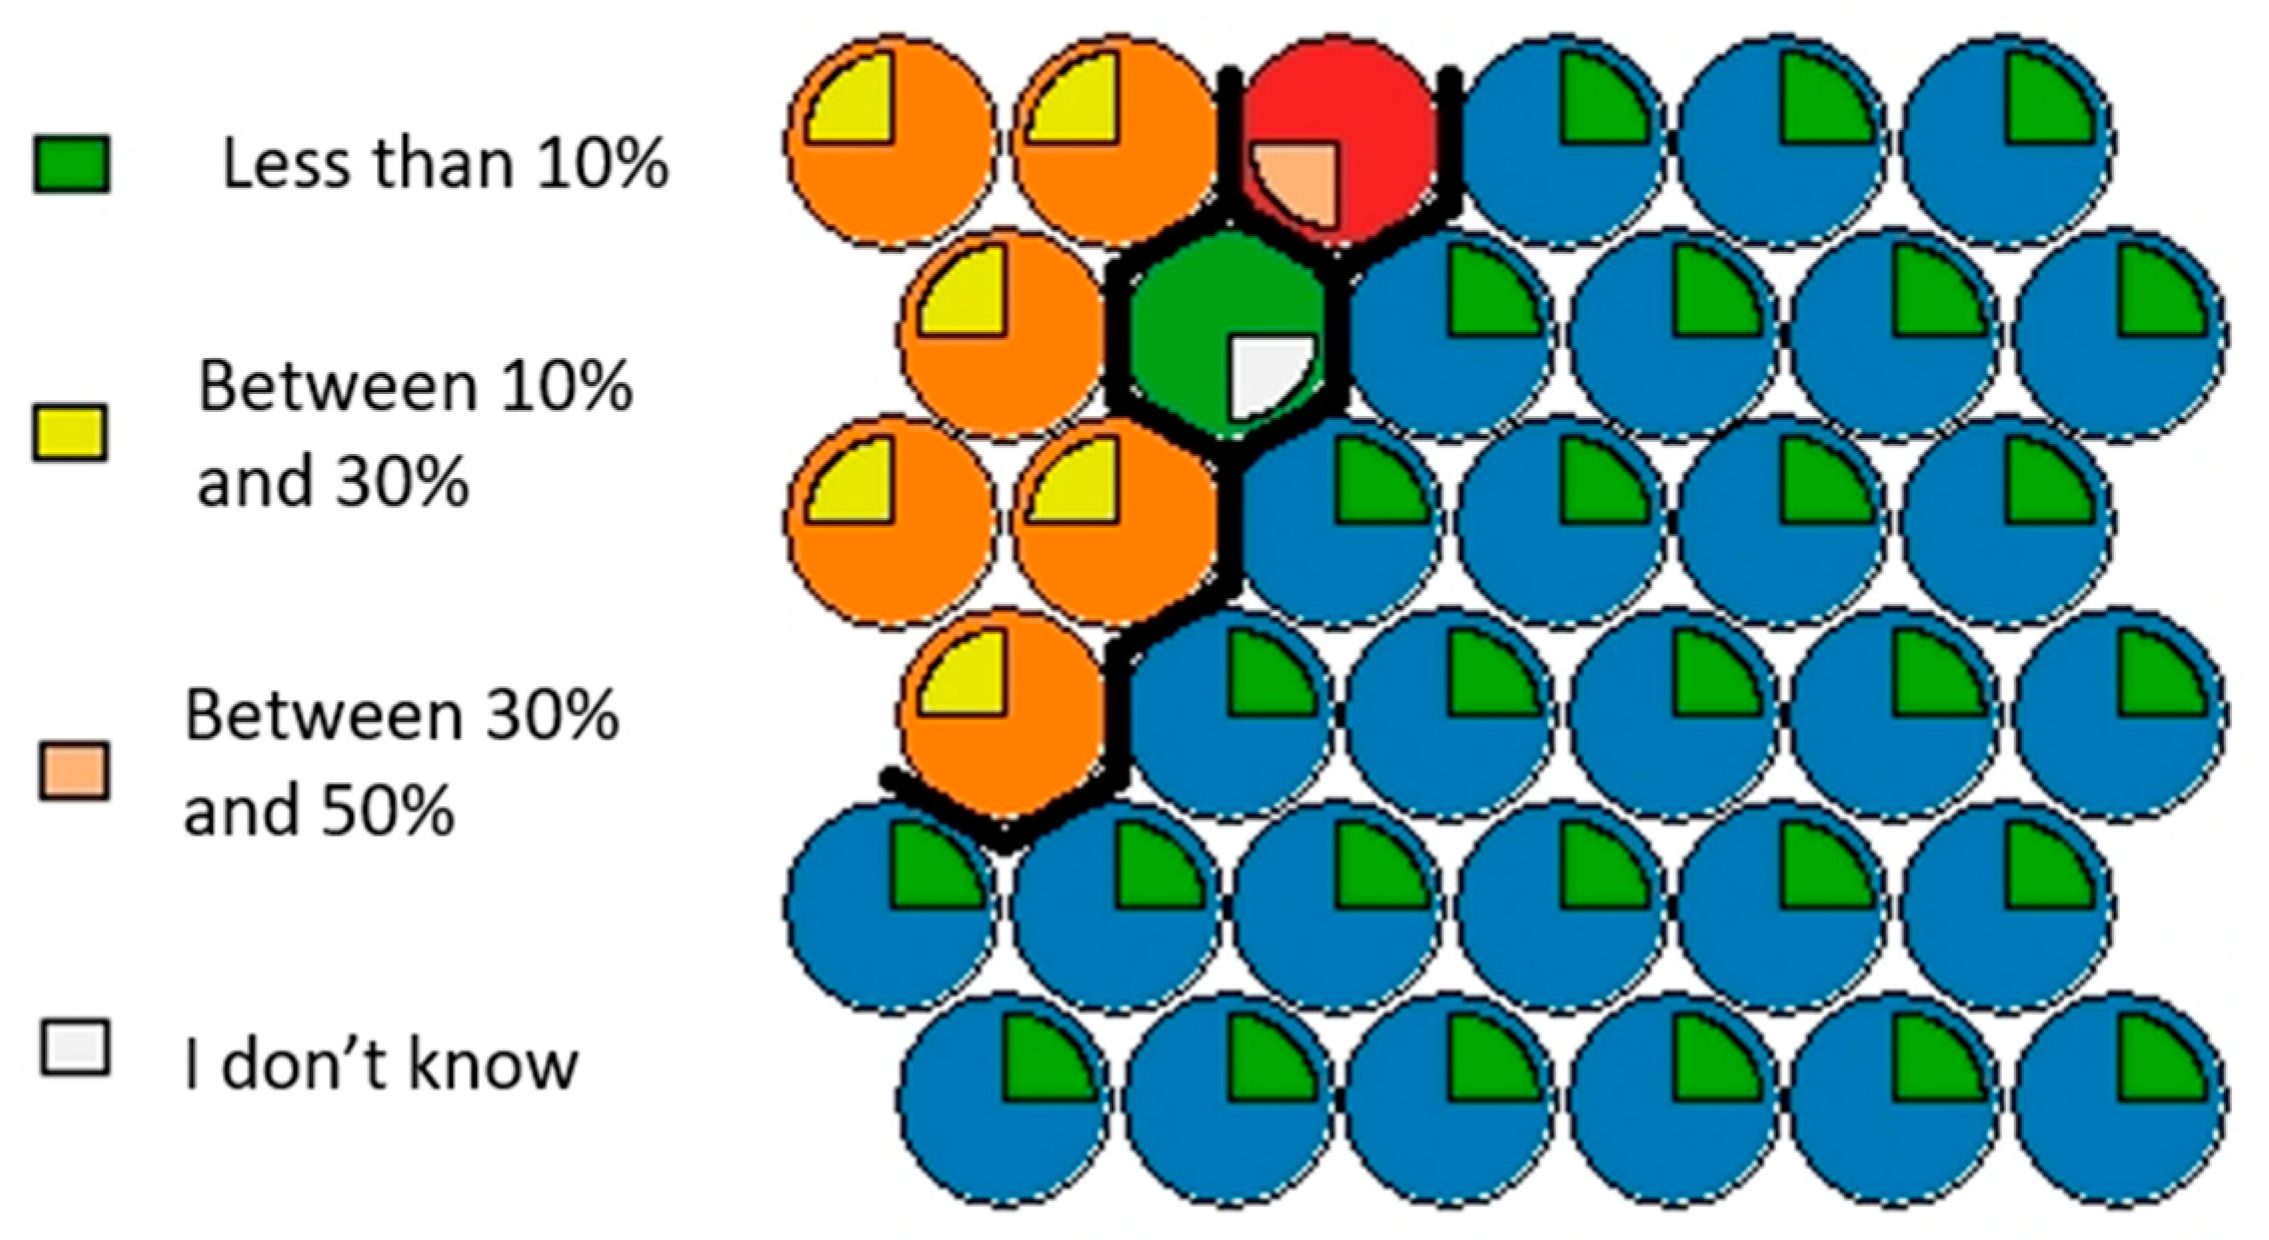
2.2. Self-Organising Map (SOM) Construction and Validation

We applied a type of SOM using the R Package “kohonen” Supervised and Unsupervised Self-Organising Maps [33] in order to segment consumers with respect to the amount of food waste they produce, and an artificial neural network considered the following relationship: y = f ( x ) , where y is our dependent variable, or variable to be clustered (quantity of food waste), and x is the vector of explanatory variables we used to obtain a segmentation. So, in our model, the polytomous dependent variable (i.e., food waste amount weekly produced) took on values from 1 to 4; in particular, 1 if the food waste was less than 10%, 2 if between 10% and 30%, 3 if between 30% and 50% and 4 if the respondent was not able to quantify the food wasted. Explanatory variables included food-related behaviours, food waste concerns and intention to reduce waste. In addition, we controlled for the sociodemographic characteristics of the respondents (gender, age, job, education, family size, presence of children and household income).
The ability of the SOM approach to cluster our sample of consumers with respect to the amount of food waste produced was tested using the training progress graph (Figure 1a). After conducting numerous experiments with matrices of different sizes, the accuracy criterion pointed to a hexagonal matrix of size 6 × 6, which is associated with a predictive capability of 46% (for more details, see [34,35]).
The SOM results are summarised by a U-Matrix (unified distance matrix). This matrix is represented by a heat map (Figure 1b) that indicates the degree of proximity of the statistical units within neurons (for more details, see [36]). We observed that most of the neurons placed under the main diagonal of the matrix tended towards red (i.e., the statistical units in each neuron were very homogeneous). The neurons above the main diagonal faded towards white (i.e., low homogeneity between the units within each neuron). The U-Matrix allowed the identified clusters to be visualised.

2.3. Clustering

Clusters emerged from the U-Matrix, the number of which was difficult to determine due to the different nuances above the main diagonal. In order to have an objective dimension of the clusters, based on the SOM results, we implemented a cluster analysis using Ward’s method [37].
On observing the dendrogram and making a cut at height 8 of the dissimilarity indicator (vertical axis), we noted the emergence of four clusters. Regarding this, both the Calinski–Harabasaz and Duda–Hart tests [38] (Table 1) allowed us to choose a suitable number of groups to consider in the analysis (i.e., the number of clusters for which both the tests took on the highest value). In this case, the highest value of these tests (6.57 for the Calinski–Harabasz test and 0.8607 for the Duda–Hart test) was obtained corresponding to a number of clusters equal to four. Following these results, we conclude this section by showing the U-Matrix with the definition of the cluster boundaries (see Figure 2a).

3. Results

3.1. Descriptive Statistics

Regarding the sociodemographic variables, males constituted approximately 48% of the sample, the average age of the respondent was about 40 and nearly 41% attained at least a high school qualification. Forty percent of the sample self-reported an annual average family income of over €30,000. Almost 33% of respondents were employees, 15% were housewives and 13.5% were self-employed or professionals. The average household size was 2.9 and children under 12 were present in 27% of the households.
With regard to food waste knowledge, 33% of consumers considered themselves quite aware of this problem, while 19% stated they had little awareness. As reported in the Table 2, consumers were very concerned with the environmental and social consequences of food waste, especially the waste of environmental resources (M = 4.32) as well as the consequence of food distribution inequality. Less sensitivity was shown towards the waste of economic resources linked to policies for the disposal of food surpluses (M = 3.96). Respondents on average self-assessed to generate a low level of food waste, and over 70% stated to waste between 10% and 30% of food on a regular week. As for the frequency of food waste, wastage occurred primarily on a daily basis (36.6%), followed by food wastage only on special occasions, such as during holidays (22%). The most wasted foods were those with a shorter shelf-life: 49% of respondents stated that they threw away bread, 48% fruit and vegetables and 48% rice and pasta. On average, respondents threw away the food mainly because it had expired or gone bad (M = 3.77) or because they had difficulty keeping it properly (M = 3.16).
Respondents would reduce the amount of food wasted mainly by planning purchases (M = 4.05) and paying attention to portion size (M = 3.97). They also stated that they could waste less food if they had further information on how to correctly interpret the expiration date on the label (M = 4.13) and if they had more information on how to share or donate food (M = 4.23).

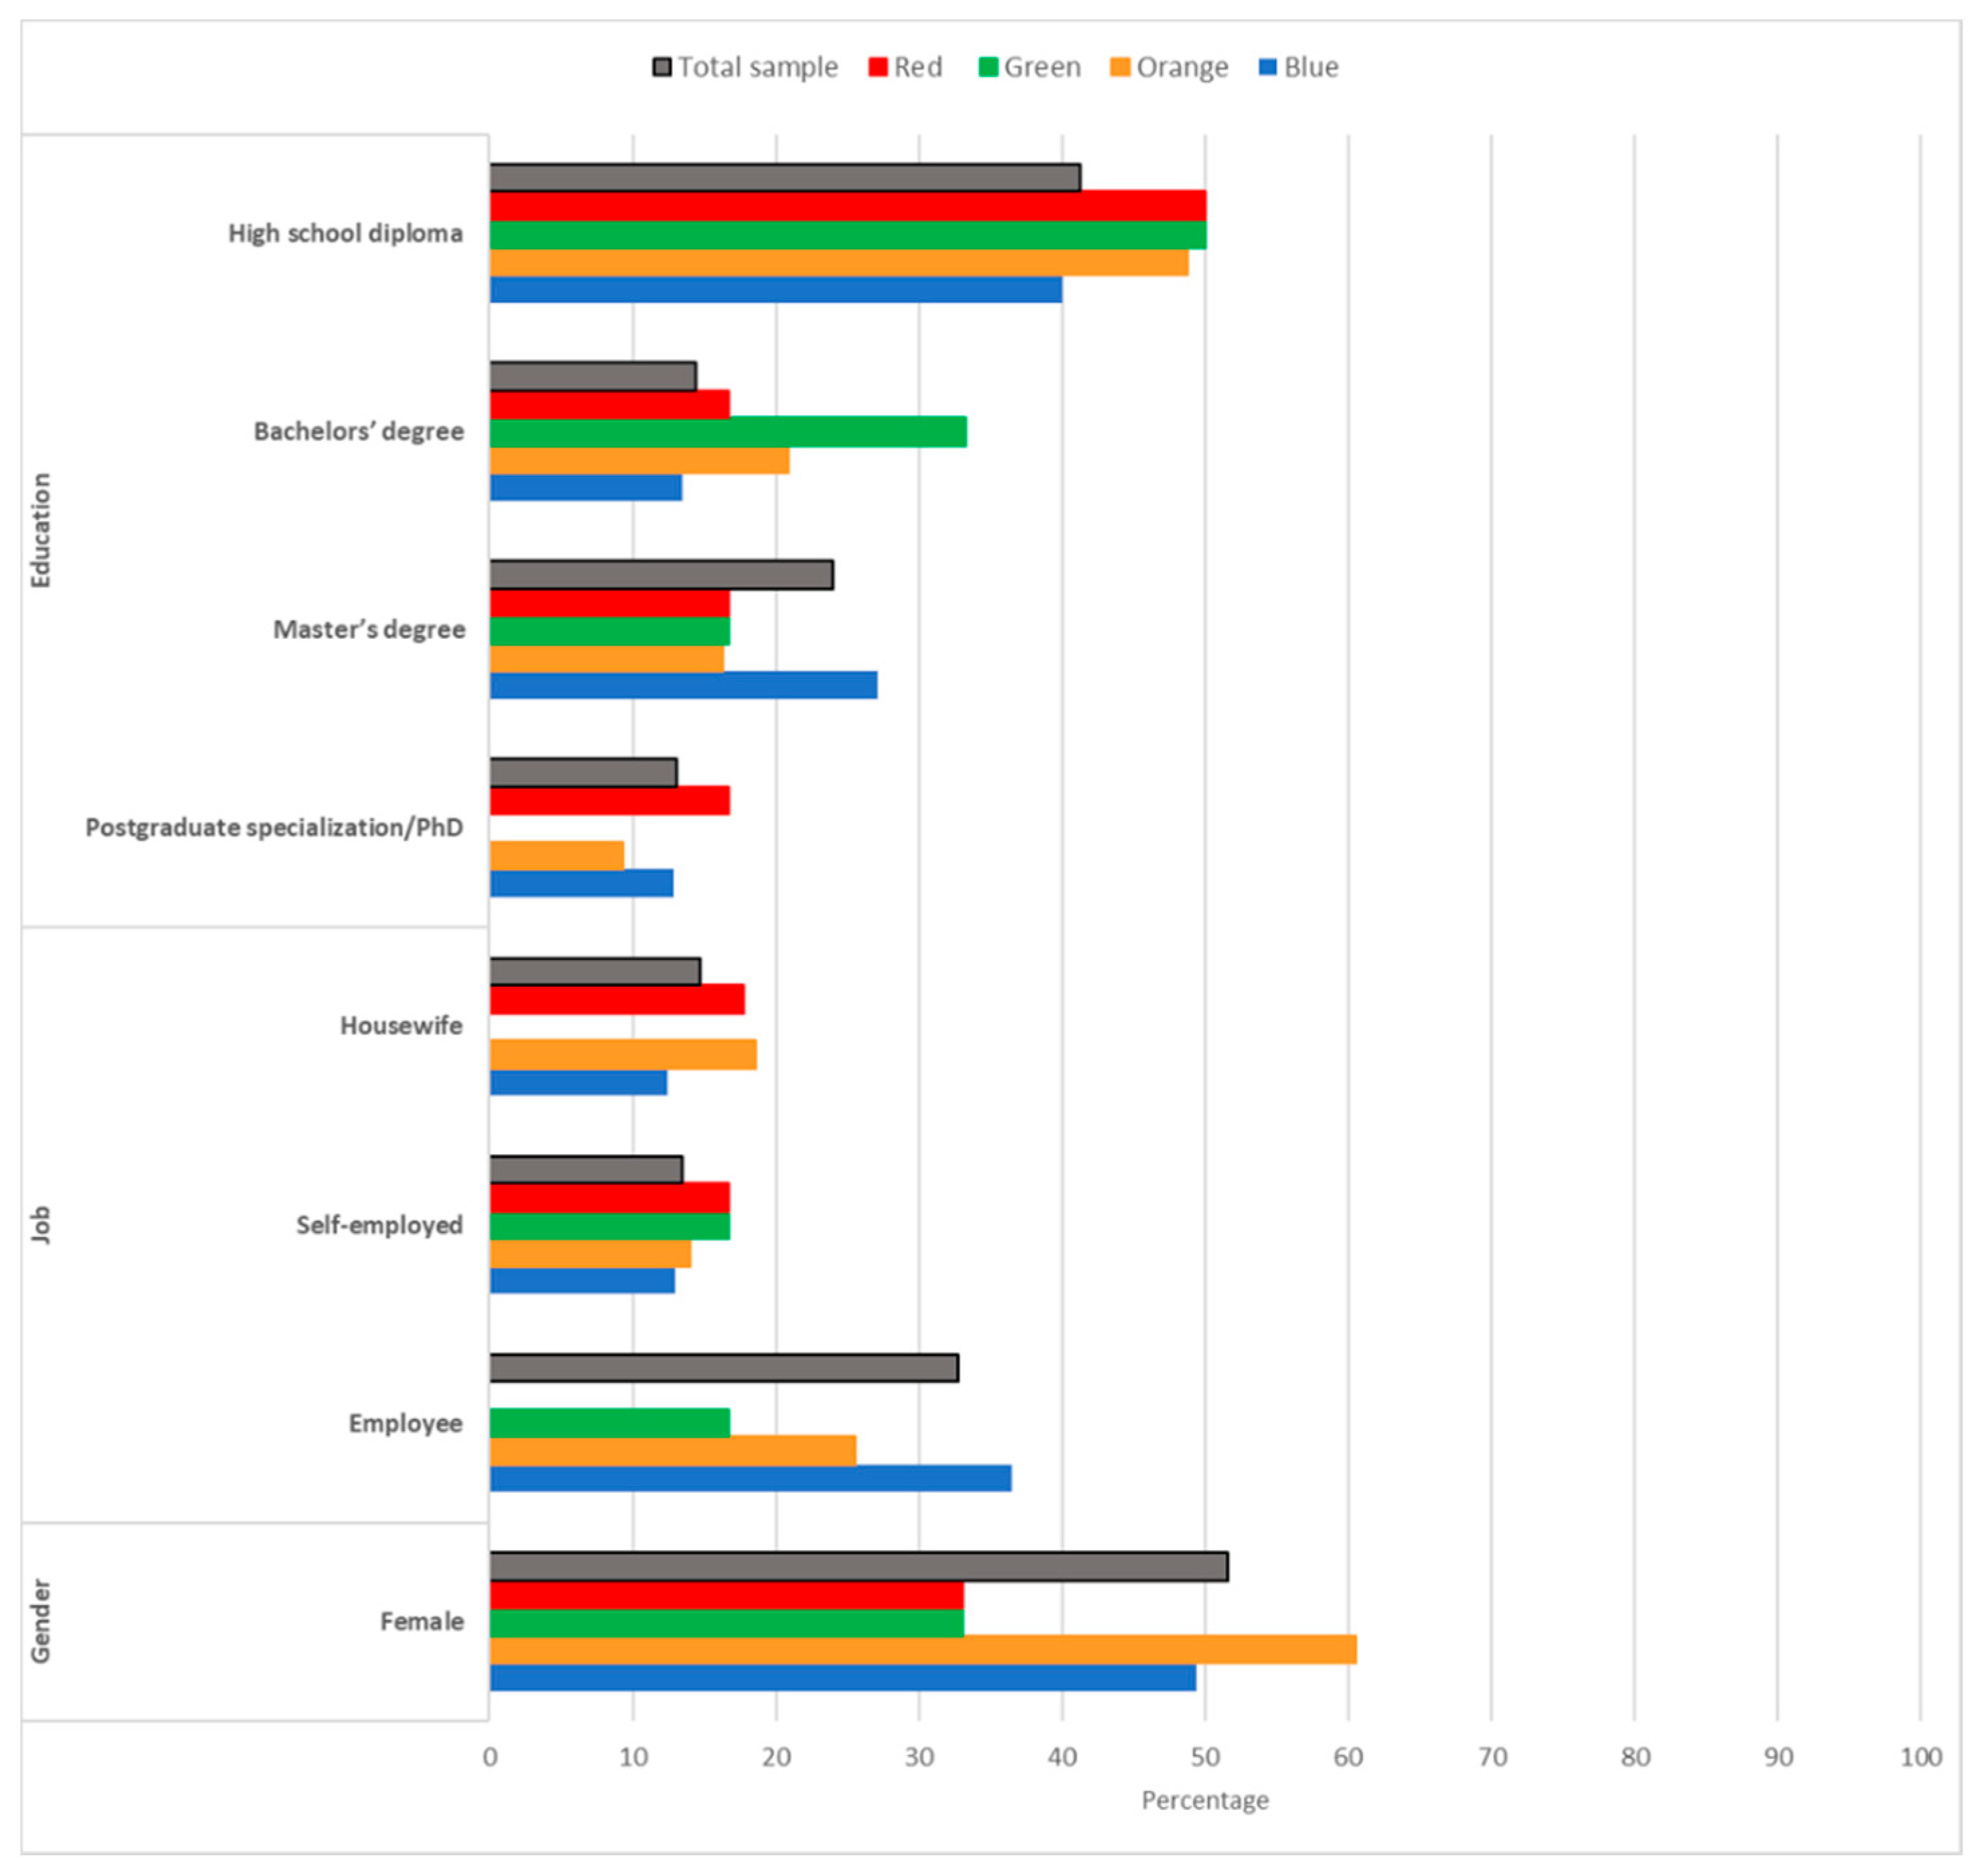
3.2. Profiling Consumer Segments

SOM analysis allowed us to identify four consumer clusters. In order to enhance the readability of the results, we reported the U-Matrix not in the form of a heatmap but as a map that identifies the clusters of the dependent variable (Figure 3).
In order to profile each cluster, we applied cross-tabulation and one-way ANOVA. The four consumer clusters are identified by colour (Table 2 and Figure 4 show the cluster profile in detail).
The Blue Cluster represents the largest segment (71% of the total sample) and includes consumers who wasted less than 10%. These individuals were the oldest, with an average age of 41 years; they were mainly employees, had no children under the age of 12, lived in households consisting of three members and their household average annual income was in the range of €20,000-€30,000. They also had a higher level of education compared with the other clusters: almost 13% had a postgraduate specialisation/PhD, while 27% held a Master’s degree. Regarding food habits, these consumers avoided making unnecessary purchases because they usually made a list of products before shopping; they were less sensitive to supermarket offers for food than the other clusters and tended to reuse leftovers. With regard to food waste concerns, these consumers were the most concerned about the environmental, economic and social consequences of food waste. They presented the highest level of sensitivity to both environmental and social impacts of food waste, such as the wastage of natural resources and inequality in food distribution among the world’s population. They were inclined to reduce food waste by planning their purchases and paying more attention to the food portions prepared. Finally, they stated that they could waste less food if they had more information on how to donate food.
The Orange Cluster (19% of the total sample) includes consumers who wasted between 10% and 30% of food and had the greatest incidence of females and housewives. These consumers were on average 35 years old and almost half had obtained a high school diploma. In terms of food-related behaviour, they were very attentive to product prices, always looking for products offering the best value for money and buying more food when supermarkets offered good value for money. With respect to food waste concerns, they were especially sensitive to environmental resource waste. Finally, while they showed willingness to reduce food waste by paying attention to the size of food portions, they had difficulty controlling the food wasted in their family.
The Green Cluster (5% of the total sample) includes consumers who wasted between 30% and 50%. They had an average age of 33 years, and half of them had a high school diploma and 33% a bachelors’ degree. Regarding food-related behaviour, these consumers were very sensitive to supermarket offers and often purchased foods that were not included in the shopping list or tended to buy larger amounts of food when supermarkets offered good value for money. Their concerns about the environmental and economic impacts of food waste were in line with the sample, while presenting a lower level of sensitivity to the social impact. These consumers seemed aware that the driver of their household food waste was linked to the difficulty in planning food purchases and preparing meals. They tended to consider it impossible to reduce food waste, compared with the other clusters, even if the desire to manage household expenditures efficiently strongly affected their intention to waste less. Finally, they stated that they could waste less food if they had further information on how to correctly interpret the expiration date on the label.
The Red Cluster (5% of the total sample) includes consumers who were not able to quantify the amount of food wasted. These individuals were younger than the other three clusters, were mainly men and lived in households with more than three members. They considered food shopping a boring activity and generally did not use a shopping list. They preferred familiar, fresh food and were particularly attentive to the expiration date on labels. Indeed, concerns over food expiration or food that may have gone bad were the main drivers of their wasteful behaviour. These consumers seemed less sensitive than the other three clusters to the loss of biodiversity and desertification linked to intensive food production and the waste of economic resources linked to policies for the disposal of food surpluses. Finally, they were more inclined to reduce food waste by planning their purchases and paying more attention to the food portions prepared.

4. Discussion

The identification of different consumer segments allowed us to set up some preventive strategies for policy makers, retailers and producers targeting different profiles
Overall, most respondents self-reported that they wasted less than 10% of food during a regular week. This result seems to be in line with a recent report produced at the national level, which found that in Italy, the incidence of households with wasteful behaviour is somewhat lower than in other EU countries [30]. In addition, the regions in southern Italy show a lower incidence of food waste than that in central or northern Italy [30,39]. However, it must be highlighted that previous research showed that the self-assessment of household food waste is systematically underestimated [28,30,39].
Our results confirm that food-related behaviour and routine are prominent drivers in determining food waste at the household level [8,12,27]. Further, the level of concerns about the impact of food waste differed among the identified clusters but to a lesser extent compared with food behaviour variables.
Regarding the cluster analysis results, the Blue Cluster comprises individuals who self-reported a low level of food waste by planning their purchases well and not being influenced by supermarket offers. Thus, planning routines can play an important role in limiting food waste [10,11,12]. Additionally, on average, they represent the segment that most reuses leftovers, confirming that this practice is useful in reducing wasteful behaviour [8,17]. However, given that its potential is not yet fully appreciated by households, due primarily to uncertainty regarding leftover edibility or safety [19,28], it is crucial to provide information on managing leftovers, for example, by holding waste cookery classes as suggested by previous research [7,11]. Blue Cluster consumers are also particularly sensitive to environmental concerns related to food waste, confirming the role of concerns in influencing responsible food behaviour and the intention to reduce food waste [11,12].
Blue Cluster consumers also would waste less if they had more information on how to donate food. Antiwaste policies should therefore better inform consumers about how to donate food and promote the creation of initiatives that could support food sharing by exploiting the potential of new technologies, such as online platforms and apps [40,41].
With regard to the profiles of the Orange and Green Clusters, which on average wasted more food than their Blue counterparts, a common result that emerged is that they are unable to plan their purchases and are easily influenced by supermarket promotions, therefore tending to buy more. This confirms that overprovisioning of food, as well as bulk purchases, are prominent reasons leading to wasteful behaviour [9,10]. As a consequence, policy makers in their education campaigns should encourage consumers to plan their food purchases, as well as to use meal plans in advance or check inventories before shopping. In this regard, public policies could encourage the use of new technologies that facilitate the efficient management of food purchases or food stocks through, for example, menu planning or shopping applications that are widely available and could represent an important self-regulatory resource in reducing food waste [42]. Retailers can also actively contribute to reducing food waste, for example, by rethinking their sales promotions, introducing, for example, “buy one get one later” initiatives already proposed by Sainsbury’s and Tesco [5], or by using social media or e-newsletters to inform customers about sales promotions [43], which has proven to reduce food waste.
Another interesting aspect that emerges is that for the Green Cluster, concern over food safety and proper storage is one of the main reasons for food waste, accompanied by difficulties in interpreting the expiration date on labels, confirming what has been shown by other studies [12,15,28]. In this regard, in accordance with the literature, considering that consumers seem to be very confused and show difficulties in interpreting the actual meaning of the expiration date and the date of minimum durability, a simplified food labelling regulation could represent a potential antiwaste strategy [7,15]. Additionally, educational initiatives are needed to help consumers correctly interpret the date of minimum durability, as well as efforts to increase consumer acceptability of food that is less fresh or nearing its expiration date.
Moreover, in this case, joint action among policy makers, retailers and producers could result in more effective strategies, for example, by placing educational spaces in retail outlets or adding such information to producers’ promotional campaigns. Producers and retailers could be supported by public policies in introducing smart labels that help consumers identify unsafe food by changing its colour on the packaging [44].
Finally, with respect to the Red Cluster profile, once again, it is noticeable that the lack of planning is the probable cause of food waste, linked to strong sensitivity to product freshness. Thus, the desire to eat fresh food also represents a prominent reason for food being wasted. In this regard, packaging innovation and new packing materials are crucial in order to extend product freshness, shelf-life and reduce wasteful behaviour [45]. As a consequence, public policies supporting investments for research and development in this field should be strengthened. Another possible strategy for such consumers could be implemented by retailers selling suboptimal fresh food accompanied by targeted communication in-store messages [46].
With respect to sociodemographic variables, our results confirm that younger consumers tend to waste more food than older consumers [8,17]. Therefore, it would be useful to implement different antiwaste strategies taking age into account, using different tools depending on consumer age. As for education, in contrast with [17], we found that a higher level of education corresponded to a low level of food waste. In contrast, in terms of household size, there was no significant difference among clusters, except for the Red Cluster with its large household size. However, the fact that this cluster includes individuals who were unable to estimate their food waste precludes us from drawing a definitive conclusion.
It is worth highlighting that the results from the present research are subject to several limitations mainly connected to the use of a self-administered questionnaire and the self-assessment of the extent of consumers’ household food waste. This leads to underestimation of their food waste behaviour due to social desirability bias, even if the aim of our research was not to assess the extent of household food waste but to explore the drivers behind food waste behaviour. However, previous research found that the use of a survey can only partly capture the complexity of food waste behaviour [39,46]. Further research might provide greater insight into how food behaviour and food waste are linked, perhaps using food diaries as recommended by Giordano et al. [39].
Other limitations concern the study sample, which was a convenience sample. Furthermore, as the survey only included respondents from southern Italy, the results cannot be extended to the national population. Thus, future research could concentrate on other geographical regions in order to obtain comparable results in different socioeconomic contexts.

5. Conclusions

The findings from our research suggest the existence of different profiles of consumer behaviour that influence household food waste generation, so strategies aimed at reducing food waste should take such differences into account when promoting behavioural change. The recognition of these differences, in both consumers’ sociodemographic profile and their food-related behaviour, may represent an important starting point to develop and implement different antiwaste strategies and plans at EU and national levels as well. Disseminating information and implementing education about food waste and its environmental and social consequences are important to raise consumer awareness, but they represent only the starting point of a more complex strategy based on the collaboration between all food supply chain stakeholders. In this regard, the World Resource Institute recently recommended that governments and all actors in the food supply chain should follow a “Target–Measure–Act” approach, starting by pursuing a “to-do” list tailored to their specific roles [47].

Author Contributions

Conceptualization, A.A., A.M.; Data curation, A.A., M.A., A.F.; Methodology, M.A., A.F.; Supervision, A.A., A.M.; Writing–original draft, A.A., A.M., M.A., A.F.; Writing—review and editing, A.A.; A.F. All authors have read and agreed to the published version of the manuscript.

Funding

This research was funded by University of Naples Parthenope as part of the research project “Sustainability, externalities and efficient use of environmental resources”. And The APC was funded by University of Naples Parthenope.

Acknowledgments

The Authors wish to thank the anonymous Reviewers for their valuable comments and suggestions.

Conflicts of Interest

The authors declare no conflict of interest

Appendix A

Figure A1. Map of Campania Region.
Sustainability 12 01495 g0a1

References

  1. United Nations. General Assembly Resolution A/RES/70/1. Transforming Our World, the 2030 Agenda for Sustainable Development. Available online: https://www.un.org/sustainabledevelopment/sustainable-consumption-production/ (accessed on 18 September 2017).
  2. European Commission. Communication from the Commission to the European Parliament, the Council, the European Economic and Social Committee and the Committee of the Regions. Towards a Circular Economy: A Zero Waste Programme for Europe. 2014. Available online: https://eur-lex.europa.eu/resource.html?uri=cellar:aa88c66d-4553-11e4-a0cb01aa75ed71a1.0022.03/DOC_1&format=PDF (accessed on 10 July 2016).
  3. Stenmarck, Â.; Jensen, C.; Quested, T.; Moates, G. Estimates of European Food Waste Levels; IVL Swedish Environmental Research Institute: Stockholm, Sweden, 2016; Available online: http://www.eu-fusions.org (accessed on 10 March 2019).
  4. Canali, M.; Amani, P.; Aramyan, L.; Gheoldus, M.; Moates, G.; Östergren, K.; Silvennoinen, K.; Waldron, K.; Vittuari, M. Food waste drivers in Europe, from identification to possible interventions. Sustainability 2017, 9, 37. [Google Scholar] [CrossRef] [Green Version]
  5. Bos-Brouwers HE, J.; Soethoudt, J.M.; Canali, M.; Östergren, K.; Amani, P.; Aramyan, L.; O’Connor, C. Drivers of Current Food Waste Generation, Threats of Future Increase and Opportunities for Reduction; FUSIONS N FP7-KBBE-2012-6-311972; The Swedish Institute for Food and Biotechnology: Göteborg, Sweden, 2014. [Google Scholar]
  6. Aschemann-Witzel, J.; De Hooge, I.E.; Almli, V.L.; Oostindjer, M. Fine-tuning the fight against food waste. J. Macromarketing 2018, 38, 168–184. [Google Scholar] [CrossRef]
  7. Schanes, K.; Dobernig, K.; Gözet, B. Food waste matters-A systematic review of household food waste practices and their policy implications. J. Clean. Prod. 2018, 182, 978–991. [Google Scholar] [CrossRef]
  8. Stancu, V.; Haugaard, P.; Lähteenmäki, L. Determinants of consumer food waste behaviour: Two routes to food waste. Appetite 2016, 96, 7–17. [Google Scholar] [CrossRef] [PubMed]
  9. Qi, D.; Roe, B.E. Household food waste: Multivariate regression and principal components analyses of awareness and attitudes among US consumers. PLoS ONE 2016, 1, e0159250. [Google Scholar] [CrossRef] [PubMed]
  10. Bravi, L.; Francioni, B.; Murmura, F.; Savelli, E. Factors affecting household food waste among young consumers and actions to prevent it. A comparison among UK, Spain and Italy. Resour. Conserv. Recycl. 2020, 153, 104586. [Google Scholar] [CrossRef]
  11. Mondéjar-Jiménez, J.A.; Ferrari, G.; Secondi, L.; Principato, L. From the table to waste: An exploratory study on behaviour towards food waste of Spanish and Italian youths. J. Clean. Prod. 2016, 138, 8–18. [Google Scholar] [CrossRef]
  12. Principato, L.; Secondi, L.; Pratesi, C.A. Reducing food waste: an investigation on the behaviour of Italian youths. Br. Food J. 2015, 117, 731–748. [Google Scholar] [CrossRef]
  13. Melbye, E.L.; Onozaka, Y.; Hansen, H. Throwing it all away: exploring affluent consumers’ attitudes toward wasting edible food. J. Food Prod. Mark. 2017, 23, 416–429. [Google Scholar] [CrossRef]
  14. Priefer, C.; Jörissen, J.; Bräutigam, K.-R. Food waste prevention in Europe—A cause-driven approach to identify the most relevant leverage points for action. Resour. Conserv. Recycl. 2016, 109, 155–165. [Google Scholar] [CrossRef]
  15. Di Talia, E.; Simeone, M.; Scarpato, D. Consumer behaviour types in household food waste. J. Clean. Prod. 2019, 214, 166–172. [Google Scholar] [CrossRef]
  16. Stefan, V.; Van Herpen, E.; Tudoran, A.A.; Lähteenmäki, L. Avoiding food waste by Romanian consumers: The importance of planning and shopping routines. Food Qual. Prefer. 2013, 28, 375–381. [Google Scholar] [CrossRef]
  17. Secondi, L.; Principato, L.; Laureti, T. Household food waste behaviour in EU-27 countries: A multilevel analysis. Food Policy 2015, 56, 25–40. [Google Scholar] [CrossRef]
  18. Cecere, G.; Mancinelli, S.; Mazzanti, M. Waste prevention and social preferences: the role of intrinsic and extrinsic motivations. Ecol. Econ. 2014, 107, 163–176. [Google Scholar] [CrossRef] [Green Version]
  19. Setti, M.; Banchelli, F.; Falasconi, L.; Segrè, A.; Vittuari, M. Consumers’ food cycle and household waste. When behaviors matter. J. Clean. Prod. 2018, 185, 694–706. [Google Scholar] [CrossRef]
  20. Neff, R.A.; Spiker, M.L.; Truant, P.L. Wasted food: US consumers’ reported awareness, attitudes, and behaviors. PLoS ONE 2015, 10, e0127881. [Google Scholar] [CrossRef] [Green Version]
  21. Quested, T.E.; Marsh, E.; Stunell, D.; Parry, A.D. Spaghetti soup: The complex world of food waste behaviours. Resour. Conserv. Recycl. 2013, 79, 43–51. [Google Scholar] [CrossRef]
  22. Riverso, R.; Amato, M.; La Barbera, F. The effect of food waste habit on future intention to reduce household food waste. Qual. Access Success 2017, 18, 369–375. [Google Scholar]
  23. Visschers, V.H.; Wickli, N.; Siegrist, M. Sorting out food waste behaviour: A survey on the motivators and barriers of self-reported amounts of food waste in households. J. Environ. Psychol. 2016, 45, 66–78. [Google Scholar] [CrossRef]
  24. Graham-Rowe, E.; Jessop, D.C.; Sparks, P. Predicting household food waste reduction using an extended theory of planned behaviour. Resour. Conserv. Recycl. 2015, 101, 194–202. [Google Scholar] [CrossRef]
  25. Parizeau, K.; Von Massow, M.; Martin, R. Household-level dynamics of food waste production and related beliefs, attitudes, and behaviours in Guelph, Ontario. Waste Manag. 2015, 35, 207–217. [Google Scholar] [CrossRef] [PubMed]
  26. Williams, H.; Wikström, F.; Otterbring, T.; Löfgren, M.; Gustafsson, A. Reasons for household food waste with special attention to packaging. J. Clean. Prod. 2012, 24, 141–148. [Google Scholar] [CrossRef] [Green Version]
  27. Aschemann-Witzel, J.; De Hooge, I.; Amani, P.; Bech-Larsen, T.; Oostindjer, M. Consumer-related food waste: Causes and potential for action. Sustainability 2015, 7, 6457–6477. [Google Scholar] [CrossRef] [Green Version]
  28. Falasconi, L.; Cicatiello, C.; Franco, S.; Segrè, A.; Setti, M.; Vittuari, M. Such a shame! A study on self-perception of household food waste. Sustainability 2019, 11, 270. [Google Scholar] [CrossRef] [Green Version]
  29. Gaiani, S.; Caldeira, S.; Adorno, V.; Segrè, A.; Vittuari, M. Food wasters: Profiling consumers’ attitude to waste food in Italy. Waste Manag. 2018, 72, 17–24. [Google Scholar] [CrossRef] [PubMed]
  30. MIPAF-CREA, 2019. L’osservatorio Sulle Eccedenze, Sui Recuperi e Sugli Sprechi Alimentari Ricognizione Delle Misure in Italia e Proposte di Sviluppo. Available online: http://www.crea.gov.it/documents/59764/0/Osservatorio+CREA+O-ERSA+WEB.pdf/c93f0266-e5f7-e2f3-e581-32797328bb3b?t=1559138880594. (accessed on 16 September 2019).
  31. Grunert, K.G.; Brunsø, K.; Bredahl, L.; Bech, A.C. Food-related lifestyle: A segmentation approach to European food consumers. In Food, People and Society; Springer: Berlin/Heidelberg, Germany, 2001; pp. 211–230. [Google Scholar]
  32. Italian National Institute of Statistics. Official Data on Resident Population in the Italian Municipalities. Available online: https://ugeo.urbistat.com/AdminStat/it/it/demografia/dati-sintesi/campania/15/2 (accessed on 8 January 2020).
  33. Wehrens, R.; Wehrens, M.R. Package ‘Kohonen’. Available online: https://mran.microsoft.com/snapshot/2014-11-18/web/packages/kohonen/kohonen.pdf (accessed on 1 July 2019).
  34. Kollias, S.; Stafylopatis, A.; Duch, W.; Oja, E. Artificial Neural Networks—ICANN 2006. In Proceedings of the 16th International Conference, Athens, Greece, 10–14 September 2006; Springer: Berlin/Heidelberg, Germany. [Google Scholar]
  35. James, G.; Witten, D.; Hastie, T.; Tibshirani, R. An Introduction to Statistical Learning with Applications in R; Springer: New York, NY, USA, 2013. [Google Scholar]
  36. Alpaydin. E. Introduction to Machine Learning, 3rd ed.; The MIT Press: Cambridge, MA, USA, 2014. [Google Scholar]
  37. Romesburg. C. Cluster Analysis for Researchers; Lulu Press: Morrisville, NC, USA, 2004. [Google Scholar]
  38. Caliński, T.; Harabasz, J. A dendrite method for cluster analysis. Commun. Stat. Theory Methods 1974, 3, 1–27. [Google Scholar] [CrossRef]
  39. Giordano, C.; Alboni, F.; Falasconi, L. Quantities, Determinants, and Awareness of Households’ Food Waste in Italy: A Comparison between Diary and Questionnaires Quantities’. Sustainability 2019, 11, 3381. [Google Scholar] [CrossRef] [Green Version]
  40. Davies, A. Sharecity Typologies of Food Sharing. In Sharecity e Sustainability of City-Based Food Sharing; Working Paper 1. Trinity College Dublin: Dublin, Ireland, 2016; Available online: http://sharecity.ie/wp-content/uploads/2016/03/SHARECITY-TYPOLOGIES-OFFOOD-SHARING_WP1.pdf (accessed on 9 September 2019).
  41. Michelini, L.; Principato, L.; Iasevoli, G. Understanding food sharing models to tackle sustainability challenges. Ecol. Econ. 2018, 145, 205–217. [Google Scholar] [CrossRef]
  42. Jones, H. Tech Innovations That Could Reduce Food Waste. The Guardian. Available online: https://www.theguardian.com/business/2016/jul/14/tech-innovations-that-could-reduce-foodwaste (accessed on 9 September 2019).
  43. Young, W.; Russell, S.V.; Robinson, C.A.; Barkemeyer, R. Can social media be a tool for reducing consumers’ food waste? A behaviour change experiment by a UK retailer. Resour. Conserv. Recycl. 2017, 117, 195–203. [Google Scholar] [CrossRef] [Green Version]
  44. Newsome, R.; Balestrini, C.G.; Baum, M.D.; Corby, J.; Fisher, W.; Goodburn, K.; Labuza, T.P.; Prince, G.; Thesmar, H.S.; Yiannas, F. Applications and Perceptions of Date Labeling of Food. Compr. Rev. Food Sci. Food Saf. 2014, 13, 745–769. [Google Scholar] [CrossRef] [Green Version]
  45. Wikström, F.; Verghese, K.; Auras, R.; Olsson, A.; Williams, H.; Wever, R.; Grönman, K.; Pettersen, M.K.; Møller, H.; Soukka, R. Packaging strategies that save food: A research agenda for 2030. J. Ind. Ecol. 2019, 23, 532–540. [Google Scholar] [CrossRef]
  46. Aschemann-Witzel, J.; Otterbring, T.; De Hooge, I.E.; Normann, A.; Rohm, H.; Almli, V.L.; Oostindjer, M. The who, where and why of choosing suboptimal foods: Consequences for tackling food waste in store. J. Clean. Prod. 2019, 236, 117596. [Google Scholar] [CrossRef]
  47. World Resources Institute. Reducing Food Loss and Waste: Setting a Global Action Agenda. Available online: https://www.wri.org/publication/reducing-food-loss-and-waste-setting-global-action-agenda (accessed on 10 June 2019).
Figure 1. Validation graphs of self-organising maps (SOMs).
Sustainability 12 01495 g001
Figure 2. Clustering.
Sustainability 12 01495 g002
Figure 3. Identified clusters.
Sustainability 12 01495 g003
Figure 4. Clusters’ sociodemographic profiles.
Sustainability 12 01495 g004
Table 1. Test results.
Duda–HartCalinski–Harabasz
Number of clustersJe(2)/Je(1)Pseudo-T-squaredPseudo-F
10.80658.16
20.8153.41
30.61123.186.45
40.86072.756.57
50.85632.185.79
60.46911.135.17
70.74022.814.9
80.8152.044.63
Table 2. Cluster profiling.
BlueOrangeGreenRed Total Sample
Motivation that drives food waste behaviour
(α = 0.687)
Food has expired or gone bad3.683.604.663.803.77
I bought/cooked too much food2.282.532.83 2.332.34
The food is about to expire2.142.302.502.16 2.18
I didn’t keep the food well and I worry that it may have gone bad3.103.344.332.503.16
I have prepared/bought food that I or my family do not like1.932.042.832.001.98
Food-related behaviour
(α = 0.712)
I like shopping for food3,123,303,523,223.29
Shopping for food bores me2.232.041.833.162.21
Shopping for food is like a game to me2.523.022.663.002.63
Before I do a large amount of food shopping, I always make a list 3.372.933.662.663.33
I usually purchase food that I did not include in the shopping list3.203.204.163.663.24
I usually buy larger amounts of food when supermarkets offer good value for money3.313.673.663.333.37
I usually decide what to buy only when I am at the supermarket2.232.202.332.662.16
I buy and eat only products that are familiar to me3.303.272.834.003.31
I like to try new foods that I have never tasted2.952.972.163.162.92
For me, the freshness of food products is very important4.504.534.504.834.49
I prefer to buy fresh meat and vegetables rather than prepackaged4.194.233.663.834.24
I always check the expiration date on the label4.234.164.504.664.24
I always look for the product with the best value for money3.944.133.833.503.96
I always compare product prices before buying them3.643.933.833.503.72
I usually keep and reuse leftovers3.653.552.663.003.59
Food waste concerns
(α = 0.910)
Waste of environmental resources (water, energy, soil, etc.)4.414.164.004.164.32
CO2 emissions increase due to the production and transport of food4.053.794.003.833.98
Waste of economic resources for the purchase of food not consumed4.203.864.003.834.03
Inequalities in food distribution among the world’s population4.243.953.833.664.18
Loss of biodiversity and desertification linked to intensive food production4.023.974.003.164.01
Waste of economic resources linked to policies for the disposal of food surpluses4.01 3.864.003.003.96
Intention to reduce food waste
(α = 0.625)
I would like to reduce the amount of food wasted by programming my purchases better4.053.694.334.164.051
I would like to reduce the amount of food wasted by paying more attention to the portions I prepare3.893.884.333.503.97
Even if I wanted, it would be impossible for me to reduce the amount of food wasted on my family2.082.322.662.002.14
I do not intend to change my habits2.102.042.331.162.07
Motivation to prevent food waste
(α = 0.755)
Think about people who do not have enough food4.204.234.833.004.19
The desire to efficiently manage my family spending4.234.234.502.834.20
The thought of wasted natural resources (energy and water) in the production of wasted food4.183.864.332.664.08
I could waste less food if…
(α = 0.710)
Smaller packages of food were available in stores3.703.864.002.333.77
There was information on how to interpret the expiration date on the label correctly4.134.024.502.834.08
There was more information on how to share or donate food4.234.214.833.004.21

