Article

The Global Potential Distribution of Invasive Plants: Anredera cordifolia under Climate Change and Human Activity Based on Random Forest Models

1
School of Geography and Tourism, Shaanxi Normal University, Xi’an 710119, China
2
National Engineering Laboratory for Resource Development of Endangered Crude Drugs in Northwest of China, Shaanxi Normal University, Xi’an 710119, China
3
The Key Laboratory of Medicinal Resources and Natural Pharmaceutical Chemistry, The Ministry of Education, Shaanxi Normal University, Xi’an 710119, China
4
College of Life Sciences, Shaanxi Normal University, Xi’an 710119, China
*
Authors to whom correspondence should be addressed.
Sustainability 2020, 12(4), 1491; https://doi.org/10.3390/su12041491
Submission received: 30 December 2019 / Revised: 12 February 2020 / Accepted: 13 February 2020 / Published: 17 February 2020
(This article belongs to the Special Issue Climate Change and Global Food Security)

Abstract

:
The potential distribution of the invasive plant Anredera cordifolia (Tenore) Steenis was predicted by Random Forest models under current and future climate-change pathways (i.e., RCP4.5 and RCP8.5 of 2050s and the 2070s). Pearson correlations were used to select variables; the prediction accuracy of the models was evaluated by using AUC, Kappa, and TSS. The results show that suitable future distribution areas are mainly in Southeast Asia, Eastern Oceania, a few parts of Eastern Africa, Southern North America, and Eastern South America. Temperature is the key climatic factor affecting the distribution of A. cordifolia. Important metrics include mean temperature of the coldest quarter (0.3 °C ≤ Bio11 ≤ 22.9 °C), max temperature of the warmest month (17.1 °C ≤ Bio5 ≤ 35.5 °C), temperature annual range (10.7 °C ≤ Bio7 ≤ 33 °C), annual mean air temperature (6.8 °C ≤ Bio1 ≤ 24.4 °C), and min temperature of coldest month (−2.8 °C ≤ Bio6 ≤ 17.2 °C). Only one precipitation index (Bio19) was important, precipitation of coldest quarter (7 mm ≤ Bio19 ≤ 631 mm). In addition, areas with strong human activities are most prone to invasion. This species is native to Brazil, but has been introduced in Asia, where it is widely planted and has escaped from cultivation. Under the future climate scenarios, suitable habitat areas of A. cordifolia will expand to higher latitudes. This study can provide a reference for the rational management and control of A. cordifolia.

1. Introduction

Climate change, biological invasion, and human activities are important factors leading to global biodiversity changes, but among them, climate change and human activities have essential effects on the distribution of invasive species [1,2]. Hence, it is important to explore the relationship between them. Studies have shown that, over the past century, the phenomenon of global warming has been remarkable. Global temperatures in the 21st century are expected to rise by 1.1 to 6.4 °C [3]. With the development of GCMs (General Circulation Models), research on the potential distribution and migration of alien plants under different climatic conditions in the future has become a hot topic [4]. Generally, a new set of scenarios under the framework of Coupled Model Intercomparison Project 5 (CMIP5) of the World Climate Research Program (WCRP) (i.e., Representative Concentration Pathways (RCPs)) has been developed [5]. The RCPs consist of four greenhouse gas emission scenarios, one low-emission scenario (RCP2.6), two medium-emission scenarios (RCP4.5 and RCP6.0), and one high-emission scenario (RCP8.5) [6].
Studies have shown that biodiversity is greatly affected by climate change [7,8,9]. For example, if the predicted greenhouse gas scenarios are achieved, changes in temperature will lead to changes in the geographic distribution of animal and plant species; suitable regions and species distributions may change or be transferred to other regions; and suitable habitats will decrease over time [10,11,12]. One example is that the potential distribution of invasive plants in Australia will gradually shrink to the south. In addition, global climate change will further threaten the survival of local species [4,13,14]. Under appropriate conditions, invasive species can change the species composition of invaded regional ecosystems through species competition, predation, and changes in materials cycling, thereby threatening and reducing suitable areas for local, native species [15,16,17]. Species that can withstand a wider range of environmental conditions are likely to be more aggressive, for instance, because of the low soil-nitrogen requirement of Myrica faya, in Hawaii’s young volcanic sites, M. faya has a wider range of niches than do native plants, so the invasion of M. faya changed the local ecosystem [18].
Invasive plants (IPs) refer to non-native species that have been accidentally or intentionally introduced into habitats other than their current or historic native distributions and have adverse impacts on the economy, ecology, or environment, as they spread through the introduced area. They display many characteristics, such as adaptation to a wide climatic range, environmental tolerance, rapid growth, and high levels of asexual reproduction [19]. However, in the process of plant invasion, the role of human activities should not be ignored. The impact of human activities on the environment may be equivalent to climate change, astronomical change, and geological forces, and these factors together promote changes in the ecological processes of the Earth [20]. In addition, human social activities accelerate the entry of IPs into new environments, threatening biodiversity in the invaded areas and potentially destroying local ecological balance. Therefore, human activities not only affect societal development, but also have a great impact on species diversity and ecological balance [21].
With the continuous change of climate and increasing intensity of human activities, nearly a sixth of the world’s land surface is currently vulnerable to invasive species. Their impact on the distribution pattern of invasive species is increasing, and the environmental adaptability of invasive plants is also increasing [22]. In recent years, the impact of human activities on the natural environment has become more obvious, mainly reflected in the expansion of urban scale, the increase of greenhouse gas emissions, and changes in global land use [23]. At present, human activities have caused dramatic changes in the Earth’s surface coverage and atmospheric environment, leading to global climate change, rising temperature, desertification, and drought risk [24]. Influenced by climate change and human activities, IPs may change their distribution and diffusion pathways. For instance, the increasing number of roads provides new dispersal pathways for IPs. Human disturbances often cause local ecosystem changes, resulting in the fragmentation of local plant habitats and making them more vulnerable to invasion [25,26]. Therefore, due to the impact of climate change and human activities, IPs increasingly threaten biodiversity and ecosystem integrity [27]. Recently, there have been studies on IPs in local areas, usually focused on the impact of future climate change. Most of these studies use climate factors as variables and use species distribution models for simulations and predictions. Some of these studies focus on the projection of multi-species distribution in the context of future climate change. For example, one found that suitable habitats of five IPs in the Himalayas will change in elevation [28]. Other research assessed the suitable habitat and potential impacts of the invasive plant Cryptostegia grandiflora (rubber vine) in the Afar Region of Ethiopia [29]. Some scholars study the distribution of species on different scales. One study found that the invasion of Artocarpus heterophyllus (Moraceae) into the Atlantic Forest can affect the shape and magnitude of the spatial pattern of local endemic aromatic fruit tree species [30].
In recent years, studies on the simulation of plant species distribution and habitat suitability have focused more on endangered species, medicinal plants, and crops [31,32,33,34]. However, few studies have focused on simulating the habitat adaptability for IPs. At present, species distribution modeling (SDM), also known as ecological niche modeling (ENM), has been widely used in the impact of climate change on species’ habitats [35]. Among them, Maximum entropy (MaxEnt) is widely used, but Generalized add model (GAM), Random Forest (RF), and Bayesian models (BA) are also commonly applied [36]. MaxEnt was used to simulate the potential distribution of Tricholoma matsutake under the current climate scenario, and its prediction accuracy was satisfactory [37]. The potential distribution of the endangered species Abies chensiensis, in China, was studied by using geographic information system (GIS) and MaxEnt, with good predictive ability [38]. RF model generates a large number of classification regression trees, and then selects subsamples for regression analysis [39], which is one of the most accurate models based on classified regression trees; at the same time, RF is very effective in processing large amounts of data [40], handing missing data well. A previous study used an RF model to predict the abundance of multiple tree species in Great Britain, and the accuracy of predictions reached high levels [41]. The large-scale distribution of Pinus yunnanensis was also predicted by RF, and prediction results were better than for other models [42]. Similar studies have been conducted for animals, by using RF to evaluate potential habitats of Syrmaticus reevesii, Manis pentadactyla, and Macana thibetana [43].
Anredera cordifolia (Tenore) Steenis is a succulent perennial climber (vine) native to Brazil. The genus Anredera is composed of 5–10 species from tropical America. Anredera cordifolia belongs to the Basellaceae; it has 3–7 m long branched stems with aerial tubers, fleshy, heart-shaped leaves, red–green stems, and fragrant white flowers borne in racemes [44]. It is suitable for growing in various soils, under humid conditions, and has drought and moisture tolerance. It has a long flowering period, mainly concentrated from June to October [45]. Currently, it is naturalized in many areas (including Australia, China, South Africa, and Croatia) [46]. It was originally used to beautify the environment, and humans have intentionally spread it to all continents, except Antarctica [47]. The A. cordifolia is considered a "transformer" weed in the invaded area. It not only destroys forests, covering trees and shrubs, but also spreads to coastal areas, rivers, and wetlands, gradually replacing native species [48,49]. At present, research on A. cordifolia mainly focuses on its biological properties, invasive traits, analyses of its chemical components, allelopathy, the extent of its spread, and control measures [45,50,51], but less on the impacts of human, ecological, and environmental factors on its spread. Therefore, it is of great significance to study the potential suitable habitat distribution of A. cordifolia under changing climatic scenarios.
To better understand the impacts of these factors, this study combined climatic data with global human footprint data by using RF models to predict the potential suitable habitat of A. cordifolia under the current climate scenario, and those of the 2050s (2041–2060), and 2070s (2061–2080). The changes of habitat area, migration, and the influence of macro-environmental factors were analyzed, and they provided a basis for the ecological environmental protection and long-term protection of other plant species.

2. Materials and Methods

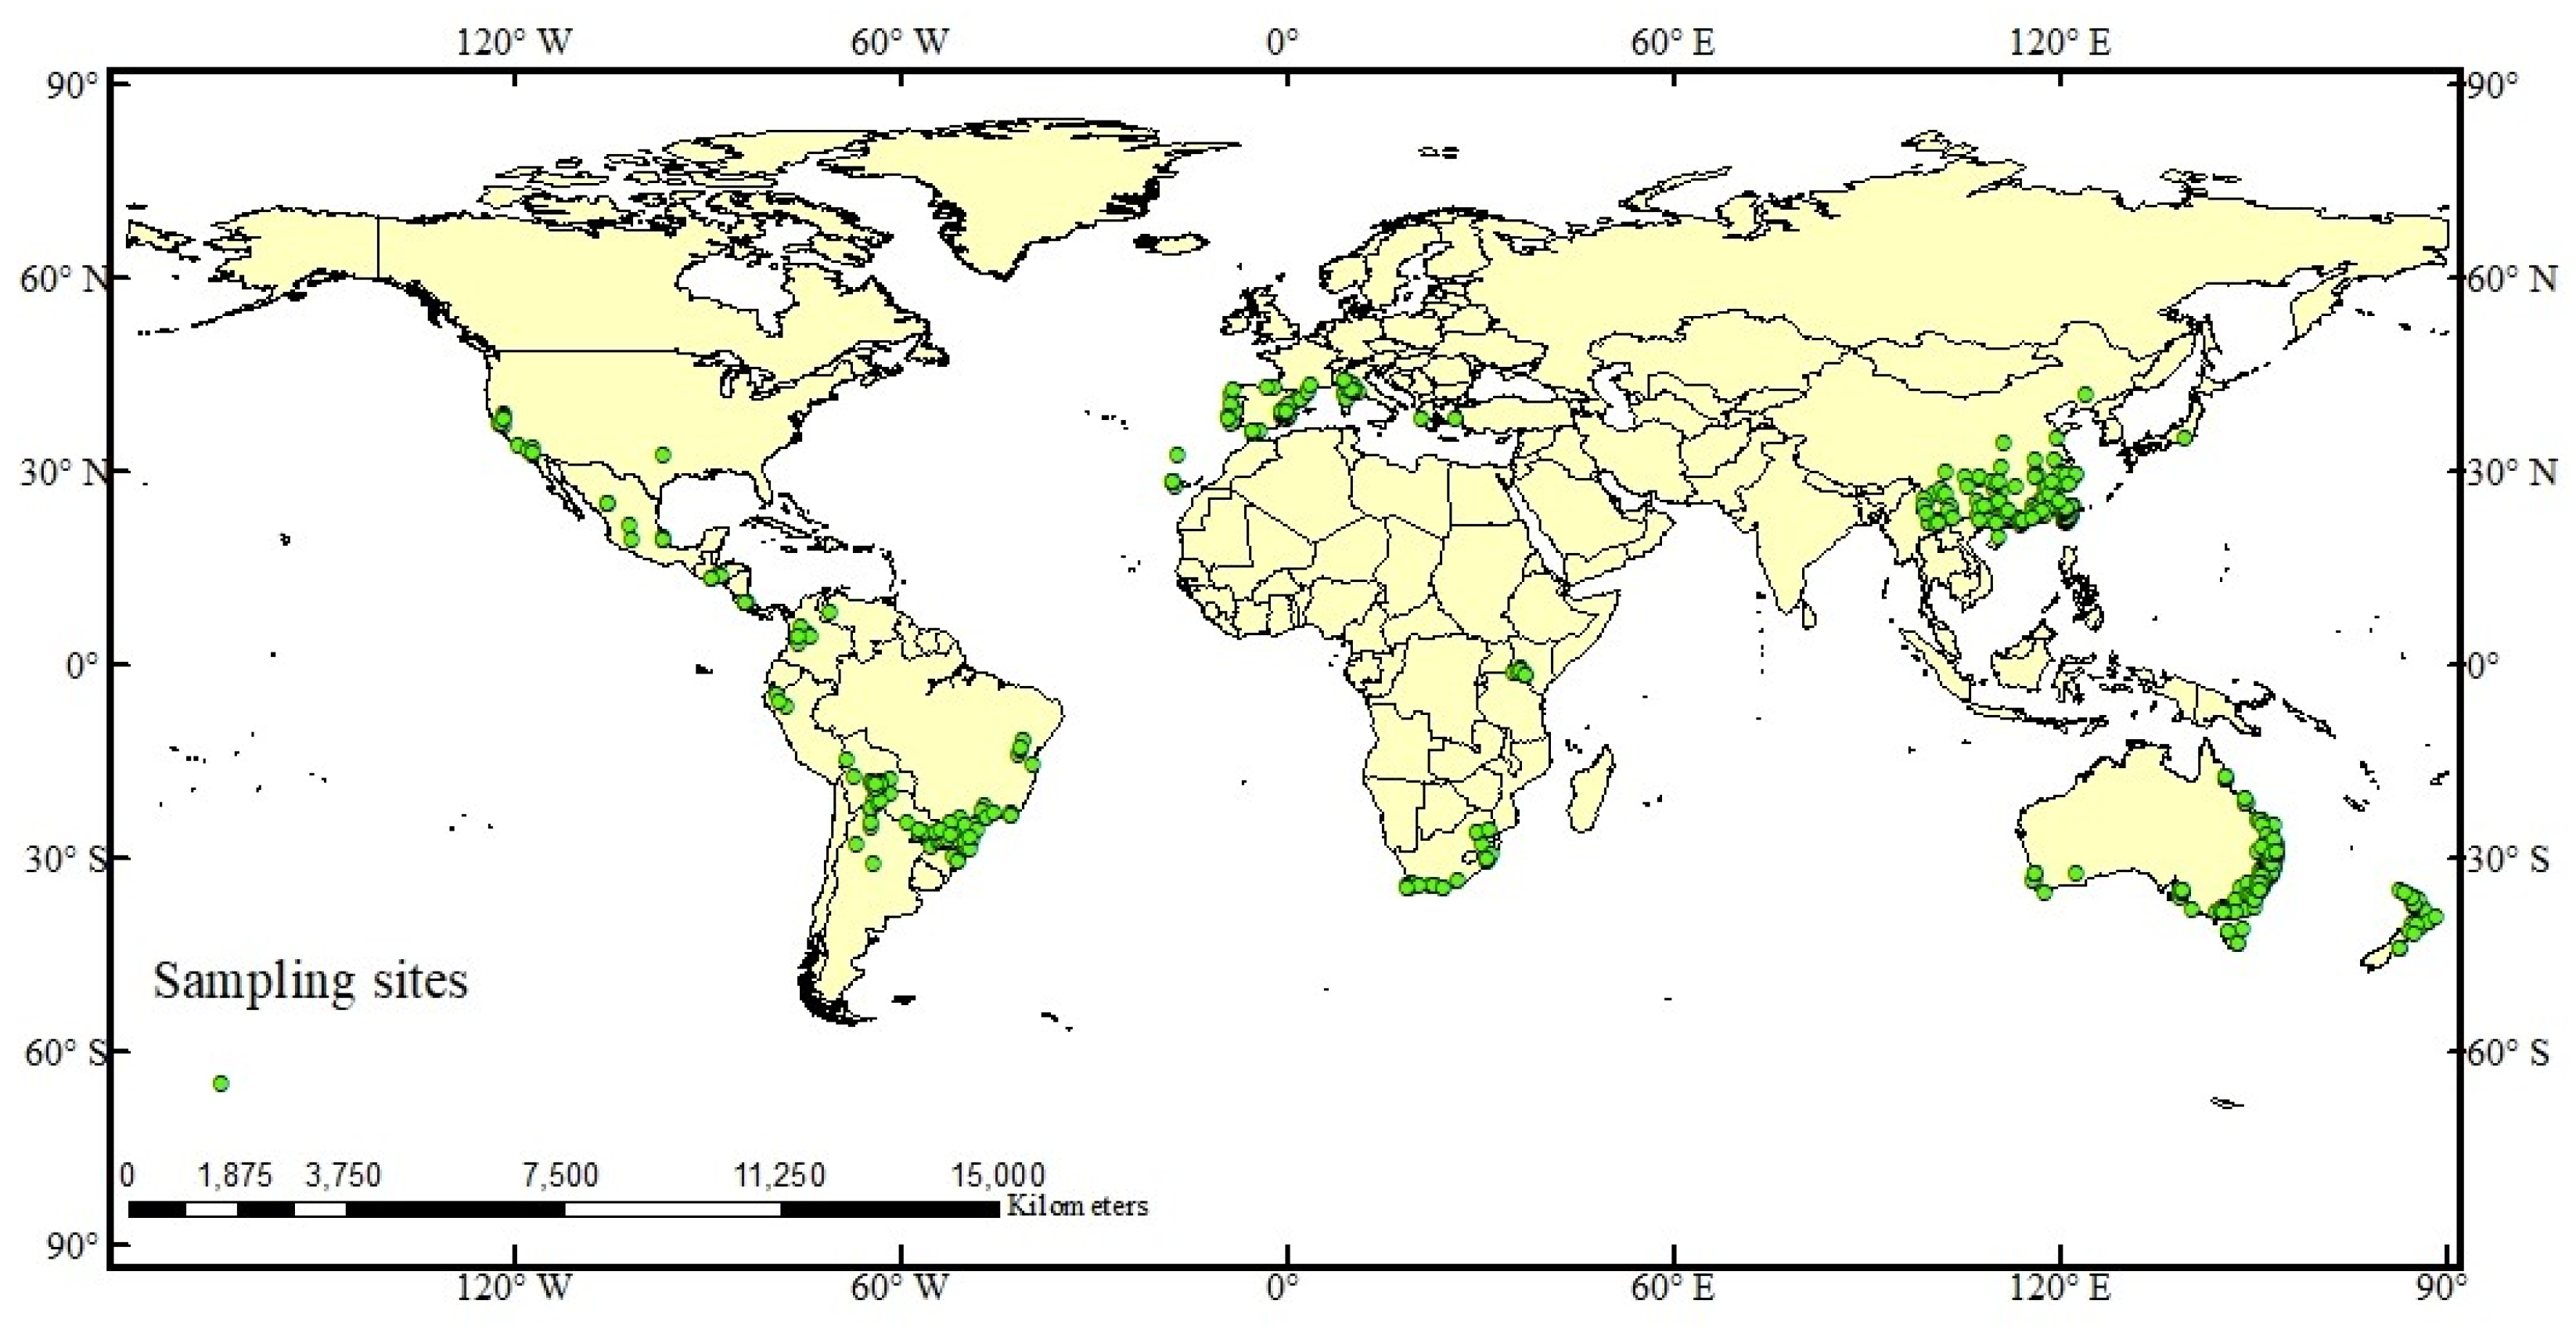
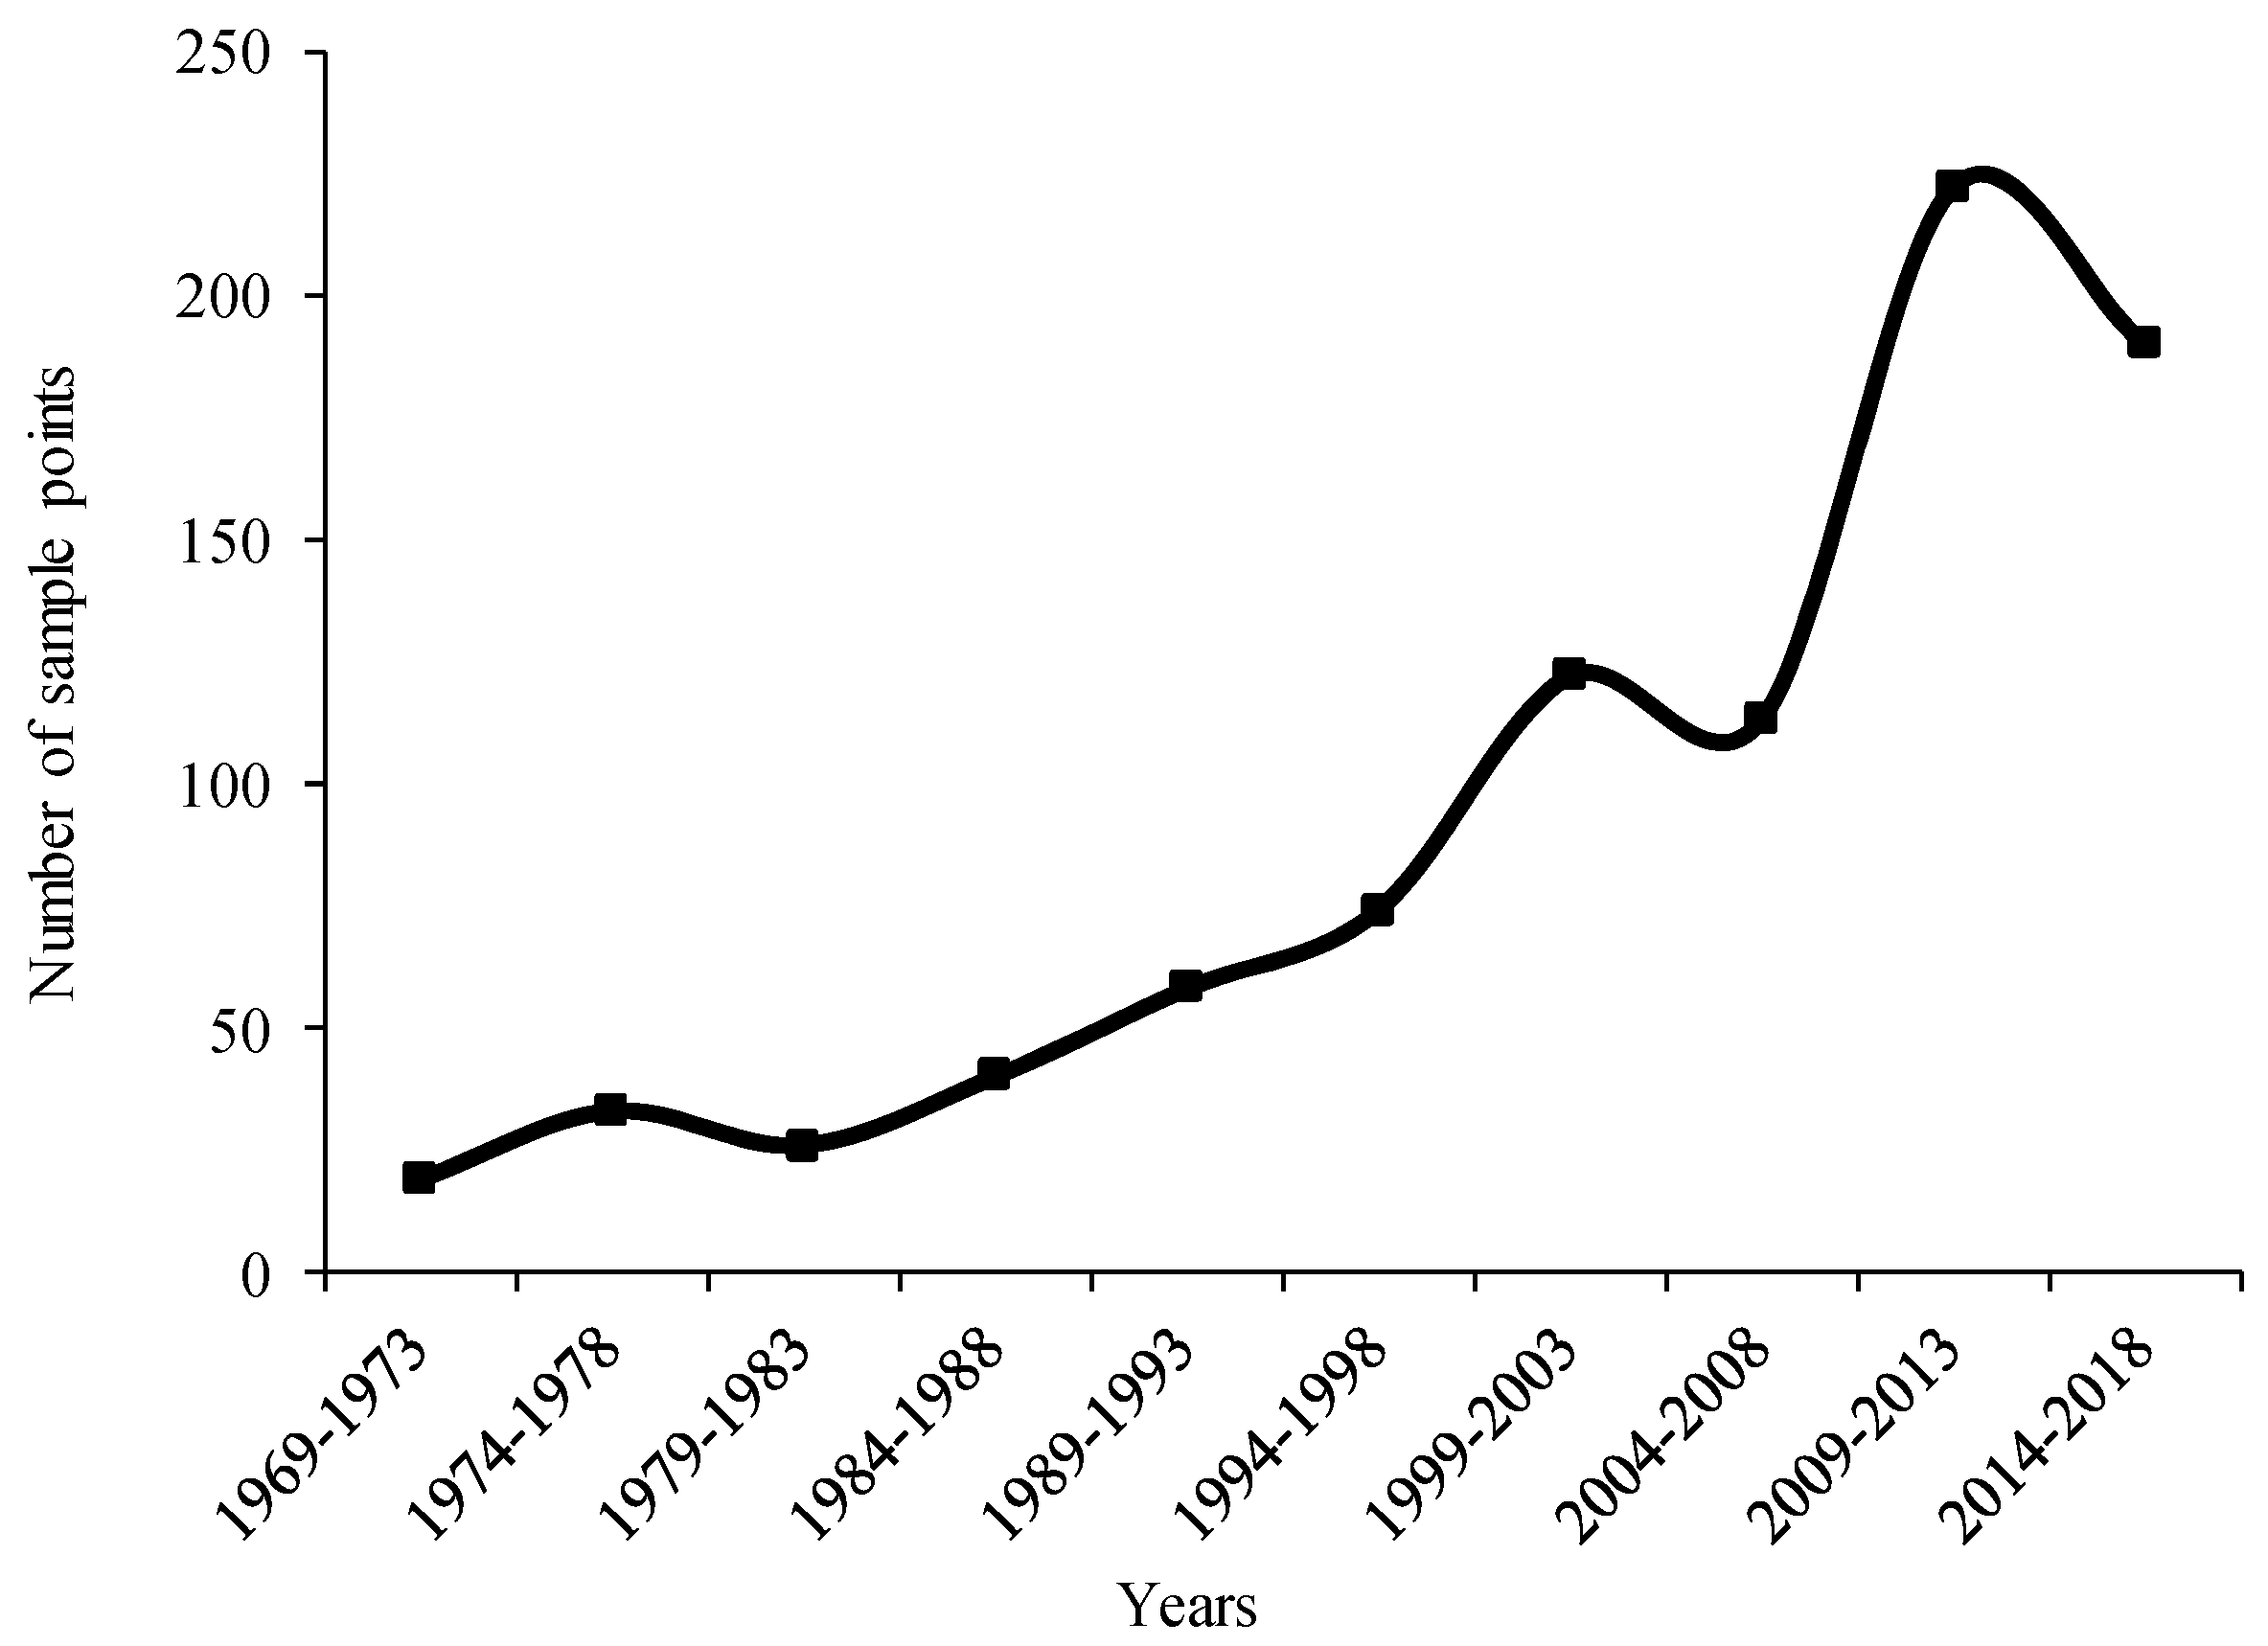
2.1. Species Distribution

Distributional data for A. cordifolia were mainly obtained from the Global Biodiversity Information Facility (GBIF, https://www.gbif.org/). From GBIF and literature reports on the distribution of A. cordifolia worldwide from 1950 to 2018 [52], 1354 initial distribution points were selected. After filtering and processing, 897 unique distribution points were finally obtained (Figure 1). The accuracy of predictions is affected both by the accuracy of distribution points and the total number of points. To expand the volume of data, we generated pseudo-existence points as part of the modeling process. The selection and quality of pseudo-existence point data also affect the prediction results of the model. Generally, methods for generating pseudo-existence points are based on random generation, spatial data, or environmental factors. [53]. In this study, a global random point was created by setting the command of randomly generated pseudo-existence points in R ver. 3.3.2 (http://www.r-project.org/), and 2000 pseudo-existence points were generated for this modeling operation.

2.2. Environmental Data

Climate variables include temperature and precipitation, which are two of the most crucial environmental variables affecting vegetation distribution and plant species diversity. Thus, we used 19 bioclimatic variables (Bio1–Bio19) of the Community Climate System Model 4 (CCSM4), which can explain the physiological and ecological tolerance of plants well [5]. Current and future climate variable data were downloaded from WORLDCLIM version 1.4 (http://www.worldclim.org), on a global climate grid with a spatial resolution of 30" (about 1 km2), obtained through interpolation of global climate sites. We began with environmental data from the current period (1950–2000), to model and predict plant invasion. Environmental data from RCP4.5 (middle greenhouse gas emission scenarios) and RCP8.5 (highest greenhouse gas emission scenarios), in the 2050s (2041–2060) and the 2070s (2061–2080), were then applied to simulate the future potential distribution of A. cordifolia. To avoid correlation between bioclimatic variables, which can cause errors in the prediction results, according to the biological characteristics of A. cordifolia, only one of the two factors with a Pearson correlation coefficient less than 0.8 was retained to participate in the modeling. In this study, 13 factors were selected to participate in the modeling (Table 1). DIVA-GIS software was used to convert climate data into grid format for R modeling.
The human activity data used throughout this paper are from the 2009 global human footprint dataset (Table 1), including the environment, population density, power infrastructure, crop land, pasture, roads, railways, and waterways, which are aspects we included in our modeling. This dataset comes from the SocioEconomic Data and Applications Center (SEDAC, http://sedac.ciesin.columbia.edu/), and the spatial resolution is about 1 km2.

2.3. Random Forest Model

In this study, predictions of the Random Forest model for A. cordifolia were made in Biomod2, a package integrating 10 models in R 3.3.2 [54]. We imported species distribution data and environmental data into R. The distribution data were divided into two parts, 75% as training data and 25% as test data. The accuracy of the model was evaluated by the area under the receiver operating characteristic curve (AUC), Kappa coefficient, and true skill statistics (TSS). AUC is the area under receiver operating characteristic (ROC) curve, which plots 1-specificity as the abscissa, and sensitivity as the ordinate [55]. Kappa coefficient refers to the ratio between the number of observation points that the model predicts correctly and incorrectly. TSS is an improved test index derived from the Kappa coefficient. TSS = sensitivity + (specificity—1); the greater the three values, the higher the accuracy of the model [56] (Table 2).

2.4. Classification of Predictive Distribution

We used the Natural Breaks classification method to categorize suitable habitat, as it maintains the statistical characteristics of the data [60]. The predicted results of RF were imported into ArcGIS 10.2 for re-classification of A. cordifolia. Natural Breaks classified habitat into four grades: unsuitable (0–0.3), marginally suitable (0.3–0.5), moderately suitable (0.5–0.7), and highly suitable (0.7–1). Then we superimposed the map of global human footprint with that of A. cordifolia’s potential distribution for the current period to reveal relationships between the two patterns. We divided the overlay results into four levels: (Ⅰ) areas with the strongest human activities and high suitability distribution area for A. cordifolia; (Ⅱ) areas with strong human activities and moderate suitability; (Ⅲ) areas with weak human activities and marginal suitability; (Ⅳ) areas where human activities are the weakest and habitat is unsuitable for A. cordifolia. The resampling tool in ArcGIS 10.2 spatial analysis module was used to assign values to the suitable habitats of each grade. After that, the area of suitable habitat was calculated to obtain a suitable habitat distribution for A. cordifolia and to further determine its potential invasion risk areas.

3. Results

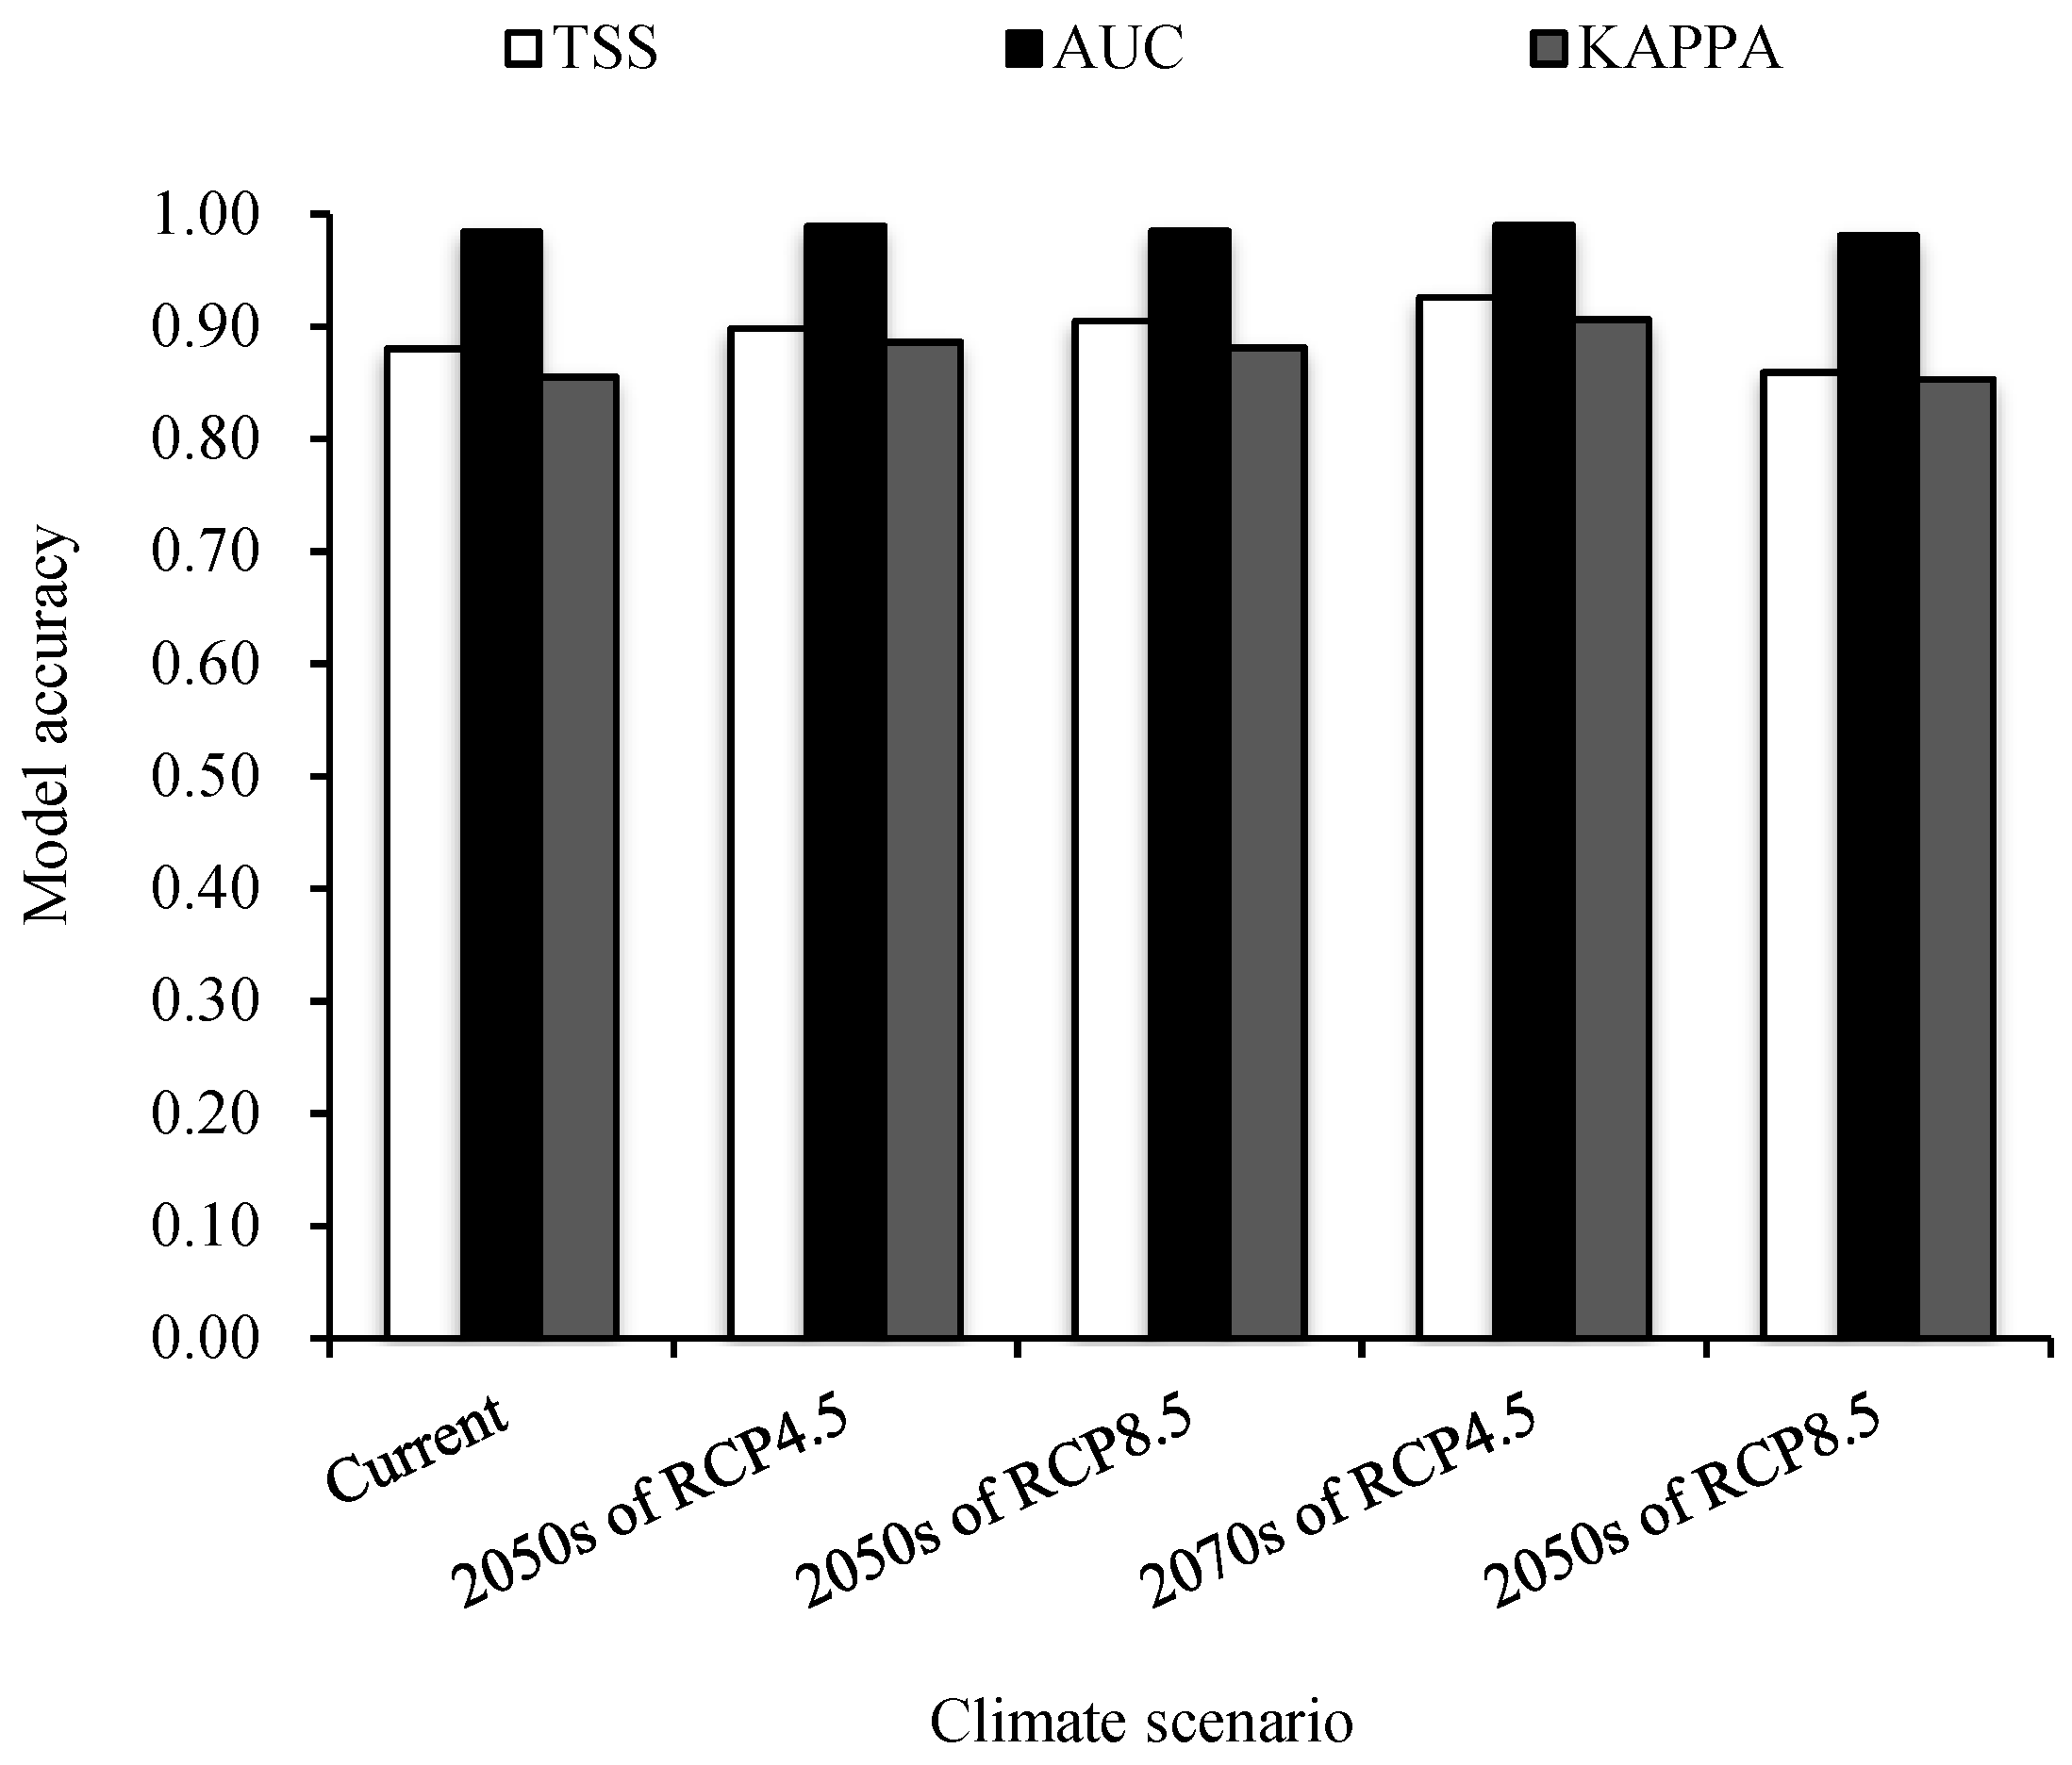
3.1. Precision Test of Random Forest Model

Based on the prediction of the test set data by RF, we obtained the AUC, Kappa, and TSS values of the model in each period. It can be seen that the AUC value of each period is greater than 0.95, and the Kappa and TSS values are greater than 0.85 (Figure 2), indicating that the prediction accuracy of the model is relatively high.

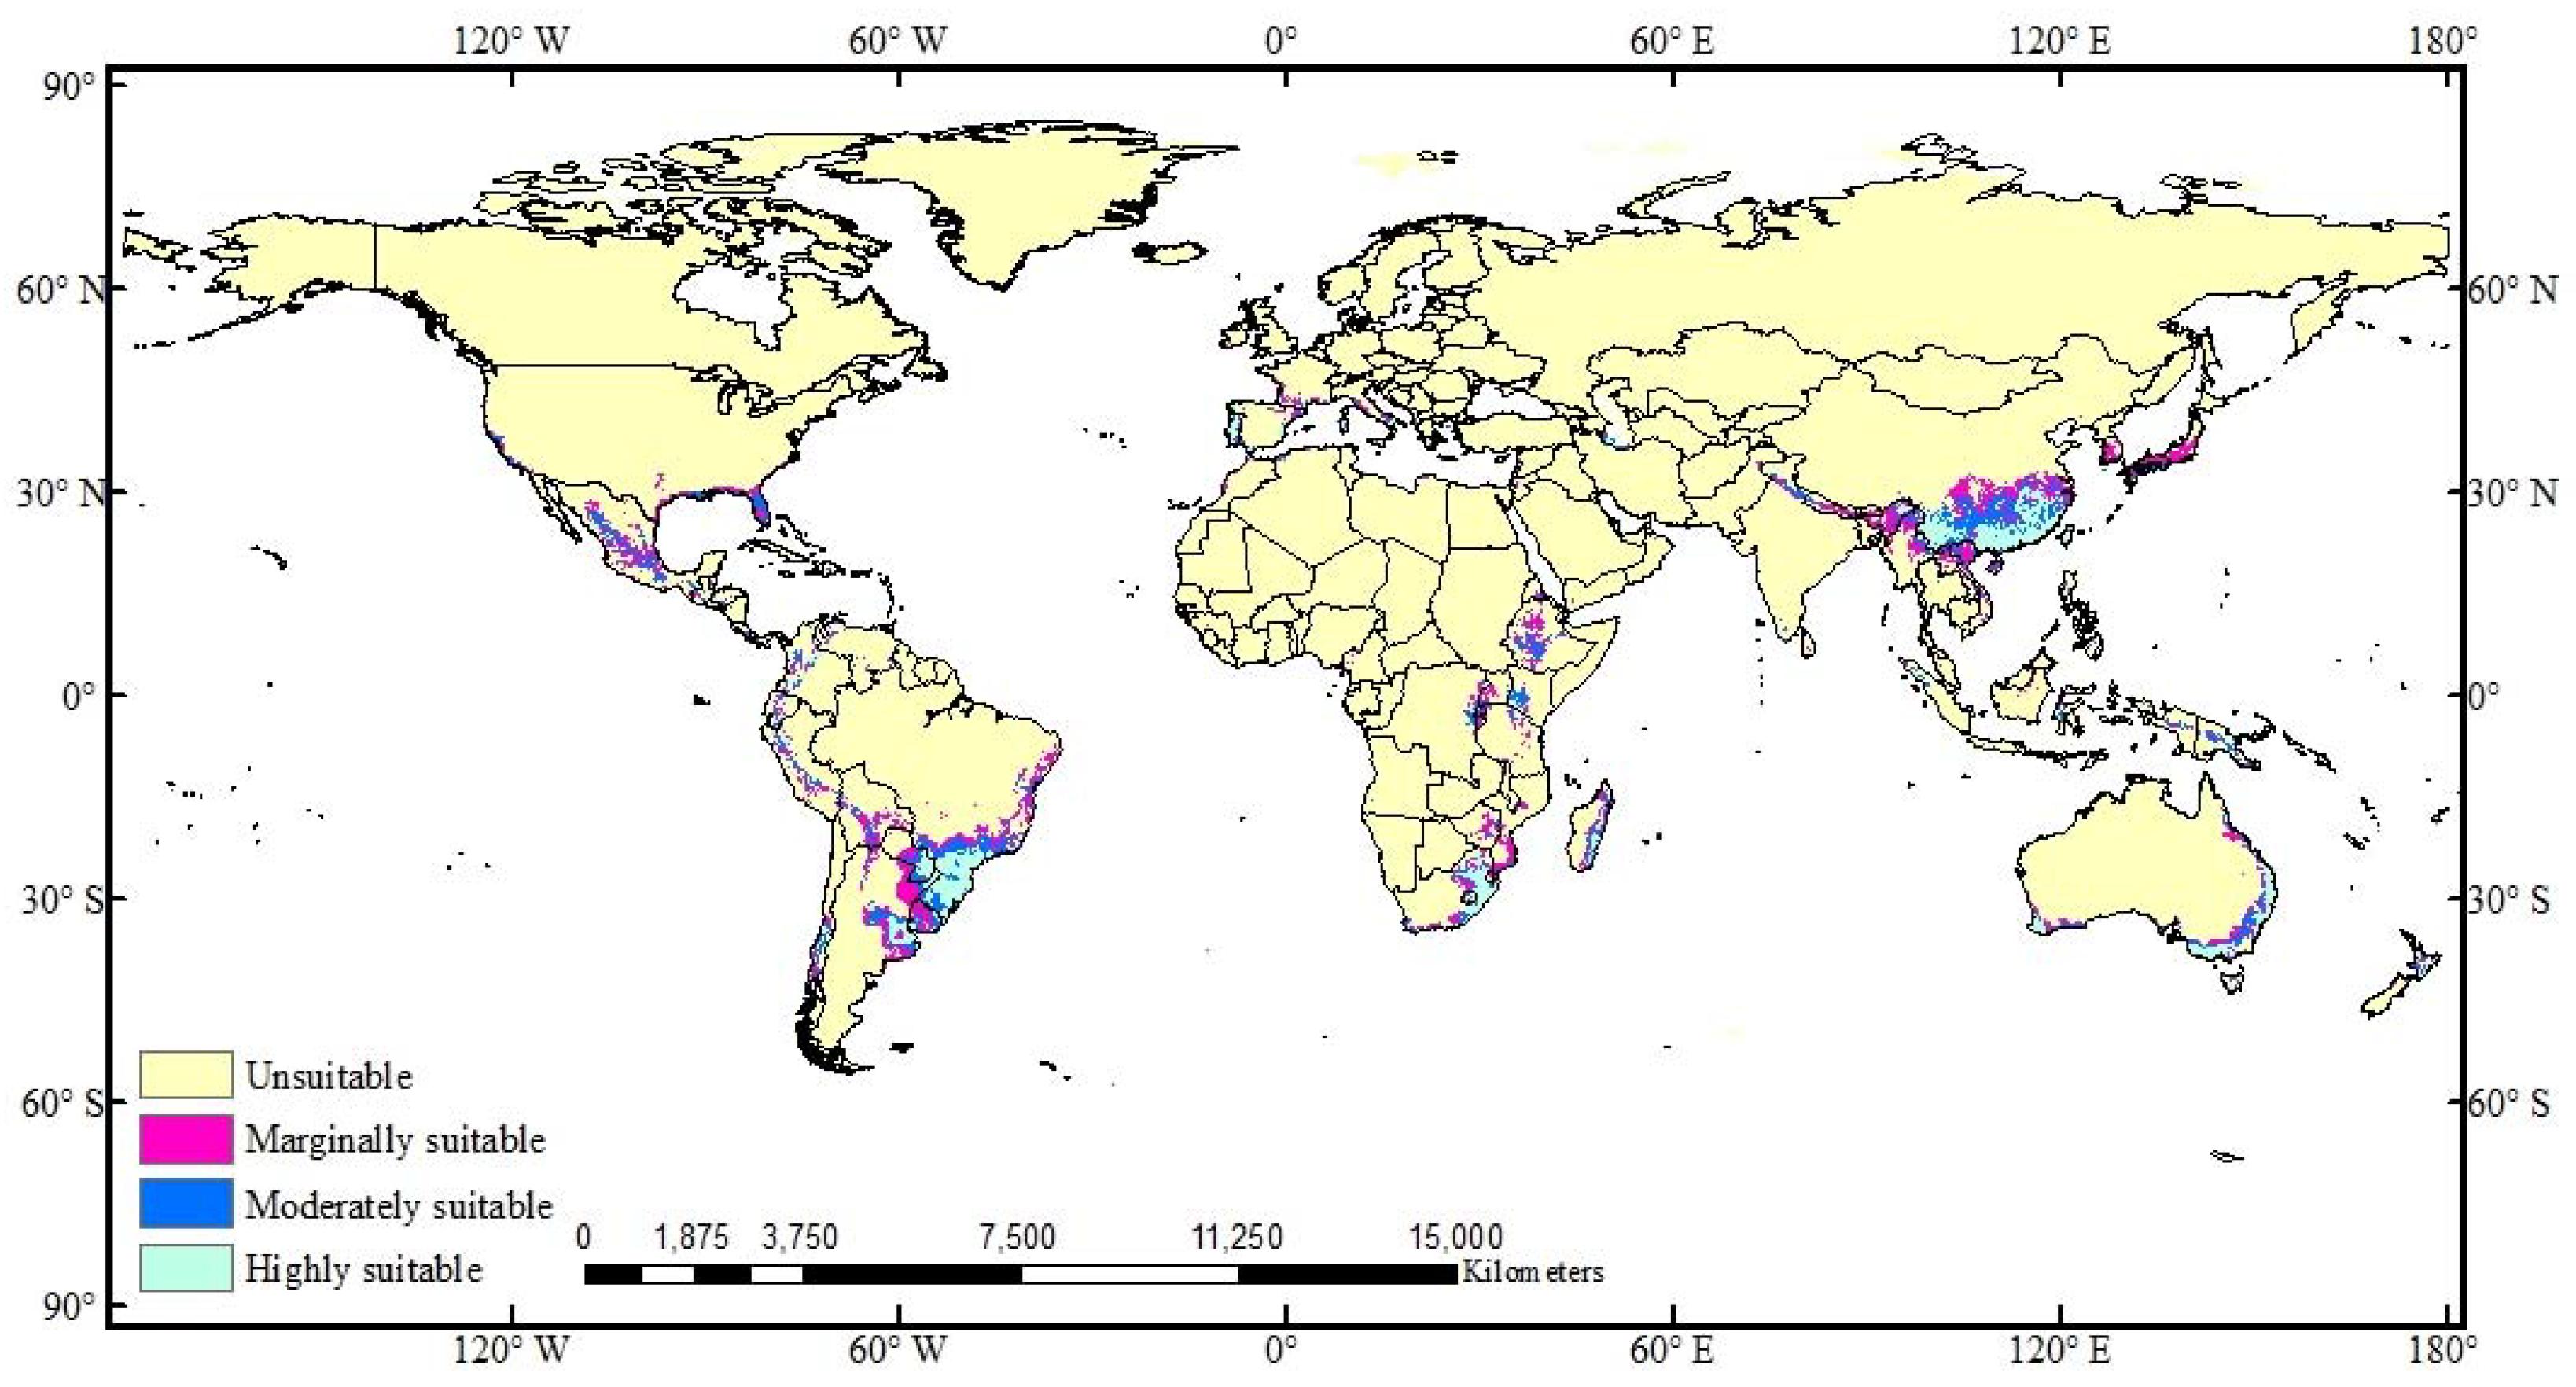
3.2. Potential Global Distribution

The potential global distribution of A. cordifolia was predicted by the RF model. The results showed that A. cordifolia is currently adapted to the southeastern regions of Asia and Africa, the eastern coastal areas of Australia, Florida, and Gulf Coast of the United States, Mexico, and the central and eastern coastal areas of South America (Figure 3).
Under current climatic conditions, suitable areas for A. cordifolia are mainly concentrated between 20° and 35° N or 20° and 35° S; most parts are subtropical monsoon, monsoon humid, or tropical grassland climates [61]. Most regions have abundant rainfall, with annual precipitation > 1000 mm and annual mean temperature ≥ 15 °C. At the same time, the prediction results also showed that the optimal annual mean temperature for A. cordifolia is between 20 and 30 °C. The optimal annual precipitation is 800 to 2000 mm. This is in line with the growth environment of the current distribution.
In terms of global distribution and number of sites, A. cordifolia has a tendency to spread gradually inland from coastal areas, and from 1969 to 2018, the number of A. cordifolia sites generally showed an upward trend (Figure 4). In the 1980s, economic globalization began gradually, and trade among countries increased, accelerating the spread of IPs [62]. Since 1988, A. cordifolia has spread rapidly worldwide, probably because of its increased cultivation, followed by local adaptation. At present, the suitable area for A. cordifolia accounts for about 7.69% of the total research area (Figure 3), which is distributed in all continents, except Antarctica. The distribution area of highly suitable habitat of A. cordifolia is 2.43%. The areas of the highly, moderately, and marginally suitable habitat areas comprise 30.44%, 31.30%, and 38.26% of the total suitable habitat area, respectively (Figure 5).

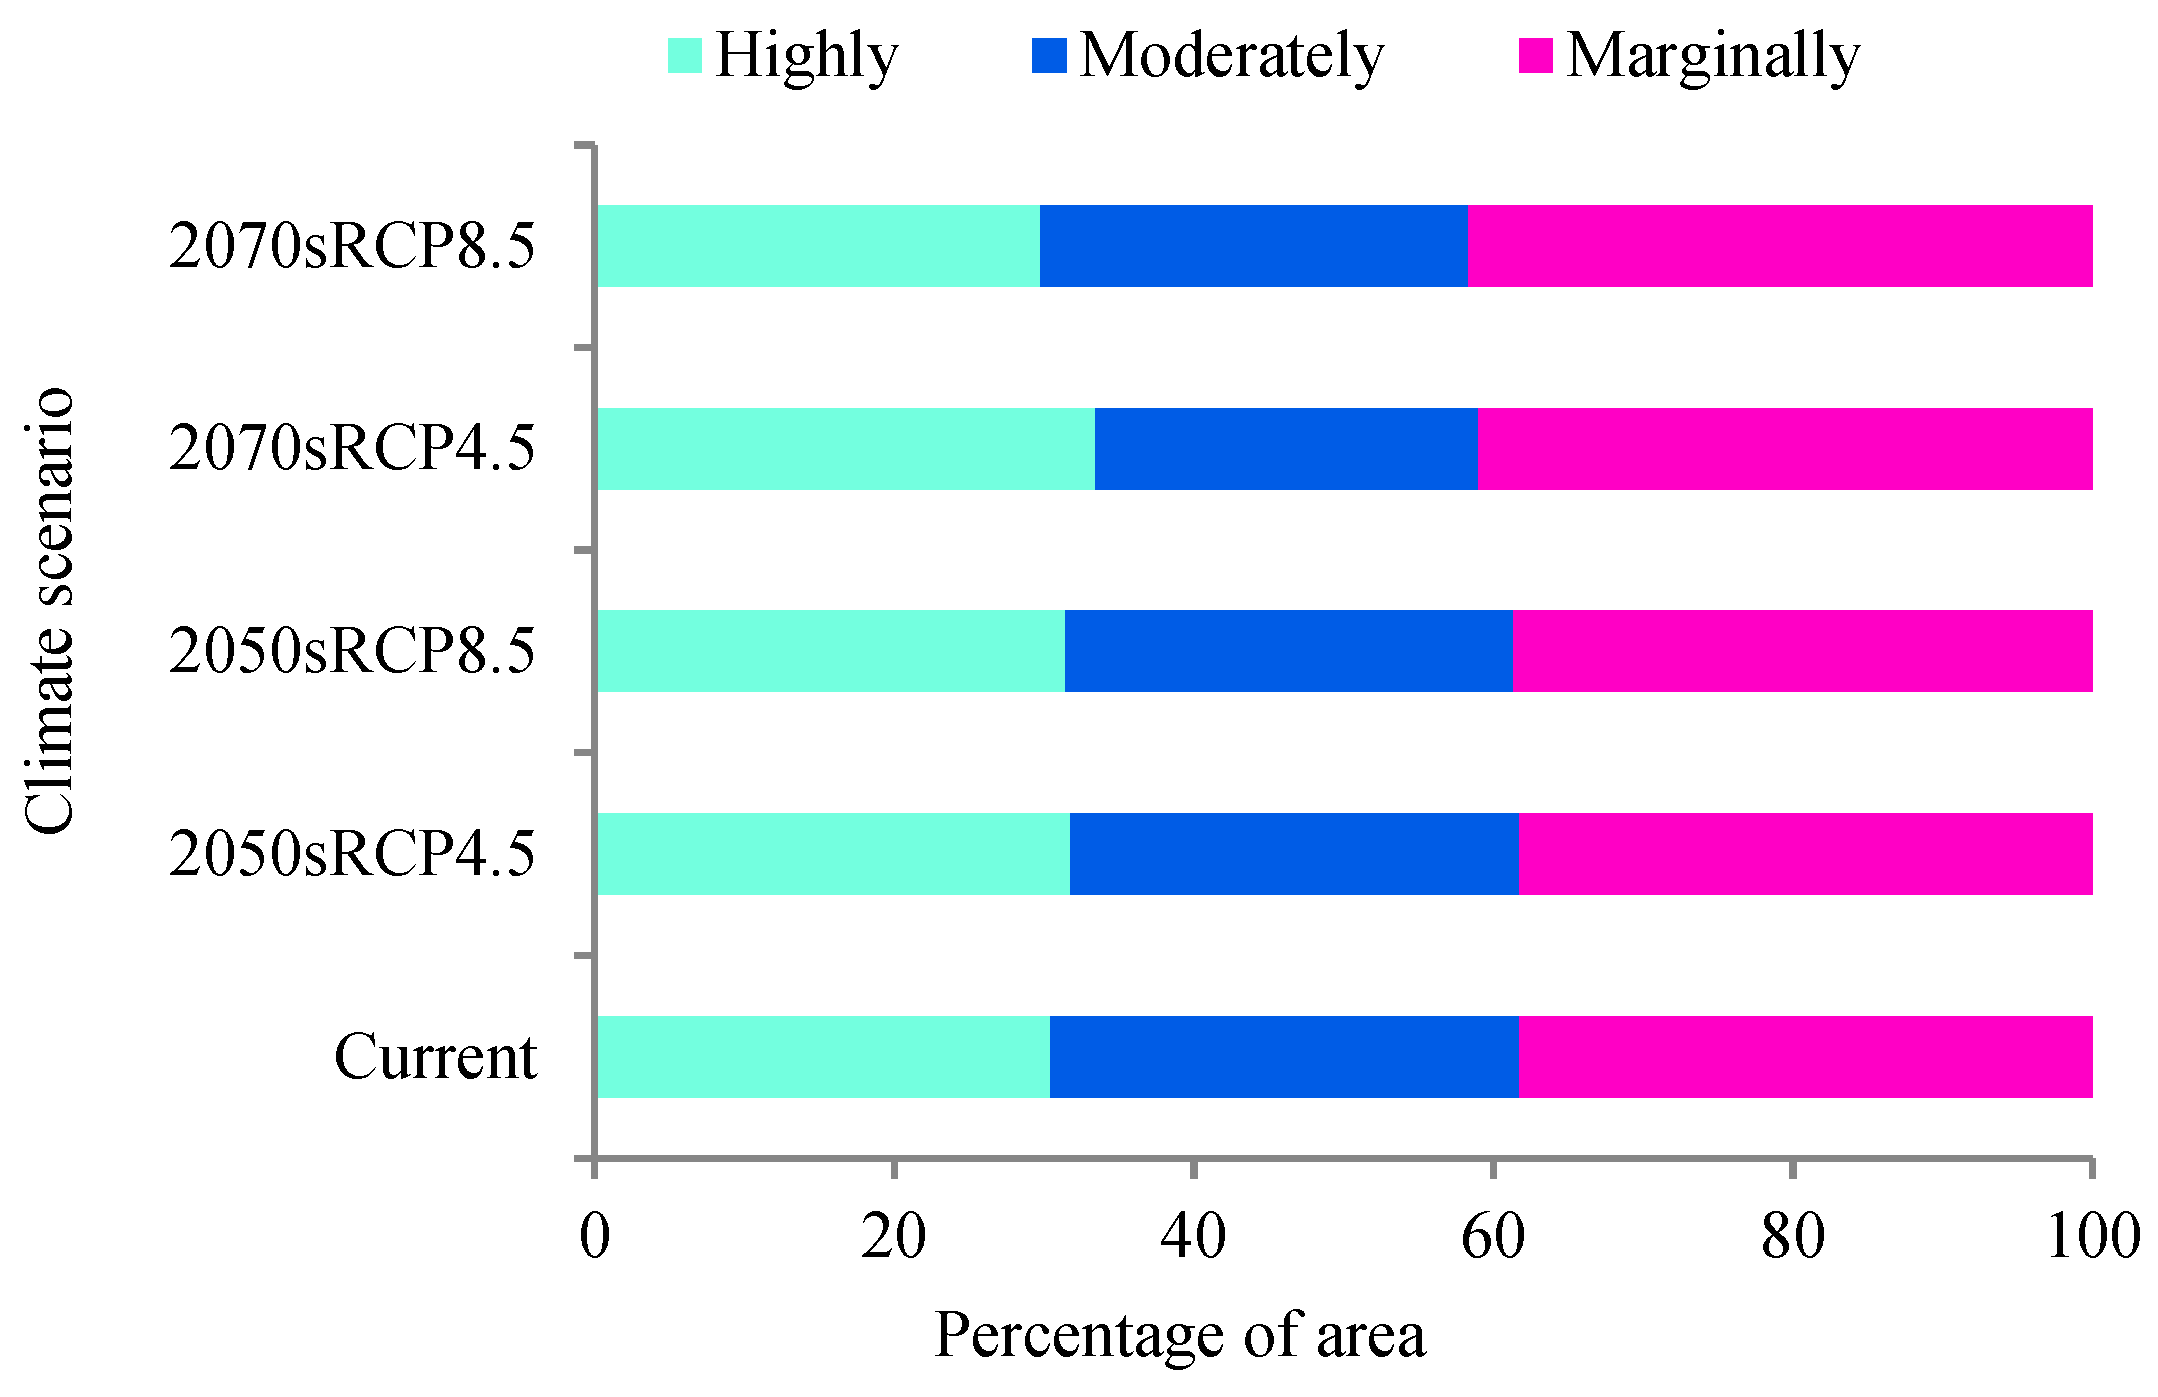
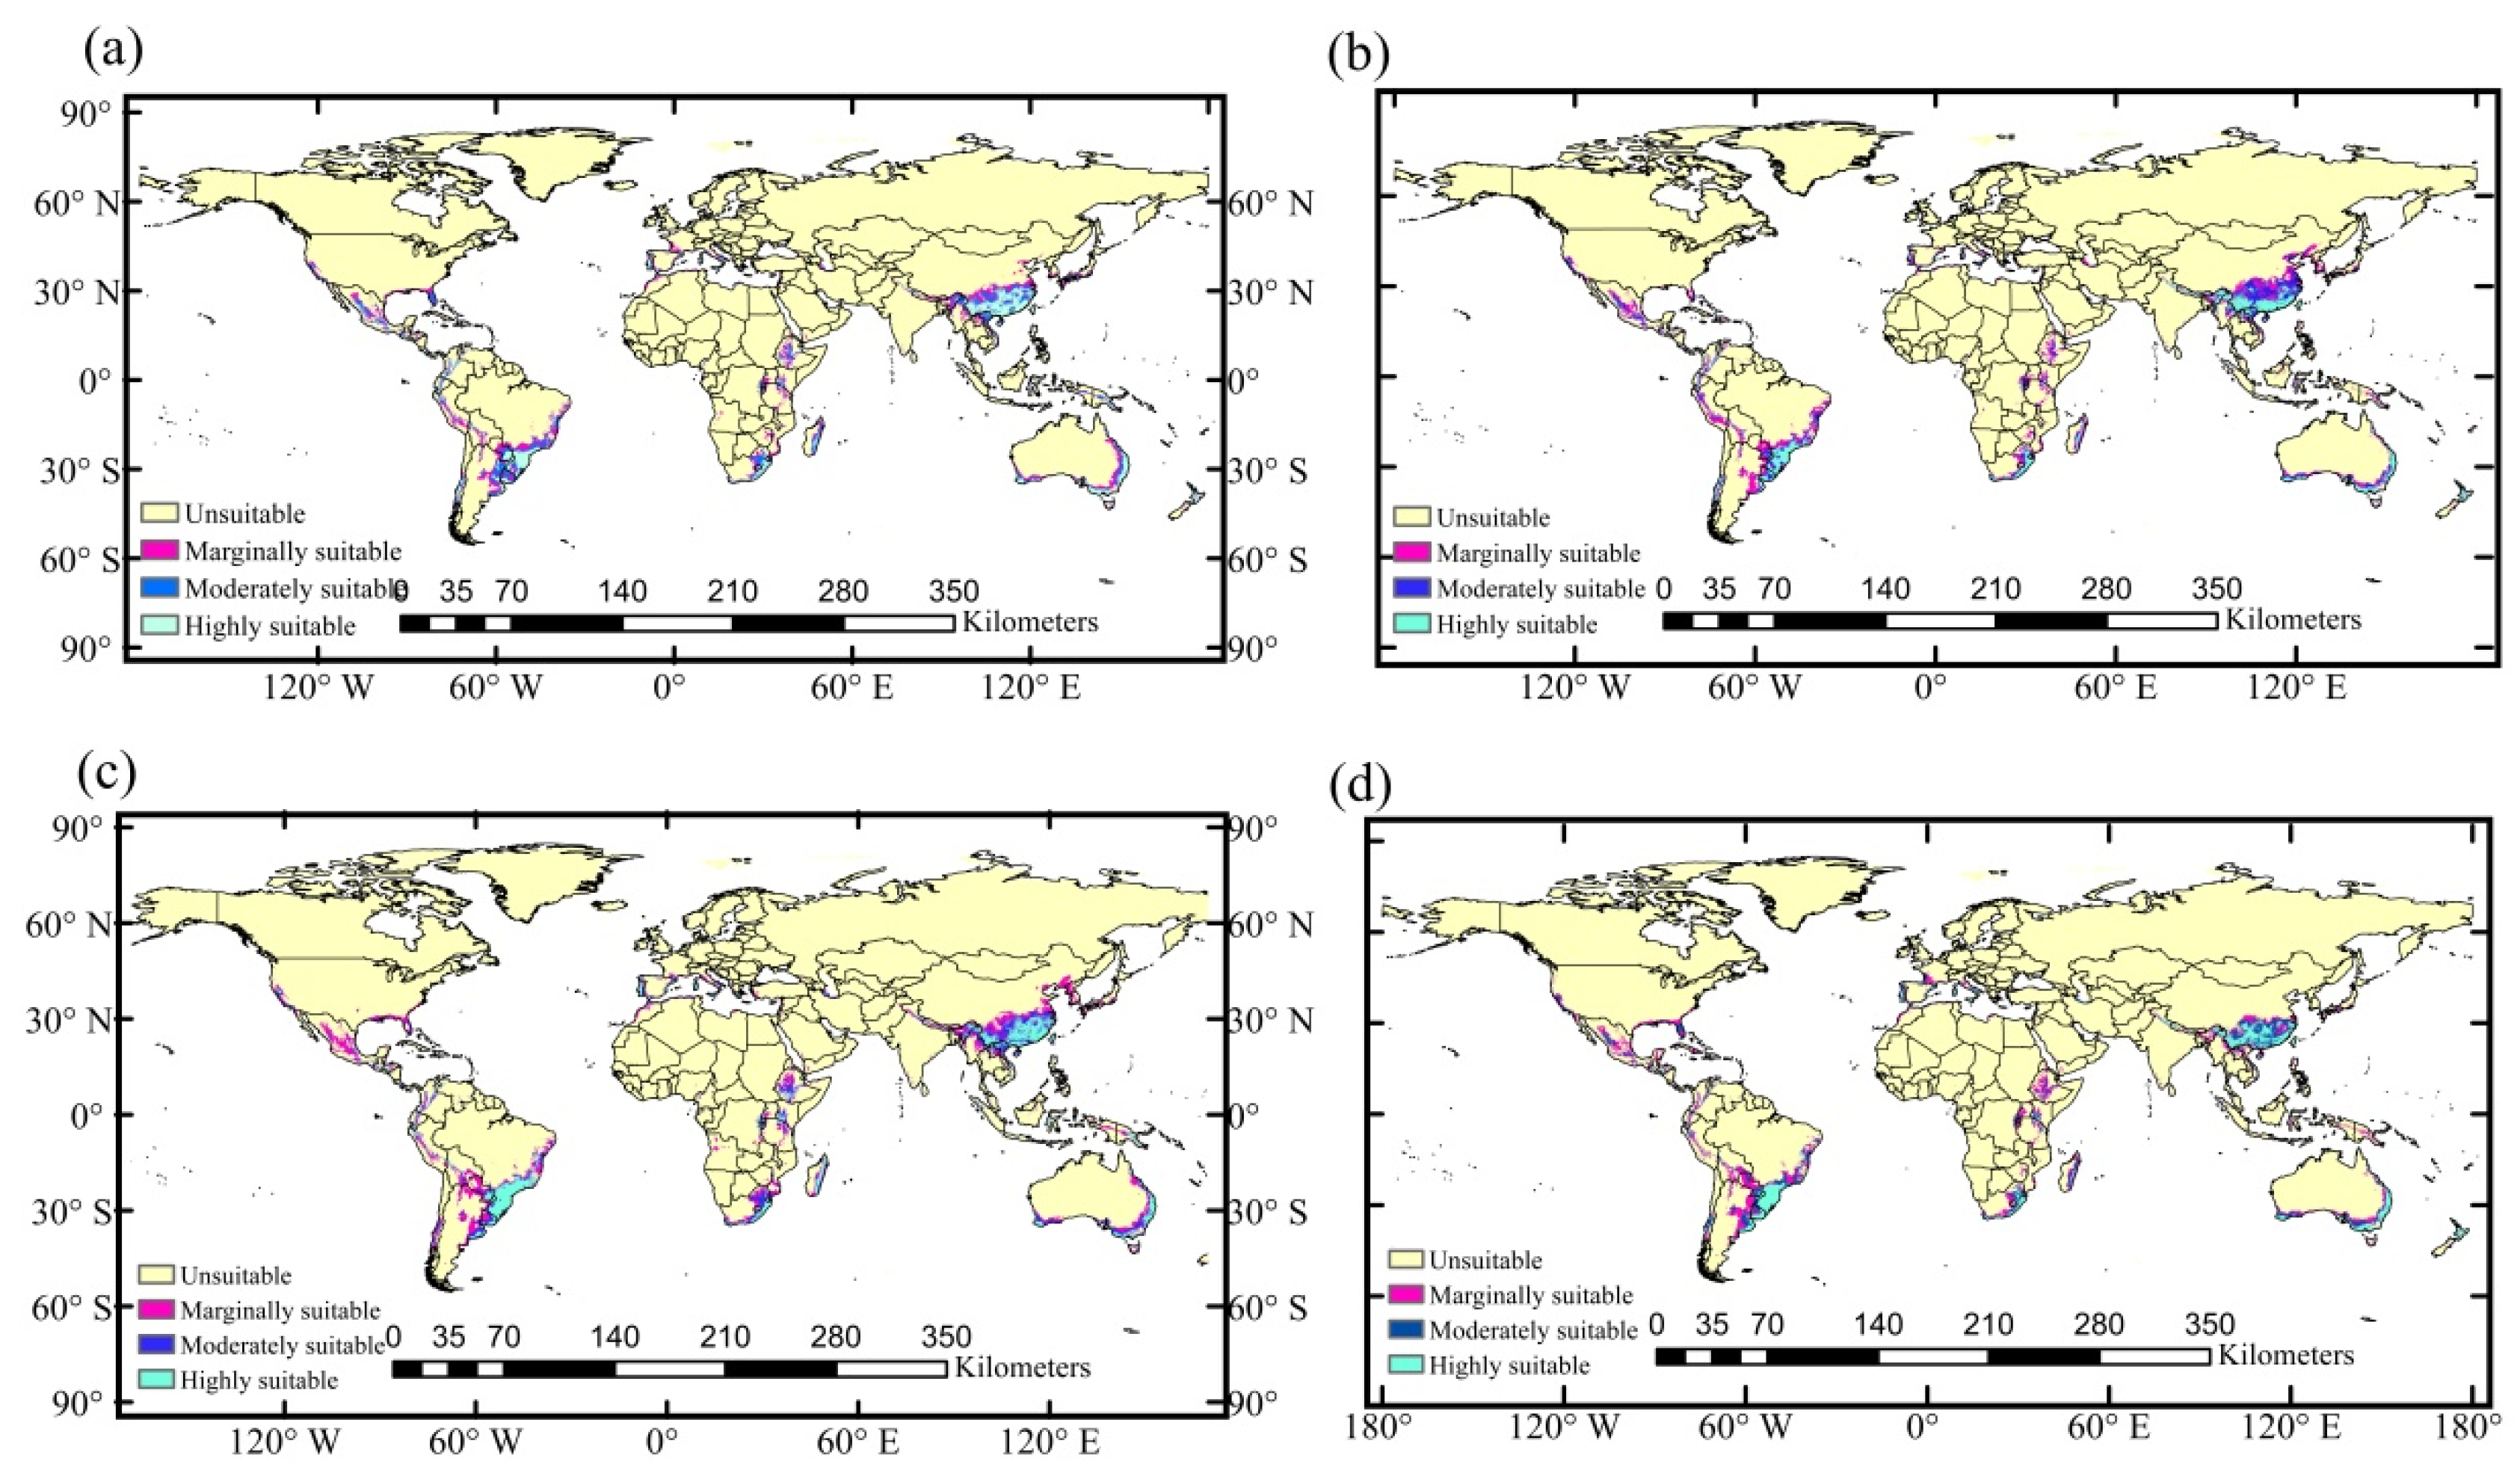
3.3. Predicting Potential Suitable Habitats under Future Climate Scenarios

The four maps of Figure 6 illustrate that the area of highly suitable habitat first increases and then decreases, the marginally suitable area gradually increases, and the moderately suitable area first decreases and then increases. It can also be seen from Figure 6 that the area of suitable habitat in Asia and South America is obviously larger than that in other continents, and highly suitable habitat is concentrated in the regions near 30 °N and 30 °S of those continents. The predicted results show that the suitable habitat will increase over time, and the suitable area has an obvious band-like distribution (Figure 6), extending inland.
From current scenario to RCP4.5 and RCP8.5 of the 2050s, highly suitable habitat area of A. cordifolia increases by 275,370 km2 and 208,929 km2 (Figure 6a,b). From current scenario to RCP4.5 of the 2070s, the highly suitable habitat area of A. cordifolia increases by 619,755 km2, while under RCP8.5 of the 2070s, highly suitable habitat area decreases by 22,559 km2 (Figure 6c,d). In the 2070s, the new suitable habitat area of RCP4.5 is the highest, reaching 2.75%, while the suitable habitat area decreased by 1.28% and disappeared by 1.08% in RCP8.5 (Table 3).
By comparing different future climate scenarios in the future (Figure 6 and Table 3), one can infer that the suitable habitat area of A. cordifolia will increase as the concentration of greenhouse gas emissions increases, but only to a point. When the concentration of greenhouse gas emissions is too high, for example, as RCP8.5 by the 2070s, the new suitable habitat area is the smallest, accounting for 2.21% of the total suitable habitat area, while the areas of decrease and disappearance are the largest in the future climate scenarios, accounting for 1.28% and 1.08% of the total suitable habitat area, respectively. Therefore, we speculate that high concentration of greenhouse gas emissions may affect the growth rate or competitiveness of A. cordifolia, inhibiting its spread.

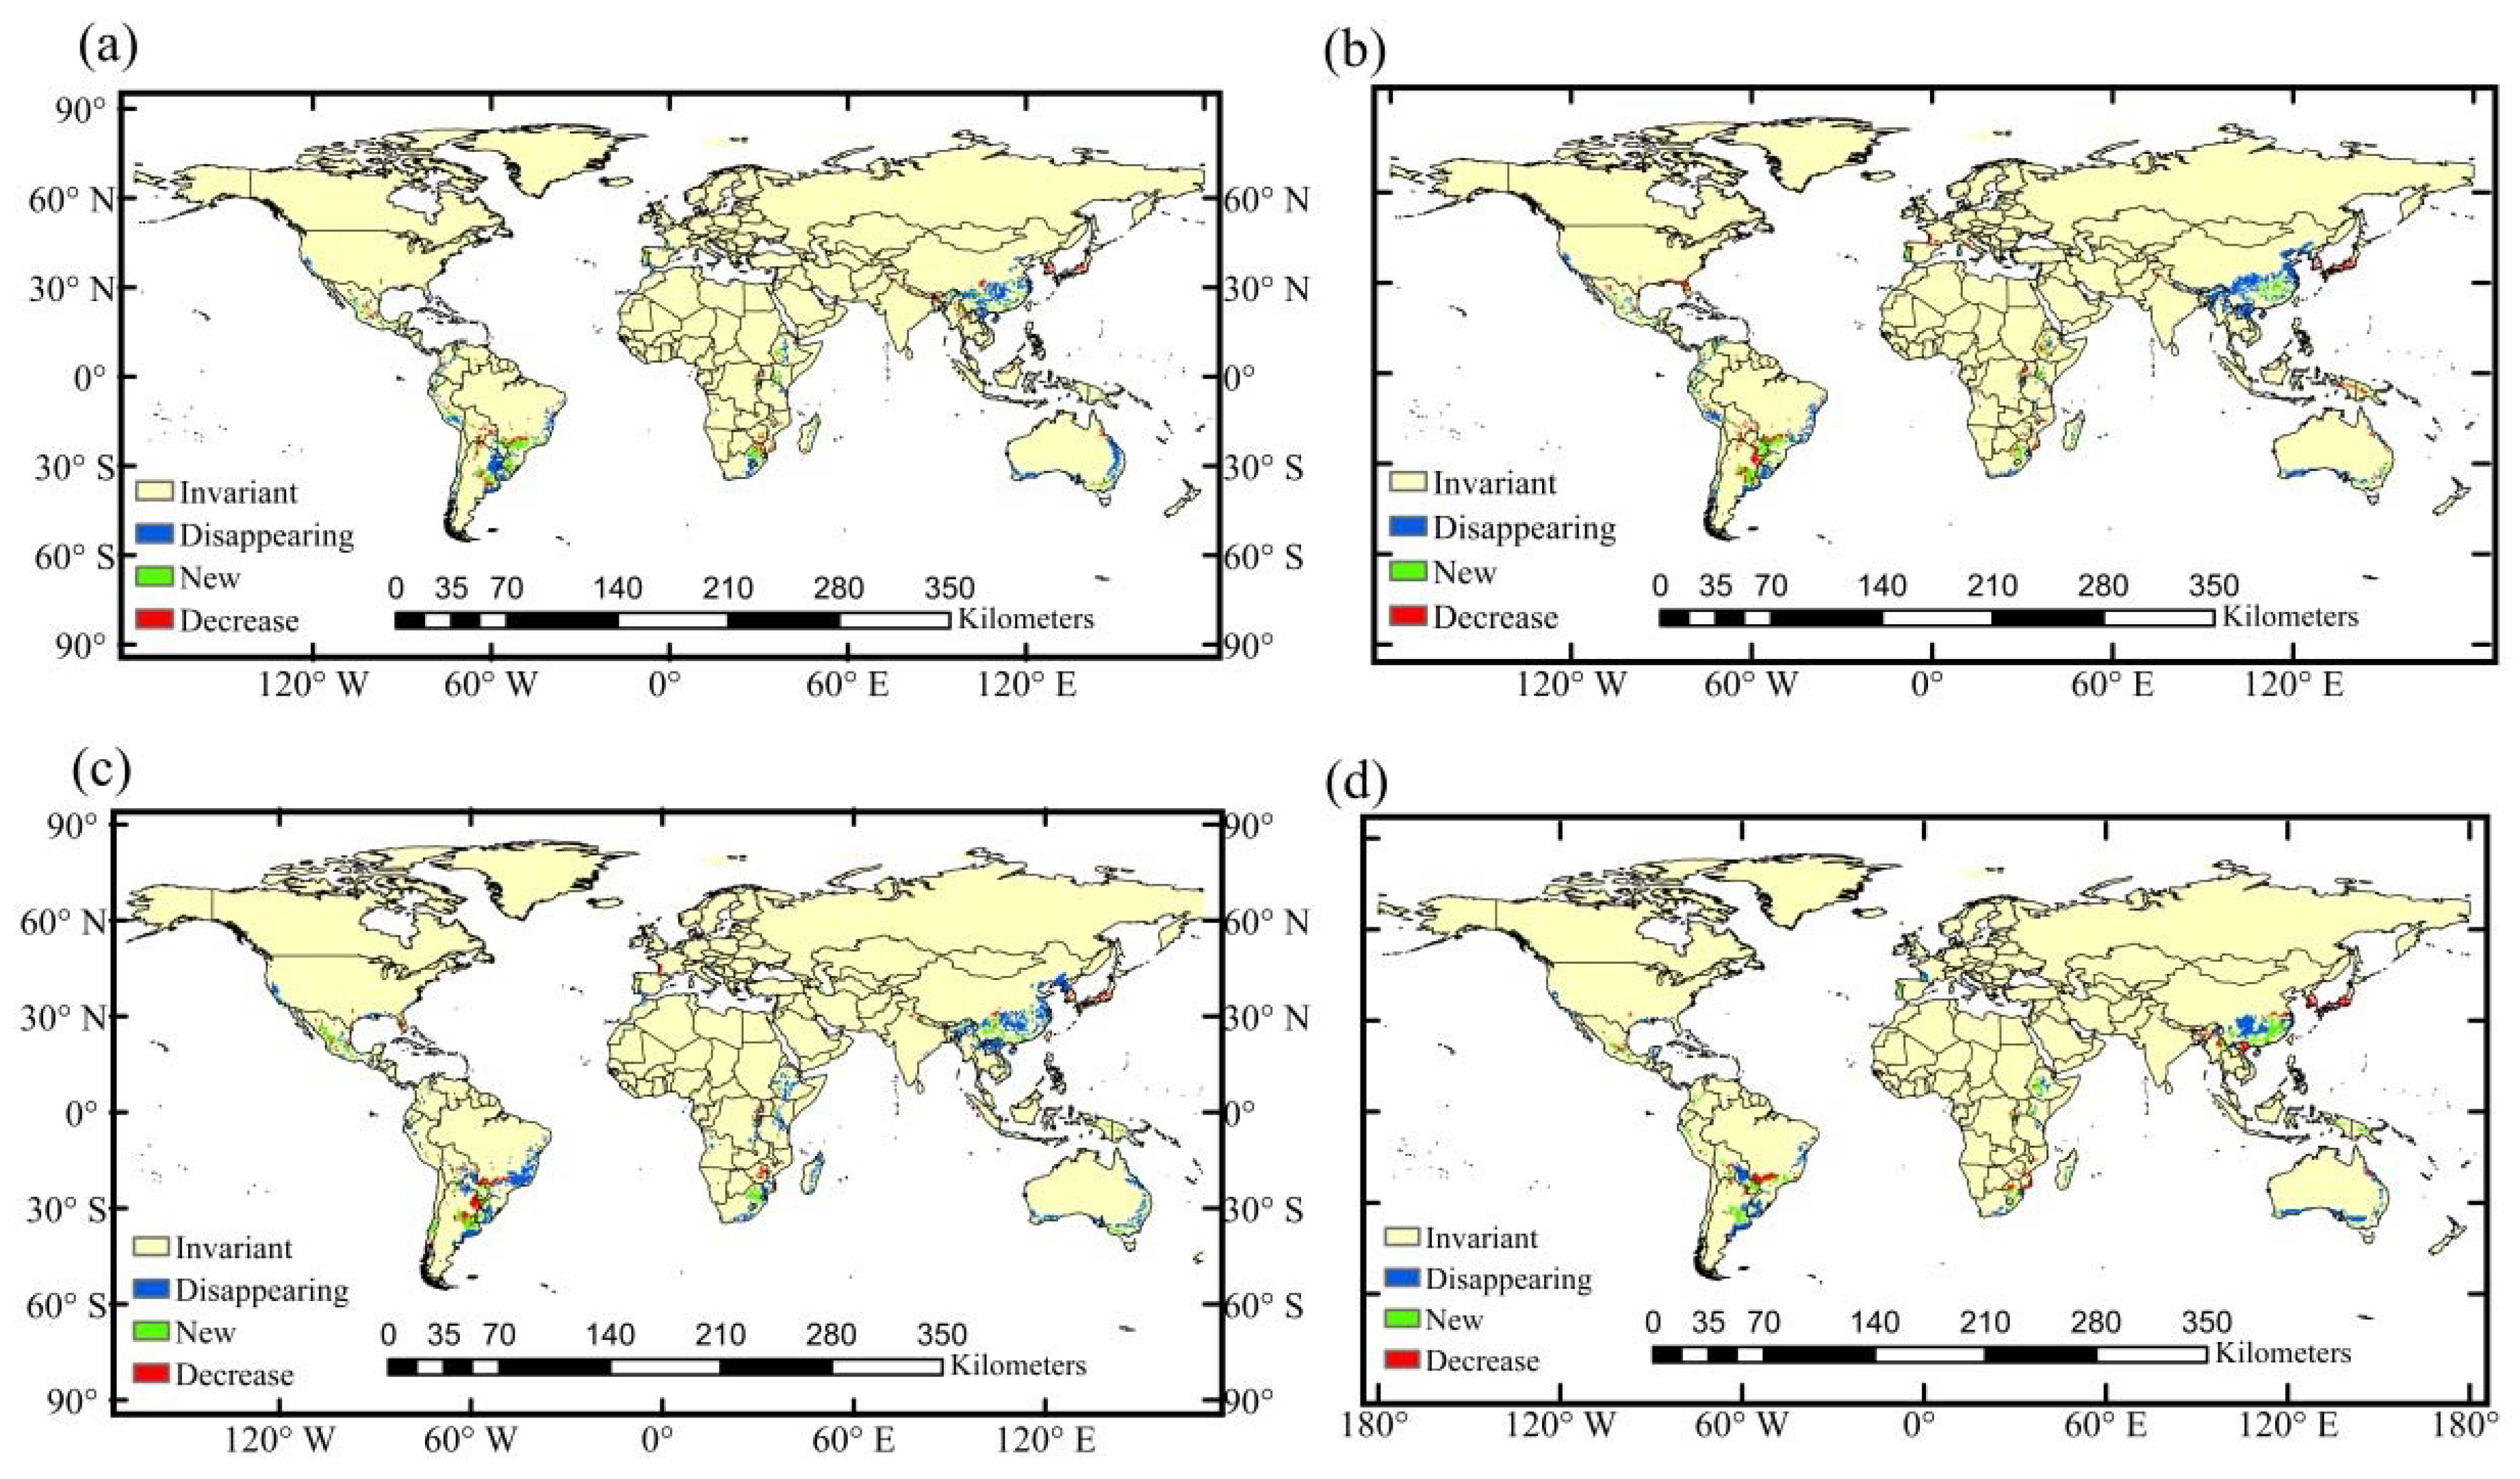
3.4. Potential Suitable Habitat Change in the Future

Moving from the present to the 2050s, under these climate scenarios, highly and marginally suitable habitats of A. cordifolia both show increasing trends (Figure 6a,b). Moreover, under RCP4.5, by the 2070s (Figure 6c), the area of moderately suitable habitat should decrease. Under RCP8.5 (Figure 6d), the total suitable habitat decreases by 0.13%, and the highly and moderately suitable habitat areas decrease; but the area of marginally suitable habitat will increase.
From the current period to 2050s, the suitable habitat that will disappear is concentrated, and the new suitable habitats are increasingly scattered (Figure 7a,b). The new suitable habitats will be concentrated in Southeastern Africa and the central and eastern parts of South America, roughly centered on 30 °S. The results indicate that temperature is the common factor affecting the distribution of A. cordifolia in different regions. Habitat losses are mainly located in the northern and western margins of the original highly suitable habitats, concentrated in China, Oceania, and South America. As for the 2070s, the new suitable habitat range of A. cordifolia will be obviously larger than that of the 2050s, mainly distributed in Sichuan, Yunnan, Guangdong, and Guangxi of China, Southern Japan, and southern coastal areas of North America, while habitat losses will be mainly located in Central China, marginal zones of the original highly suitable area of Oceania, and the central and eastern coastal areas of South America (Figure 7c,d).
A comparison of the current suitable habitat area of A. cordifolia with two climate scenarios of the 2050s and 2070s shows that moderately suitable habitats will be most affected by climate change. Under RCP4.5 in the 2070s scenario, the global average surface temperature increases by 1.8 °C [3]. During this period, the area of moderately suitable habitat would decrease, but highly and marginally suitable habitats increase significantly, mainly in Southeastern China, and the coastal areas of eastern South America. By the 2070s, if the RCP4.5 assumptions are true, optimum habitat of A. cordifolia will increase the most, so we speculate that the invasion speed of A. cordifolia may increase as well.

3.5. Relative Importance of Climatic Factors

We used RF to simulate the importance of 13 climatic factors on the potential habitat of A. cordifolia under five different climatic models. We transformed the importance of factors into weights and analyzed the impact of each factor in the model. In terms of the factor contribution, the mean temperature of the coldest quarter (Bio11) is the most important climatic factor (Table 4). Furthermore, its weight exceeds 20% in all periods, except for RCP8.5 in the 2070s. The next most important factor is Bio5, the maximum temperature of the warmest month; the weight of Bio5 exceeds 10% in all models.
Notably, the top seven climatic factors cumulatively explain about 85% of the potential habitats in each model (Table 4). Six of the seven factors were found to be in common for all models. Five are temperature factors (Bio1, Bio5, Bio6, Bio7, and Bio11), and the sixth is Bio19 (precipitation of coldest quarter). The five temperature factors indicate that conditions for A. cordifolia growth are suitable in subtropical and warm temperate regions. Moreover, the range of Bio19 is 7–631 mm, which means that A. cordifolia has strong drought tolerance when in a relatively dormant state.
In summary, we can conclude the suitable area of A. cordifolia is mild, with little rain in winter, and hot and rainy in summer.

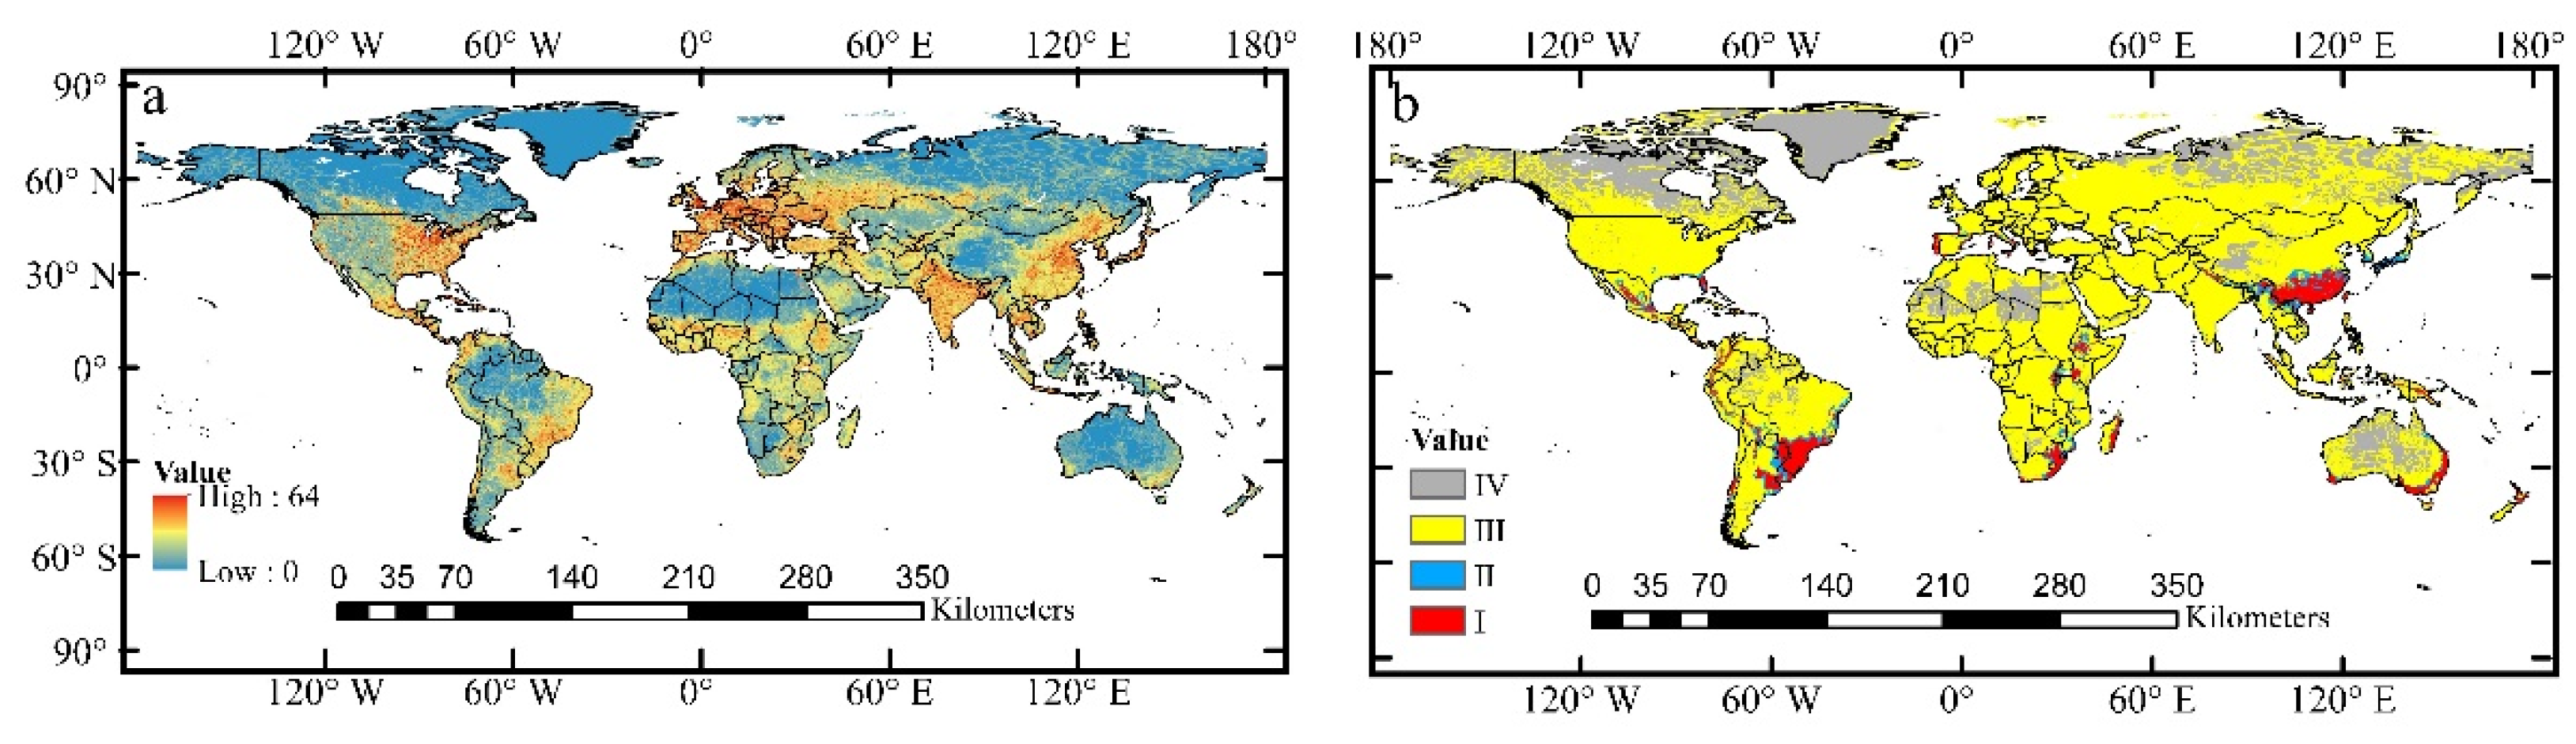
3.6. Relationships between Human Activities and Distribution

In addition to climate, human activities also significantly influence the spread and distribution of IPs. At present, the spatial distribution of human activities varies greatly in the world. The intensity of human activities in the northern hemisphere is higher than that in the southern hemisphere, and is mainly concentrated in East Asia, India, Central and Eastern Africa, Western Europe, and Eastern North America (Figure 8a). Moreover, we found, in certain regions, that the geographic pattern of human activities is consistent with the predicted potential distribution range of A. cordifolia: Area Ⅰ is mainly distributed in Eastern and Southern China, eastern coastal areas of Oceania, western coastal areas of Europe, Southeastern Africa, and eastern coastal areas of South America. These areas are fundamentally consistent with the highly suitable distribution regions, accounting for 1.82% of the gross area. Area Ⅱ is mainly in the periphery of Area I, and generally tends to the northwest direction, accounting for 2.08% of total land area. Area Ⅲ is the most widespread, accounting for 94.03%. The remaining 2.07% falls within Area Ⅳ (Figure 8b).

4. Discussion

4.1. The Significance of Studying the Potential Distribution of A. Cordifolia

Normally, there are three stages for IPs to harm an area: introduction, naturalization, and Invasion. That is to say, the species can only start breeding when it reaches a new place across geographical barriers and overcomes various abiotic and biological obstacles. Generally, 50–80% of the invaders we study have harmful effects [63], so it is important to study IPs and understand which places are suitable for their survival under future climate-change scenarios. Currently, A. cordifolia is causing serious harm to most of the warm regions of the world. By simulating the current and future distribution of A. cordifolia, we can find areas with potential risk of invasion.
Our results indicate that temperature plays an important role in the distribution of A. cordifolia, because from now to the future, as the temperature rises, the distribution area of A. cordifolia increases significantly, especially in Southeast Asia (Figure 6). By combining actual sample data, we determined that the suitable habitats of A. cordifolia are mainly distributed in temperate regions between 20° and 35 °N and 20° and 35 °S. The climatic conditions in these areas are about the same as in its place of origin. Anredera cordifolia has caused serious harm in South Africa and Australia, where it forms mats on trees and shrubs, destroys forests, and replaces native species in coastal areas, riversides, and wetlands [47]. In addition, the fallen tubers can still sprout after five years [64].

4.2. The Influence of Major Variables on Adaptation

Generally, the distribution of plant species and the establishment of populations are closely related to geographic and climatic conditions [11,65,66]. In this study, considering the study area and species, we selected 19 bioclimatic factors and human activity factors. It is well-known that other climatic factors, such as moisture balance and extreme temperature events, also determine plant distribution [67,68,69]. Numerous studies have shown that local moisture balance and extreme temperature events will affect the physiological characteristics of plants, such as yield, florescence, and tolerance [70,71]. Under the climate change, biochemical interaction will also affect the adaptability of species to the environment [72,73,74]. However, we consider that the time (current period and future two periods) and space (global) span of this study is extensive and these factors are difficult to project. Thus, we have chosen to omit the effects of moisture balance, extreme temperature events, and biochemical interaction on the distribution of A. cordifolia, realizing that these factors may have a certain impact on our predictions, but, hopefully, on a global scale, such impacts will be fairly small. Future work can explore the role of allelopathy and other biochemical interactions on the distribution of A. cordifolia and investigate limits brought about by extreme low (or high) temperature events (at a smaller timescale), so as to understand the response of A. cordifolia under different natural conditions.
In this study, we analyzed the climatic factors that have a significant influence on the growth of A. cordifolia based on the relative contribution rates of these factors to this species’ distribution under current and future climate scenarios. Based on the relative weight and cumulative contribution of each factor, seven factors contribute about 85% toward the prediction of potential habitat, with five temperature factors in common across all models (Table 4). Our results indicate that temperature is the main climatic factor affecting the growth of A. cordifolia, with a much smaller role played by precipitation. Based on climate, we found that A. cordifolia should be distributed between 20° and 35 °N and 20° and 35 °S, mainly in Asia, Oceania, and South America (Figure 3). Westhuizen [75] reported that the mean annual temperature of the areas threatened by A. cordifolia is 20–30 °C, and annual precipitation exceeds 800 mm, consistent with our predictions.
Anredera cordifolia is a perennial vine from tropical and subtropical regions, adapted to grow in warm and humid areas. At present, most samples have been recorded from roadsides, wasteland, and forest land. Research shows that it can grow in a broad range of soils [52], but we do not know the full range of edaphic factors, such as soil texture, nutrients, and pH, which may limit its ability to thrive in new environments. Further studies are needed to determine how edaphic factors promote or hinder the spread of A. cordifolia under a wide range of field conditions.

4.3. The Dispersal of A. Cordifolia and Human Activities

The spread of IPs is often closely related to human activities; they are often introduced into a place for some economic or ecological value. Moreover, human factors are also one of the important reasons for the spread of A. cordifolia beyond South America. Because of its bright green leaves and dense flowers, it is of great ornamental value to decorate fences and green low walls, leading to its introduction, in the last century, to many other countries [44]. For example, in the early 20th century, A. cordifolia was introduced into Hawaii and Croatia; it was introduced to Queensland and New South Wales in Australia in the 1950s [61], and to the mainland of China in the 1970s [45]. The tubers and broken branches of the A. cordifolia are not easily spread by the wind, but are used for decoration and greening, and they grow in large numbers in their planting areas [44]. Because its tuber grows at an alarming rate, and the stem and vine can still survive after being cut off, it can quickly invade other areas [76].
Although in some countries, such as Thailand and Indonesia, A. cordifolia is not listed as an invasive species, it has caused serious damage in South Africa, Australia, and China [65]. At present, scholars are studying methods to control A. cordifolia, including herbicides, mechanical, biological, and cultural controls, and fire [52]. Although herbicides can reduce the growth rate of A. cordifolia to a certain extent, there are two problems. One is that the production of viscous exudates from cut stems inhibit herbicide uptake; the other is the difficulty in achieving upward translocation of herbicide. Mechanical removal is limited to local areas, that is, the scope of the invasion must be small. Generally, we recommend removing the tubers from the vines, where possible, prior to vine cutting, followed by pulling out the vines and digging out the underground tubers. Finally, tubers should be dried and burned. This method is feasible and effective in areas where A. cordifolia has not caused much harm [52]. Regarding biological control, the key is to find selective pests that attack A. cordifolia. Several potential biocontrol agents have been collected in Brazil and Argentina, including three insects and a fungal pathogen. For one of these insects, Plectonycha correntina Lacodaire (Chrysomelidae), scholars studied its host specificity and found that its consumption of A. cordifolia is higher than other plants [76], but consumption is also related to the season of release, light, and natural enemies of the beetle, so these control agents need further study [52]. Insects that feed exclusively on Basellaceae would be useful for biological control in countries lacking native Basellaceae, such as Australia and New Zealand. And a damaging leaf spot fungus is known from Taiwan, but has not yet been considered for biocontrol [52]. Cultural controls are artificial controls that prohibit the introduction of invasive species [77,78]. Experiments have found that the average growth of aerial tubers was not significantly reduced after the fire [79], suggesting that fire would be a risky and ineffective management tool.
According to our results, from 1969 to 2018, the annual growth rate of sampling points of A. cordifolia was the highest in Oceania, followed by Asia and South America (Figure 9). Human activities are intensive in these areas. The intensity of human activities in Eastern Asia and India, Western Europe, and Eastern North America, from 1995 to 2010, is significantly larger than other regions, for various reasons, including global CO2 emission concentration, population density, and economic factors related to GDP [80]. From the human footprint map (Figure 8a), it can be seen that the human activity index of these countries is also in a high state. Comparing the predicted results against the current distribution, in some warm temperate regions, such as Eastern Australia and Southeastern Asia, the extent of highly suitable habitat of A. cordifolia clearly exceeds the current distribution, suggesting a high risk of expansion that is dependent on those human activities that favor this species.

5. Conclusions

This study used the RF model to analyze the global habitat distribution of the invasive plant Anredera cordifolia, under current and future conditions, by applying different climate scenarios. Prediction accuracy of the RF model was evaluated by AUC, Kappa, and TSS. The indicators showed that our predictions of potential distribution for A. cordifolia should be accurate.
The main climatic factors affecting the distribution of A. cordifolia are Bio11 (Mean temperature of coldest quarter), Bio5 (Max temperature of the warmest month), Bio1 (Annual mean temperature), Bio7 (Temperature annual range), Bio6 (Min temperature of coldest month), and Bio19 (Precipitation of coldest quarter). Among the six factors, temperature has a greater impact on the distribution of A. cordifolia than does precipitation. Therefore, in addition to biological control, large-scale removal in the coldest season might exploit a vulnerability.
The predicted results show that suitable habitats accounted for 7.69% of the total research area (excluding Antarctica), with highly suitable habitats concentrated mainly in two continents, Asia and South America, near 30 °N or 30 °S, with subtropical monsoon or monsoon humid climates. At present, the distribution area of highly suitable habitat of A. cordifolia is 2.43%, which is far from its maximum potential, and the species is continuing to spread. Therefore, intentional introductions should be discouraged, and monitoring and control should be strengthened, especially in areas of high suitability.
We discovered that intensity of human activities positively correlated with the distribution of A. cordifolia and accelerates its transmission over time. Humans have introduced it into other continents as a decorative and green plant, accelerating its spread worldwide. Therefore, it is necessary to strengthen the study of chemical and biological control measures in areas with intense human activity, focusing on eradication of A. cordifolia. In highly suitable habitat areas, the introduction of A. cordifolia should be prohibited. Moving toward the 2070s, the highest risk areas for its invasion are mainly located in the central part of China, the area on both sides of 30 °S in South America, and the southeastern part of Africa, which need to strengthen protection measures. Although A. cordifolia is not considered to be invasive in Europe, Japan, North America, and other regions, field monitoring and strengthened regulations to prevent its spread may be needed in those areas.

Author Contributions

Conceptualization, Z.Z. and W.G.; software (R, Diva-GIS, and ArcGIS10.2), writing, and original draft preparation, X.Z. (Xuhui Zhang) and X.Z. (Xiaoyan Zhang); writing—review and editing, X.Z. (Xuhui Zhang) and W.G.; W.G. and H.W. conducted formatting, and W.G. was the advisor and text editor; J.L. and Q.Z. gave comments and improved the final manuscript. All authors have read and agreed to the published version of the manuscript.

Funding

This research was supported by the National Natural Science Foundation of China (No. 31070293) and the Research and Development Program of Science and Technology of Shaanxi Province (No. 2014K14-01-02).

Acknowledgments

We would like to thank everyone in our research team for their help. In addition, we appreciate Yunfei Gu, a doctoral student at the University of Southampton, for assisting us in revising the paper. We wish to thank the reviewers for their careful review and many constructive comments.

Conflicts of Interest

The authors declare no conflicts of interest.

References

  1. González-Moreno, P.; Pino, J.; Carreras, D.; Basnou, C.; Fernández-Rebollar, I.; Vilà, M. Quantifying the landscape influence on plant invasions in Mediterranean coastal habitats. Landsc. Ecol. 2013, 28, 891–903. [Google Scholar] [CrossRef] [Green Version]
  2. Catford, J.A.; Jansson, R.; Nilsson, C. Reducing redundancy in invasion ecology by integrating hypotheses into a single theoretical framework. Divers. Distrib. 2009, 15, 22–40. [Google Scholar] [CrossRef] [Green Version]
  3. Sanjay, J.; Krishnan, R.; Shrestha, A.B.; Rajbhandari, R.; Ren, G.Y. Downscaled climate change projections for the Hindu Kush Himalayan region using CORDEX South Asia regional climate models. Adv. Clim. Chang. Res. 2017, 8, 185–198. [Google Scholar] [CrossRef]
  4. Hierro, J.L.; Villarreal, D.; Eren, Ö.; Graham, J.; Callaway, R.M. Disturbance facilitates invasion: The effects are stronger abroad than at home. Am. Nat. 2006, 168, 144–156. [Google Scholar] [CrossRef]
  5. Allen, S.K.; Plattner, G.K.; Nauels, A.; Xia, Y.; Stocker, T.F. Climate change 2013: The physical science basis. An overview of the working group 1 contribution to the fifth assessment report of the intergovernmental panel on climate change (IPCC). Comp. Geom. 2007, 18, 95–123. [Google Scholar] [CrossRef] [Green Version]
  6. Climate Change 2014 Synthesis Report. Available online: https://www.cornwallhousing.org.uk/media/10924486/IPCC-Climate-Change-2014-Synthesis-Report.pdf (accessed on 30 January 2020).
  7. Linares, J.C.; Covelo, F.; Carreira, J.A.; Merino, J. Phenological and water-use patterns underlying maximum growing season length at the highest elevations: Implications under climate change. Tree Physiol. 2012, 32, 161–170. [Google Scholar] [CrossRef] [PubMed] [Green Version]
  8. Chen, Y.; Vasseur, L.; You, M. Potential distribution of the invasive loblolly pine mealybug, Oracella acuta (Hemiptera: Pseudococcidae), in Asia under future climate change scenarios. Clim. Chang. 2017, 141, 719–732. [Google Scholar] [CrossRef]
  9. Jiang, F. Bioclimatic and altitudinal variables influence the potential distribution of canine parvovirus type 2 worldwide. Ecol. Evol. 2018, 8, 4534–4543. [Google Scholar] [CrossRef] [Green Version]
  10. Zhao, Z.F.; Wei, H.Y.; Guo, Y.L.; Gu, W. Potential distribution of Panax ginseng and its predicted responses to climate change. Chin. J. Appl. Ecol. 2016, 27, 3607–3615. (In Chinese) [Google Scholar] [CrossRef]
  11. Guo, Y.; Wei, H.; Lu, C.; Gao, B.; Gu, W. Predictions of potential geographical distribution and quality of Schisandra sphenanthera under climate change. Peerj 2016, 4, e2554. [Google Scholar] [CrossRef] [Green Version]
  12. Zhang, L.P.; Li, L.C.; Xia, J.; Wang, R.C. Quantitative assessment of the impact of climate variability and human activities on runoff change in the Luanhe river catchme. J. Nat. Resour. 2015, 30, 664–672. (In Chinese) [Google Scholar]
  13. Wauchope, H.S.; Shaw, J.D.; Varpe, Ø.; Lappo, E.G.; Boertmann, D.; Lanctot, R.B.; Fuller, R.A. Rapid climate-driven loss of breeding habitat for arctic migratory birds. Glob. Chang. Biol. 2016, 23, 1085–1094. [Google Scholar] [CrossRef] [PubMed]
  14. Ray, D.; Behera, M.D.; Jacob, J. Predicting the distribution of rubber trees (Hevea brasiliensis) through ecological niche modelling with climate, soil, topography and socioeconomic factors. Ecol. Res. 2016, 31, 75–91. [Google Scholar] [CrossRef]
  15. O’Donnel, J.; Gallagher, R.; Wilson, P.D.; Downey, P.O.; Hughes, L.; Leishman, M. Invasion hotspots for non-native plants in Australia under current and future climates. Glob. Chang. Biol. 2012, 18, 617–629. [Google Scholar] [CrossRef]
  16. Rossiter-Rachor, N.A.; Setterfield, S.A.; Douglas, M.M.; Hutley, L.B.; Cook, G.D.; Schmidt, S. Invasive, Andropogon gayanus, (gamba grass) is an ecosystem transformer of nitrogen relations in Australian savanna. Ecol. Appl. 2009, 19, 1546–1560. [Google Scholar] [CrossRef] [PubMed] [Green Version]
  17. Giakoumi, S.; Guilhaumon, F.; Kark, S.; Terlizzi, A.; Claudet, J.; Felline, S.; Cerrano, C.; Coll, M.; Danovaro, R.; Fraschetti, S.; et al. Space invaders; biological invasions in marine conservation planning. Divers. Distrib. 2016, 22, 1–12. [Google Scholar] [CrossRef] [Green Version]
  18. Vitousek, P.M.; Walker, L.R.; Whiteaker, L.D.; Mueller-Dombois, D.; Matson, P.A. Biological invasion by Myrica faya alters ecosystem development in Hawaii. Science 1987, 238, 802–804. [Google Scholar] [CrossRef]
  19. Whitney, K.; Gabler, C. Rapid evolution in introduced species, ’invasive traits’ and recipient communities: Challenges for predicting invasive potential. Divers. Distrib. 2008, 14, 569–580. [Google Scholar] [CrossRef]
  20. González-Moreno, P.; Diez, J.M.; Ibáñez, I.; Castell, X.F.; Vilà, M. Plant invasions are context-dependent: Multiscale effects of climate, human activity and habitat. Divers. Distrib. 2014, 20, 720–731. [Google Scholar] [CrossRef] [Green Version]
  21. Hulme, P.E. Relative roles of life-form, land use and climate in recent dynamics of alien plant distributions in the British Isles. Weed Res. 2009, 49, 19–28. [Google Scholar] [CrossRef]
  22. Early, R.; Bradley, B.; Dukes, J.S.; Lawler, J.J.; Olden, J.D.; Blumenthal, D.M.; Gonzalez, P.; Grosholz, E.; Ibañez, I.; Miller, L.P.; et al. Global threats from invasive alien species in the twenty-first century and national response capacities. Nat. Commun. 2016, 7, 12485. [Google Scholar] [CrossRef] [PubMed]
  23. Shine, K.P.; Forster, P. The effect of human activity on radiative forcing of climate change: A review of recent developments. Glob. Planet. Chang. 1999, 20, 205–225. [Google Scholar] [CrossRef]
  24. Huang, J.P.; Yu, H.P.; Guan, X.D.; Wang, G.Y.; Guo, R.X. Accelerated dryland expansion under climate change. Nat. Clim. Chang. 2015, 6, 166–171. [Google Scholar] [CrossRef]
  25. Hulme, P.E. Trade, transport and trouble: Managing invasive species pathways in an era of globalization. J. Appl. Ecol. 2009, 46, 10–18. [Google Scholar] [CrossRef]
  26. Richardson, D.M.; Holmes, P.M.; Esler, K.J.; Galatowitsch, S.M.; Stromberg, J.C.; Kirkman, S.P.; Pysek, P.; Hobbs, R.J. Riparian vegetation: Degradation, alien plant invasions, and restoration prospects. Divers. Distrib. 2007, 13, 126–139. [Google Scholar] [CrossRef]
  27. Weber, E.; Sun, S.G.; Li, B. Invasive alien plants in China: Diversity and ecological insights. Biol. Invasions 2008, 10, 1411–1429. [Google Scholar] [CrossRef] [Green Version]
  28. Lamsal, P.; Kumar, L.; Aryal, A.; Atreya, K. Invasive alien plant species dynamics in the Himalayan region under climate change. Ambio J. Hum. Environ. 2018, 47, 697–710. [Google Scholar] [CrossRef]
  29. Luizza, M.W.; Tewodros, W.; Evangelista, P.H.; Jarnevich, C.S. Integrating local pastoral knowledge, participatory mapping, and species distribution modeling for risk assessment of invasive rubber vine (Cryptostegia grandiflora) in Ethiopia’s Afar region. Ecol. Soc. 2016, 21, 22. [Google Scholar] [CrossRef] [Green Version]
  30. Guilherme, D.O.; Bruno, D.S.B.; Daniela, D.S.D.S.; Vinícius, Q.D.M.; Maria, C.S.S. Combining the effects of biological invasion and climate change into systematic conservation planning for the Atlantic forest. Biol. Invasions 2018, 20, 2753–2765. [Google Scholar] [CrossRef]
  31. Jing, L.; Yang, Y.; Wei, H.Y.; Zhang, Q.Z.; Zhang, X.H.; Zhang, X.Y.; Gu, W. Assessing habitat suitability of parasitic plant Cistanche deserticola in north China under future climate scenarios. Forests 2019, 10, 823. [Google Scholar] [CrossRef] [Green Version]
  32. Zhao, Z.F.; Guo, Y.L.; Wei, H.Y.; Qiao, R.; Gu, W. Prediction of potential geographical distribution and quality of a Gynostemma pentaphyllum base on the fuzzy matter element model in China. Sustainability 2017, 9, 1114. [Google Scholar] [CrossRef] [Green Version]
  33. Wang, R.; Jiang, Y.; Su, P.; Wang, J.A. Global spatial distribution of and trends in rice exposure to high temperature. Sustainability 2019, 11, 6271. [Google Scholar] [CrossRef] [Green Version]
  34. Ashraf, U.; Ali, H.; Chaudry, M.N.; Ashraf, I.; Batool, A.; Saqib, Z. Predicting the potential distribution of Olea ferruginea in Pakistan incorporating climate change by using Maxent model. Sustainability 2016, 8, 722. [Google Scholar] [CrossRef] [Green Version]
  35. Austin, M. Species distribution models and ecological theory: A critical assessment and some possible new approaches. Ecol. Model. 2007, 200, 1–19. [Google Scholar] [CrossRef]
  36. Elith, J.; Graham, C.H.; Anderson, R.P.; Dudík, M.; Ferrier, S.; Guisan, A.; Hijmans, R.J.; Huettmann, F.; Leathwick, J.R.; Lehmann, A.; et al. Novel methods improve prediction of species’ distributions from occurrence data. Ecography 2006, 29, 129–151. [Google Scholar] [CrossRef] [Green Version]
  37. Guo, Y.; Li, X.; Zhao, Z.; Wei, H.; Gao, B.; Gu, W. Prediction of the potential geographic distribution of the ectomycorrhizal mushroom Tricholoma matsutake under multiple climate change scenarios. Sci. Rep. 2017, 7, 46221. [Google Scholar] [CrossRef] [Green Version]
  38. Gao, B.; Wei, H.Y.; Guo, Y.L.; Gu, W. Using GIS and MaxEnt to analyze the potential distribution of Abies chensiensis. Chin. J. Ecol. 2015, 34, 843–852. (In Chinese) [Google Scholar]
  39. Breiman, L. Random forests. Mach. Learn. 2001, 45, 5–32. [Google Scholar] [CrossRef] [Green Version]
  40. Bi, Y.F.; Xu, J.C.; Li, Q.H.; Antoine, G.; Wilfried, T.; Niklaus, E.Z.; Yang, Y.P.; Yang, X.F. Applying biomod for model-ensemble on species distribution: A case study for Tsuga chinensis in China. Plant Divers. Resour. 2013, 35, 647–655. (In Chinese) [Google Scholar] [CrossRef]
  41. Hill, L.; Hector, A.; Hemery, G.; Smart, S.; Tanadini, M.; Brown, N. Abundance distributions for tree species in Great Britain: A two-stage approach to modeling abundance using species distribution modeling and random forest. Ecol. Evol. 2017, 7, 1043–1056. [Google Scholar] [CrossRef] [Green Version]
  42. Zhang, L.; Wang, L.L.; Zhang, X.; Liu, S.R.; Sun, P.S.; Wang, T.L. The basic principle of random forest and its applications in ecology: A case study of Pinus yunnanensis. Acta Ecol. Sin. 2014, 34, 650–659. [Google Scholar] [CrossRef]
  43. Jin, Y.; Zhou, K.X.; Fang, Y.; Liu, X. Assessment of effect of climate change on potential habitat of animal species based on random forest model. J. Ecol. Rural Environ. 2014, 30, 416–422. (In Chinese) [Google Scholar] [CrossRef]
  44. Stančić, Z.; Mihelj, D. Anredera cordifolia (Ten.) Steenis (Basellaceae), naturalised in south Croatia. Nat. Croat. 2010, 19, 273–279. [Google Scholar]
  45. Wang, Y.L.; Wei, M.Y.; Zhao, H. The biological characteristics of alien plant Anredera cordifolia and its control. J. Anhui Agric. Sci. 2008, 36, 5524–5526. (In Chinese) [Google Scholar] [CrossRef]
  46. Ji, G.X.; Tan, L.L.; Chu, Q.G. Anatomical studies on the distribution and development of mucilage cells in Anredera cordifolia. J. Trop. Subtrop. Bot. 2010, 18, 655–660. (In Chinese) [Google Scholar] [CrossRef]
  47. Wu, S.H.; Xie, C.F.; Rejmánek, M. Catalogue of the naturalized flora of Taiwan. Taiwania 2004, 49, 16–31. (In Chinese) [Google Scholar] [CrossRef]
  48. Timmins, S.M.; Reid, V. Climbing asparagus, Asparagus scandens Thunb.: A South African in your forest patch. Austral. Ecol. 2010, 25, 533–538. [Google Scholar] [CrossRef]
  49. Van Gennip, S.J.; Popova, E.E.; Yool, A.; Pecl, G.; Hobday, A.J.; Sorte, C.J.B. Going with the flow: The role of ocean circulation in global marine ecosystems under a changing climate. Glob. Chang. Biol. 2017, 23, 2602–2617. [Google Scholar] [CrossRef] [Green Version]
  50. Ling, Y.; Chen, J.L.; Wu, S.Y.; Chen, Y.Z. The test of Anredera cordifolia on nutrient quality and acute toxicity. Clin. Med. Eng. 2010, 17, 57–58. (In Chinese) [Google Scholar]
  51. Nuryantini, A.Y.; Edikresnha, D.; Munir, M.M. Electrospun polyvinylpyrrolidone as a carrier for leaves extracts of Anredera cordifolia (Ten.) Steenis. Mater. Sci. Forum 2015, 827, 91–94. [Google Scholar] [CrossRef]
  52. Vivian-Smith, G.; Lawson, B.E.; Turnbull, I.; Downey, P.O. The biology of Australian weeds. 46. Anredera cordifolia (Ten.) Steenis. Plant Protect. Quart. 2007, 22, 2–10. [Google Scholar]
  53. Barbet-Massin, M.; Jiguet, F.; Albert, C.H.; Thuiller, W. Selecting pseudo-absences for species distribution models: How, where and how many? Methods Ecol. Evol. 2012, 3, 327–338. [Google Scholar] [CrossRef]
  54. Thuiller, W.; Lafourcade, B.; Engler, R.; Araújo, M.B. Biomod—A platform for ensemble forecasting of species distributions. Ecography 2009, 32, 369–373. [Google Scholar] [CrossRef]
  55. Kwon, Y.S.; Bae, M.J.; Hwang, S.J.; Kim, S.H.; Park, Y.S. Predicting potential impacts of climate change on freshwater fish in Korea. Ecol. Inform. 2014, 29, 156–165. [Google Scholar] [CrossRef]
  56. Hipólito, J.; Hasui, É.; Viana, B.F. Solving problems involving the distribution of a species of unknown distribution via ecological niche modeling. Nat. Conserv. 2015, 13, 15–23. [Google Scholar] [CrossRef] [Green Version]
  57. Purves, R.D. Optimum numerical integration methods for estimation of area-under-the-curve (AUC) and area-under-the-moment-curve (AUMC). J. Pharmacokinet. Biop. 1992, 20, 211–226. [Google Scholar] [CrossRef]
  58. Allouche, O.; Tsoar, A.; Kadmon, R. Assessing the accuracy of species distribution models: Prevalence, kappa and the true skill statistic (Tss). J. Appl. Ecol. 2010, 43, 1223–1232. [Google Scholar] [CrossRef]
  59. Chu, J.; Li, Y.; Zhang, L.; Li, B.; Gao, M.; Tang, X.; Ni, J.; Xu, X. Potential distribution range and conservation strategies for the endangered species Amygdalus pedunculata. Biodivers. Sci. 2017, 25, 799–806. (In Chinese) [Google Scholar] [CrossRef] [Green Version]
  60. Lu, C.Y.; Gu, W.; Dai, A.H.; Wei, H.Y. Assessing habitat suitability based on geographic information system (GIS) and fuzzy: A case study of Schisandra sphenanthera Rehd. et Wils. in Qinling Mountains, China. Ecol. Model. 2012, 242, 105–115. [Google Scholar] [CrossRef]
  61. Starr, F.; Starr, K.; Loope, L. Anredera cordifolia (Madeira vine), Basellaceae. Report from Biological Resources Division, United States Geological Survey, Maui, Hawaii, 2003. Available online: http://www.hear.org/starr/hiplants/reports/pdf/anredera_cordifolia.pdf (accessed on 30 January 2020).
  62. Keller, R.P.; Geist, J.; Jeschke, J.M.; Kühn, I. Invasive species in Europe: Ecology, status, and policy. Environ. Sci. Eur. 2011, 23, 23. [Google Scholar] [CrossRef] [Green Version]
  63. Richardson, D.M.; Pyšek, P.; Rejmánek, M.; Barbour, M.G.; Panetta, F.D.; West, C.J. Naturalization and invasion of aline plants: Concepts and definitions. Divers. Distrib. 2000, 6, 93–107. [Google Scholar] [CrossRef]
  64. Xifreda, C.C.; Argimon, S.; Wulff, A.F. Infraspecific characterization and chromosome numbers in Anredera cordifolia (Basellaceae). Thais. J. Bot. 1999, 9, 99–108. [Google Scholar] [CrossRef]
  65. Callaway, R.M.; Cipollini, D.; Barto, K.; Thelen, G.C.; Hallett, S.G.; Prati, D.; Stinson, K.; Klironomos, J. Novel weapons: Invasive plant suppresses fungal mutualists in America but not in its native Europe. Ecology 2008, 89, 1043–1055. [Google Scholar] [CrossRef] [PubMed] [Green Version]
  66. Callaway, R.M.; Mahall, B.E.; Wicks, C.; Zabinski, P.C. Soil fungi and the effects of an invasive forb on grasses: Neighbor identity matters. Ecology 2003, 84, 129–135. [Google Scholar] [CrossRef]
  67. Widrlechner, M.P.; Daly, C.; Keller, M.; Kaplan, K. Horticultural applications of a newly revised USDA Plant Hardiness Zone Map. HortTechnology 2012, 22, 6–19. [Google Scholar] [CrossRef] [Green Version]
  68. Mather, J.R.; Yoshioka, G.A. The role of climate in the distribution of vegetation. Ann. Assoc. Am. Geogr 1968, 58, 29–41. [Google Scholar] [CrossRef]
  69. Stephenson, N.L. Climatic control of vegetation distribution: The role of water balance. Am. Nat. 1990, 135, 649–670. [Google Scholar] [CrossRef]
  70. Song, S.; Li, F.D.; Lu, Y.L.; Khan, K.; Xue, J.F.; Leng, P.F. Spatio-temporal characteristics of the extreme climate events and their potential effects on crop yield in Ethiopia. J. Resour. Ecol. 2018, 9, 290–301. [Google Scholar] [CrossRef]
  71. Tandazo-Yunga, J.V.; Ruiz-González, M.X.; Rojas, J.R.; Capa-Mora, E.D.; Prohens, J.; Alejandro, J.D.; Acosta-Quezada, P.G. The impact of an extreme climatic disturbance and different fertilization treatments on plant development, phenology, and yield of two cultivar groups of Solanum betaceum Cav. PLoS ONE 2017, 12, e0190316. [Google Scholar] [CrossRef] [Green Version]
  72. Sirgedaite-Šežiene, V.; Baležentiene, L.; Varnagiryte-Kabašinskiene, I.; Stakėnas, V.; Baliuckas, V. Allelopathic effects of dominant ground vegetation species on initial growth of Pinus sylvestris L. seedlings in response to different temperature scenarios. iForest 2019, 12, 132–140. [Google Scholar] [CrossRef]
  73. Baležentienė, L. Allelopathic activity of two invasive Impatiens species in temperate climate of Lithuania. Allelopath. J. 2018, 45, 45–54. [Google Scholar] [CrossRef]
  74. Šežiene, V.; Baležentienė, L.; Maruška, A. Identification and allelochemic activity of phenolic compounds in extracts from the dominant plant species established in clear-cuts of Scots pine stands. iForest 2017, 10, 309–314. [Google Scholar] [CrossRef] [Green Version]
  75. Westhuizen, L.V.D. Initiation of a biological control programme against Madeira vine, Anredera cordifolia (Ten.) Steenis (Basellaceae), in South Africa. Afr. Entomol. 2011, 19, 217–222. [Google Scholar] [CrossRef]
  76. Cagnotti, C.; Kay, F.M.; Gandolfo, D. Biology and host specificity of Plectonycha correntina Lacordaire (Chrysomelidae), a candidate for the biological control of Anredera cordifolia (Tenore) Steenis (Basellaceae). Afr. Entomol. 2007, 15, 300–309. [Google Scholar] [CrossRef]
  77. Batianoff, G.N.; Butler, D.W. Assessment of invasive naturalized plants in south-east Queensland. Plant Prot. Q. 2002, 17, 27–34. [Google Scholar]
  78. Loope, L.; Starr, F.; Starr, K. Protecting endangered plant species from displacement by invasive plants on Maui, Hawaii. Weed Technol. 2004, 18, 1472–1474. [Google Scholar] [CrossRef]
  79. Armstrong, T.; Prior, S. Control of Madeira vine (Anredera cordifolia) using mechanical methods, herbicides and hot fire. In Alan Fletcher Research Station: Environmental Weed Management Research; Queensland Department of Natural Resources: Brisbane, Australia, 1997; pp. 37–43. [Google Scholar]
  80. Zhang, Y.T.; Huang, J.P.; Guan, X.D.; Guo, R.X. Quantitative assessment of global human activity’s influence on climate. J. Arid. Meteorol. 2017, 35, 182–189. (In Chinese) [Google Scholar] [CrossRef]
Figure 1. Historic and current distribution of A. cordifolia.
Sustainability 12 01491 g001
Figure 2. Evaluation of three indicators on current and future climate prediction models of the distribution of A. cordifolia. TSS (true skill statistics), AUC (area under receiver operating characteristic), and Kappa (Kappa coefficient).
Sustainability 12 01491 g002
Figure 3. Potential global distribution of A. cordifolia under the current climate scenario.
Sustainability 12 01491 g003
Figure 4. The curve of A. cordifolia global sampling sites over time.
Sustainability 12 01491 g004
Figure 5. Proportions of three suitability classes for the distribution of A. cordifolia under different climate scenarios.
Sustainability 12 01491 g005
Figure 6. Potential suitable habitat of A. cordifolia under future climate models: (a) the 2050s of RCP4.5; (b) the 2050s of RCP8.5; (c) the 2070s of RCP4.5; and (d) the 2070s of RCP8.5.
Sustainability 12 01491 g006
Figure 7. Spatial transformation characteristics of habitat suitability for A. cordifolia under different periods and scenarios: (a) the 2050s under RCP4.5; (b) the 2050s under RCP8.5; (c) the 2070s under RCP4.5; and (d) the 2070s under RCP8.5.
Sustainability 12 01491 g007
Figure 8. Human footprint map and global distribution map of A. cordifolia under the influence of human activities in current period. (a) Global human footprint dataset of 2009; (b) (Ⅰ) areas with the strongest human activities and high suitability distribution area; (Ⅱ) areas with strong human activities and moderately suitable distribution area; (Ⅲ) areas with weak human activities and marginal suitability distribution area; (Ⅳ) the area where human activities are the weakest and unsuitable distribution area.
Sustainability 12 01491 g008
Figure 9. The number of sampling points in continents across different time periods.
Sustainability 12 01491 g009
Table 1. Evaluation of potential factors for modeling predicted distributions of A. cordifolia.
FactorsAbbreviationNameSelected
Climate variablesBio1Annual mean air temperature
Bio2Mean diurnal range (Mean of monthly (max temp-min temp))
Bio3Isothermality (Bio2/Bio7) (*100)
Bio4Temperature seasonality (standard deviation *100)
Bio5Max temperature of the warmest month
Bio6Min temperature of coldest month
Bio7Temperature annual range (Bio5-Bio6)
Bio8Mean temperature of wettest quarter
Bio9Mean temperature of driest quarter
Bio10Mean temperature of warmest quarter
Bio11Mean temperature of coldest quarter
Bio12Annual precipitation
Bio13Precipitation of wettest month
Bio14Precipitation of driest month
Bio15Precipitation Seasonality (Coefficient of Variation)
Bio16Precipitation of the wettest quarter
Bio17Precipitation of the driest quarter
Bio18Precipitation of the warmest quarter
Bio19Precipitation of the coldest quarter
Human activity HFPHuman footprint data set
Table 2. Evaluation criteria of model accuracy.
IndexExtremely HighVery HighHighAverageFailReferences
AUC0.91–10.81–0.900.71–0.800.61–0.70<0.60[57]
TSS0.81–10.80–0.610.41–0.600.40–0.21<0.20[58]
Kappa0.86–10.71–0.850.56–0.700.41–0.55<0.40[59]
Table 3. Changes of suitable habitat area of A. cordifolia under future climate models.
PeriodsClimate ScenarioArea Percentage
NewInvariantDecreaseDisappearing
Future (2050s)RCP4.52.3295.921.010.75
RCP8.52.5095.311.161.03
Future (2070s)RCP4.52.7595.521.010.72
RCP8.52.2195.431.281.08
Table 4. The relative weight of climatic factors under each climate model (%).
FactorCurrent2050sRCP4.52050sRCP8.52070sRCP4.52070sRCP8.5
Bio1122.6623.0422.8723.4614.43
Bio514.0311.1619.4518.4114.43
Bio113.3112.648.8613.0020.43
Bio711.1517.8414.6813.0014.79
Bio1911.158.924.096.504.93
Bio47.557.436.826.133.87
Bio65.404.469.556.1310.92
Bio33.953.723.421.802.81
Bio182.521.492.742.532.11
Bio162.522.222.061.811.41
Bio102.161.492.052.182.11
Bio141.803.341.362.525.28
Bio171.802.252.052.532.48

