1. Introduction
Service networks (transport, electricity, communications, gas, water) are the backbone of any territorial organization. Urban anthropization illustrates how service networks remain tied to their territory throughout the decades due to high capital investment and the way these networks are operated, maintained, and expanded. Nevertheless, these networks also change and adapt to technological breakthroughs, exogenous factors, and population needs [
1].
Modelling the anthropization process of a city explains its historical formation as a physical object, delineates urban growth through time, and indicates how it was managed [
2]. Even though Latin America cities follow the model of European and US cities, the urbanization process is marked by a double opposition: New World (as opposed to Europe) and Latin (as opposed to Saxon) [
3,
4]. Therefore, the key for their future development should come from comparative studies of cities within the same context, rather than from using external models.
The urbanization of modern cities follows the parcellation, urbanization and construction (P + U + C) process [
2], in a framework of controlled planning and execution. This means that urban planning determines not only parcelling, urban mobility (vehicles and pedestrian), and housing types (single- or multi-family), but also the service networks, including the power network. However, most modern Latin American cities have experienced a fragmented urban growth, through lots and suburbs, often under speculative pressure and unplanned self-construction as new land is made available and has access to service infrastructure [
5].
Documenting the growth of a city can be very useful if the drawings are made with further purpose than observing formal chronological aspects of the architectural background [
6]. Adding other backgrounds and variables to cross evaluate and analyse gives a better understanding of unforeseen growth tendencies and brings up otherwise hidden deficiencies of the urban service networks in the different areas of the city. This information is very valuable when establishing sustainable urban planning criteria [
7,
8], Herce and Miró Farellons suggest five development lines to reformulate urban models from a sustainability standpoint [
9]. These include relating service infrastructure with land use in order to increase efficiency.
The study of anthropization together with infrastructure growth is an essential tool to assess the state of a city and determine actions to bolster its sustainability based on economic parameters (economic accessibility, production, private sector, public services, jobs); environmental parameters (agriculture, water, air, energy, environmental management, resources, waste, noise); social parameters (quality of life, environmental education, population, identity, social inclusion, participation, safety, and health); and urban parameters (equipment, street furniture, green areas, planning and management, land, transportation) [
10,
11,
12]. In this context, urban infrastructure includes transportation networks, fresh water and sewers networks, power network, and information network, as well as the management of waste and green infrastructures [
13]. In particular, power networks are very expensive and have a large impact on urban and territorial planning [
9].
Scientific literature includes the sustainable urban infrastructure concept since 1982, based on socioeconomic development in balance with natural resource availability [
14]. For instance, the relocation of urban parks to increase the quality of life in modern cities [
15], the perception studies and landscape evaluation from the expert, psychophysical, cognitive, and experimental points of view to assess its quality [
16,
17], the atmospheric models for urban areas [
18], etc. However, despite these actions, the current trend in city development is still somehow based on abusing local resources, which are often scarce [
19].
The solar urban design is an approach that can both help overcome the local resource issue and the global energy problem [
20]. On the other hand, active participation of the population in city planning helps visualizing the resource depletion problem, and the increased awareness is the basis for implementing sustainability programs [
21].
The model introduced by Amado et al. presents an integral method to optimize the global energy performance of a city matching forecasts of energy use patterns and solar generation. This type of renewable energy integration into the urban systems can be applied both to new areas of city growth and to existing districts [
22].
Integral models of city planning describe the behaviour of the system (users, consumption, and resources), and allow the estimation of their value, as well as define an optimized solution taking into account the various factors that weight in the decision making process from a multidimensional and sustainable standpoint [
23,
24].
Currently, one of the most popular approaches to the new paradigm of sustainable urban planning is called, according to Heymans et al., urban consonance, which is based on the harmony between nature and people, and describes the evolution of ecological urban planning in an interdisciplinary way [
25]. However, this new paradigm is the foundation of an ecologic urban planning and design that applies sustainability concepts in a spatial context, but has yet to be developed from a multidisciplinary standpoint [
26].
Current city anthropization studies focus on analysing the environmental gains through city structure and urban land use [
27,
28,
29]. Hayashi et al. analyses special land use patterns in coastal mangroves and assesses its environmental impacts using remote detection techniques [
30]. Guetté et al. does a historic study of the anthropization of a wetland, in which he assesses the documented changes in traditional studies of land use or coverage change, mapping the variations of the main habitats [
31]. Tu et al. study the relation between urban landscape patterns and particle pollution using a regression model [
32].
Cui et al. propose a method to evaluate the effects of urban expansion into agricultural land using geographic data to identify multiyear patterns and improve sustainable urban growth [
33]. Kim et al. presents a method to asses urban growth using satellite imaging and claims that controlling urban growth improves infrastructure efficiency [
34].
Other studies focus on assessing the impact of transportation infrastructure and its influence on sustainable development [
35,
36]. These models are assessment and forecast tools for transportation routes and will develop into prediction and control models, similar to advanced systems of passenger information and traffic management [
37].
On the other hand, some studies of infrastructure transitions (e.g., energy, transportation, housing, agriculture, water, etc.) perform multidisciplinary analysis of their long-term growth management, focusing on the social purpose of the infrastructure [
38,
39,
40,
41,
42,
43,
44,
45]. It is still necessary, however, to address persistent urban sustainability problems. These methods result in partial representations of urban infrastructure, and in most cases, they have a focus on environmental and technological impacts.
Most research concerning urban infrastructure analysis suggests the integration of information, so that city projects take into account economic, environmental, social, and cultural functions. Therefore, integral urbanization or re-urbanization models [
46] include the information to create multifunctional areas that relate tourism activities, mobility and accessibility, the use of renewable energy sources, environmental education, economy, and safety [
47,
48,
49]. On the other hand, it is essential that this information is public along the process, in order to comprehend and interact with the wishes and expectations of each community. It must be taken into account that the results of the modelling can be compromised by the availability and quality of the data [
50].
The integrated model of urban systems provides description, analysis, and optimization of the main characteristics of developed and undeveloped areas [
51,
52]. However, explaining the evolution of urban systems at a large space–time scale is complex. Therefore, obtaining an integrated city model is a challenging endeavour that intends to compare multiple structures. Each structure is a combination of mechanisms and processes that are included in the urban infrastructure analysis [
53].
The mathematical and spatial approach of this model integrates multiple mechanisms to design, implement, and asses the infrastructure. Its contribution to city planning is assessed through time, confronting the mathematical models with the empiric data in a geographic information system (GIS) georeferenced environment [
54].
This paper carries an integral analysis of the evolution of the urban infrastructure of Ambato, a mid-tier city in Ecuador, from the 1950s to the present time, and introduces a mathematical model to relate anthropization with the growth of the power network in order to support sustainable urban planning. The goal is to establish a multidisciplinary method to analyse anthropization, and particularly, its link with the growth of the power network in order to provide a better comprehension of urban infrastructure dynamics.
The analysis begins with the study of previous urban and infrastructure growth and growth management and predicts its evolution, so that sustainability criteria can be introduced in power network planning.
This study used older maps to analyse the existing infrastructure and support current and future management. For the case study of Ambato, Ecuador, the cadastre was used as a reliable source persistent through decades to inventory data and other cartographic information related to the city and its infrastructure. This information was then integrated in a georeferenced environment using GIS software [
55,
56,
57], which allows the overlaying of multiple information layers: power network, power users, and socioeconomic data. This links different sources of information and gives way to infer correlations between city growth, user base, and infrastructure development.
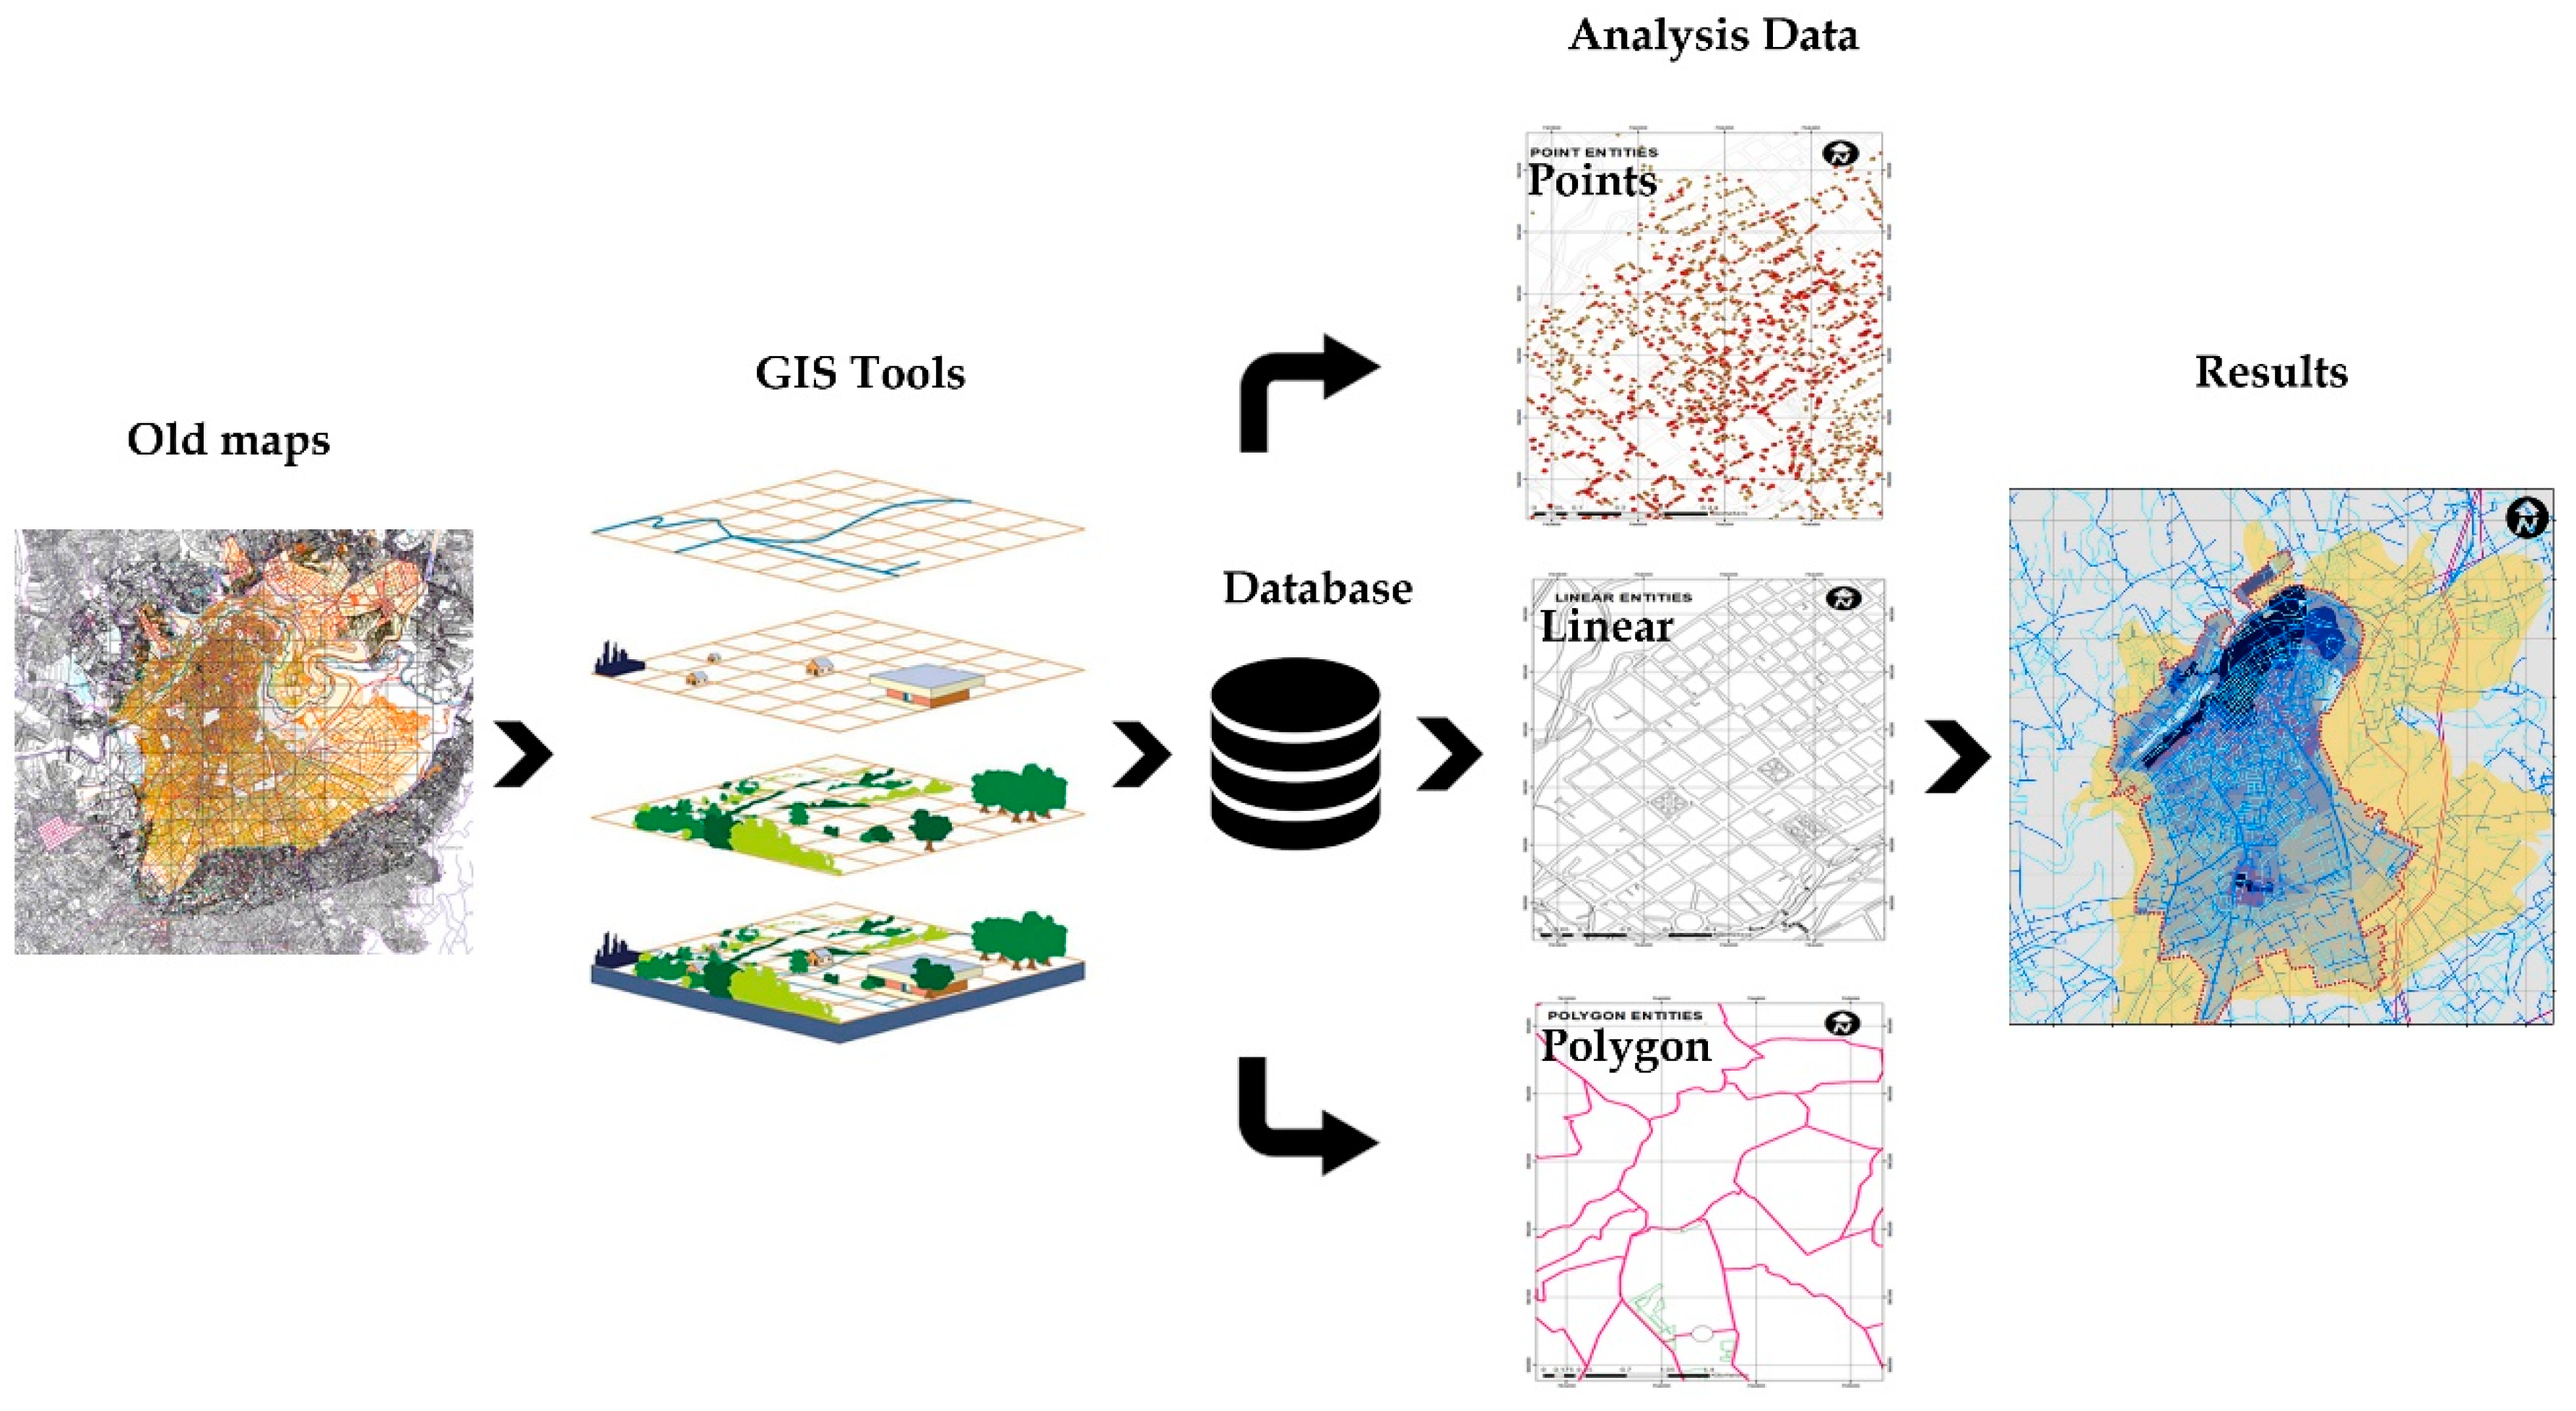
Figure 1 shows an overview of the analysis methodology for urban infrastructure. First, compile a database with general spatial and temporal information of the power network and the city. There are three types of data: points (users, transformers, poles, buildings), lines (power, drinking water, sewers), and polygons (districts, electric coverage area, population density), which integrate swiftly into the GIS software [
58,
59,
60].
The integrated time series is processed using a mathematical model to adjust them to a sigmoid curve to predict future behaviour of parameters such as power network densification, transformer overload, and future power network expansion with sustainability criteria, using current transformer capacity as a hard cap for network densification [
61].
Additionally, polygon data show land use patterns, especially in the city expansion zones, although city growth is limited by the model to the current municipality limits. Using the time series of GIS data, we discuss the changes in land use and the evolution of power network user density. It shows that it is necessary to control the potential development of new districts, adapting zoning regulations to control urban sprawl and improve the efficiency of the power network.
This article presents an alternative way of analysing urban environments with the main goal of supporting city management. Furthermore, it is possible to extrapolate the results of this study to other infrastructure networks, such as water, transportation, communication, pedestrian routes, ecological corridors, etc. This multidisciplinary approach can be a resource to urban infrastructure planning that helps, in a way, to simplify the very complex issue that is sustainable urban planning.
The materials and methods used for the study are presented in
Section 2, followed by the most relevant results obtained in
Section 3, with a brief discussion of their significance in
Section 4. Finally, conclusions are presented in
Section 5.
2. Materials and Methods
The design of the analysis of the urban system was based on an algorithm that assesses urban expansion with sustainability criteria. The input variables were introduced through a vector with the parameters of the urban system. The algorithm calibrated the model with this data, calculating the least error with the reference curve. The adjusted profile could be used to forecast city growth, and to plot a two-dimension graph that shows the influence of a given parameter on the model calibration. To sum up, the data calibrate the model, and obtain a single scalar value that represents the possible strategic sectors of city expansion.
The model requires as input a description of the urban area and its infrastructure, including land availability, power network, and the physical features of the land. It also requires time series of the description parameters that show the variation along time and the effect of policies on them. The model needs the variables to be adequately measured and coded for the analysis. With all this information, the model will produce a single scalar value for each expansion zone that assesses the feasibility of an expansion in that area.
This article introduces a methodology based on the analysis of the anthropization and power network growth in urban settings. It is based on mapping the urban model and the current power infrastructure, to diagnose the present state of the network and identify shortcomings within the urban mesh and its relation to infrastructure networks. Lastly, it develops a mathematical model to describe urban patterns and tendencies.
Mapping of the city was based on the standardized anthropization and power network data of Ambato from 1950 to 2019. Anthropization drawings were obtained through digitalization of maps from different periods. From this information, we could obtain the growth parameter that describes the urban infrastructure management modes.
The model estimates the power network user growth using a multiple regression technique to analyse historic data. It is an unrestricted non-linear least squares problem, which calculates the global minimum square sum of
m non-linear functions [
62],
where each
is a non-linear function defined in
.
Data adjustment is an especially problematic issue when dealing with non-linear least square problems; in this case, adjusting data
, to a model given by the function
, where
is a parameter vector. Considering
as the prediction error of the model for the
-th observation,
the adjustment problem becomes a non-linear least squares problem, where
are the real geometrical parameters for economic factors (economic accessibility, production, private sector, public services, jobs); environmental factors (agriculture, water, atmosphere, energy, environmental management, resources, waste, noise); social factors (quality of life, environmental education, population, identity, social inclusion, participation, safety, health); and city management factors (public equipment, street furniture, green areas, land management and planning, transportation) of a given study area (e.g., 1 km × 1 km) in different time periods [
59,
63].
Most technological developments follow and S-shaped growth curve, that can be divided into four phases: pre-development, take-off, acceleration, and stabilization [
64,
65,
66]. Therefore, the study cases uses a sigmoid function
to adjust the power network growth data [
67]:
where
have to be calculated. Time periods
are time intervals from 1950 to 2019.
The least squares problem to adjust
, is defined by:
The gradient
is:
The approach to solve this problem is an optimization method of the quasi-Newton family that approximates the Broyden–Fletcher–Goldfarb–Shanno (BFGS) algorithm, and which is implemented in Python [
68,
69,
70,
71]. MATLAB was used to calculate the Hessian matrix [
72].
The BFGS method, like other optimization methods, uses both the objective function value and its gradient, that is, the objective function derivative with respect to its arguments, as in Equation (5).
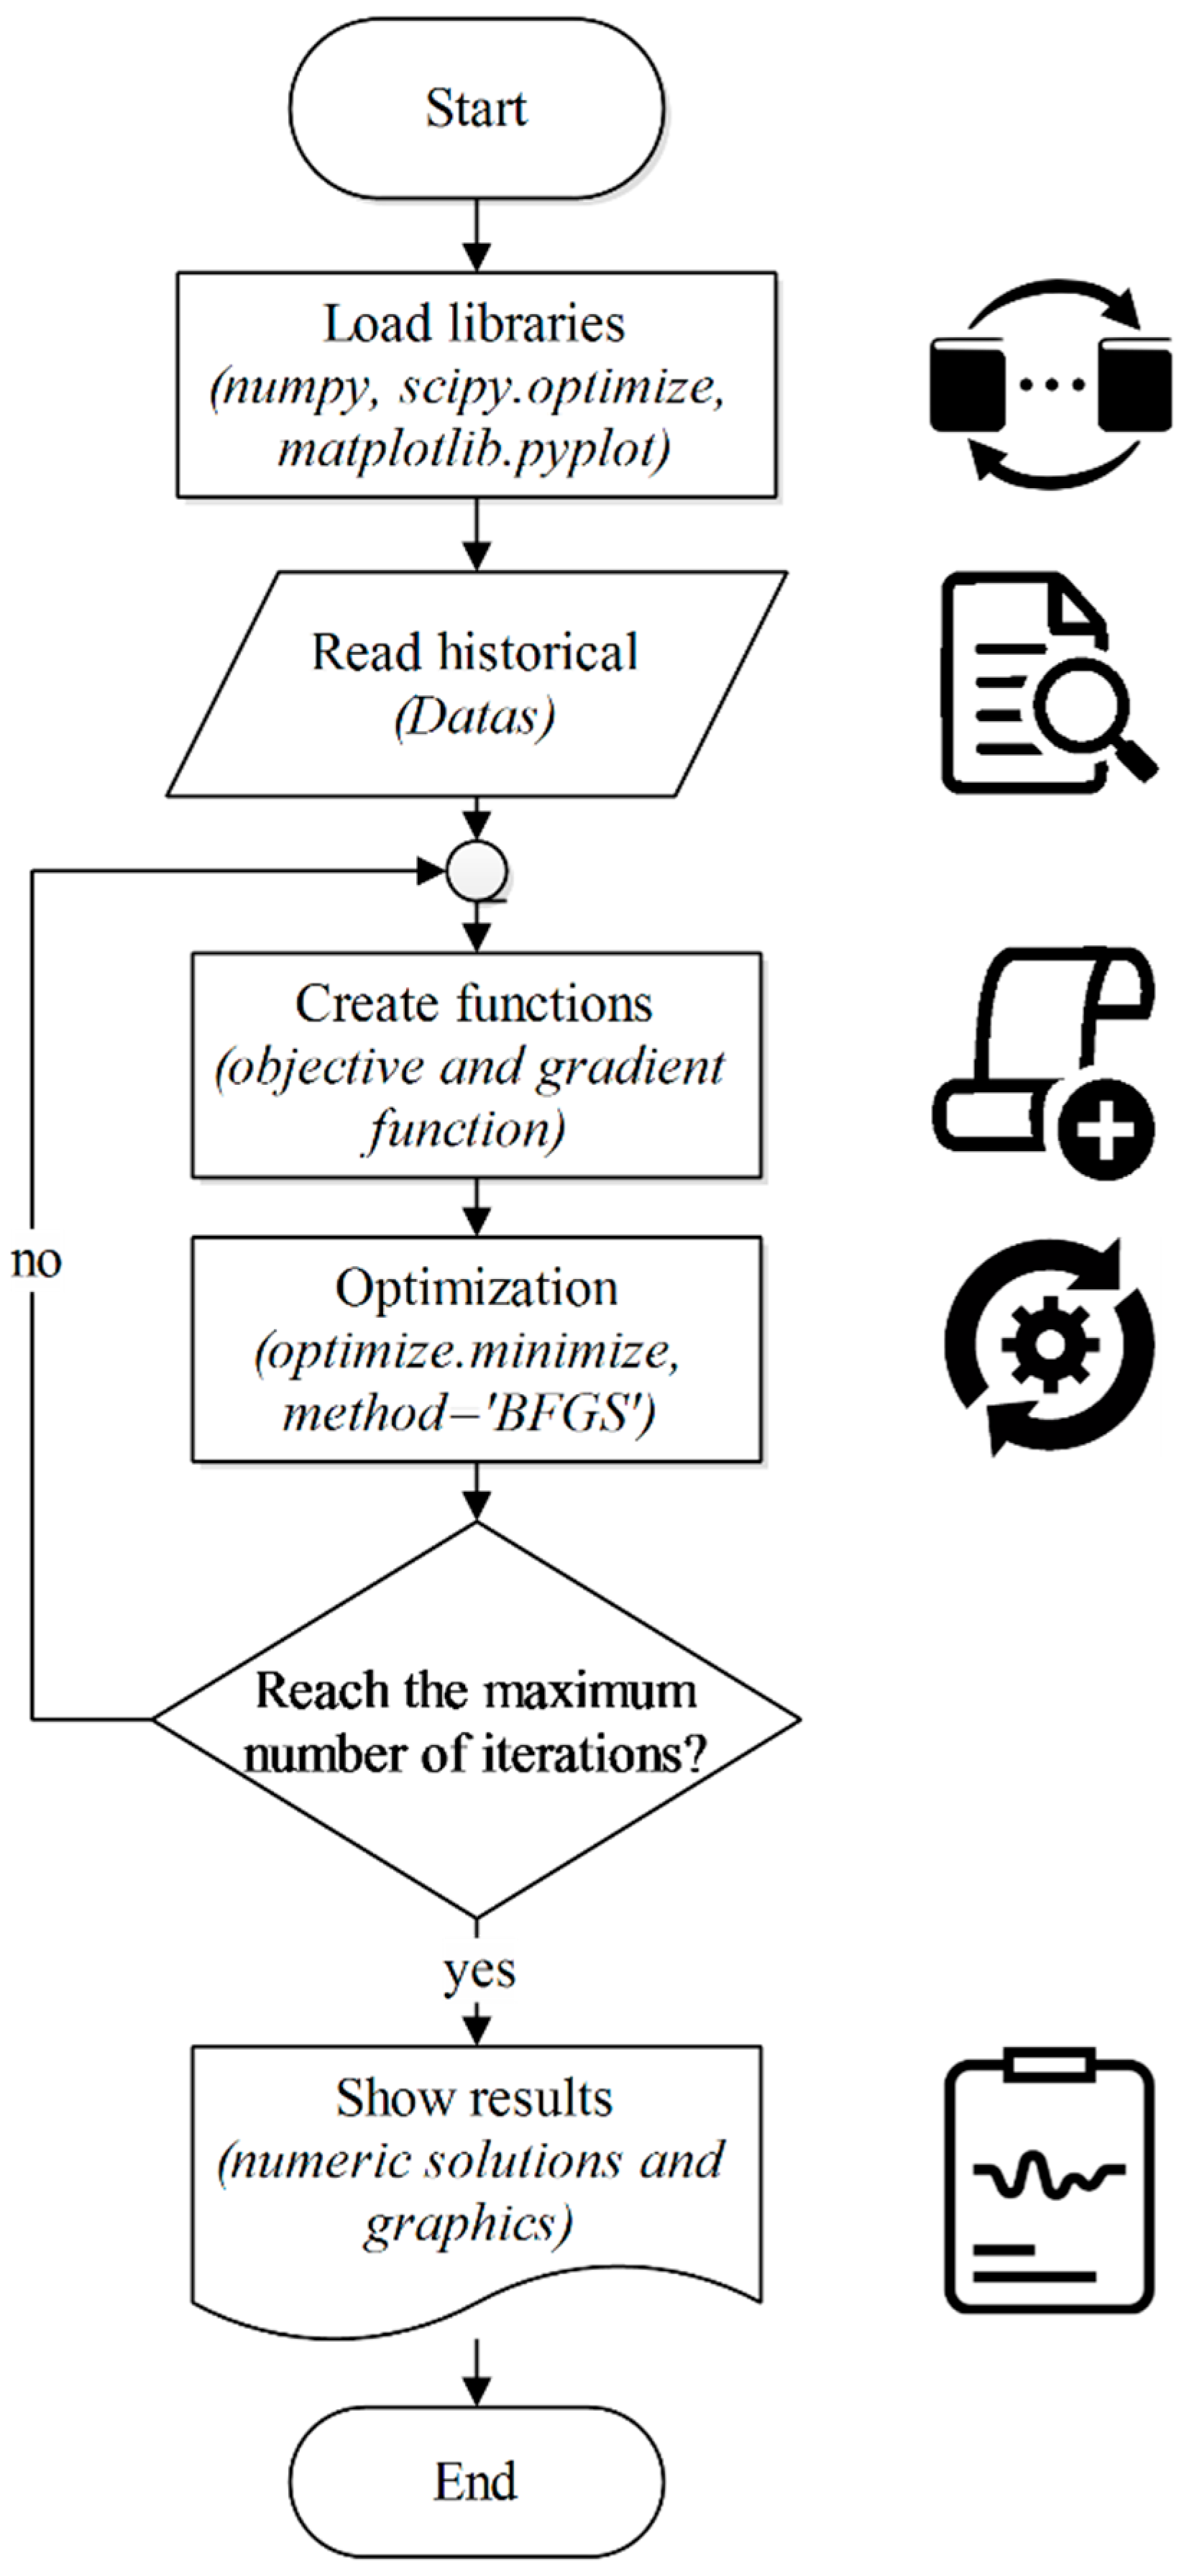
Figure 2 is the flow diagram of the proposed model to adjust data to the objective function using Python and the libraries numpy, scipy, and matplotlib. The model loads the power network data (capacity, user quantity, and type), and anthropization data (population data and urban areas) into the adjustment model, which performs the optimization using the BFGS method. Lastly, if adjustment criteria are met, it prints out the results and plots the corresponding predictive curves.
Basically, the model inputs a vector or , which correlates the parameters either geometrically or arithmetically. Each element within the vector has a weight factor between 0 and 1, depending on its incidence in the analysis. For instance, a weight factor of 0 in access to electricity means no availability, while 1 means full access to electricity. The vector can also be normalized to values between 0 and 1.
3. Results
This research analyses the urban infrastructure of Ambato, Ecuador, from the 1950s to 2019. Its main goal is to support sustainable city planning. The electrical infrastructure was analysed using historical data, which set the ground to predict that in 2050 the urban area and the power network will enter a phase of densification, and possibly that the users (who are currently passive) will begin to actively participate in the network as prosumers, creating a new cycle of development and adoption of technology [
73].
The integration of anthropization data with power network growth data reveals network growth patterns and the issues that a scattered urban growth creates on the power mesh. Furthermore, current electricity user data was inputted in a geographic information system (GIS) environment to generate maps of the current state of the city grid.
Table 1 shows the urban area data, including population density and electricity coverage index
, which indicates to the relationship between the population with electricity service in their house and the urbanized area. Currently in the case of Ambato, Ecuador, it is 0.5187 due to plots without buildings. The processed data were used as input for the BFGS optimization, with the output shown in
Table 1.
Table 2 shows the results of the algorithm, which include number of iterations, function evaluations, and gradient evaluations. The adjustment error is calculated at 0.00035, which means that the resulting curve has a good adjustment to the data.
The coefficients of the model are the resulting values of the vector , where . These results are the basis for the projection of the future power network of Ambato, the study area. The code developed in Python is used to forecast power network user density into the 2050 horizon.
Under a scenario in which city planning takes sustainability criteria into account and there are no extensions of the urban limit, the density of users of the electricity grid by 2050 would increase by approximately 13%, thereby covering non-consolidated areas and increasing the use factor of the infrastructure. In addition, the analysis takes into account the relationship between the length of the network and the area to be developed, since length is one of the parameters affecting the efficiency of the electrical infrastructure.
Table 3 shows the results of the projection, including real data and simulation results, and the maximum and minimum error considering a ±0.5 tolerance.
A total of 34 iterations were needed to calibrate the parameters shown in
Table 3. This result does not lead to a single value, but it gives a range of possible values for each parameter, with a range of error of ±0.5. Furthermore, the values are not independent, and therefore they have to be adjusted depending on the scenario.
This method can evaluate the behaviour of the model, so that it can determine which assumptions are necessary and sufficient to achieve the desired results. For instance, the model can penalize city growth without a robust power network or completely ban it outside city bounds.
It also helps to determine which parameters have a significant influence in city growth. However, the examination of the simulation model shows that interaction mechanisms between system entities are essential to produce an evolution akin to that of real systems.
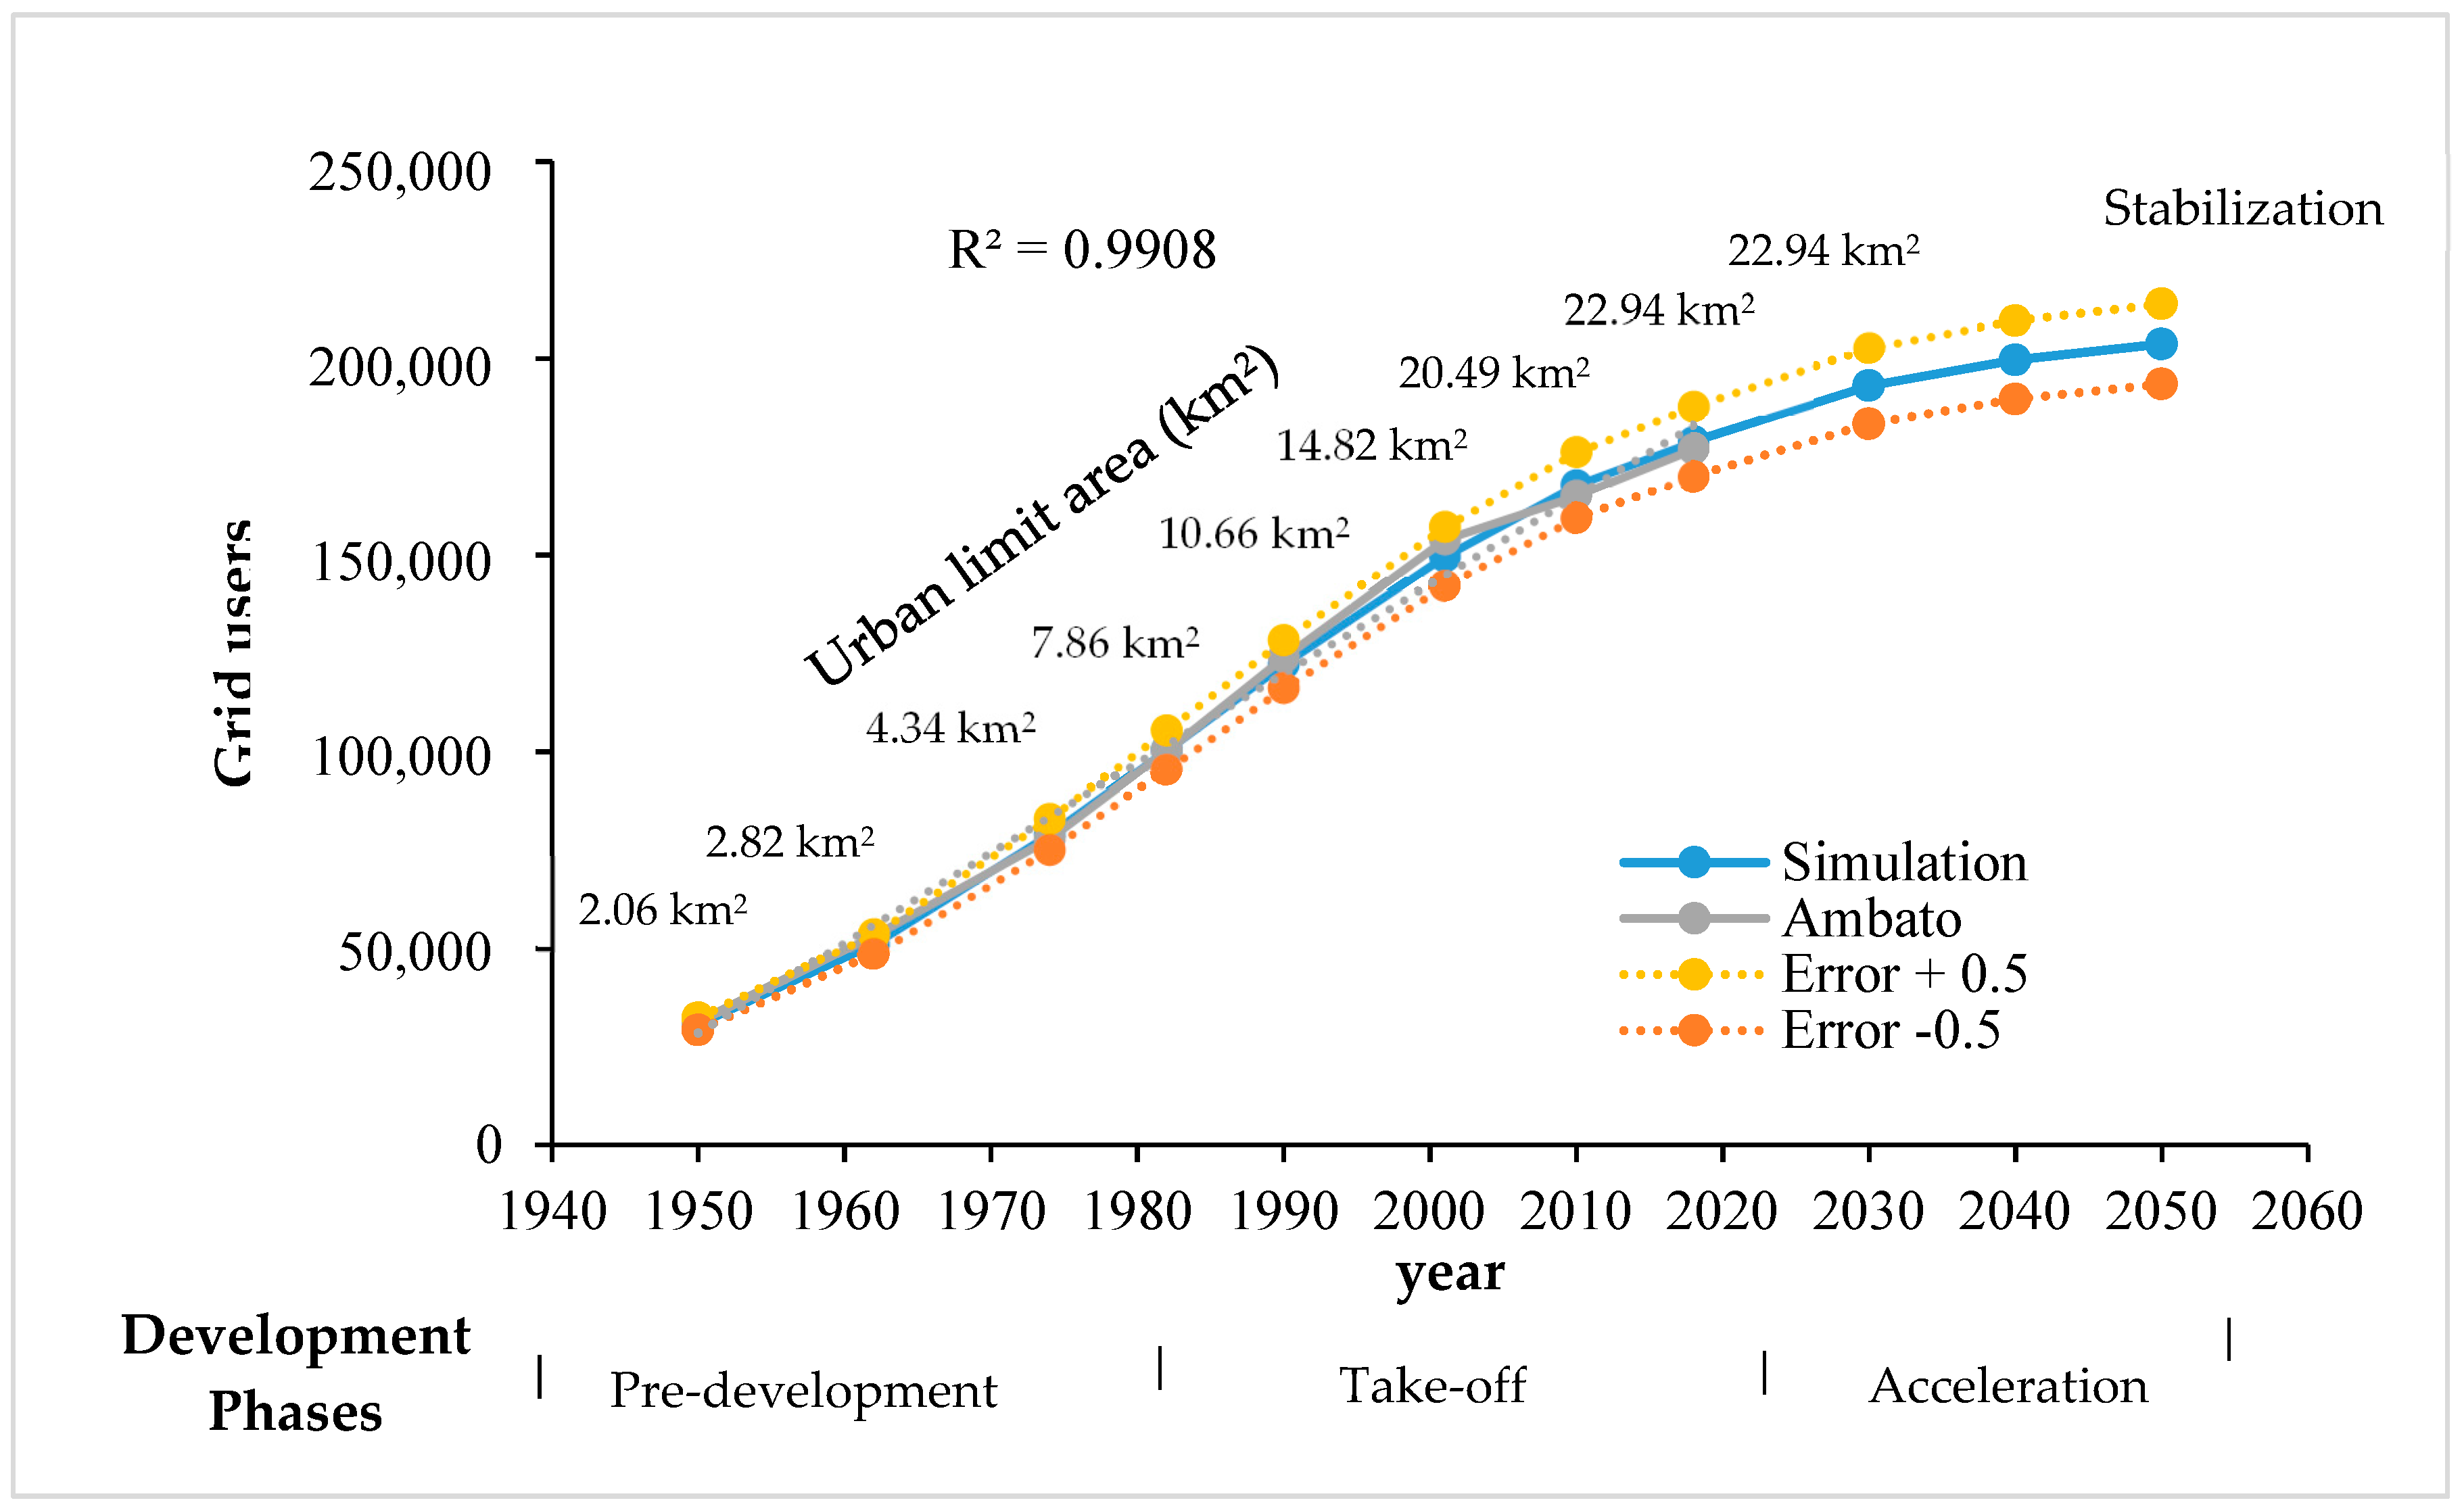
Figure 3 shows the projected power network users for 2050. The model also includes geospatial user data, which can correlate to the city infrastructure considering anthropization data. In this case, the upper limit of the function is restricted by the city limits. After the maximum area is reached around 2050, the electricity grid will enter a stabilization phase in which the curve remains constant. Therefore, the users of the urban area will densify until the capacity of the grid so permits.
The forecast for new power network users by 2050 yields a result of 203,630 total users with a population density of 4850 people/km2.
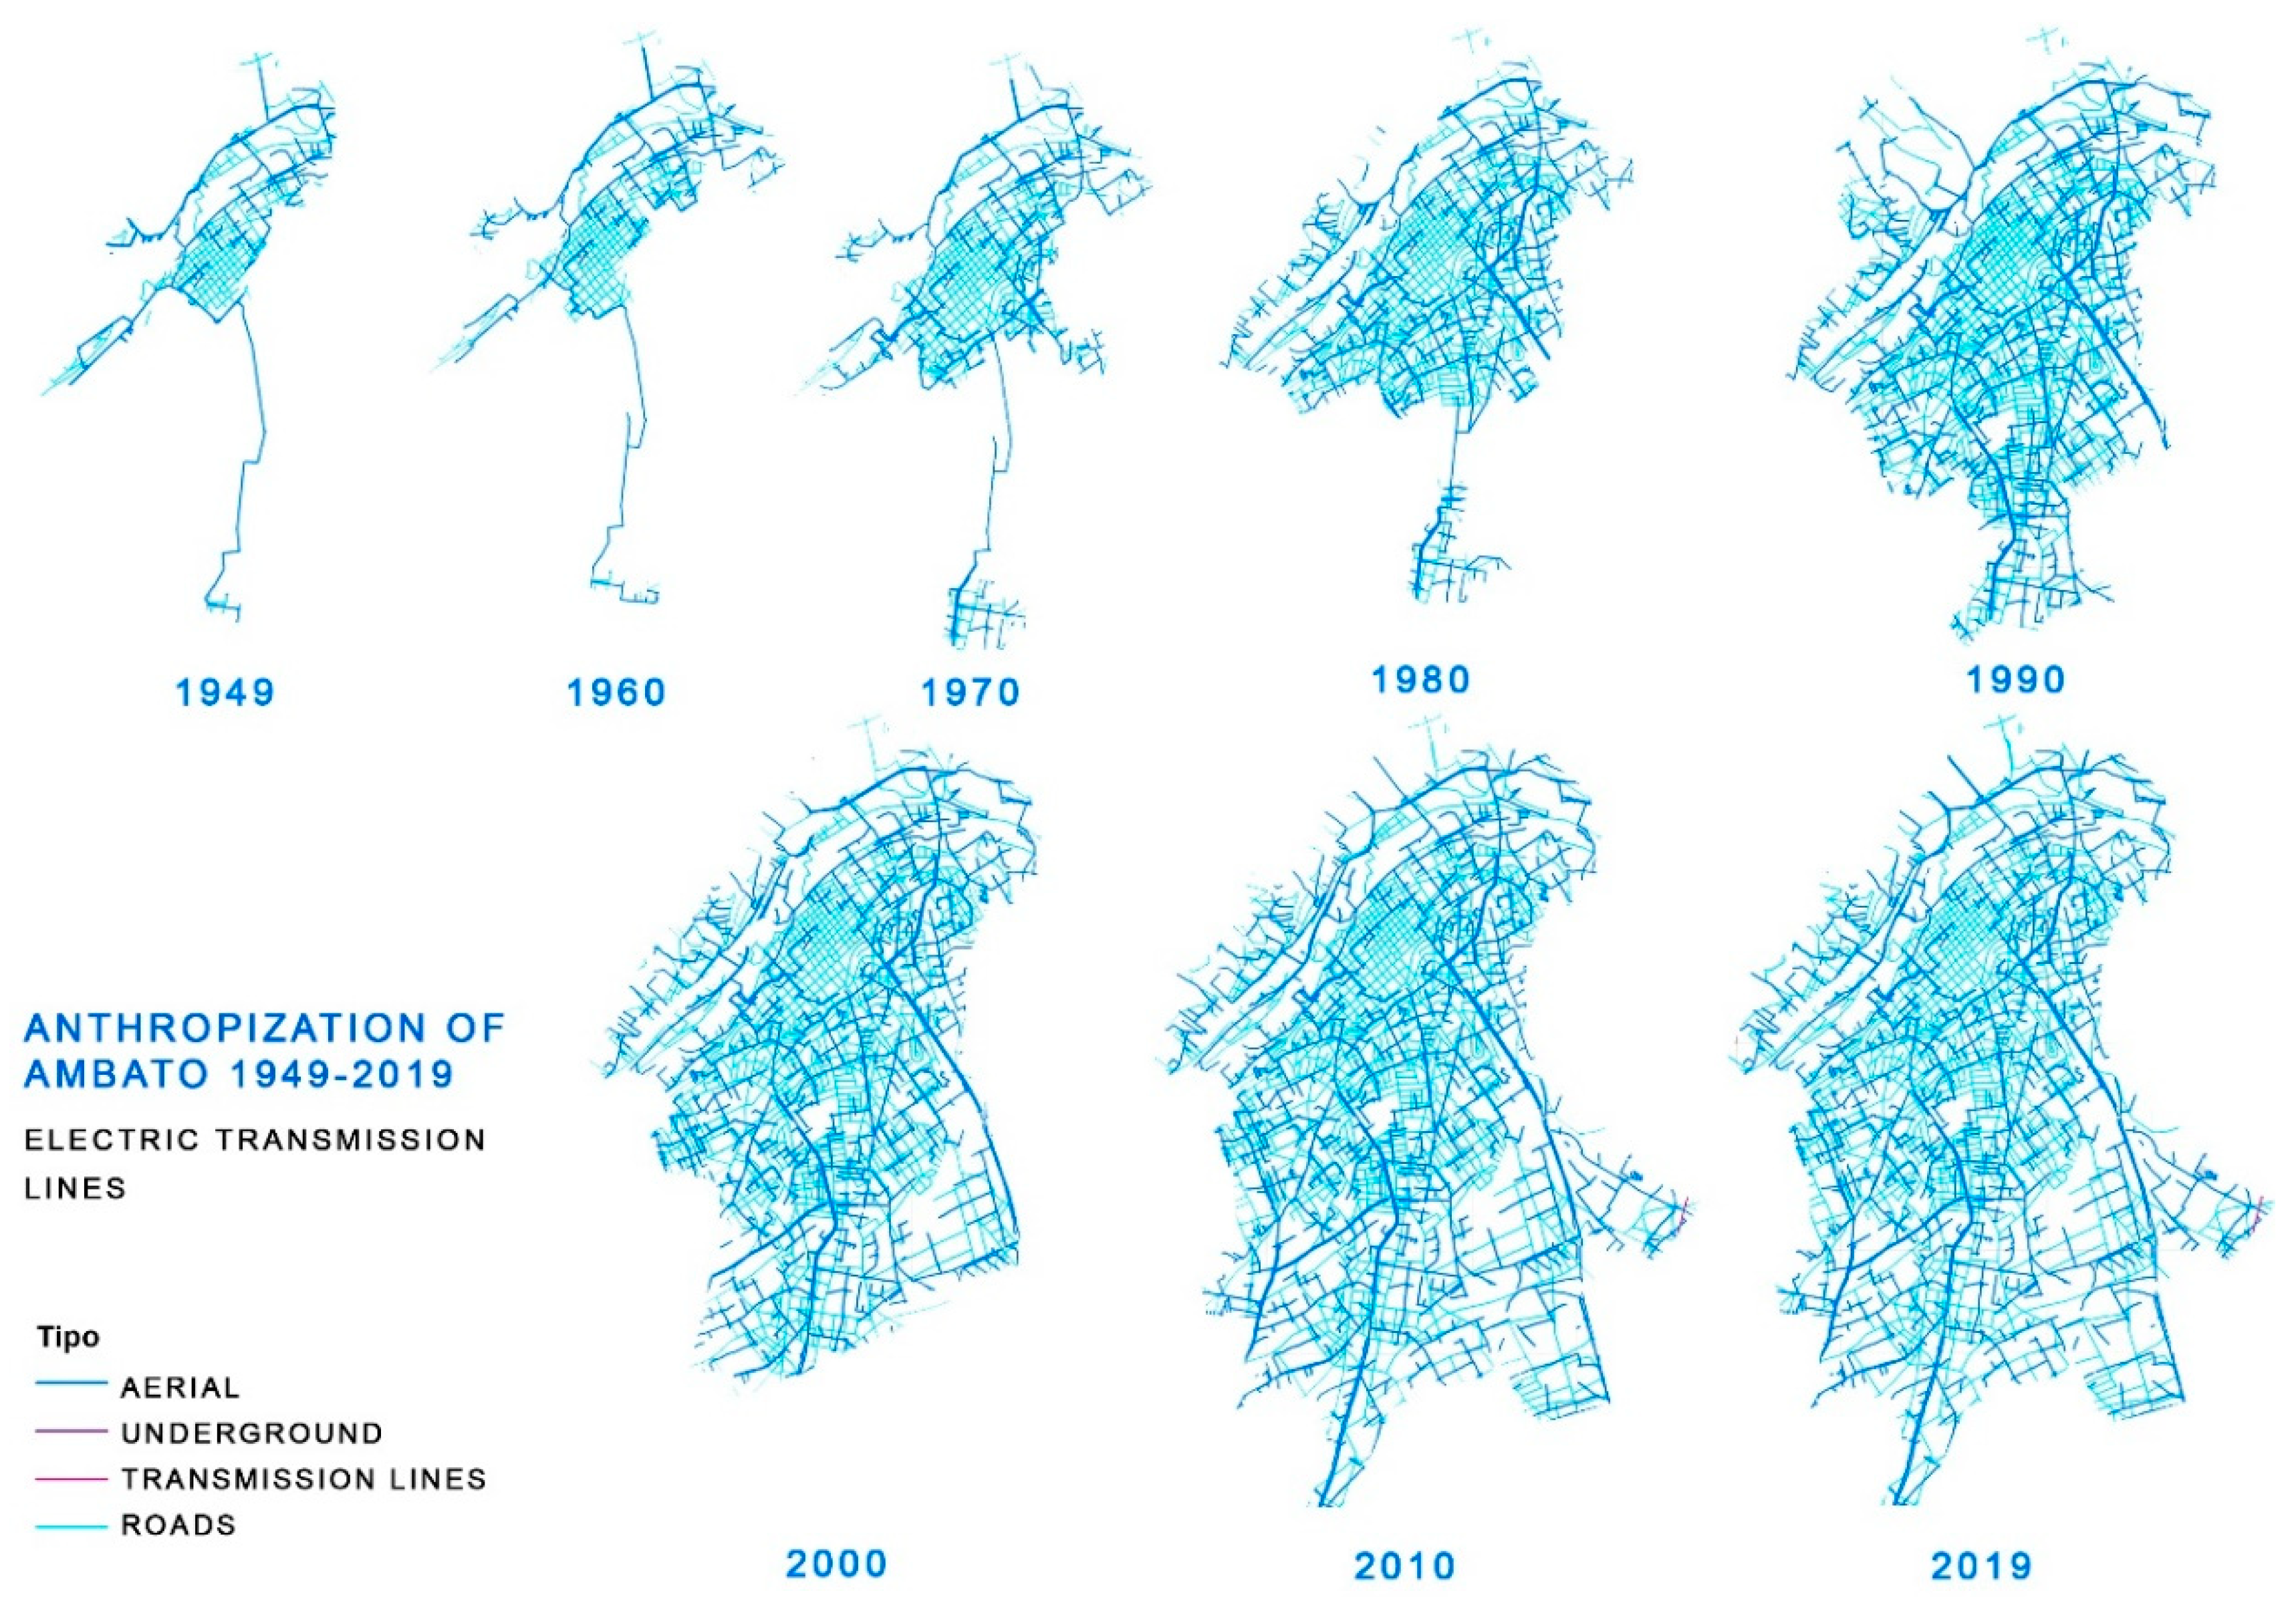
Figure 4 shows the growth pattern of the power network from 1950 to 2019. This sequence shows the current stage of Ambato power network development, with two completed phases: pre-development (1950–1980) and take-off (1980–2020) and is starting the maturation phases: acceleration (2020–2050) and, finally, stabilization (beyond 2050).
The drawing of the urban area of Ambato comes from the digitalized maps of the Regulatory Plan of Tungurahua, created in 1950 [
74]. A large earthquake had hit Ambato in 1949 that heavily damaged the city, which was prompted for reconstruction.
Maps for the following decades were obtained from the cadastre of the Ambato local government, using CAD tools such AutoCAD and ArcGIS for their digitalization.
Figure 5 shows the different stages of the anthropization of Ambato, together with the growth of the power network. In addition, it depicts the area outside the current city limits that may be developed in the future. These new developments can be planned following criteria of energy, ecological, and economic sustainability after 2050.
Anthropization data show how the urban area grew during the study period: 37% (1950–1960), 53% (1960–1970), 80% (1970–1980), 35% (1980–1990), 39% (1990–2000), 38% (2000–2010), and 11% (2010–2019), mostly at the expense of agricultural land. The growth patterns observed from the historical data are the basis for the simulation for future city growth.
The city was divided into three regions according to their topographic characteristics: the central area with higher population density; the south and east areas with agricultural plains littered with low density but organized settlements with easy access to the power and road networks; and the hilly areas in the north and west, with worse access to the networks and, therefore, less likely to host city expansion.
The analysis of the growth and evolution of Ambato shows natural growth, immigration, peripheral expansion, and growth anomalies. Additionally, there is a social and functional analysis on housing, commerce, and industry, among other parameters.
The main difficulty in performing this type of analysis is the lack of accurate statistical data and city maps. However, in this case there were available older maps from 1950 with information on population density, districts, civil registry, publications, and city census. All this information confirmed a strong influence of immigration started in the mid-20th century on the electrification and industrialization of the city.
The main goal when analysing the anthropization process of Ambato is not reconstructing history as much as identifying growth patterns, phases, and the evolution of the city systems. In history of societies, the appearance and development of cities indicates new modes of inhabiting the land and managing resources [
75]. Therefore, the description of this event points out the main traits that explain urban development. For instance, the spread of scientific and technical innovation from place to place, and the increasing interaction among people inside and between cities explains an increasing concentration of population as well as city growth.
This research has access to precise empirical data to calibrate the model. Thus, it was possible to develop a mathematical model using urban growth data, population growth rates, and emergence periods. This model attempts to establish the generic conditions needed for the emergence of an urban system like the one in Ambato, and its prospects of sustainable growth.
The model used in this research can steer the city growth and development in a normal and rational fashion, avoiding a disjointed growth that leaves neighbourhoods disconnected from the city, and that create inefficiencies in the power network [
76].
The social and functional analysis shows existing land use zoning and points out heterogeneous uses, singling out zones of administrative duty; commercial areas; residential areas with or without yard, and varying hygienic and constructive quality; disperse housing areas; undeveloped areas; and areas that are potentially dangerous for development.
The central sector consists of 60% single-family houses that hosts the middle classes. Building height in this area is 40% ground floor only, 30% two-storey houses, and 30% three-storey houses.
Energy maps also integrate information from other sources, such as urban plots, land value, housing type, family size, household appliance ownership, and household income. A multidimensional analysis including all this information results in the categorization of the plots according to its consumption type and detects areas of potential growth, which leads to the optimization of the power network and minimization of power losses.
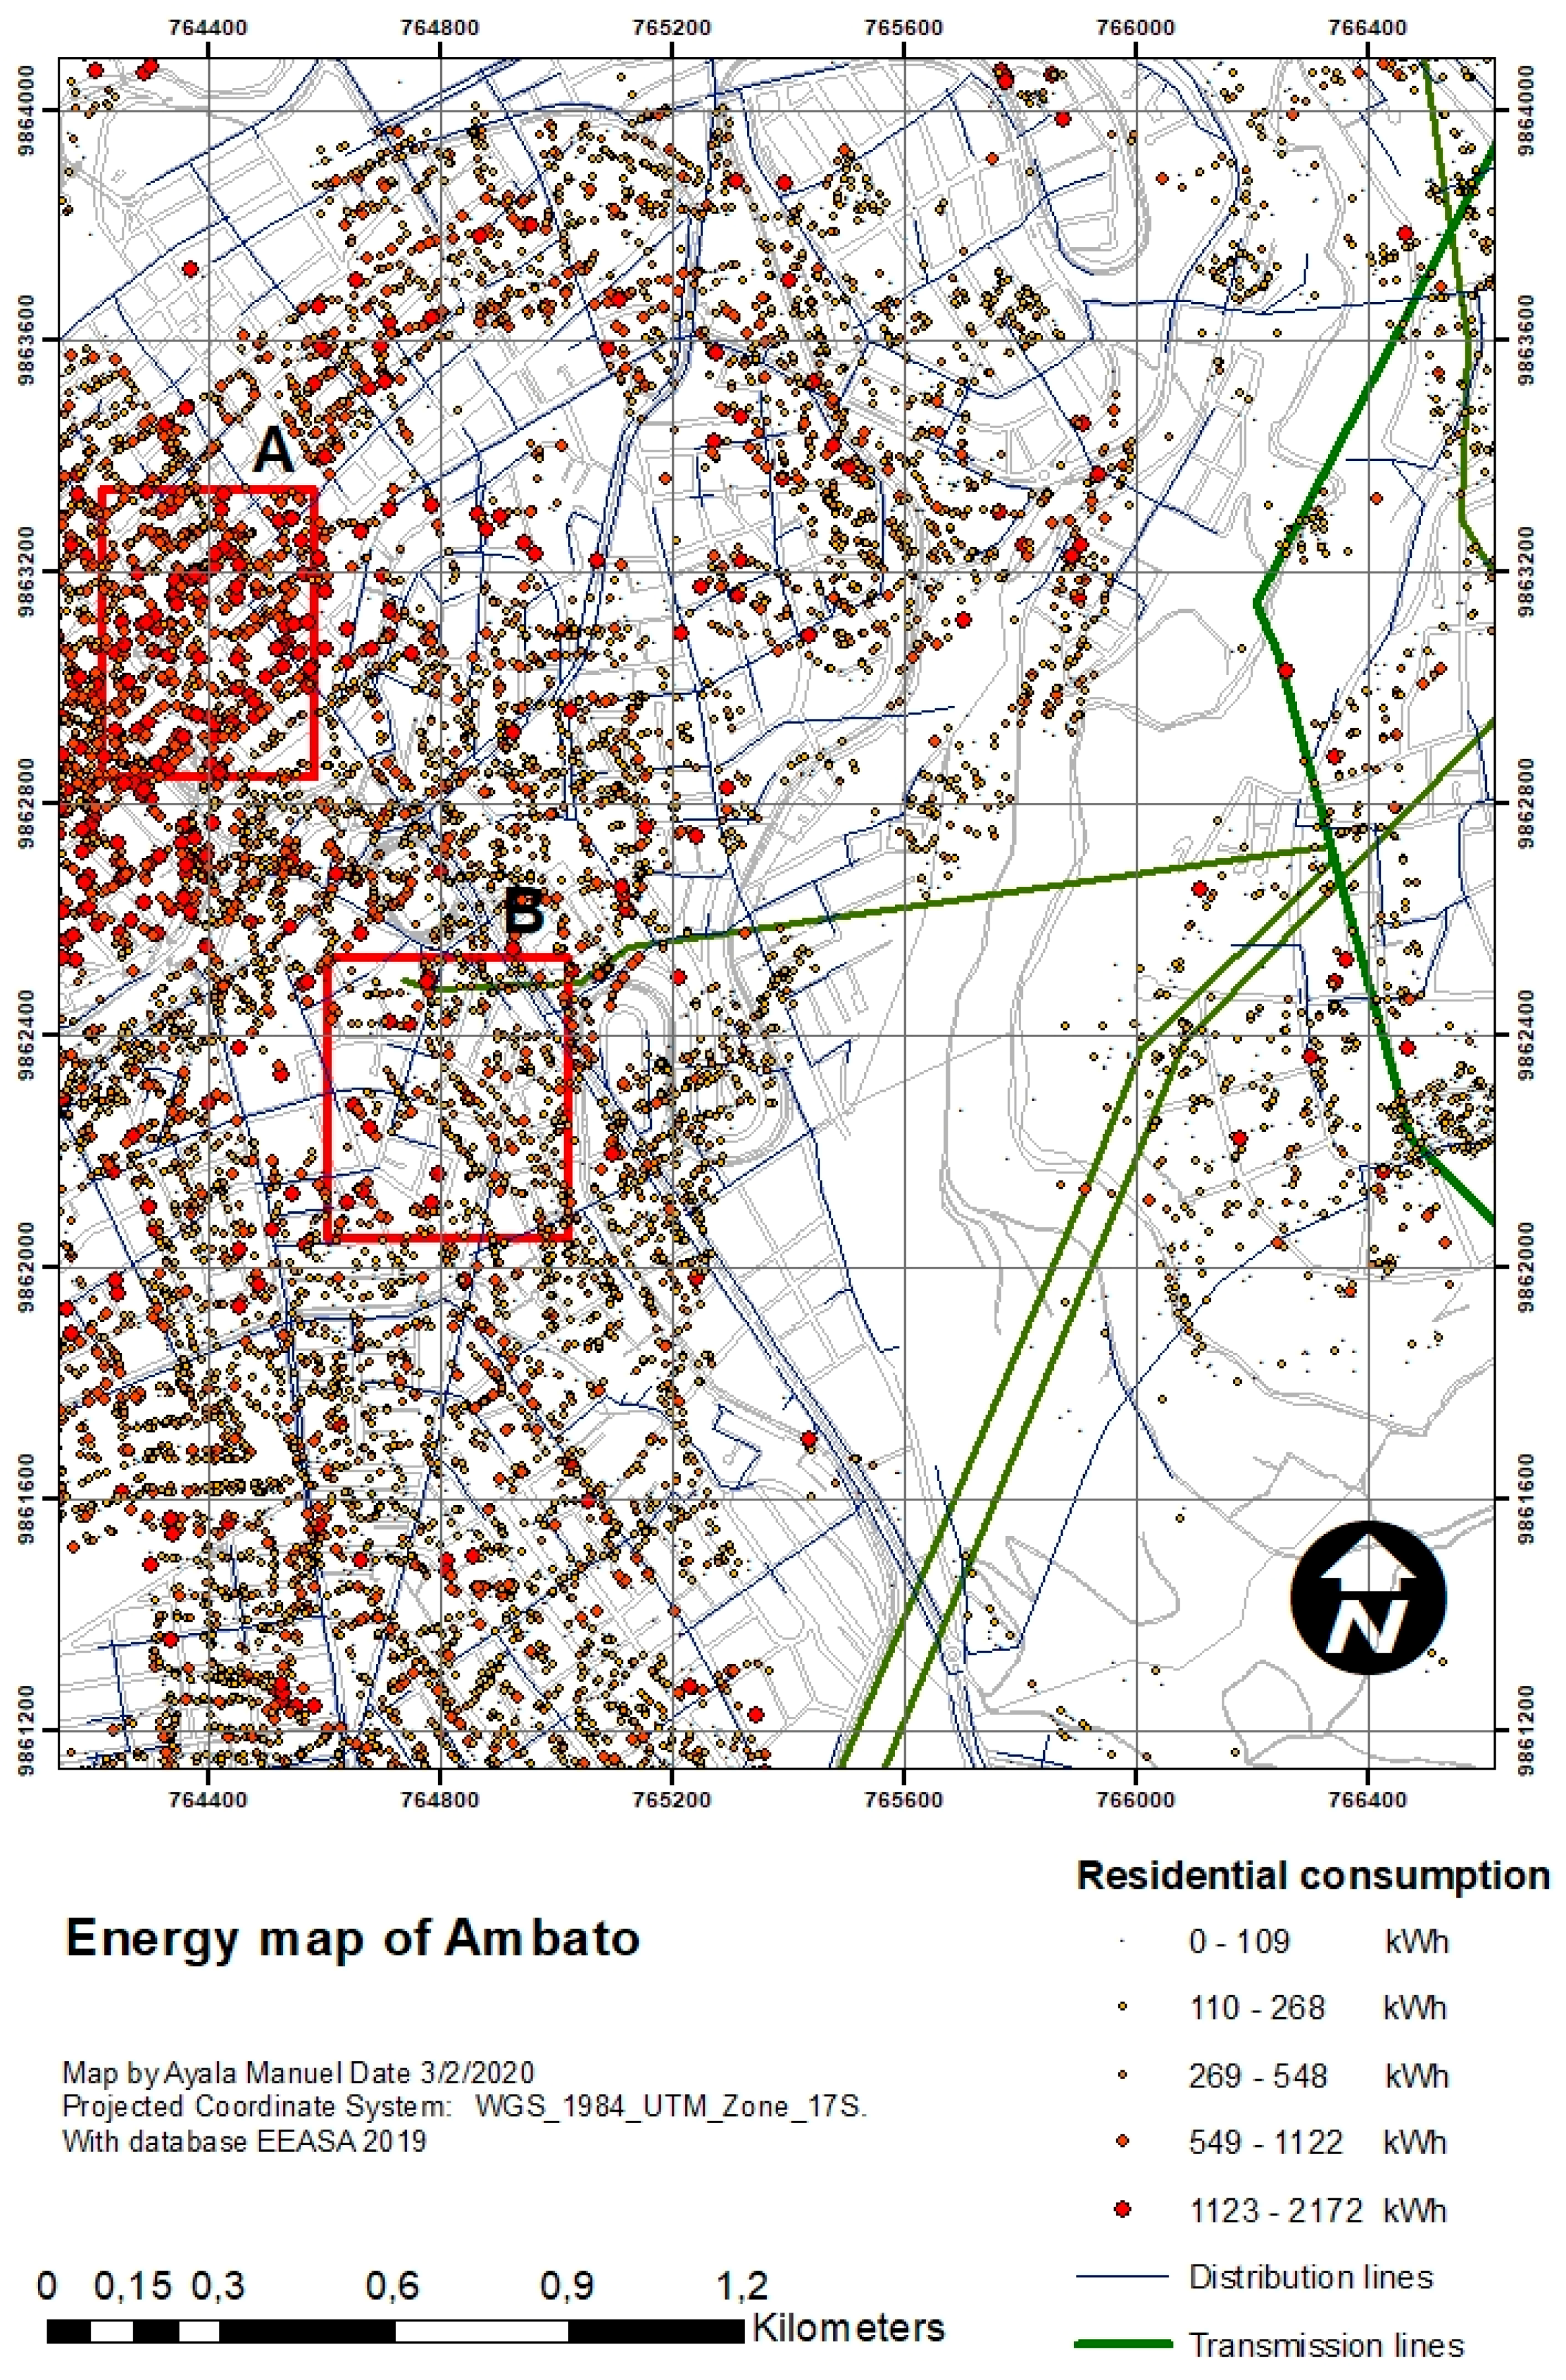
Figure 6 shows the electricity consumption of the network users. This information allows us to determine that approximately 105,374 users consume less than 2200 kWh, which is more than 60% of the users. On the other hand, it is possible to visualize high-density residential sectors such as area A, where consumption is higher due to the use of induction cookers, while area B is a low-density sector. The usage of induction cookers in this area is low, so the power network can absorb more users. Furthermore, a database of commercial and industrial users was compiled, which can help plan the expansion of the power network.
4. Discussion
City growth and urban planning processes are intimately linked to the growth of basic technical service networks, including the power network. Most Ecuadorian cities’ growth is scattered and extensive, with low population density nodes added to the city centre. This growth model is primarily driven by single-family dwellings that are built at growing distance from the centre, and therefore the basic services and equipment it provides. The infrastructure of this type of city has a low investment-to-use ratio, and therefore its efficiency is low compared to that of more compact cities.
New developments are required to assess their risk factors and potential environmental damage, and developing land outside the city limits is currently forbidden in Ecuador.
Ambato, Ecuador, is a mid-tier city with a well-developed power network, but it still has a considerable amount of urban land to be developed and electrified. Ecuadorian cities do not have a standard protocol to archive historic infrastructure data, which hampers data gathering and processing for research purposes. Therefore, gathering and standardizing data for the model was a key activity that entailed a significant effort by the authors.
One of the greatest challenges of contemporary cities is planning their own reconstruction, their renewal, following sustainability criteria. Obtaining knowledge of the historic evolution of their infrastructure helps in assessing the infrastructure needs at a short-, mid-, and long-term, and planning the sustainable renewal accordingly. This planned city renewal and growth gives the different agents and operators (e.g., city government, utilities) the ability to coordinate their interventions, and therefore optimizes the capital costs of new infrastructure, but also their life cycle efficiency, and their interaction with existing infrastructure. This would improve the overall efficiency of urban infrastructures at short-, mid-, and long term through policies focused on urban sustainability. To this end, this research presents a tool for analysing urban infrastructure that is multidisciplinary, economic, and easy to apply in any context due to its flexibility, avoiding the lack of communication between various disciplines [
77].
Research results show a way to integrate knowledge between different disciplines, which can guide decisions in sustainable urbanization plans. The study suggests the need for coherent processes based on benchmarks when linking urban growth and the electricity grid.
5. Conclusions
Sustainable urban planning that maintains the ecologic balance with the surrounding territory and its resources has become a priority for city planning policies. Geospatial and temporal information processed using geographic information system (GIS) software display urban dynamics in an understandable fashion and play a fundamental role in providing clear and deep insights to city planners and decision-makers. These studies will therefore be the basis for sustainable city management and development. This type of analysis can help city planners and decision makers further understand city and infrastructure growth dynamics, and produce policies that bolster sustainable city growth
Ambato, Ecuador, is a mid-tier city with a structured centre and a low-density periphery, dominated by single-family houses. To improve infrastructure efficiency and utilization factor, it is necessary to densify the periphery and prevent urban sprawl.
The model presented in this paper is based on Ambato, Ecuador, but it can be applied in general cases or tailored to fit other urban areas.
Modelling of infrastructure and city expansion is most commonly used in environmental applications. However, universities, governments, cities, and consultants can also use these models to support infrastructure design and management. Therefore, engineers, architects, and city planners should be acquainted with these multidisciplinary methods and techniques to assess infrastructure efficiency, which encourages sharing experiences from experts on different fields and promotes solutions that address issues from different perspectives simultaneously while building upon previous knowledge.
The introduction of GIS software is the base of this multidisciplinary approach of urban infrastructure research and can keep a real-time feed on key infrastructure parameters (users, network capacity, transformer location and capacity, accessibility, availability, etc.) both to city management and utilities. It also makes the avalanche of data readily accessible to human readers almost immediately, so that they can make informed decisions.
The model presented in this paper is a cheap and practical tool, that can both predict patterns and detect bottlenecks or weak points in the different power networks, but it can also be used for other service networks. The multiple layers that it includes also highlight the relation between technical and socioeconomic aspects of the network, thus helping in balancing the different pillars of sustainable development: economy, environment, and society. The model developed and used in this research can help direct the city growth and development in a rational manner, avoiding disjointed neighbourhoods and adding unnecessary strain to the power network.
Furthermore, the model determined that because of the topographic conditions, sustainable growth of Ambato is towards the areas east and south of the existing city. On the other hand, west and north sectors present a more complex expansion due to their hilly nature.
The growth and evolution analysis of Ambato showed a natural population growth coupled with a strong immigration, which led to a peripheral expansion and growth anomalies.
Social and functional analysis reveal the zoning according to the different uses of land, singling out the administrative zones, residential areas with varying population density (with or without yard, single- or multi-storey buildings, disperse districts), construction quality, and hygiene conditions, as well as undeveloped areas.
The general assessment of the relation between anthropization and sociotechnical infrastructures is a field that has a potential to improve urban planning, and its study should be furthered by future research at a local, district, or even neighbourhood levels.


