Article

R&D in Europe: Sector Decomposition of Sources of (in)Efficiency

by
Tihana Škrinjarić
Faculty of Economics and Business, University of Zagreb, Zagreb 10000, Croatia
Sustainability 2020, 12(4), 1432; https://doi.org/10.3390/su12041432
Submission received: 13 January 2020 / Revised: 7 February 2020 / Accepted: 11 February 2020 / Published: 14 February 2020

Abstract

:
Measuring the efficiency of research and development (R&D) expenditure and innovation policy has gained attention in recent years. This research examines the efficiency of 29 selected European countries for the period ranging from 2007 to 2017 in achieving and obtaining R&D goals. The methodology applied is the data envelopment analysis approach with the inclusion of the missing data approach. The contributions of this research include the following: dynamic analysis is conducted to track changes of (in)efficiencies over time; the decomposition of the efficiency is done by separating the main variables of interest into the private, higher education, and government sectors; and the robustness of the results is evaluated, which is often ignored in the literature. The results of the analysis are discussed with possible directions for inefficient countries. The rankings provided in the empirical part of the study confirm previous findings on disparities between the European countries with respect to innovation and the R&D sector.

1. Introduction

Sustainable economic growth is heavily dependent on innovation and research and development (R&D) as primary driving forces [1,2,3,4]. Knowledge-based economies are those that are most successful in achieving sustainable growth and improving economic welfare [5]. The last couple of years have seen an increasing interest in evaluating the performance of industries, regions, countries, and other relevant economic levels. The topic of innovation and its effects on increasing total factor productivity have been researched for several decades now [6,7,8]. Many different world organizations have introduced indices that measure the achievements at all stages of R&D, recognizing the importance of innovation and R&D in achieving sustainable economic growth (according to the European Innovation Scoreboard by the European Commission, Global Innovation Index by Cornell University, INSEAD (INStitut Européen d’ADministration des affaires (European Institute of Business Administration)), and the World Intellectual Property Organization).
The European Commission recognized these topics by launching the Green Paper on Innovation in 1995, Lisbon Strategy in 2000, the Europe 2020 strategy in 2010, as well as Regional Policy Contributing to Smart Growth in Europe, along with other relevant documents and strategies (for details please see [9]). Despite this, the desired level of progress has not been achieved by the European Union members, as the Europe 2020 target of R&D representing 3% of GDP has not been met by many countries [10]. The most recent plan and document is the Multiannual Financial Framework for 2021–2027 [11], where a strong focus is made on innovation. This means that an adequate and objective assessment of causes of this problem is needed. The interest in researching this topic has risen in the last couple of years, which can be seen in the growth of the number of research papers within this area of research. This is especially true for measurement of achievements of R&D, innovation, spillovers of knowledge, their effects on the economic growth, sustainability of the economic system, and other topics. There are some criticisms of the traditional indicators of such issues, as [12] state that such indicators offer partial views of the innovation process in a country. Since sustainable development requires (technological) innovation in order to succeed [13], it is important to obtain objective results in measuring the achievements in the area of innovation and R&D on the country, regional, or other levels important for the decision-makers, policy-makers, and other relevant economic subjects. The common approach of measuring the relative efficiency of innovation and R&D is the data envelopment Analysis (DEA). This approach has advantages in analysis of issues that fall in the domain of public sector activities [14], as well as advantages over other methodological approaches, such as the stochastic frontier analysis (SFA) and panel regression [15,16]. DEA is a non-parametric approach comparing the relative efficiency of the so-called decision-making units (alternatives that need to be compared and ranked one to another). Although the literature utilizing the DEA (and related approaches) within this area of research is constantly growing (please see the second section for a review), some gaps still exist. Some of the research shows rather peculiar results in terms of finding that those countries that have the most problems within the R&D sector are more efficient than those that are better-ranked via some official ranking systems. This means that a step within the modelling process is faulty. Furthermore, static analysis is often conducted. This means that a research either observes only one year in the empirical part or calculates the averages of several years. Such an approach could lead to misleading results. It is important to observe if changes are happening over time, and if so then in which direction. Additionally, the research utilizes variables that are aggregated at a country level. However, it is important to distinguish which sector contributes to the problems or improvements in the area of innovation and R&D. By using country-level data alone, a detailed analysis cannot be made. As [17] state that one of the important factors that can stimulate innovation is public financing, there exists a need to compare the effectiveness of public financing of such activities. This is why decomposition of total investment and research resources within the area of R&D needs to happen.
From an economic standpoint, science and technology driven by innovation should reduce the sense of social and economic stagnation in some countries [18,19,20] that have the ability to acquire and use new knowledge as a primary element of their national wealth [21]. These importance points are recognized in the literature. Thus, obtaining fast and reliable information on where a nation stands in respect to new knowledge, innovation, R&D, and related issues is of great interest to all those included in achieving a better future. Furthermore, the decomposition of R&D expenditure and employment should be done in a formal analysis. In this regard, [22,23,24] discuss in detail the issues of using total R&D expenditure in research due to business R&D (BERD) being heavily affected by the industrial structure of each country. Furthermore, obtaining information from sector disaggregation is important from a private research (private business sector R&D) perspective. This is due to preserving the industrial base in Europe and its competitiveness with private R&D, and the spillovers of private R&Ds to higher education and greater adoption of new technologies [25]. Other studies [26,27] emphasize three reasons why measuring the progress of innovation should be important. First, theoretical analysis and development of innovation theories require innovation assessment. Furthermore, it is important for the development and implementation of public policies. Finally, results obtained from innovation assessment are used in the development of firms’ regions’, or countries’ strategies. Thus, this research, although of a more technical nature, is helpful from an economic point of view, as some previous gaps within this area of research are filled and this analysis can provide additional knowledge and insights for the empirical assessment of an economy’s R&D efficiency. Furthermore, increasing knowledge development and technical change are found to be major sources of productivity and new job creation [28,29,30], which will contribute to the notion of sustainable economic growth. In order to facilitate this, the empirical assessment part should be correct and insightful. This is why the goal of this research is to objectively evaluate the (in)efficiency of selected European countries for the period from 2007 to 2017 based on relevant variables. Efficiency in terms of the definition of the DEA model is the main idea. From an economic point of view, as well as within the DEA methodology, the idea of efficiency in economics is to obtain as many outputs as possible based on as few inputs as possible. In ([31], p. 676) the economic efficiency is defined as “The term efficiency as commonly used generally refers to the ratio between the inputs employed and the outputs realized. More precisely, it refers to the maximization of output produced by a unit of input. If more output can be produced per unit of input, the efficiency increases.” And in ([32], p. 9): “To economists, efficiency is a relationship between ends and means. When we call a situation inefficient, we are claiming that we could achieve the desired ends with less means, or that the means employed could produce more of the ends desired”.
The novelty includes observing not only a dynamic approach so that changes can be observed over time, but also a decomposition of R&D expenditures and research staff variables will be made so that three sectors can be simultaneously observed: the higher education, government, and private sectors. Furthermore, the robustness of the results will be examined so that the findings will be reliable for use in future research as well. Finally, previous research often analyzes more developed countries (such as Western Europe, alongside OECD economies), while Eastern and Southern European countries are not often present in existing studies. This research includes those countries in the analysis as well, since those economies have more problems with innovation and R&D policies compared to the more developed European countries. In this way, detailed results can be obtained so that the policymakers for those countries can benefit from such an analysis.
The rest of the paper is structured as follows. The second section gives an overview of related research within this area. A methodology description is given in the third section, with empirical results analyzed in the fourth section. The fifth and final section concludes the research with recommendations for policy-makers and future work.

2. Related Literature Overview

Although related research has been growing in the last couple of years, there are several approaches to analyzing innovation and R&D. The approach that is mostly related to this research will be analyzed in more detail in the next paragraphs. Some other approaches not strictly related to this paper are briefly mentioned as follows. Regional analysis has become popular in recent years, since innovation clusters exist within some regions. Such papers include [5], where 271 NUTS-2 (Nomenclature of Units for Territorial Statistics) regions in the EU-27 (European Union) were compared based on average values of included variables for the period 2005–2010. The DEA modelling approach was utilized in this study. Another study [33] included 192 European Union regions in their analysis. DEA and structural modelling were combined, where the DEA efficiency scores were used in the second step of the structural modelling (which is sometimes criticized in the literature; please refer to [34]). In another study, 178 NUTS-2 regions (for Western Europe) were compared using a mixed spatial autoregressive model and difference in differences (DID) approach (years included were 2007, 2009, and 2011) [35]. The results indicated that an innovation intensity divergence exists between the examined regions. Other methodological approaches were utilized as well. Panel regression techniques are also popular within this area of research. One study [36] examined 11 European Union countries over the period 1991–2005 to estimate the patent intensity based on characteristics such as public expenditures on education per capita, institutional milieu promoting the development and application of new technology, the Ginarte–Park index of intellectual property protection, R&D expenditure per 1000 employees, value-added in industry as % of GDP, sum of exports and imports as % of GDP, and stock market value as % of GDP. Results were not surprising—Sweden, Finland, the Netherlands, and Germany were found to have the highest R&D efficiency. Other regression applications within these topics can be found in [37].
DEA applications can be found in the following papers. One study [38] observed 28 European Union member states in the year 2018. The authors used the following variables in the study: new doctorate graduates per 1000 people, lifelong learning (population aged 25–64 involved in education), degree to which individuals pursue entrepreneurial activities, public sector R&D expenditures, venture capital investments and private sector R&D expenditure per GDP, non R&D expenditure, employment in knowledge-intensive activities, and sales of new-to-market and new-to-firm innovations. The results indicated that half of the countries were DEA efficient, with strange outlier results, such as Romania being efficient but the UK being inefficient, despite the characteristics of input and output data for both countries. Such results could be due to using many variables in the analysis and the number of decision-making units (DMUs) barely exceeding one condition of the number of inputs and outputs in the analysis and not exceeding two other conditions. Another study [39] combined the K-means clustering with a DEA model for 30 provinces in China over the period 2016–2018. The number of researchers, R&D technical service institutions, total R&D funds, market share of leading products, and other factors were used as the main variables in the study. The authors first used the DEA approach to obtain efficiency scores and the second part of the analysis included the clustering method to obtain information on the (dis)similarities between provinces based on their purely technical and scale efficiencies. Another study [40] compared 44 countries via stochastic frontier analysis (SFA) and panel regression techniques for the period 1966–2003 to assess the effects of international R&D spillover on innovation efficiency. Scientific papers, patent cooperation treaty (PCT) patents, and other variables that consider international spillover ideas were included in the study. The authors found positive international R&D spillover in the production of scientific papers. One author [41] observed 28 European Union countries in three years (2011–2013) via categorical data combined with DEA. Many inputs and outputs were utilized, such as the categorical data from countries that were classed as frontier, secondary emerging, advanced emerging, or developed countries. Additionally, the total number of publications, the number of patents granted by the EPO (European Patent Office) and by the U.S. Patent and Trademark Office, the total number of full-time equivalent R&D personnel, the number of postgraduates employed in science and technology (measured in thousands), and the amount of R&D expenditure (in Euro per habitant) by the government, business, education, and employment sectors in high and medium-high technology manufacturing were explored. Thus, somewhat peculiar results were obtained, showing that some countries (such as Bulgaria, Croatia, and Romania) were found to be just as efficient as the best-performing countries according to some of the international rankings. The reasoning could lie in the fact that the number of countries did not satisfy the aforementioned conditions regarding the number of inputs and outputs in the analysis.
One study [42] included the more developed European countries alongside Japan, the United States, Australia, and Canada for the year 1993. The study was rather simple, with several input and output variables included (GDP, active population, R&D expenditure, publications and patents per country). Germany, the Netherlands, and Austria were the top performers within Europe. One landmark study [43] is the only paper (to the knowledge of the author) that focuses on Central and Eastern European (CEE) countries concerning innovation efficiency. The observed period was 2008–2015, with the variables including annual public and private spending on innovation; scientific and technical journal articles; human resources in science and technology; and numbers of graduates in tertiary education, science, math, computing, engineering, manufacturing, and construction. Based on the chosen set of variables, Romania and Slovakia were found to be the closest to the DEA efficient frontier classification.
By observing previous literature mentioned in this section, it can be seen that research mostly focuses on static analysis, with no robustness checks for results (either via different methodologies or by comparing the results to the international ranking systems). Furthermore, the expenditures on R&D and employment in the R&D sector are used as aggregated variables. However, data on these variables is available on a per-sector basis for higher education, government, and private business sectors. By performing the analysis with disaggregated data, the results can indicate which sector is more or less successful compared to others in achieving efficiency in the area of R&D. This will be done in the empirical section of the paper, with the methodology described in the next section.

3. Methodology Description

3.1. Data Envelopment Analysis

In order to compare the relative R&D efficiencies of European countries in the empirical part of the research, a data envelopment analysis (DEA) will be employed. The DEA represents a set of models and methods of mathematical modelling, with the main aim of comparing the relative efficiencies of the so-called decision-making units (DMUs). This method sits in the field of operations research, as it is a discipline that uses mathematical modelling to aid the decision-making process. The ranking system for the DMUs is constructed based on the idea that all DMUs use inputs in order to produce outputs, with the most efficient DMU being the one which can produce maximal values of outputs with minimal needed inputs. Details on the terminology and basic ideas, assumptions, and introduction can be found in [44,45,46,47,48,49,50].
The notation within this methodology is as follows. Each DMU j uses m inputs (x1j, x2j, ..., xmj) for production of s outputs (y1j, y2j, ..., ysj), j ∈ {1, 2, ..., n}. The matrix notation of all of the collected data is as follows: X and Y consist of all inputs and outputs, respectively, where XMmn and YMsn. Each row in both matrices represents the DMU j, with x o = ( x 1 o , x 2 o ,   ... , x m o ) and y o = ( y 1 o , y 2 o ,   ... , y s o ) , and xo0, xo0 and yo0, yo0. The slacks-based measure (SBM) model was developed in [34,35] and is the approach used in this study. The reason for this is the fact that it has advantages when compared to the most used models, namely the Charnes–Cooper–Rhodes (CCR) and Banker–Charnes–Cooper (BCC) models; the SBM is an additive model with unit invariance properties and the possibility of being non-oriented and non-radial. In other words, the optimization process does not depend on the equally increasing or decreasing output and input values of the DMU under consideration when it is being evaluated; the results are not sensitive to data translation (it is a dimensionally free model) [51]. The main SBM model is as follows:
min λ , s , s + ρ = 1 1 m i = 1 m s i x i o 1 + 1 s i = 1 s s r + y r o s.t. x o = X λ + s y o = Y λ s + λ 0 , s 0 , s + 0
where s and s+ denote vectors of input and output slacks, respectively. The DMU under consideration is SBM-efficient iff ρ * = 1 (i.e., if s = 0 and s+ = 0, no input excess and no output shortfalls exist). Inefficient DMUs can be projected to the efficient frontier in order to calculate the rates of input reduction or output increase needed for it to become efficient:
x ^ o x o s * y ^ o y o + s * +
Relations in Equation (2) explain how much a DMU needs to reduce its inputs and increase its outputs in order to become efficient in terms of the definition of SBM efficiency.
Finally, often the DEA approach to evaluating efficiency has problems with missing data. One of the approaches includes deleting the DMUs from samples that have missing data. This could result in an insufficient number of DMUs in the analysis. Furthermore, if a specific set of countries needs to be evaluated and all of them are included in the sample, this approach is not the best one. Another approach is given in [52], in which it is advised to include penalties for missing data. For those missing values that refer to the input values, the researcher should put in values greater than the maximum available data value. The opposite is true for missing output values. As [52] has shown, doing this in the analysis will yield efficient values that are just as correct as those acquired from the approach involving deleting DMUs with missing data. However, the researcher will be able to compare those DMUs which would not be included in the analysis if the first approach for dealing with missing data was used. This research follows the approach in [52].

3.2. Multiple Criteria Decision Making (MCDM)

The robustness of the results will be evaluated via another branch of operations research, employing a MCDM model. The set of models within the MCDM methodology consists of many approaches that have the goal of obtaining a ranking system based on different criteria, on which the alternatives are compared one to another. When making decisions in real life (for economics, finance, etc.), the decision maker often has to compare alternatives based on different, often conflicting criteria. MCDM models have been developed to aid in making such decisions. Details on this methodology can be found in [53], which is followed for the basic terminology and ideas in this research. When the problem and objectives of a study are outlined, the alternatives have to be identified. Based on these alternatives, a mathematical model is formulated and the problem is solved. The results are presented to the decision maker, who either makes a final decision based on the results or some of the steps in the process are redefined. As a basic MCDM model, this study uses the multi objective optimization by ratio analysis (MOORA) model, as it is robust in respect to the specific criteria observed in [54]. Alternatives that need to be ranked are observed and their criteria are measured in order to be used in the ranking process. The data is collected on m alternatives with n criteria, xij, i ∈ {1, 2, ..., n}, j ∈ {1, 2, ..., m}, and each value is normalized as follows:
x i j * = x i j j = 1 m x i j 2
which means that every value x i j * will be in the range [0, 1]. If the value of the criterion should be the greatest possible, values in (3) are summarized, whereas the criterion which should be the smallest possible is detracted from the total sum:
y j * = i = 1 g x i j * i = g + 1 n x i j *
Now, y j * represents the values of every alternative based on the normalized values of all criteria, and y j * is used for the ranking process. The greater the value of y j * is, the alternative will obtain a better rank. It is assumed in (4) that all of the criteria have the same weights. However, if the decision-maker has arguments why some criteria should have a greater weight compared to others, (4) can be modified as well.

4. Empirical Results
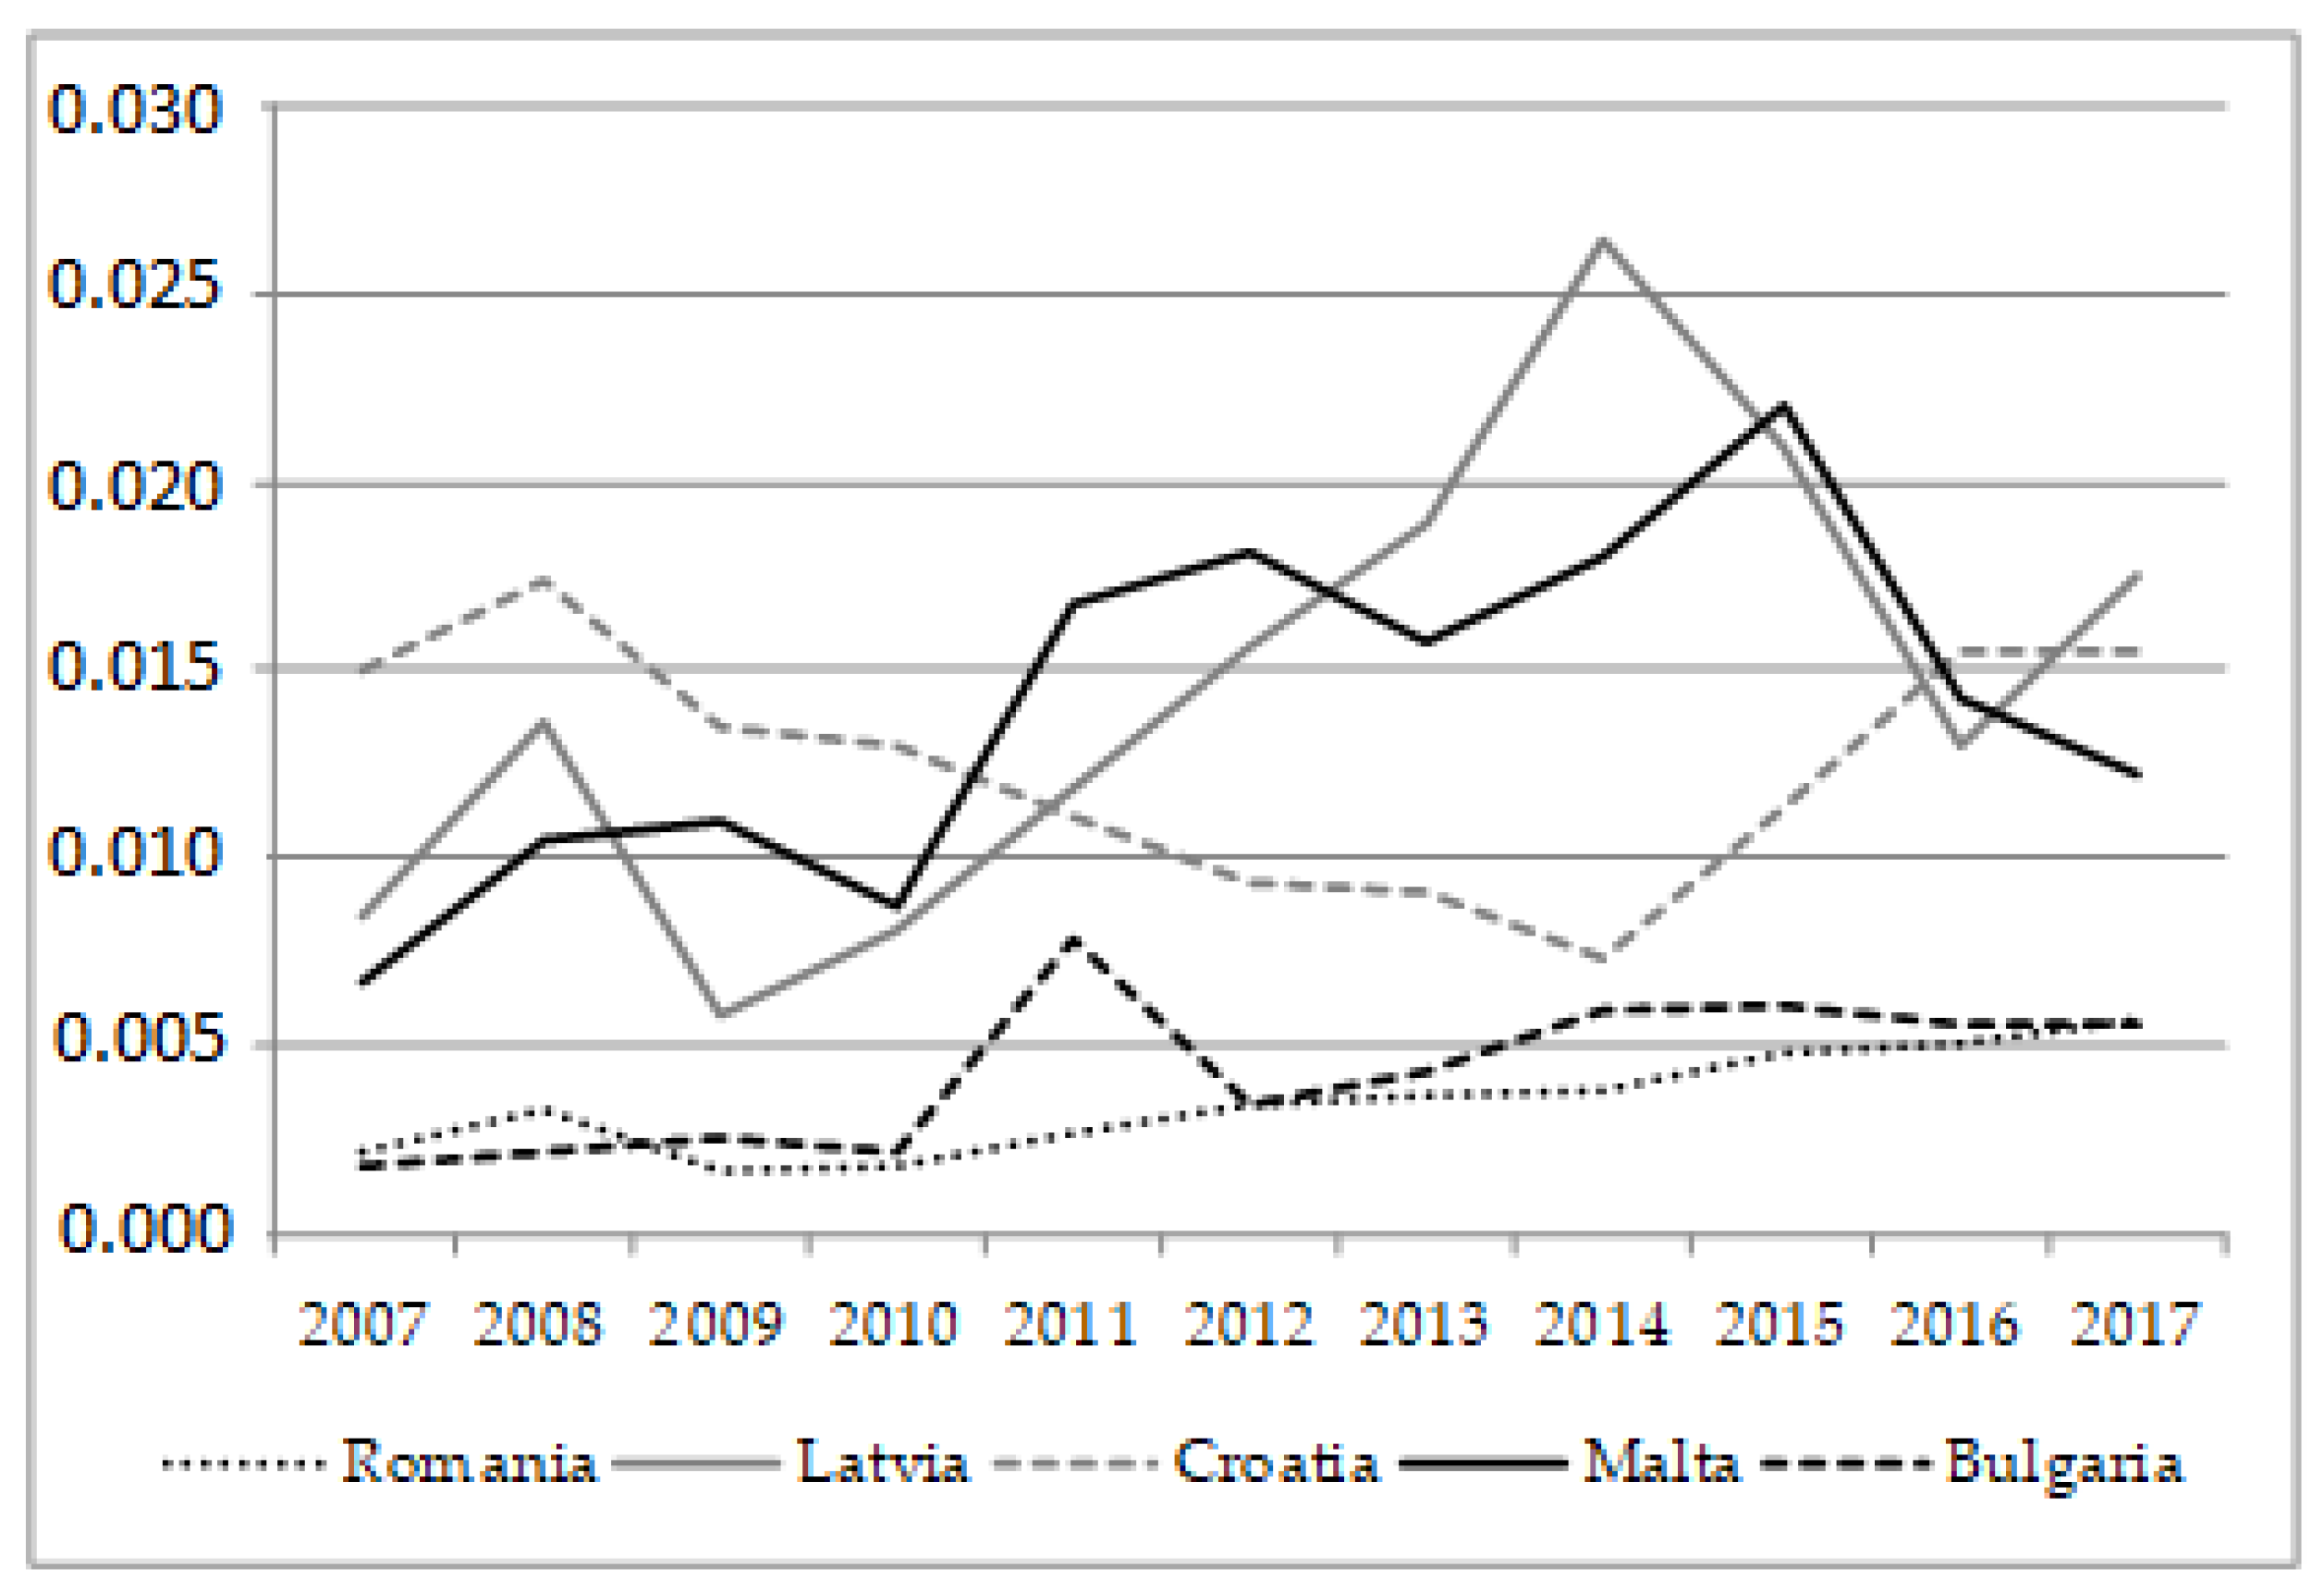
4.1. Main Results

For the empirical comparison of the efficiencies of selected European countries, the following data was collected from the European Commission’s Eurostat [55] and OECD [56] (The Organisation for Economic Co-operation and Development) databases. Yearly data for the period 2007–2017 was available for the following countries: Austria, Belgium, Bulgaria, Croatia, Cyprus, Czech Republic, Denmark, Estonia, Finland, Germany, Greece, Hungary, Iceland, Ireland, Italy, Latvia, Lithuania, Luxembourg, Malta, Netherlands, Norway, Poland, Portugal, Romania, Slovakia, Slovenia, Spain, Sweden, and the United Kingdom. The following variables were chosen based on a review of previous literature, as well as data availability for: intramural R&D expenditure in Euro per capita in the higher education sector, business enterprise sector, and government sector; total R&D personnel and researchers as a percentage of total employment in full-time equivalent work in the higher education sector, business enterprise sector, and government sector; number of scientific journal ranking (SJR) publications per million habitants; patent applications to the European patent office (EPO) per million habitants; percentage of high-tech exports out of the total exports in the higher education sector, business enterprise sector, and government sector. All of the variables were observed as outputs, with the exception of R&D expenditures, for which reciprocal values were observed so that input variables could be used in the analysis as well (the DEA approach needs both inputs and outputs for the optimization process). Previously mentioned research obtained results showing that some countries that are among the worst performers according to international institution rankings, such as the European Innovation Scoreboard classification, were ranked as the best performers in the analysis. The problem with those studies is that authors some of the variables are inputs. However, those variables should be observed as outputs. Please see [57], where Romania was shown to have more efficient R&D output than the UK. Since the DEA methodology asks that variables are identified as inputs or outputs, the following approach was taken. All of the variables have to be defined as inputs or outputs, where the idea is that those variables that have the smallest possible values are referred to as inputs, whereas outputs are defined as those that the researcher wants to have the greatest possible values. Furthermore, it is not possible to have only inputs in the analysis, nor only outputs. Finally, the missing data (which represented only 1.12% of the whole sample size) was penalized, as recommended in [52].
The SBM model was optimized for every year, with the efficiency scores for every country given in Table 1. The best performing countries were: Denmark, Finland, Luxembourg, Sweden, Germany, Iceland, and Norway; whereas the worst performers were Bulgaria, Malta, Croatia, Latvia, Romania, and Slovakia. As defined in [44], the observed DMU is fully efficient (efficiency score equal to 1) only if it is not possible to improve any input or output without worsening some of the other inputs or outputs. This is called the Pareto–Koopmans efficiency, based on the work by economists Vilfredo Pareto and Tjalling Koopmans. Thus, the efficiency scores can be interpreted economically, since they are based on the definitions of efficiency from an economic analysis. However, the interpretations may depend on the model used in the study, as there are many different models within the DEA methodology. The methodological part of the paper states the model’s efficiency if the efficiency score is equal to 1 and the slacks regarding inputs and outputs are equal to zero. In the DEA approach, efficiency means achieving as many outputs as possible while using as few inputs as possible. The problem is choosing inputs and outputs. This research has chosen the inputs and outputs that were used in the previous literature, as well as those variables used by international organizations for calculation of their indices. In the SBM model used in this study, the efficiency score can be interpreted as the ratio of the mean input and output inefficiencies ([44], p. 101).
Firstly, the rankings in Table 1 are similar to the previous findings in [58], where Denmark, Sweden, Finland, and Germany were ranked as the best in technology transfers. In [33], the results show a distinct difference between Eastern and Southern European countries on one side and Western and Northern European countries on the other, based on the analysis of patent applications. In [59], alternative approaches of rankings were used (multi-attribute decision-making problems, MDMP) for a set of 27 European countries and Norway in 2012, where the best performers were found to be Sweden, Finland, Germany, and Denmark, while Romania, Bulgaria, Croatia, and Slovakia were found to be the worst performers. Thus, the best performing countries are those which have a better infrastructure for innovation and R&D, better education levels with greater PISA (Programme for International Student Assessment) results in schooling, and lower levels of corruption, whereas the opposite is true for the worst performers. Furthermore, some specific advantages of the best performers include having the best performance in human resources (Sweden, Finland, Ireland), excellent and effective research systems (Denmark, Netherlands, Sweden, the UK), finance and support (Finland, Sweden, Denmark), and firm investments (Sweden, Germany, Finland) [58]. Inefficient countries found here are in line with results in [43], where the below average CEE performers were Croatia, Bulgaria, and Lithuania.
Some of the unusual results in individual years include the following. Austria experienced a decline in the efficiency index value in 2015, which could have been due to the decrease of funding for research and experimental development of 2 percentage points in that year [60]. The increase of the efficiency scores in 2016 and 2017 that Ireland experienced compared to previous years could be due to a great amount of funding the country received in those years (e.g., €424 million in funding from Horizon 2020) [61]. Additionally, there was increased expenditure for innovation and R&D by government departments, showing an increase of over €40 million in 2017 compared to 2016, reaching the highest levels of expenditures since 2012 [62]. Finally, the Netherlands experienced a decline in efficiency scores in 2012 and 2013. The main causes could be the decrease of the percentage of the population holding doctorate-level education in the previous two years (2011 and 2012) [63], and that the country experienced a double blow in 2012 regarding the economic downturn in 2009, which made the total recovery longer [64]. The lower efficiency score in 2011 for Germany could be due to the decline of business R&D expenditure by foreign firms [65]. The results for 2007 for the Netherlands could be due to the worsening budgetary conditions in that year for the mentioned country [66], whereas Norway was one of the first economies to experience the consequences of the financial crisis of 2007–2008, with the economy weakening as early as 2007 [67].
Some of the main characteristics of the best performers in Table 1 are as follows. The authors of [68] focus on Denmark, where it was found that production in that country is heavily knowledge-based, with an open economy and good access to finance. The authors of [69] found that research priorities in Iceland include public–private collaborative publications, with [70] stating that health technologies, eco-technologies, industry, logistics, space, and ICT (Information and Communications Technologies) sectors represent priority sectors for public financing. Regarding Luxembourg, the government spending on R&D increased by more than 11 times in a 15-year period (2000–2015), which indicates the priorities of its government [71]. This country also has great science, technology, engineering, and math (STEM) competencies [72]. Regarding Finland, [73] states that this country is capable of pulling resources for the innovation and research sectors from the funds available within the EU. The European Structural and Investment Funds represent an important source of R&D and innovation activities in Finland, with almost 1.3 billion Euros received in the period 2014–2020. The Finnish government also channelled more public funding into innovation activities. This indicates that R&D is an important sector within that country. The reason why Sweden is among the most efficient countries could be because Swedish researchers are very open to cooperation with foreign researchers [74].
Furthermore, the dynamics of the worst performing countries are depicted in Figure 1, showing changes over time. This set of countries has faced problems in the last two decades, which have contributed to the current state of affairs. First, the majority of the worst performers include countries that have transitioned from a planned economy to a market economy. In those years of transition, these countries had other focuses outside of innovation and R&D policies. The main issues concern the business practices and legislation that need to be harmonized within European Union countries, as the majority of these countries are newer European Union member states. Some of these countries have a weak linkage between the business sector and the academic sector [75]. Malta faces problems with micro-enterprises (dominating over 95% of total business) within the private sector, which have limited resources regarding innovation and R&D, limited financing, and are vulnerable due to facing riskier R&D activities [76]. Other problems include high-skill sector labor shortages in Bulgaria and Romania, alongside highly-educated population emigration [77], a problem that is present in Croatia as well, where over the 2000–2010 period the total number of full-time equivalent (FTE) researchers decreased by almost a quarter [78]. Furthermore, Croatia’s other problems include a low level of public funding for research and a very fragmented research and innovation (R&I) system [79]. Finally, Latvia faces problems of low productivity and low capacity for absorption of new technologies [80], alongside low rates of risk-taking and entrepreneurship [81].
Table 2 shows detailed results on how much each country needed to reduce inputs or increase outputs (in %) in the year 2007. The efficient countries from Table 1 have zero values for output increases and input reductions. Other countries that were found to be inefficient have positive values for reduction or expansion rates. A detailed table for the year 2017 is given in the Appendix in Table A1. In this way, policy makers can observe dynamic changes over these 11 years, see what has been done, and decide what requires more work. The greatest increase of outputs should be for the variable patent applications to the European Patent Office (EPO) per million inhabitants. This finding is in line with [82], which showed that European patent applications are constantly lagging behind the US and Japan. This same problem is prominent in 2017 (Table A1). Furthermore, by observing the average percentages in the last three columns (for R&D expenditures in all three sectors), the greatest decrease in their reciprocal values is needed in the private business sector. This result is in line with [83]. The needed changes for the worst performing countries in Table 1 can be seen in Table 2 and Table A1, which have to be done to achieve better results in the future. By comparing the needed changes in Table 2 and Table A1, it can be seen that input reductions and output increases have improved in 2017 compared to 2007, meaning the needed input reductions for the majority of countries (as well as output increases) are smaller. This means that some progress has been made over the years. The number of patents is still the greatest problem in 2017, especially for Croatia, Cyprus, Greece, and Hungary.

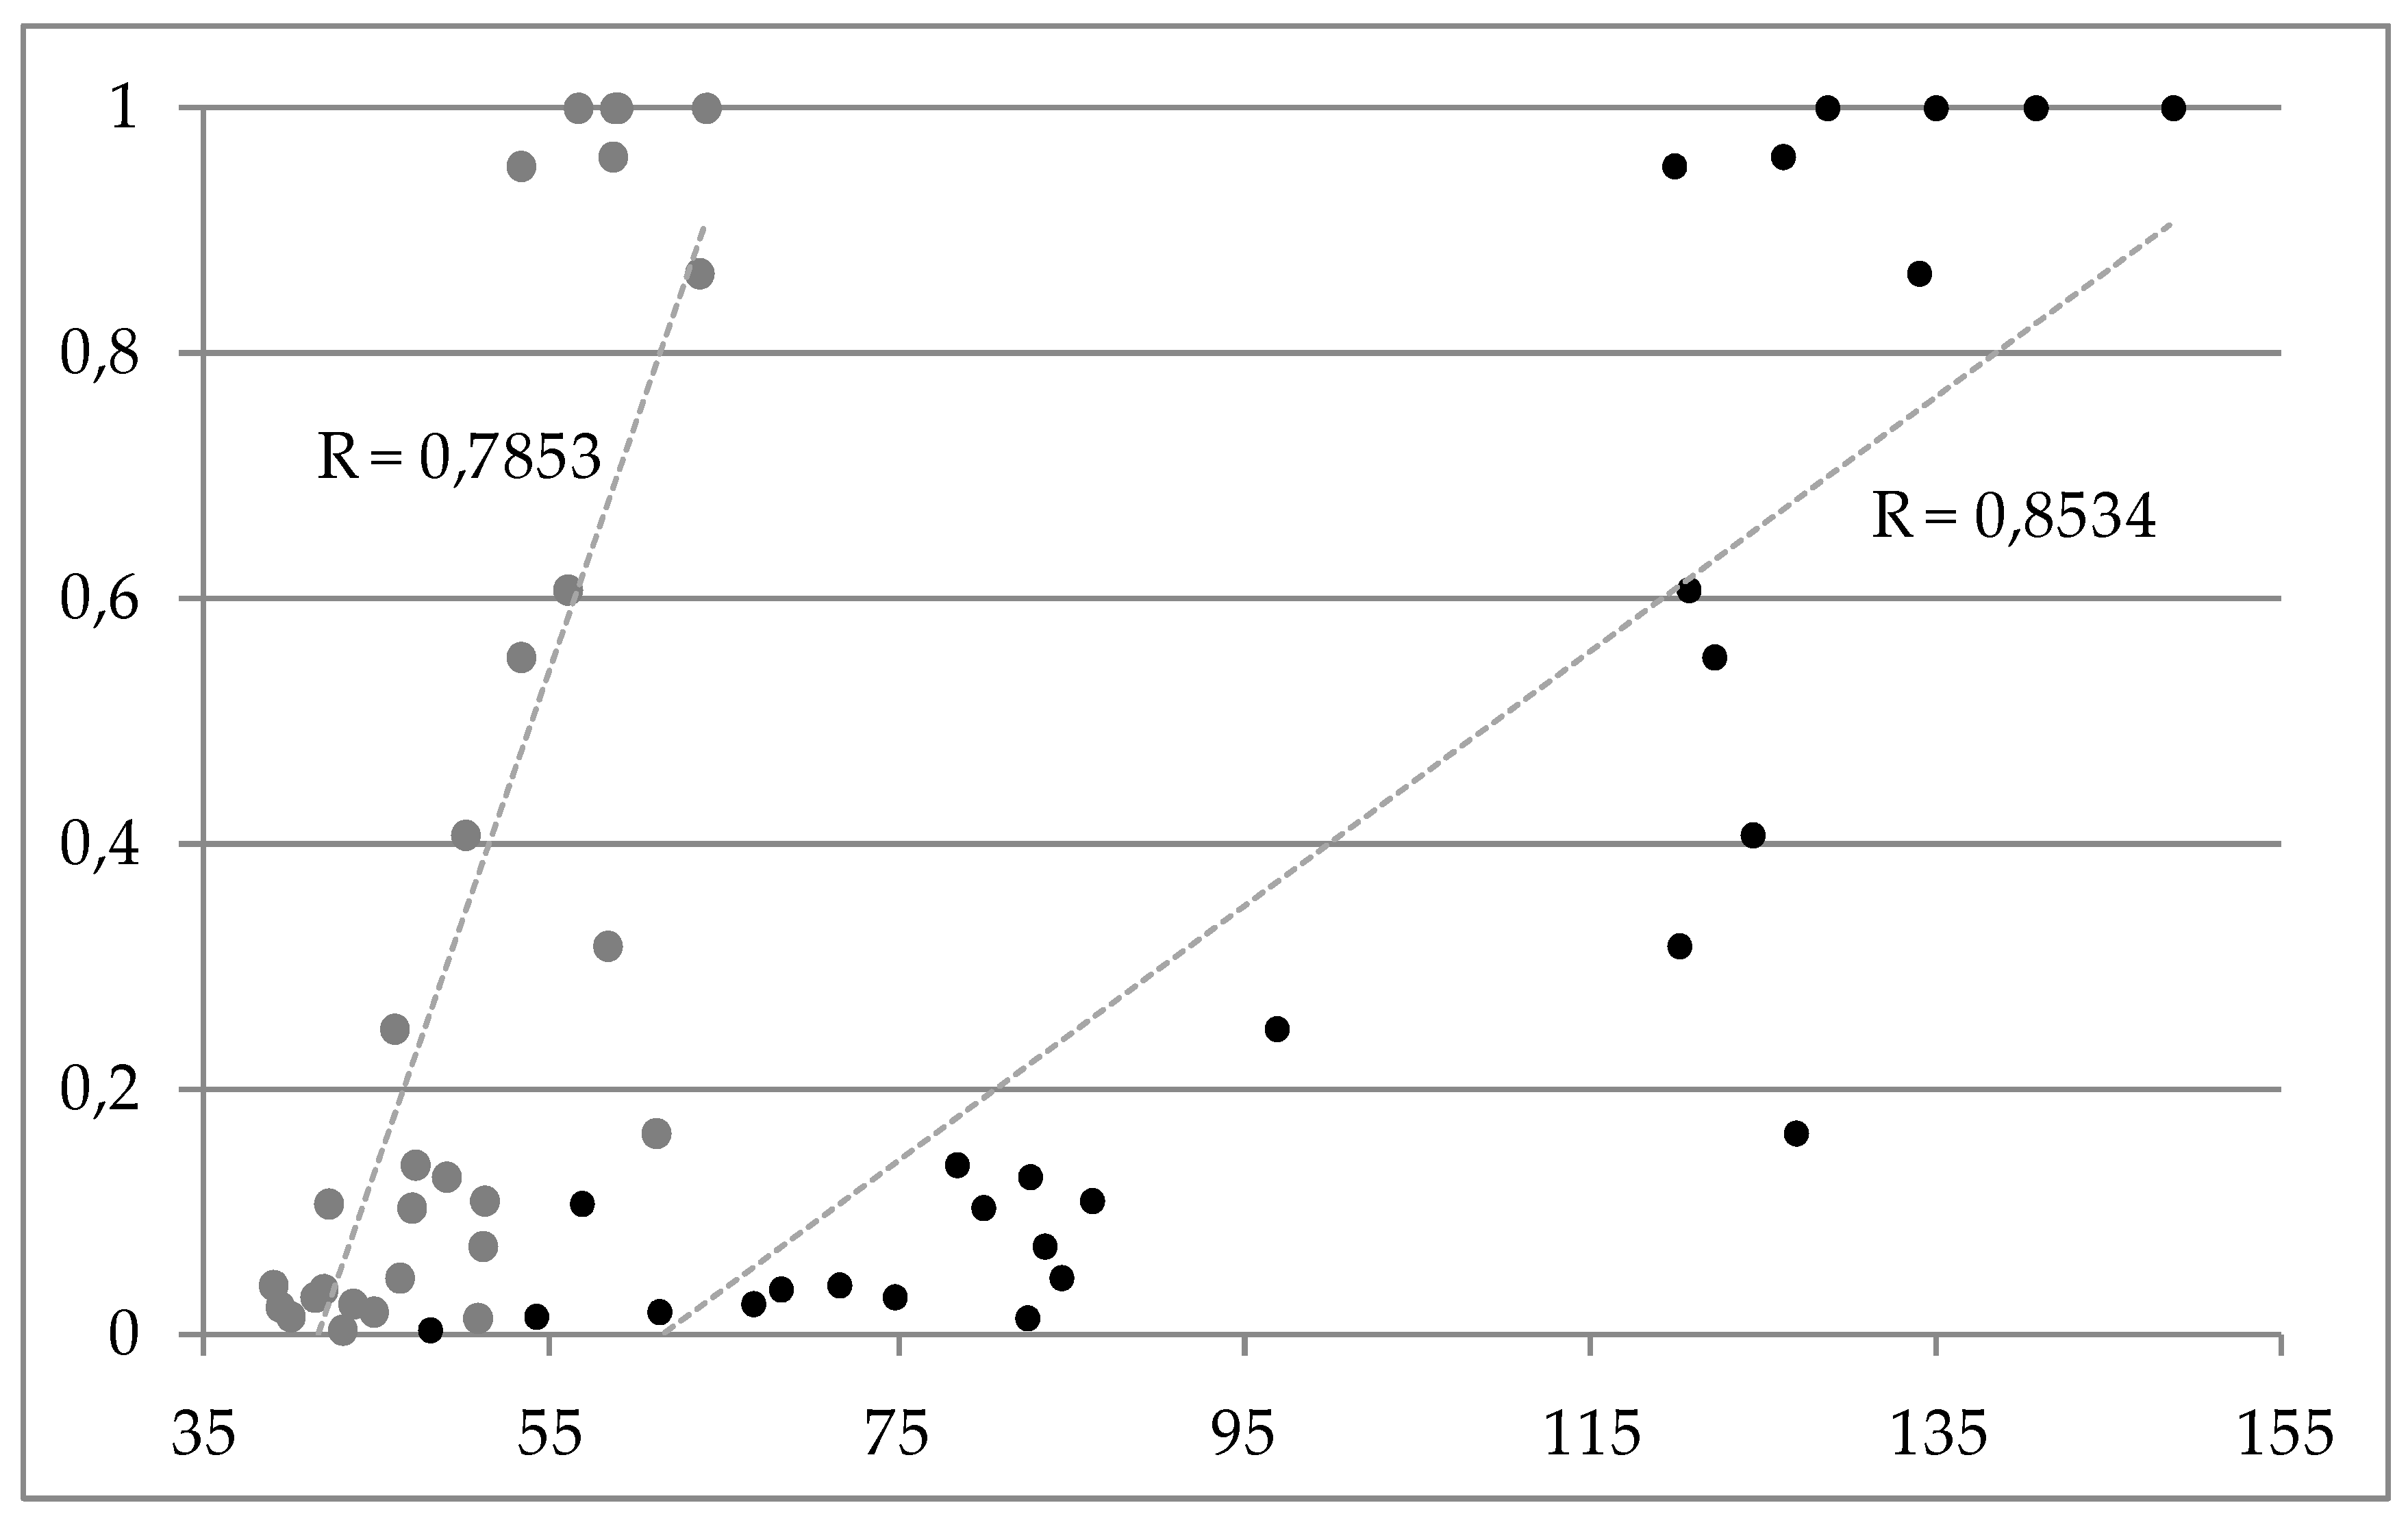
4.2. Checking for Robustness

To test the robustness of the results, a three-fold approach was taken. Firstly, the MCDM methodology was utilized to rank the countries based on the same variables. Within the MCDM modelling, all of the variables can be observed as outputs (i.e., the criteria by which the countries are compared to one another should be the greatest criteria possible). To obtain objective results, all of the criteria were given equal weights. Based on the optimal values of the functions that were optimized, the ranking system was obtained (detailed rankings are shown in the Appendix in Table A2). First, the values for every variable were normalized via Equation (3), and values in Equation (4) were calculated based on values from Equation (3). The second part of the MOORA includes the reference point theory and the min–max metric is used, where the distance of every alternative characteristic is minimized with respect to the number of alternatives [54]. The rankings based on DEA results (previous subsection) and the MCDM results (Table A2) were contrasted with one another and the correlations were calculated for every year. The correlation coefficients are shown in Table 3, where it can be seen that the values are fairly high, even being as high as 98% in some cases (2007 and 2013). This confirms that the previously obtained results are meaningful and can be used in future research and within the decision-making process.
Next, the newest rankings from the European Innovation Scoreboard (EIS) [84] and Global Innovation Index (GII) [85] were obtained and compared to the rankings of the DEA model for the year 2017. The results are shown in Figure 2, where grey dots represent the scatter plot of DEA scores and the EIS values, whereas black dots depict the scatter plot of DEA scores and GII values. The correlations between the rankings are again very high, with over 78% correlation for the EIS ranking, which is based on 27 different indicators, while the GII is based on more than 80 indicators. Since the approach in this paper obtained similar rankings based on 12 variables, it can be said that (i) the rankings obtained in this research are reliable, as they are similar to those of international institutions; (ii) that such an approach can be used in the future to obtain meaningful results with less data, time, and resources; and (iii) that Figure 2 again confirms the validity of the previously obtained results.
The results obtained in this study should be discussed from the perspective of the role of structural and intrinsic differences in R&D decomposition between the countries. This has been recognized in the literature for a long time now [86,87,88]. Thus, the differences should be taken into account, as literature shows that significant differences exist in the rate of productivity returns from R&D investment [89,90,91]. The structural differences occur due to the differences in a country’s specific sector composition, whereas the intrinsic differences are due to countries under-investing in R&D [92]. The intrinsic differences were recognized as being dominant in the European Union in [93], which asks for policies to increase R&D spending, improve intellectual Property rights, and favoring foreign direct investment (FDI). The findings of this study are in line with findings in [94], where the structural effects have the greatest influence on R&D spending in the top performing countries in this analysis (and the opposite is true for the worst performers). They are also in line with [95], where it was found that Germany is experiencing a structural change towards technology-intense industries, whereas Denmark, Austria, and Sweden have experienced changes in the intrinsic effects. Another study [96] found that industrial specialization was the main driver of R&D intensity across countries (sample included 18 countries and 21 sectors). Furthermore, [97,98] found that the sectoral composition effect is greater in European countries, as the information and communications technology (ICT) sector is smaller in the European Union compared to the USA, with [99] finding that 85% of the gap between the European Union and USA in funding R&D is due to structural effects. Others claim that institutional differences (lower levels of government support for research in the EU) are the main reason for the R&D gap [100,101]. One study [102] found that European firms have both structural and intrinsic problems compared to US firms. Structurally, European firms are less able to transform R&D expenditures into productivity gains and the intrinsic problems occur due to a lower level of human capital. Thus, it is evident that future work needs to tackle these issues in more detail so that specific policy recommendations can be made for every country based on the structural and intrinsic differences among them.

5. Conclusions

Although the European Union has set ambitious goals regarding innovation policies and R&D, there are still problems in achieving the set goal of R&D representing 3% of GDP. Regional disparities have increased over time as well. An objective analysis of achievements and shortfalls is needed so that the required policy changes within a country can be made on time and to the best quality. The existing research has some shortfalls, including static analysis being used in the majority of cases, peculiar results being found in some of the research (namely, findings in which some of the worst-ranked countries in many international rankings have been found to be among the best-performers), and usage of aggregated R&D data without the separation of the sources of (in)efficiencies for individual countries. This is why the authors attempted to fill some of the gaps in the literature in this research. The policy recommendations for inefficient countries are as follows. Firstly, setting a common goal and targets to achieve it should not be a priority, as European countries have great differences among them in terms of economic, social, demographic, and other relevant characteristics. However, some guidance could be applied in inefficient countries. This would refer to the better overall education of the workforce, and especially those workers and researchers in the innovation and R&D sectors [103]. The literature here agrees that increasing investments in the education sector, especially higher education, alongside the STEM competencies, leads to better innovation results [104,105]. As a consequence, innovation represents one of the most important factors for sustainability [106]. The literature recognizes that innovation is a driver of sustainable policy-oriented thinking [107]. The openness of R&D researchers to collaboration at national and international levels is also important, due to the synergy it provides (see [108] for a list of important literature on this topic). Cooperation between the public sector and the private business sector is also advised, as the public sector affects the private one by offsetting any negative effects from public sector R&D on the labor costs in the private sector [109,110,111]. Since the majority of the private business sector in European countries is classified as small and medium enterprises, there is a problem in finding resources in terms of money, people, knowledge, and other relevant factors needed for innovation and R&D. Thus, external financing is an important factor that affects the whole process [112]. A variety of different measures have to be designed and access to finance is necessary; these factors depends on a firm’s characteristics [113].
It is important to mention other relevant roles played by sectoral distribution, firm size distribution, and path-dependence regarding the issues observed in this study. Thus, the recommendations for policymakers and future research are not unique and they depend on many factors that change over time. One landmark study [114] was the first major contribution to introduce localized technological changes, where it is stated that technological change is localized by learning characteristics. Another study [115] emphasizes the importance of learning in introducing new technologies (i.e., the learning process will generate necessary knowledge to introduce innovations in a greater manner than R&D activities). In this way, firms that learn how to generate new knowledge can obtain increasing returns due to greater learning abilities. The sizes of the firms that acquire new knowledge, the learning process, and the innovation process are also important. This was realized very early [116], where the link between a firm’s size and productivity was observed, showing that large firms were found to be more efficient than smaller ones. This was recently confirmed in [117], where in a sample of 117,000 firms in Europe the authors found that larger companies were more productive in the period 2002–2010. Similar conclusions were obtained in [118,119], where European and US firms were compared. The firm size of the firms that were R&D-intensive was found to be a significant factor in the total R&D intensity gap between the European and US firms. The combination of sectoral distribution and size was examined in [120], where analysis at the country level for the selected European Union countries showed that large countries had greater R&D intensity, with this intensity being affected by the industrial structure. Earlier studies were examined in [121], where the author concludes that the sectoral distribution of firm characteristics (e.g., a firm’s size) are affected by the technological paradigms of the individual sector. Furthermore, [98] found that the R&D intensity gap between 18 analyzed countries was due to across-sector variation (industrial specialization). Firm size was investigated in [121] for Italian firms, where it was found that policymakers need to provide more help for smaller companies to achieve better networking among them, which could compensate for firm size. Some of the shortfalls of this study include the following. Only available data were included in the study. This study uses a time series approach, for which the last available data upon writing this research was from the year 2017. This means that the included variables are not easy to measure and publicize on a more frequent basis. Furthermore, not all European countries had available data. Thus, the cross-section series approach suffered as well. Future work should extend the findings obtained here so that further dynamics can be observed. Additionally, a country-level approach was taken, which cannot indicate the differences between specific regions within a country. Although a decrease of R&D expenditure and researchers working in this sector was observed in this study, such variables are not measured at a sub-regional level (i.e., the data is not available).
Future research could utilize other models within the DEA approach, which could possibly provide other specific questions that could arise from the policy makers. Furthermore, if the data becomes available for other periods or countries (regions, sub-regions, etc.), such analysis should be extended to obtain full insights into the (in)efficiencies of those countries or regions that were not observed in this study. However, as previous literature did not focus on sources of (in)efficiencies in the same way that it was done here, this research provides contributions to the literature.

Funding

This research received no external funding.

Acknowledgments

The author would like to thank the anonymous referees for their valuable comments and suggestions, which contributed to the quality of the paper.

Conflicts of Interest

The author declares no conflict of interest.

Appendix A

Table A1. Percentage increases of outputs and decreases of inputs for the year 2017.
CountryExpNo PapersPatEmp PvtEmpl GovEmp HighRes PvtRes GovRes HighR&D PvtR&D GovR&D High
Austria0.000.000.000.000.000.000.000.000.000.000.000.00
Belgium0.0037.2622.8223.54104.460.0014.0777.835.020.000.0021.92
Bulgaria3497.754103.7171,180.923872.191196.023081.593671.651055.822762.5940.580.0080.95
Croatia1049.46779.9833,284.073498.10861.31644.584100.66743.90615.0558.582.280.00
Cyprus429.07570.8712,004.135214.08590.12941.036553.441419.38910.2381.140.0040.20
Czech Republic42.98390.64827.80412.22419.00363.66297.29387.54506.470.0035.8014.48
Denmark0.000.000.000.000.000.000.000.000.000.000.000.00
Estonia113.28309.452108.87750.9360.8786.58811.0092.2798.7779.610.0051.02
Finland0.000.000.000.000.000.000.000.000.000.000.000.00
Germany0.000.000.000.000.000.000.000.000.000.000.000.00
Greece1269.45375.2210,548.021091.02211.58131.96828.33170.24122.8756.820.000.18
Hungary530.381151.847511.221174.22951.931128.96940.59711.381241.710.0012.5227.59
Iceland0.000.000.000.000.000.000.000.000.000.000.000.00
Ireland0.000.000.000.000.000.000.000.000.000.000.000.00
Italy0.00521.7451.11254.42448.71346.70507.97499.72479.910.0035.6523.34
Latvia0.00345.741164.801568.66468.2765.57866.33426.31127.0495.6790.2379.60
Lithuania721.05609.2113,212.431539.49525.88279.141305.96382.16248.2774.110.001.36
Luxembourg0.000.000.000.000.000.000.000.000.000.000.000.00
Malta0.002004.694117.121785.9813,240.292112.112438.6420,317.472283.570.0090.837.80
Netherlands0.000.000.000.000.000.000.000.000.000.000.000.00
Norway0.000.000.000.000.000.000.000.000.000.000.000.00
Poland1264.813576.2415,004.232698.693308.94890.672979.713479.64894.4431.3452.240.00
Portugal898.05637.427652.29919.98679.47136.691086.33804.87123.7958.5911.610.00
Romania1902.062650.7047,170.978097.061734.943597.2612,147.551715.563682.7965.700.0074.49
Slovakia718.76662.6212,747.162616.70785.45458.642568.88525.81351.2349.050.007.56
Slovenia188.77164.08298.13167.45297.75297.7881.35233.67324.640.0056.8358.97
Spain267.30429.24701.55612.47487.17207.70439.26515.52251.0925.9544.110.00
Sweden0.000.000.000.000.000.000.000.000.000.000.000.00
United Kingdom0.00142.23296.27250.391236.7537.49277.411456.8835.260.0038.540.00
Table A2. Multi objective optimization by ratio analysis (MOORA) rankings used to check robustness.
Country20072008200920102011201220132014201520162017
Austria109109121099877
Belgium1111111011888788
Bulgaria2929282829292828282828
Croatia2222212323252526252121
Cyprus2524242526272727272323
Czech Republic1414151613141413121212
Denmark54657454441
Estonia1818171716171716151515
Finland11112122123
Germany66845345556
Greece2120202017191917161616
Hungary1719181819181818171818
Iceland2333391024222425
Ireland1213131315121210999
Italy1616161521161514131313
Latvia2425272624262623262626
Lithuania2021222218232119212019
Luxembourg32221211212
Malta2727252727222425202727
Netherlands88986566665
Norway77574677242224
Poland2626262425242322232522
Portugal1917191920202020191717
Romania2828292928282929292929
Slovakia2323232122212221181920
Slovenia13124119111111111110
Spain1515141414151615141414
Sweden45768733334
United Kingdom910121210131312101011

References

  1. Acemoglu, D.; Aghion, P.; Zilibotti, F. Distance to frontier selection and economic growth. J. Eur. Econ. Assoc. 2006, 4, 37–74. [Google Scholar] [CrossRef]
  2. Aghion, P.; Howitt, P. Endogenous Growth Theory; MIT Press: Cambridge, MA, USA, 1998. [Google Scholar]
  3. Romer, P.M. Increasing returns and long-run growth. J. Political Econ. 1986, 94, 1002–1037. [Google Scholar] [CrossRef] [Green Version]
  4. Romer, P.M. Endogenous technical change. J. Political Econ. 1990, 98, S71–S102. [Google Scholar] [CrossRef] [Green Version]
  5. Aristovnik, A. Efficiency of the R&D Sector in the EU-27 at the Regional Level: An Application of DEA. Lex Localis J. Local Self-Gov. 2014, 12, 519–531. [Google Scholar]
  6. Griliches, Z. Issues in assessing the contribution of R&D to productivity growth. Bell J. Econ. 1979, 10, 92–116. [Google Scholar]
  7. Griliches, Z. Productivity puzzles and R&D: Another nonexplanation. J. Econ. Perspect. 1988, 2, 9–21. [Google Scholar]
  8. Coe, D.T.; Moghadam, R. Capital and trade as engines of growth in France: An application of Johansen’s cointegration methodology. Imf Staff Pap. 1993, 40, 542–666. [Google Scholar] [CrossRef]
  9. Weresa, M.A. Innovation Union initiative—An overview. In Strengthening the Knowledge Base for Innovation in the European Union; Weresa, M.A., Ed.; Polish Scientific Publishers PWN: Warsaw, Poland, 2018. [Google Scholar]
  10. Eurostat, Europe 2020 Indicators—R&D and Innovation. 2019. Available online: https://ec.europa.eu/eurostat/statistics-explained/index.php/Europe_2020_indicators_-_R%26D_and_innovation#R.26D_intensity_in_the_EU_is_growing_too_slowly_to_meet_the_Europe_2020_target (accessed on 4 January 2020).
  11. European Commission. A Modern Budget for a Union that Protects, Empowers and Defends. The Multiannual Financial Framework for 2021–2027 [COM/2018/321]. 2018. Available online: https://eur-lex.europa.eu/legal-content/EN/TXT/?uri=COM%3A2018%3A321%3AFIN (accessed on 4 January 2020).
  12. Zabala-Iturriagagoitia, J.M.; Voigt, P.; Gutiérrez-Gracia, A.; Jiménez-Sáez, F. Regional Innovation Systems: How to Assess Performance. Reg. Stud. 2007, 41, 661–672. [Google Scholar] [CrossRef]
  13. Ashford, N.A.; Hall, R.P. The importance of regulation-induced innovation for sustainable development. Sustainability 2011, 3, 270–292. [Google Scholar] [CrossRef] [Green Version]
  14. Charnes, A.; Cooper, W.; Lewin, A.Y.; Seiford, L.M. (Eds.) Data Envelopment Analysis. Theory, Methodology and Applications; Kluwer: Boston, MA, USA, 1994. [Google Scholar]
  15. Guan, J.; Chen, K. Modeling the relative efficiency of national innovation systems. Res. Policy 2012, 41, 102–115. [Google Scholar] [CrossRef]
  16. Coelli, T.J. Recent developments in frontier modelling and efficiency measurement. Aust. J. Agric. Resour. Econ. 1995, 39, 219–245. [Google Scholar] [CrossRef] [Green Version]
  17. Lewandowska, M.S.; Rószkiewicz, M.; Weresa, M.A. Additionality from public support to R&D and innovation in the European Union. In Strengthening the Knowledge Base for Innovation in the European Union; Weresa, M.A., Ed.; Polish Scientific Publishers PWN: Warszawa, Poland, 2018. [Google Scholar]
  18. Joly, P.B. Reimagining innovation. In Innovation beyond Technology; Lechevalier, S., Ed.; Springer: Berlin, Germany, 2019; pp. 25–45. [Google Scholar]
  19. Pestre, D. Environment and social innovation: Why technology never was the solution. In Innovation beyond Technology; Lechevalier, S., Ed.; Springer: Berlin, Germany, 2019; pp. 175–194. [Google Scholar]
  20. Koizumi, S. The light and shadow of the fourth industrial revolution. In Innovation beyond Technology; Lechevalier, S., Ed.; Springer: Berlin, Germany, 2019; pp. 63–86. [Google Scholar]
  21. Morone, P.; Taylor, R. Knowledge diffusion dynamics and network properties of face-to-face interactions. J. Evol. Econ. 2004, 14, 327–351. [Google Scholar] [CrossRef]
  22. Sandven, T.; Smith, K. Understanding R&D Intensity Indicators–Effects of Differences in Industrial Structure and Country Size; IDEA Paper No. 14; University of Oslo/STEP Group: Oslo, Norway, 1998. [Google Scholar]
  23. van Pottelsberghe, B. Europe’s R&D: Missing the Wrong Targets? In Bruegel Policy Brief; Bruegel: Brussels, Belgium, 2008. [Google Scholar]
  24. Reinstaller, A.; Unterlass, F. Sectoral innovation modes and the state of economic development: Implications for innovation policy in the new member states. In The Challenge for European Innovation Policy; Edward Elgar Publishing: Cheltenham, UK, 2011. [Google Scholar]
  25. Challenges for European Innovation Policy: Cohesion and Excellence from a Schumpeterian Perspective; Radosevic, S.; Kaderabkova, A. (Eds.) Edward Elgar Publications: Aldershot, UK, 2011. [Google Scholar]
  26. Archibugi, D.; Filippetti, A. The retreat of public research and its adverse consequences on innovation. Technol. Forecast. Soc. Chang. 2017. [Google Scholar] [CrossRef]
  27. Paas, T.; Poltimäe, H. Innovation Measurement Problems: An Illustrative Case of the Baltic Countries. In Innovation Systems in Small Catching-Up Economies, 99, Innovation, Technology, and Knowledge Management 15; Springer Science+Business Media: Berlin, Germany, 2012. [Google Scholar] [CrossRef]
  28. Krüger, J.J. Productivity and structural change: A review of the literature. J. Econ. Surv. 2008, 22, 330–363. [Google Scholar] [CrossRef]
  29. Coccia, M. Science, funding and economic growth: Analysis and science policy implications. World Rev. Sci. Technol. Sustain. Dev. 2008, 5, 1–27. [Google Scholar] [CrossRef]
  30. Bogliacino, F.; Piva, M.; Vivarelli, M. R&D and employment: An application of the LSDVC estimator using European microdata. Econ. Lett. 2012, 116, 56–59. [Google Scholar]
  31. Marciano, A.; Battista Ramello, G. (Eds.) Encyclopedia of Law and Economics; Springer Science + Business Media, LLC: Berlin, Germany; Brooklyn, NY, USA, 2019. [Google Scholar]
  32. Heyne, P. Efficiency. In The Fortune of Encyclopedia of Economics; Warner Books: New York, NY, USA.
  33. Kalapouti, K.; Petridisb, K.; Malesiosc, C.; Deyd, P.K. Measuring efficiency of innovation using combined Data Envelopment Analysis and Structural Equation Modeling: Empirical study in EU regions. Ann. Oper. Res. 2017, in press. [Google Scholar] [CrossRef] [Green Version]
  34. Simar, L.; Wilson, P.W. Estimation and inference in two-stage semi-parametric models of production processes. J. Econ. 2007, 136, 31–64. [Google Scholar] [CrossRef]
  35. Bednář, P.; Halásková, M. Innovation performance and R&D expenditures in Western European regions: Divergence or convergence? J. Int. Stud. 2018, 11, 210–224. [Google Scholar]
  36. Johansson, B.; Lööf, H.; Savin, M. European R&D Efficiency. Econ. Innov. New Technol. 2015, 24, 140–158. [Google Scholar]
  37. Guan, J.C.; Chen, K.H. Modeling macro-R&D production frontier performance: An application to Chinese province-level R&D. Scientometrics 2010, 82, 165–173. [Google Scholar]
  38. Anderson, H.J.; Stejskal, J. Diffusion Efficiency of Innovation among EU Member States: A Data Envelopment Analysis. Economies 2019, 7, 34. [Google Scholar] [CrossRef] [Green Version]
  39. Cao, Y.; You, J.; Shi, Y.; Hu, W. Evaluating R&D and Transformation Functional Platforms’ Operational Performance Using a Data Envelopment Analysis Model: A Comparative Study. Sustainability 2019, 11, 5023. [Google Scholar]
  40. Liu, J.; Lu, K.; Cheng, S. International R&D Spillovers and Innovation Efficiency. Sustainability 2018, 10, 3974. [Google Scholar]
  41. Karadayi, M.A.; Ekinci, Y. Evaluating R&D performance of EU countries using categorical DEA. Technol. Anal. Strat. Manag. 2018, 31, 227–238. [Google Scholar]
  42. Rousseau, S.; Rousseau, R. The scientific wealth of European nations: Taking effectiveness into account. Scientometrics 1998, 42, 75–87. [Google Scholar] [CrossRef]
  43. Dobrzanski, P. Innovation expenditures efficiency in Central and Eastern European Countries. Proc. Rij. Fac. Econ. J. Econ. Bus. 2018, 36, 827–859. [Google Scholar]
  44. Cooper, W.W.; Seiford, L.M.; Zhu, J. Handbook on Data Envelopment Analysis; Springer: New York, NY, USA, 2011. [Google Scholar]
  45. Sexton, T.R.; Silkman, R.H.; Hogan, A.J. Data Envelopment Analysis: Critique and Extensions. In Measuring Efficiency: An Assessment of Data Envelopment Analysis; Silkman, R.H., Ed.; Jossey-Bass: San Francisco, CA, USA, 1986; pp. 73–105. [Google Scholar]
  46. Sexton, T.R. Data envelopment analysis: Critique and extension. New Dir. Program Eval. 1986, 32, 73–105. [Google Scholar] [CrossRef]
  47. Doyle, J.; Green, R. Efficiency and Cross-efficiency in DEA: Derivations, Meanings and Uses. J. Oper. Res. Soc. 1994, 45, 567–578. [Google Scholar] [CrossRef]
  48. Sickles, R.C.; Zelenyuk, V. Measurement of Productivity and Efficiency Theory and Practice; Cambridge University Press: Cambridge, UK, 2019. [Google Scholar]
  49. Tone, K. Several Algorithms to Determine Multipliers for Use in Cone-Ratio Envelopment Approaches to Efficiency Evaluations in DEA. In Computational Approaches to Economic Problems; Amman, H., Rustem, B., Whinston, A.B., Eds.; Kluwer Academic Publishers: Dordrecht, The Netherlands, 1997; pp. 91–109. [Google Scholar]
  50. Tone, K. A slack-based measure of efficiency in data envelopment analysis. Eur. J. Oper. Res. 2001, 130, 498–509. [Google Scholar] [CrossRef] [Green Version]
  51. Thrall, R.M. Duality, classification, and slacks in DEA. Ann. Oper. Res. 1996, 66, 23–125. [Google Scholar] [CrossRef]
  52. Kousmanen, T. Data Envelopment Analysis with Missing Data. J. Oper. Res. Soc. 2009, 60, 1767–1774. [Google Scholar] [CrossRef]
  53. Hurson, C.H.; Zopounidis, C. On the use of multicriteria decision aid methods to portfolio selection. In Multicriteria Analysis; Clímaco, J., Ed.; Springer: Berlin/Heidelberg, Germany, 1995. [Google Scholar]
  54. Brauers, W.K.M.; Zavadskas, E.K. Project management by multimoora as an instrument for transition economies. Technol. Econ. Dev. Econ. 2010, 16, 5–24. [Google Scholar] [CrossRef]
  55. European Commission Eurostat Database. Available online: http://ec.europa.eu/eurostat/data/database (accessed on 28 December 2019).
  56. OECD Database. Available online: https://data.oecd.org/ (accessed on 28 December 2019).
  57. European Commission. Innovation Union Scoreboard; DG Internal Market, Industry, Entrepreneurship and SMEs: Brussels, Belgium, 2015. [Google Scholar]
  58. Furková, A. Multiple selections of alternatives under constraints: case study of European countries in area of research and development. Trendy v Podnikání 2014, 5, 73–88. [Google Scholar]
  59. Federal Ministry Republic of Austria. Austrian Research and Technology Report 2019; Federal Ministry of Education, Science and Research, 1010: Vienna, Austria, 2019.
  60. European Commission. Research and Innovation in Ireland. 2020. Available online: https://ec.europa.eu/ireland/news/key-eu-policy-areas/research-and-innovation_en (accessed on 4 February 2020).
  61. Department of Business, Enterprise and Innovation of Ireland. Innovation 2020 Third Progress Report; Government of Ireland: Dublin, Ireland, 2020.
  62. Van den Broek, J.; Deuten, J.; Jonkers, K. RIO Country Report 2017: The Netherlands, EUR 29183 EN; Publications Office of the European Union: Luxembourg, 2018; ISBN 978-92-79-81700-7. [Google Scholar]
  63. OECD. OECD Reviews of Innovation Policy NETHERLANDS Overall Assessment and Recommendations; 2 rue André-Pascal, 75775; OECD Publications: Paris, France, 2014. [Google Scholar]
  64. Sofka, W.; Shehu, E.; Hristov, H. RIO Country Report 2017: Germany; Publications Office of the European Union: Luxembourg, 2018; ISBN 978-92-79-81203-3. [Google Scholar]
  65. European Commission. European Economy; Economic and Financial Affairs: Brussels, Belgium, 2007. [Google Scholar]
  66. International Monetary Fund. Norway: Staff Report for the 2009 Article IV Consultation; I MF Country Report No. 10/24; International Monetary Fund: Washington, DC, USA, 2010. [Google Scholar]
  67. Knudsen, M.P.; Christensen, J.L.; Christensen, P. RIO Country Report 2017: Denmark; EUR 29187 EN; Publications Office of the European Union: Luxembourg, 2018; ISBN 978-92-79-81276-7. [Google Scholar]
  68. European Commission. Country profile Iceland. European Research Area Progress Report 2018. 2019. Available online: https://ec.europa.eu/info/sites/info/files/research_and_innovation/era/era-2018_country_profile_is.pdf (accessed on 28 December 2019).
  69. Grotz, M.; Walentiny, M.; Boever, E.; Crean, G. Research and Innovation Smart Specialization Strategy (RIS3), The Government of the grand Duchy of Luxembourg 2017. Available online: https://meco.gouvernement.lu/dam-assets/publications/rapport-etude-analyse/minist-economie/ris3/luxembourg-research-and-innovation-smart-specialisation-strategy-2017.pdf (accessed on 28 December 2019).
  70. Rumpf, G.; Alexander, S.; del Rio, J.-C. RIO Country Report 2016; European Commission: Luxembourg, 2017. [Google Scholar]
  71. European Commission. Science, Research and Innovation Performance of the EU 2018 Strengthening the foundations for Europe’s future 2018. Available online: https://ec.europa.eu/info/sites/info/files/srip-report-full_2018_en.pdf (accessed on 28 December 2019).
  72. European Commission. Research and Innovation performance in Country Profile Finland 2014; European Commission: Brusseles, Belgium, 2014. [Google Scholar]
  73. Swedish Research Barometer. The Swedish Research System in International Comparison 2017. Available online: https://www.vr.se/download/18.5639980c162791bbfe69788d/1555334890011/Swedish-Research-Barometer_VR_2017.pdf (accessed on 28 December 2019).
  74. Klincewicz, K.; Szkuta, K.; Marczewska, M. RIO Country Report 2016: Poland; European Union: Brusseles, Belgium, 2016. [Google Scholar]
  75. The Malta Council for Science & Technology. National Research and Innovation Strategy 2020; The Malta Council for Science & Technology: Il-Kalkara, Malta, 2014.
  76. Roman, M. Regional efficiency of the knowledge economy in the new EU countries: the Romanian and Bulgarian case. Rom. J. Reg. Sci. 2010, 4, 33–53. [Google Scholar]
  77. Regional Cooperation Council. Western Balkans Regional R&D Strategy for Innovation; The World Bank Group: Washington DC, USA, 2013; pp. 123–211. [Google Scholar]
  78. Račić, D.; Švarc, J.; Testa, G. RIO Country Report 2017: Croatia; EUR 29155 EN; Publications Office of the European Union: Luxembourg, 2018; ISBN 978-92-79-81200-2. JRC111260. [Google Scholar]
  79. OECD. OECD Economic Surveys—Latvia 2019. Available online: https://www.oecd.org/economy/surveys/Latvia-2019-OECD-economic-survey-overview.pdf (accessed on 28 December 2019).
  80. Rodríguez-Pose, A. Is R&D investment in lagging areas of Europe worthwhile? Theory and empirical evidence. Pap. Reg. Sci. 2001, 80, 275–295. [Google Scholar]
  81. van Pottelsberghe de la Potterie, B. The Quality Factor in Patent Systems; Bruegel Working Paper: Brussels, Belgium, 2010. [Google Scholar]
  82. OECD. The European Union: A People-Centred Agenda an International Perspective; Organisation for Economic Co-operation and Development: Brussels, Belgium, 2019. [Google Scholar]
  83. European Innovation Scoreboard. Summ. Innov. Index 2019. Available online: https://interactivetool.eu/EIS/EIS_2.html (accessed on 28 December 2019).
  84. Global Innovation Index. 2019 Report. 2019. Available online: https://www.globalinnovationindex.org/gii-2019-report (accessed on 28 December 2019).
  85. Pakes, A.; Schankerman, M. An exploration into the determinants of research intensity. In R&D, Patents, and Productivity; Griliches, Z., Ed.; University of Chicago Press: Chicago, IL, USA, 1984; pp. 209–232. [Google Scholar]
  86. Erken, H. Productivity, R&D and Entrepreneurship (No. EPS-2008-147-ORG). ERIM PhD Series in Research in Management, 147; Erasmus Research Institute of Management (ERIM): Rotterdam, The Netherlands, 2008. [Google Scholar]
  87. Mathieu, A.; van Pottelsberghe de la Potterie, B. A note on the drivers of R&D intensity. Res. World Econ. 2010, 1, 56–65. [Google Scholar]
  88. Becker, B.; Hall, S.G. Do R&D strategies in high-tech sectors differ from those in low-tech sectors? An alternative approach to testing the pooling assumption. Econ. Chang. Restruct. 2013, 46, 183–202. [Google Scholar]
  89. Cincera, M.; Ortega-Argíles, R.; Moncada-Paternò-Castello, P. The Performance of Top R&D Investing Companies in the Stock Market; IRMA Working Papers Series No 14/2009, JRC53544; European Commission, Joint Research Centre–Institute for Prospective Technological Studies and Directorate General Research: Seville, Spain, 2009. [Google Scholar]
  90. Montresor, S.; Vezzani, A. The production function of top R&D investors: Accounting for size and sector heterogeneity with quantile estimations. Res. Policy 2015, 44, 381–393. [Google Scholar]
  91. Ortega-Argilés, R.; Piva, M.; Potters, L.; Vivarelli, M. Is corporate R&D investment in high-tech sectors more effective? Contemp. Econ. Policy 2010, 28, 353–365. [Google Scholar]
  92. Moncada-Paternò-Castello, P. Corporate R&D Intensity Decomposition: Theoretical, Empirical and Policy Issues; IPTS Working Papers on Corporate R&D and Innovation, No. 02/2016; European Commission, Joint Research Centre (JRC): Seville, Spain, 2016. [Google Scholar]
  93. Stancik, J.; Biagi, F. Characterizing the Evolution of the EU-US R&D Intensity Gap using Data from Top R&D Performers; JRC Working Papers JRC75892; Joint Research Centre: Seville, Spain, 2012. [Google Scholar]
  94. Reinstaller, A.; Unterlass, F. Sectoral innovation models and level of economic development: Implications for innovation policy in the new member states. In Challenges for European Innovation Policy; Radosevic, S., Kaderabakova, A., Eds.; Edward Elger: Cheltenham, UK, 2011. [Google Scholar]
  95. Reinstaller, A.; Unterlass, F. Comparing business R&D across countries over time: A decomposition exercise using data for the EU 27. Appl. Econ. Lett. 2012, 19, 1143–1148. [Google Scholar]
  96. Mathieu, A.; van Pottelsberghe de la Potterie, B. A note on the drivers of R&D intensity. In CEPR Discussion Paper No. 6684; CEPR Centre for Economic Policy Research: London, UK, 2008. [Google Scholar]
  97. Ciupagea, C.; Moncada-Paternò-Castello, P. Industrial R&D Investment: A comparative analysis of the top EU and non-EU companies Based on the EU 2004 R&D Scoreboard. Rev. Econ. Mund. 2006, 15, 89–120. [Google Scholar]
  98. Guellec, D.; Sachwald, F. Research and entrepreneurship: A new innovation strategy for Europe. In Conference of the French Presidency of the European Union, Knowledge Intensive Growth: European Strategies in the Global Economy; Mininistère de L’enseignement Supérieur et de la Recherche: Paris, France, 2008. [Google Scholar]
  99. Moncada-Paternò-Castello, P.; Ciupagea, C.; Smith, K.; Tübke, A.; Tubbs, M. Does Europe perform too little corporate R&D? A comparison of EU and non-EU corporate R&D performance. Res. Policy 2010, 39, 523–536. [Google Scholar]
  100. Pianta, M. Innovation and employment. In The Oxford Handbook of Innovation; Fagerberg, J., Mowery, D., Nelson, R., Eds.; Oxford University Press: Oxford, UK, 2005; pp. 568–598. [Google Scholar]
  101. Erken, H.; van Es, F. Disentangling the R&D shortfall of the EU vis-à-vis the US. In Jena Economic Research Papers, No. 107; Universität Jena und MaxPlanck-Institut für Ökonomik: Jena, Germany, 2007. [Google Scholar]
  102. Ortega-Argilés, R.; Piva, M.; Vivarelli, M. The Transatlantic Productivity Gap: Is R&D the Main Culprit? Can. J. Econ. 2014, 47, 1342–1371. [Google Scholar]
  103. Beun, H.; van Schaik, M.; Schout, A. The Innovation Potential of the Policy Brief EU Budget 2021–2027; Netherlands Institute of International Relations, Policy Brief: The Hague, The Netherlands, 2019. [Google Scholar]
  104. Elnasari, A.; Fox, K.J. R&D, Innovation and Productivity: The Role of Public Support. Kdi J. Econ. Policy 2015, 37, 73–96. [Google Scholar]
  105. Vinding, A.L. Absorptive capacity and innovative performance: A human capital approach. Econ. Innov. New Technol. 2006, 15, 507–517. [Google Scholar] [CrossRef]
  106. Mazzanti, M.; Rizzo, U. Diversely Moving Towards a Green Economy: Techno Organisational Decarbonisation Trajectories and Environmental Policy in EU Sectors. Technol. Soc. Chang. 2017, 115, 111–116. [Google Scholar] [CrossRef] [Green Version]
  107. Mazzanti, M. Eco-innovation and sustainability: Dynamic trends, geography and policies. J. Environ. Plan. Manag. 2018, 61, 1851–1860. [Google Scholar] [CrossRef]
  108. Anić, I.-D. Facilitating Effective Science-Industry Collaborative Research: A Literature Review. Econ. Trends Econ. Policy 2017, 26, 7–40. [Google Scholar]
  109. Jeaumotte, F.; Pain, N. From Ideas to Development: The Determinants of R&D and Patenting; OECD Economics Department Working Paper No. 457; OECD: Paris, France, 2005. [Google Scholar]
  110. Jeaumotte, F.; Pain, N. Innovation in the Business Sector; OECD Economics Department Working Paper No. 459; OECD: Paris, France, 2005. [Google Scholar]
  111. Czarnitzki, D.; Licht, G. Additionality of public R&D grants in a transition economy: The case of Eastern Germany. Econ. Transit. 2006, 14, 101–131. [Google Scholar]
  112. Hall, B.H.; Moncada-Paternò-Castello, P.; Montresor, S.; Vezzani, A. Financing constraints, R&D investments and innovative performances: New empirical evidence at the firm level for Europe. Econ. Innov. New Technol. 2015, 25, 183–196. [Google Scholar]
  113. Moncada-Paternò-Castello, P.; Vezzani, A.; Hervás, F.; Montresor, S. Financing R&D and Innovation for Corporate Growth: What New Evidence Should Policymakers Know? European Commission Policy Brief: Luxembourg, 2014. [Google Scholar]
  114. Atkinson, A.B.; Stiglitz, J.E. A New View of Technological Change. Econ. J. 1969, 79, 573–578. [Google Scholar] [CrossRef]
  115. Stiglitz, J.E. Learning to learn, localized learning and technological progress. In Economic Policy and Technological Performance; Dasgupta, P., Stoneman, P., Eds.; Cambridge Unviersity Press: Cambridge, UK, 1987; pp. 123–153. [Google Scholar]
  116. Williamson, O.E. Hierarchical control and optimum firm size. J. Political Econ. 1967, 75, 123–138. [Google Scholar] [CrossRef]
  117. Bartelsman, E.J.; Falk, M.; Hagsten, E.; Polder, M. Productivity, technological innovations and broadband connectivity: firm-level evidence for ten European countries. Eurasian Bus. Rev. 2019, 9, 25–48. [Google Scholar] [CrossRef]
  118. Cincera, M.; Veugelers, R. Young leading innovators and the EU’s R&D intensity gap. Econ. Innov. New Technol. 2013, 22, 177–198. [Google Scholar]
  119. Stancik, J.; Biagi, F. Characterizing the evolution of the EU R&D intensity gap using data from top R&D performers. In The Economics of Knowledge, Innovation and Systemic Technology Policy; Crespi, F., Quatraro, F., Eds.; Routledge: Abington, UK, 2015. [Google Scholar]
  120. Dosi, G. Sources, Procedures, and Microeconomic Efects of Innovation. J. Econ. Lit. 1988, 26, 1120–1171. [Google Scholar]
  121. Zoia, M.G.; Barbieri, L.; Cortelezzi, F.; Marseguerra, G. The determinants of Italian firms’ technological competencies and capabilities. Eurasian Bus. Rev. 2018, 8, 453–476. [Google Scholar] [CrossRef]
Figure 1. SBM scores over the observed period for the most inefficient countries.
Sustainability 12 01432 g001
Figure 2. Comparisons of DEA scores (y-axis) to the European Innovation Scoreboard (EIS) and Global Innovation Index (GII) scores (x-axis). Grey dots represent the scatter plot for DEA scores and the EIS values, while black dots depict the scatter plot for DEA scores and GII values. Finland and Germany almost overlap in the scatter plot, as they both have a DEA score of 1 and EIS scores equal to 58.5 and 58.4, respectively.
Sustainability 12 01432 g002
Table 1. Efficiency scores in the slacks-based measure (SBM) model for the years 2007–2017.
Country20072008200920102011201220132014201520162017
Austria0.2550.3300.3230.3340.3850.4110.43310.60611
Belgium0.1980.2670.2830.2830.3250.3850.3930.4650.5570.6250.704
Bulgaria0.0020.0020.0030.0020.0080.0030.0040.0060.0060.0060.006
Croatia0.0150.0170.0130.0130.0410.0090.0090.0070.0110.0160.015
Cyprus0.0140.0180.0180.0140.0100.0060.0120.0120.0140.0170.018
Czech Republic0.0660.0750.0620.0630.1680.0970.1070.1170.1540.1320.165
Denmark11111111111
Estonia0.0370.0530.0530.0570.1340.0680.0700.0600.0890.0810.095
Finland11111111111
Germany11110.563111111
Greece0.0300.0400.0300.0190.1030.0260.0310.0360.0450.0420.047
Hungary0.0300.0340.0300.0300.0560.0320.0360.0360.0430.0380.048
Iceland11111111111
Ireland0.1210.1460.1710.1540.2010.1650.1500.1790.20311
Italy0.0990.1170.1170.1150.1540.1340.1440.1490.1540.1640.180
Latvia0.0080.0140.0060.0080.0120.0160.0190.0260.0210.0130.017
Lithuania0.0090.0150.0070.0100.1190.0210.0300.0380.0330.0260.034
Luxembourg11111111111
Malta0.0070.0100.0110.0090.0170.0180.0160.0180.0220.0140.012
Netherlands0.36811110.5860.5631111
Norway0.4791111111111
Poland0.0080.0100.0100.0150.0170.0210.0230.0270.0330.0140.019
Portugal0.0360.0470.0400.0370.1100.0310.0350.0370.0460.0460.050
Romania0.0020.0030.0020.0020.0030.0030.0040.0040.0050.0050.006
Slovakia0.0100.0110.0090.0150.0630.0200.0200.0280.0450.0280.033
Slovenia0.1050.1520.1510.1500.2010.2010.2030.1930.1790.1740.187
Spain0.1010.1260.1190.1280.2090.1160.1150.1160.1210.1250.143
Sweden11111111111
United Kingdom0.1590.1840.1620.1590.1630.1570.1450.1680.1850.1600.169
Table 2. Percentage increases of outputs and reductions of inputs for the year 2007.
CountryExpNo. PapersPatEmp PvtEmpl GovEmp HighRes PvtRes GovRes HighR&D PvtR&D GovR&D High
Austria99.5877.18045.59634.59109.1592.22740.52115.31058.971.9
Belgium319.11111.22086.12691.3976.22162.97687.1178.01062.5532.52
Bulgaria4534.265116.31139,209.8615,845.53775.154576.7720,081.02777.743978.8193.82092.44
Croatia1208.251125.4516,141.484389.08633.311160.068262.54705.311101.9281.37040.11
Cyprus760.141746.324513.047996.263535.592461.339783.677292.212154.1676.6324.750
Czech Republic546.671052.792373.07831.79864.568881358.2938.481040.8119.31043.47
Denmark000000000000
Estonia1152.221281.032227.621792.431923.04624.752406.841800.94571.6247.9570.740
Finland000000000000
Germany000000000000
Greece2000919.64597.91667.762106.82481.722352.342907.48622.9173.1940.070
Hungary646.862942.534094.292983.371914.762136.843342.412159.792294.7632.04031.53
Iceland000000000000
Ireland20.58142.29104.45218.751338.33217.62262.622066.14211.54067.7610.64
Italy831.21609.69230.55594.65808.9400.11393.911120.49633.8820.7332.150
Latvia4560.9810,913.715,040.8911,860.973972.121486.3321,306.094813.851537.1665.3520.850
Lithuania1361.532340.7348,752.215113.29769.41691.545843.27856.48677.7485.469.250
Luxembourg000000000000
Malta394.917303.536197.843178.3425,142.362891.825217.6536,535.13048.964.792.070
Netherlands7.3423.190110.67165.268.24183.36192.03127.7750.6831.380
Norway500.730025.3464.521.4829.5257.345.4128.3218.850
Poland7498.415114.0921,475.0411,677.594913.222167.3613,444.354378.011910.0672.12032.15
Portugal919.71932.748053.371814.671141.19801.691889.82987.84610.2555.5330.730
Romania4666.678255.95149,703.338255.52757.128060.489627.912541.238065.2985.62068.04
Slovakia4404.124647.5615,474.1510,055.893118.091660.312,828.572971.661427.7163.41050.04
Slovenia1234.48405.12414.39473.95386.18750.87791.83393.22703.9720.1054.96
Spain1497.71742.34983.8710.92826.83415.521171.63974.2428.62.455.940
Sweden000000000000
United Kingdom82.1999.0866.21188.261121.4853.24281.731628.8931.84055.139.47
Note: R&D = research and development; Exp = exports variable; No. papers = the number of scientific journal ranking (SJR) papers; Pat = patents; Emp = employment; Res = researchers; pvt, gov, and high = private business, government, and higher education sectors, respectively (please see first paragraph in Section 4.1).
Table 3. Correlations between rankings for data envelopment analysis (DEA) and multiple criteria decision making (MCDM) approaches.
Correlation20072008200920102011201220132014201520162017
Value0.98210.97750.96990.97840.63420.97850.98480.96980.85780.88340.7538

