Spatial and Temporal Variations in Extreme Precipitation and Temperature Events in the Beijing–Tianjin–Hebei Region of China over the Past Six Decades


Abstract
:1. Introduction
2. Data and Methods
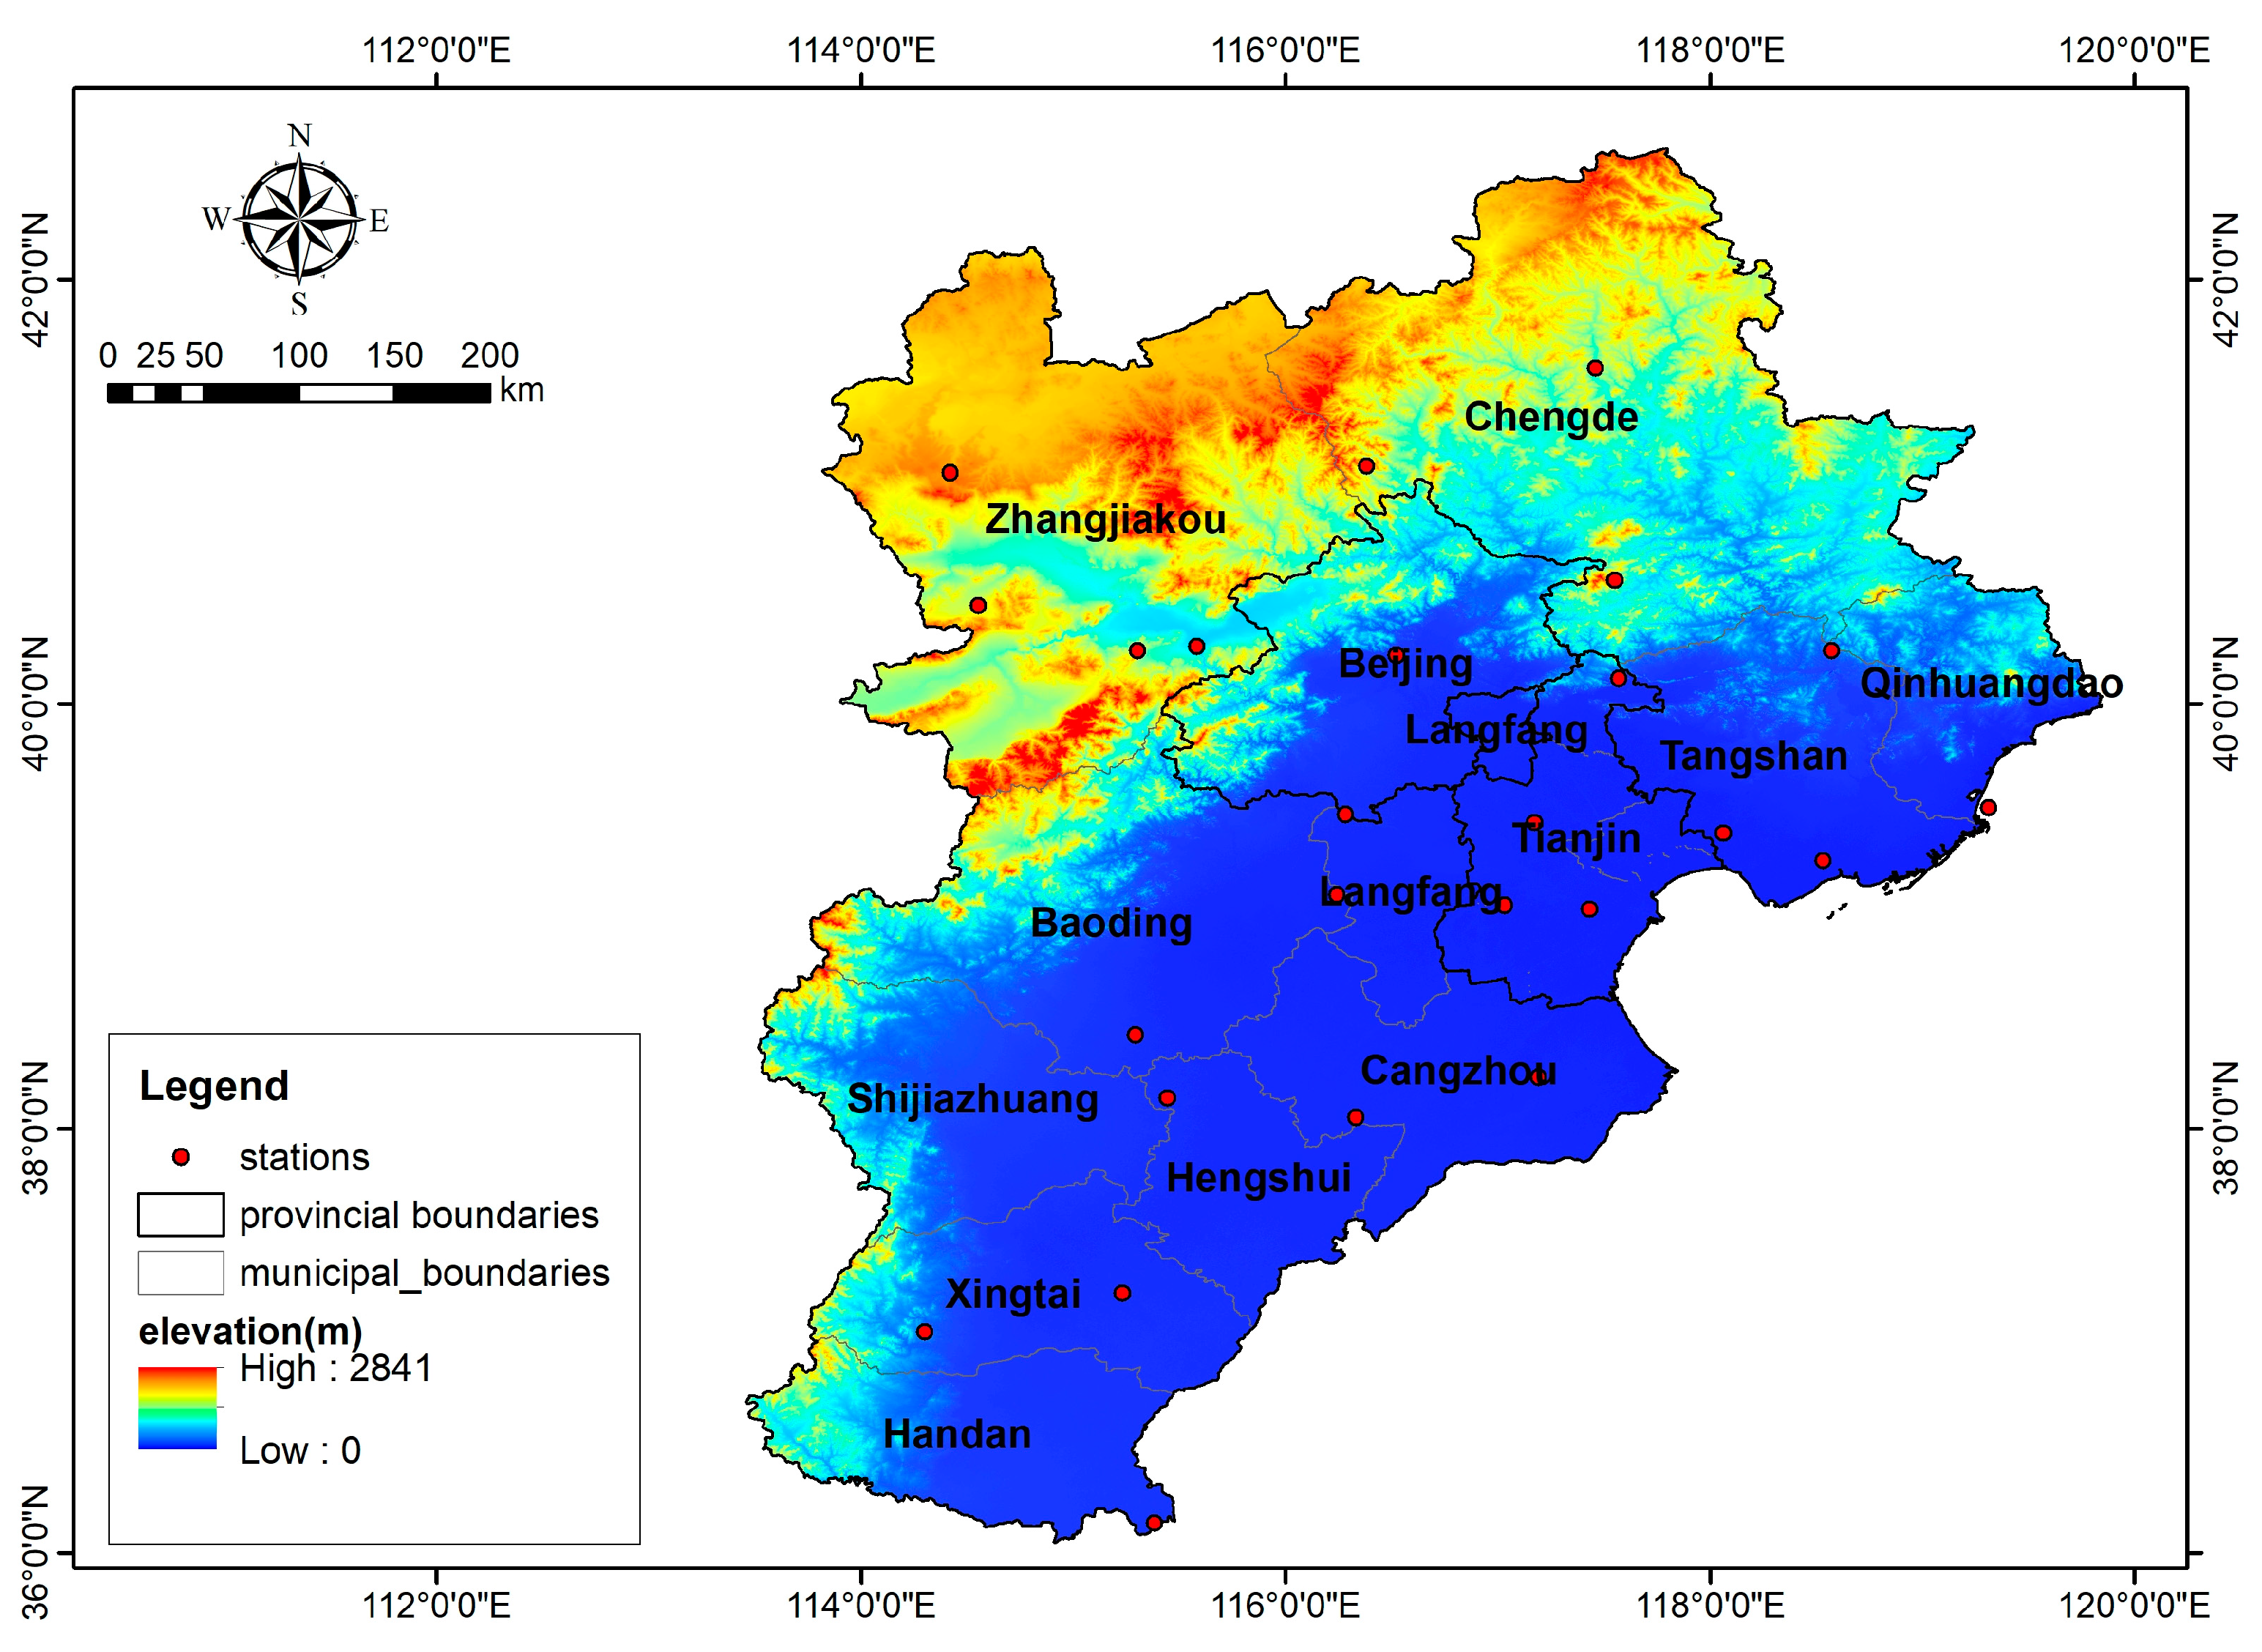
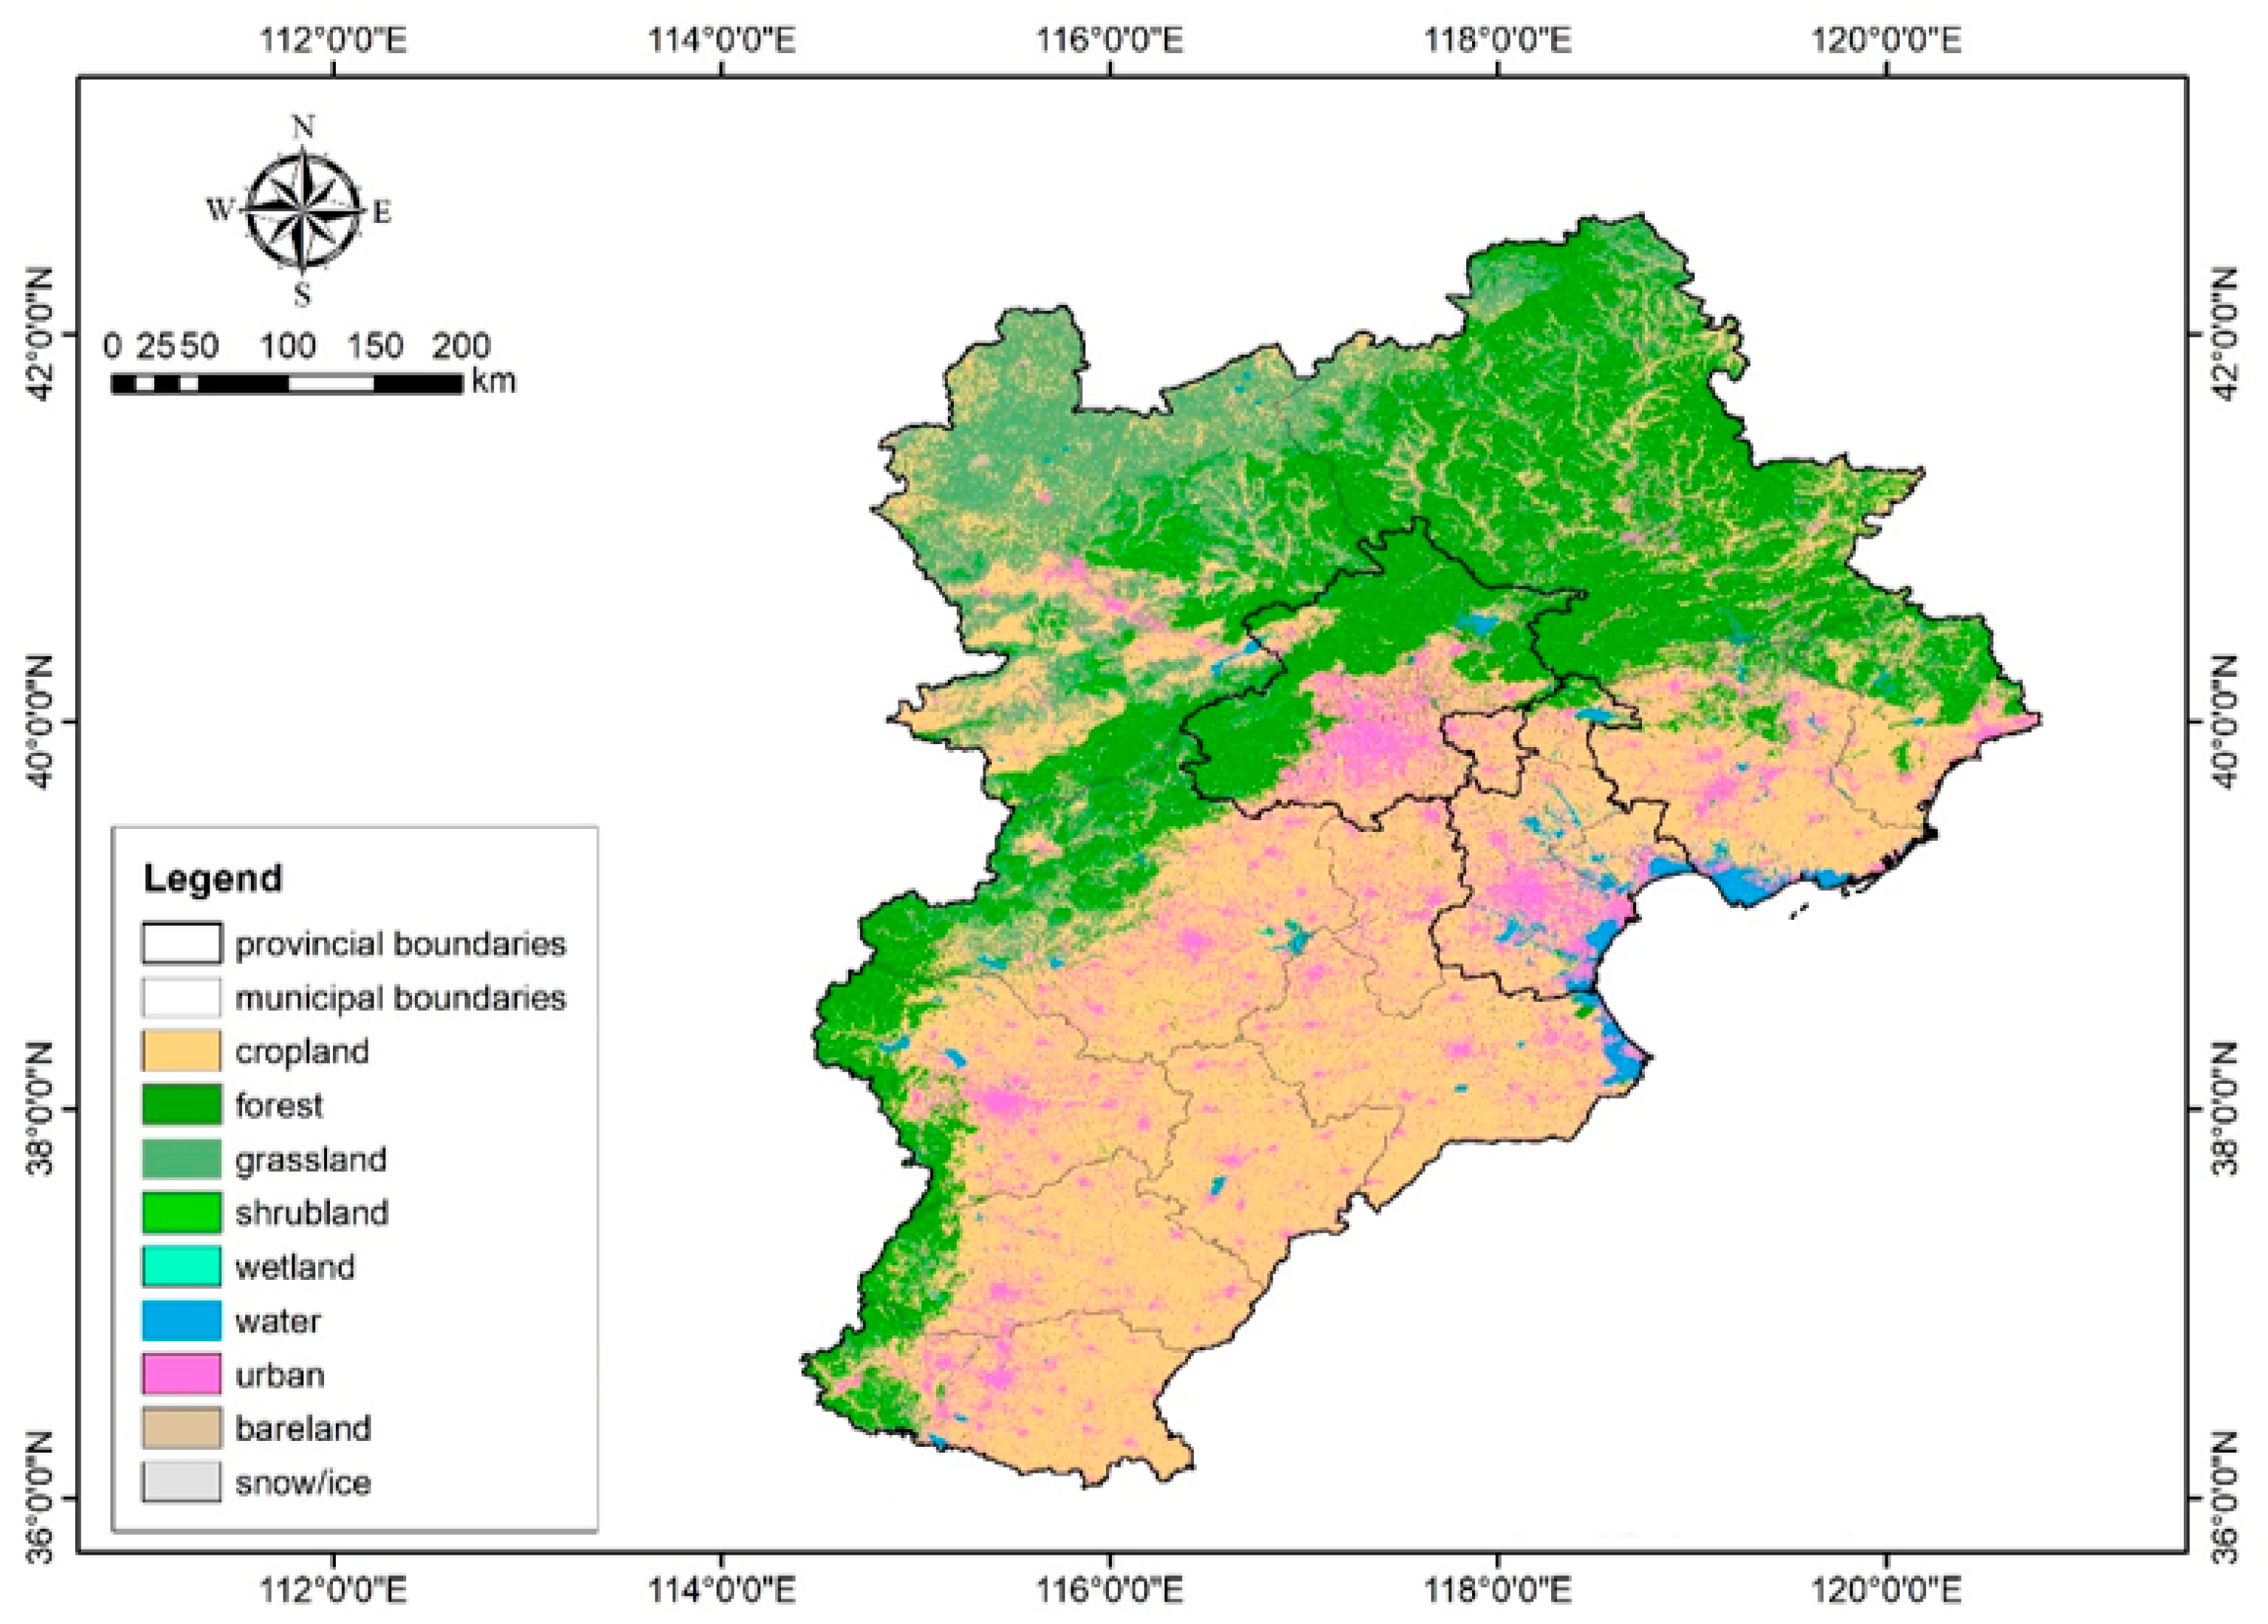
2.1. Study Area
2.2. Data
2.3. Methodology
2.3.1. Extreme Precipitation and Temperature Indices
2.3.2. Trend Analysis Method
3. Results
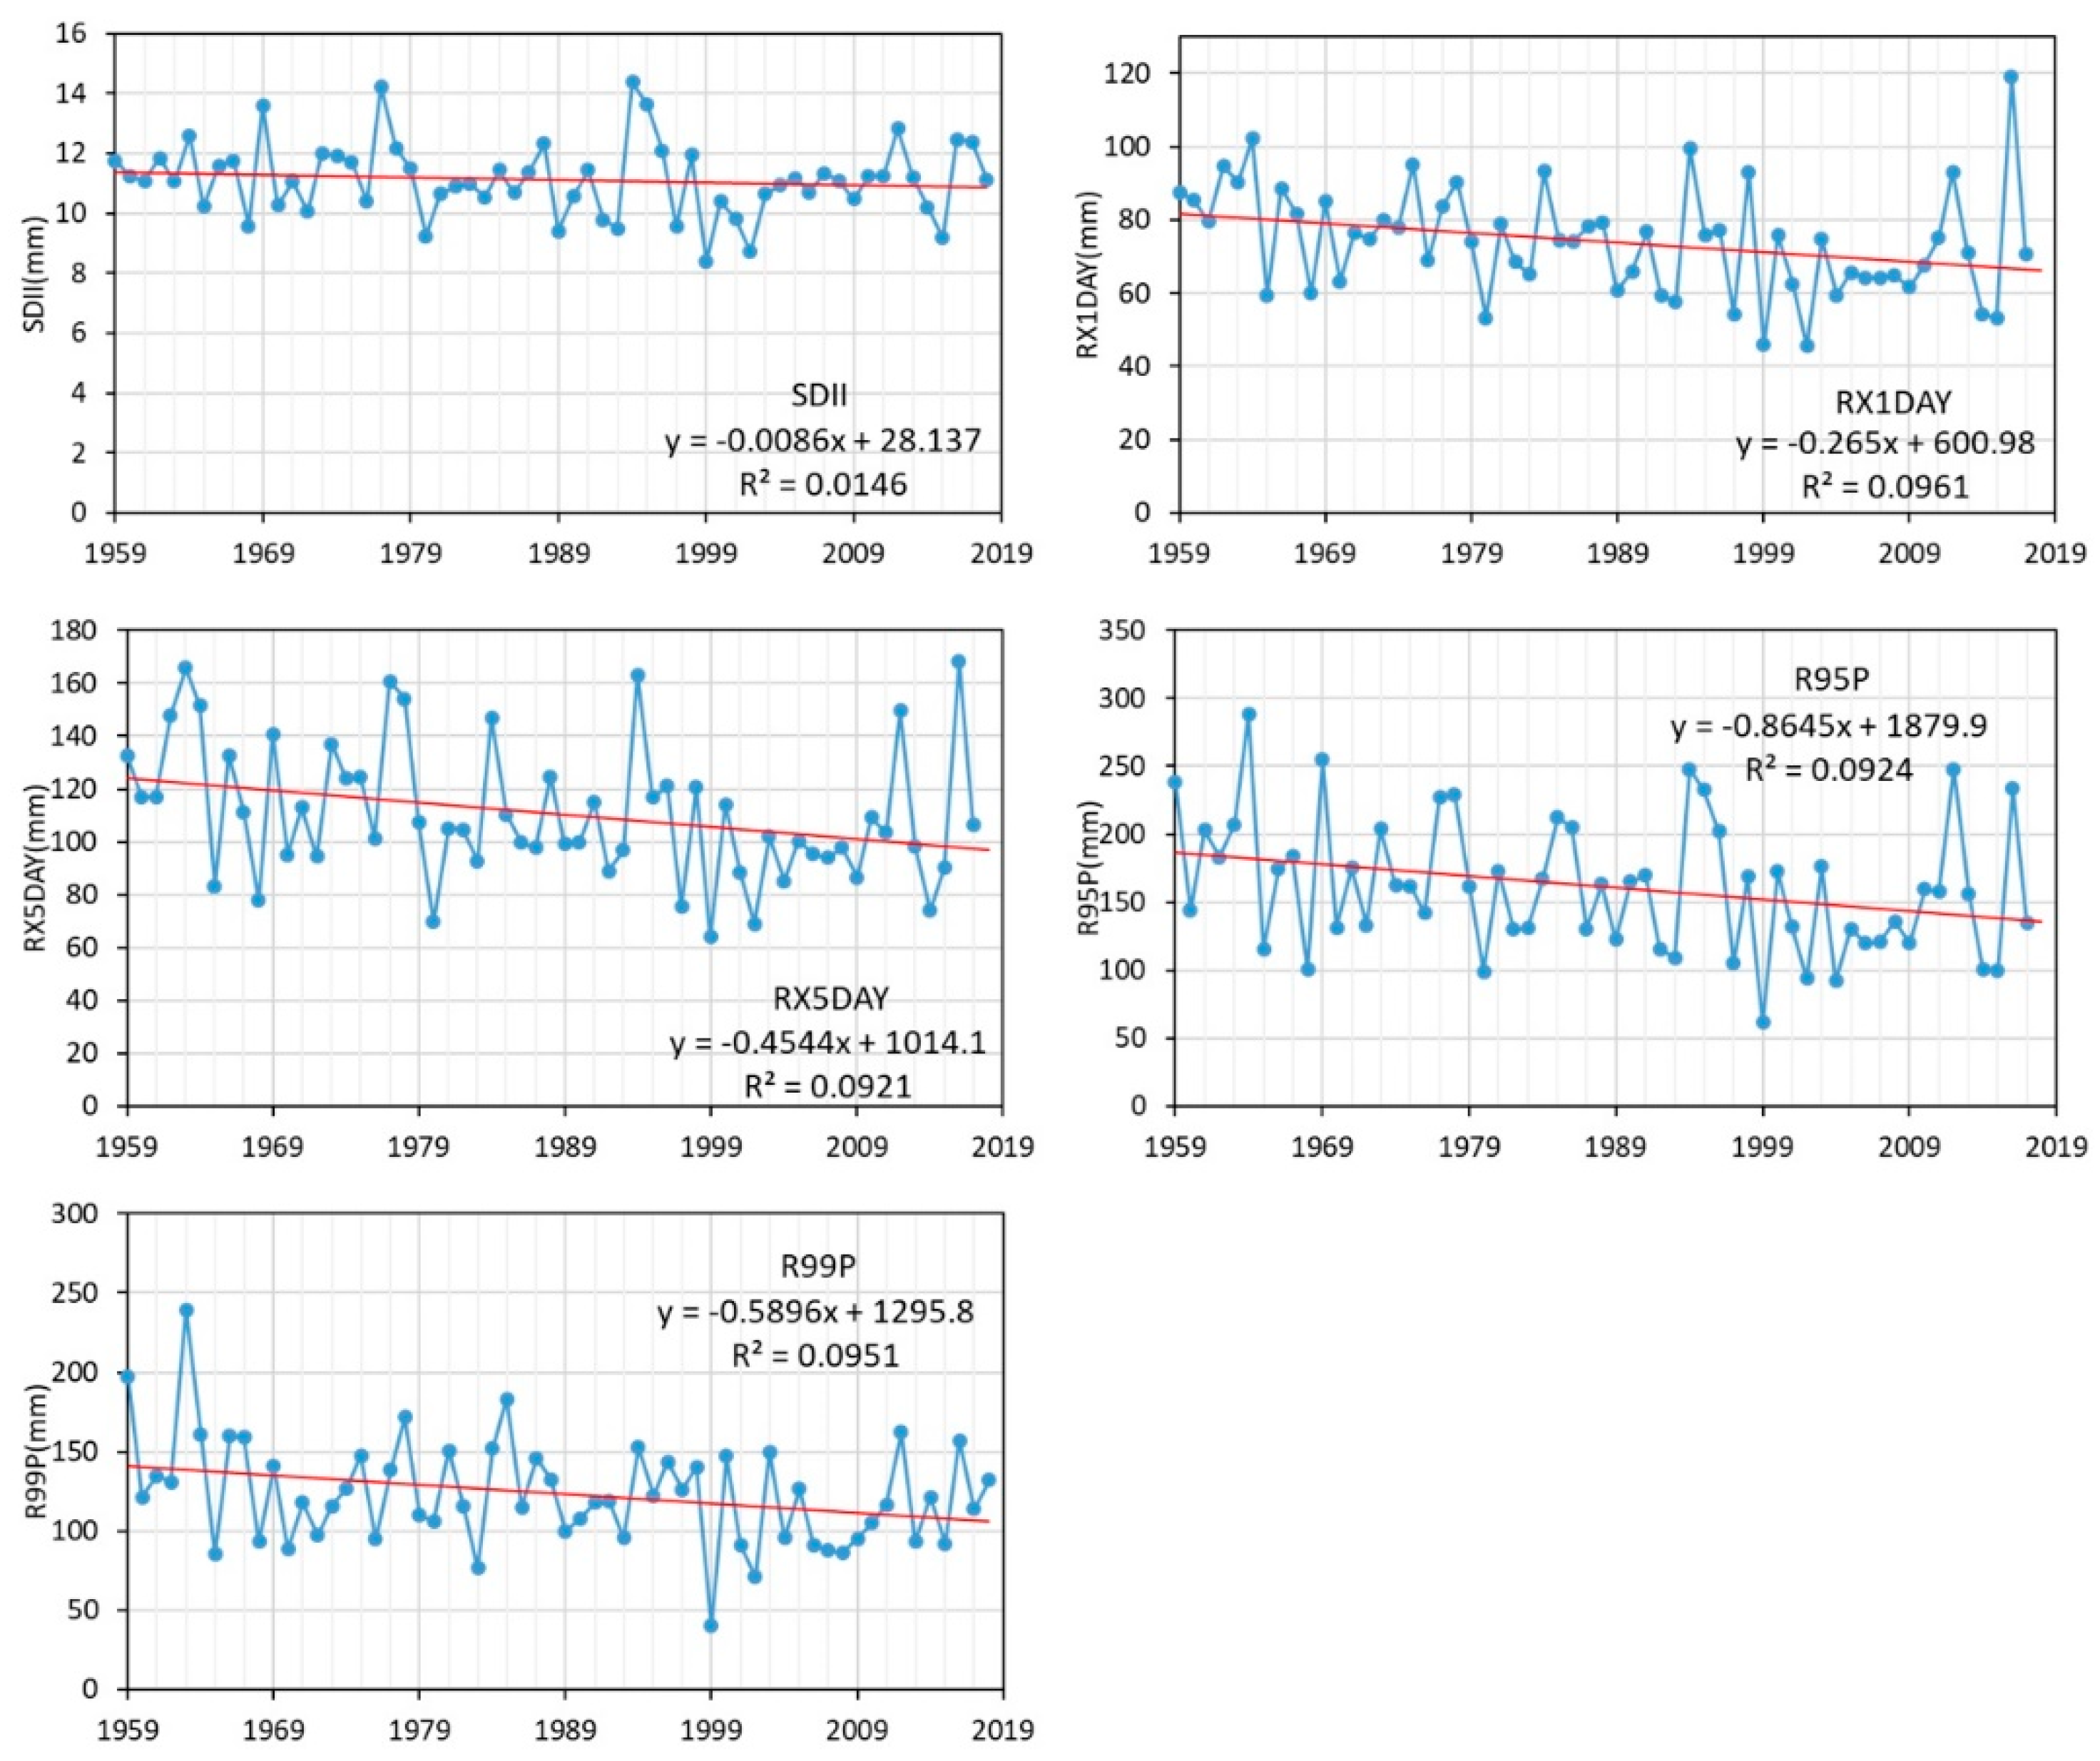
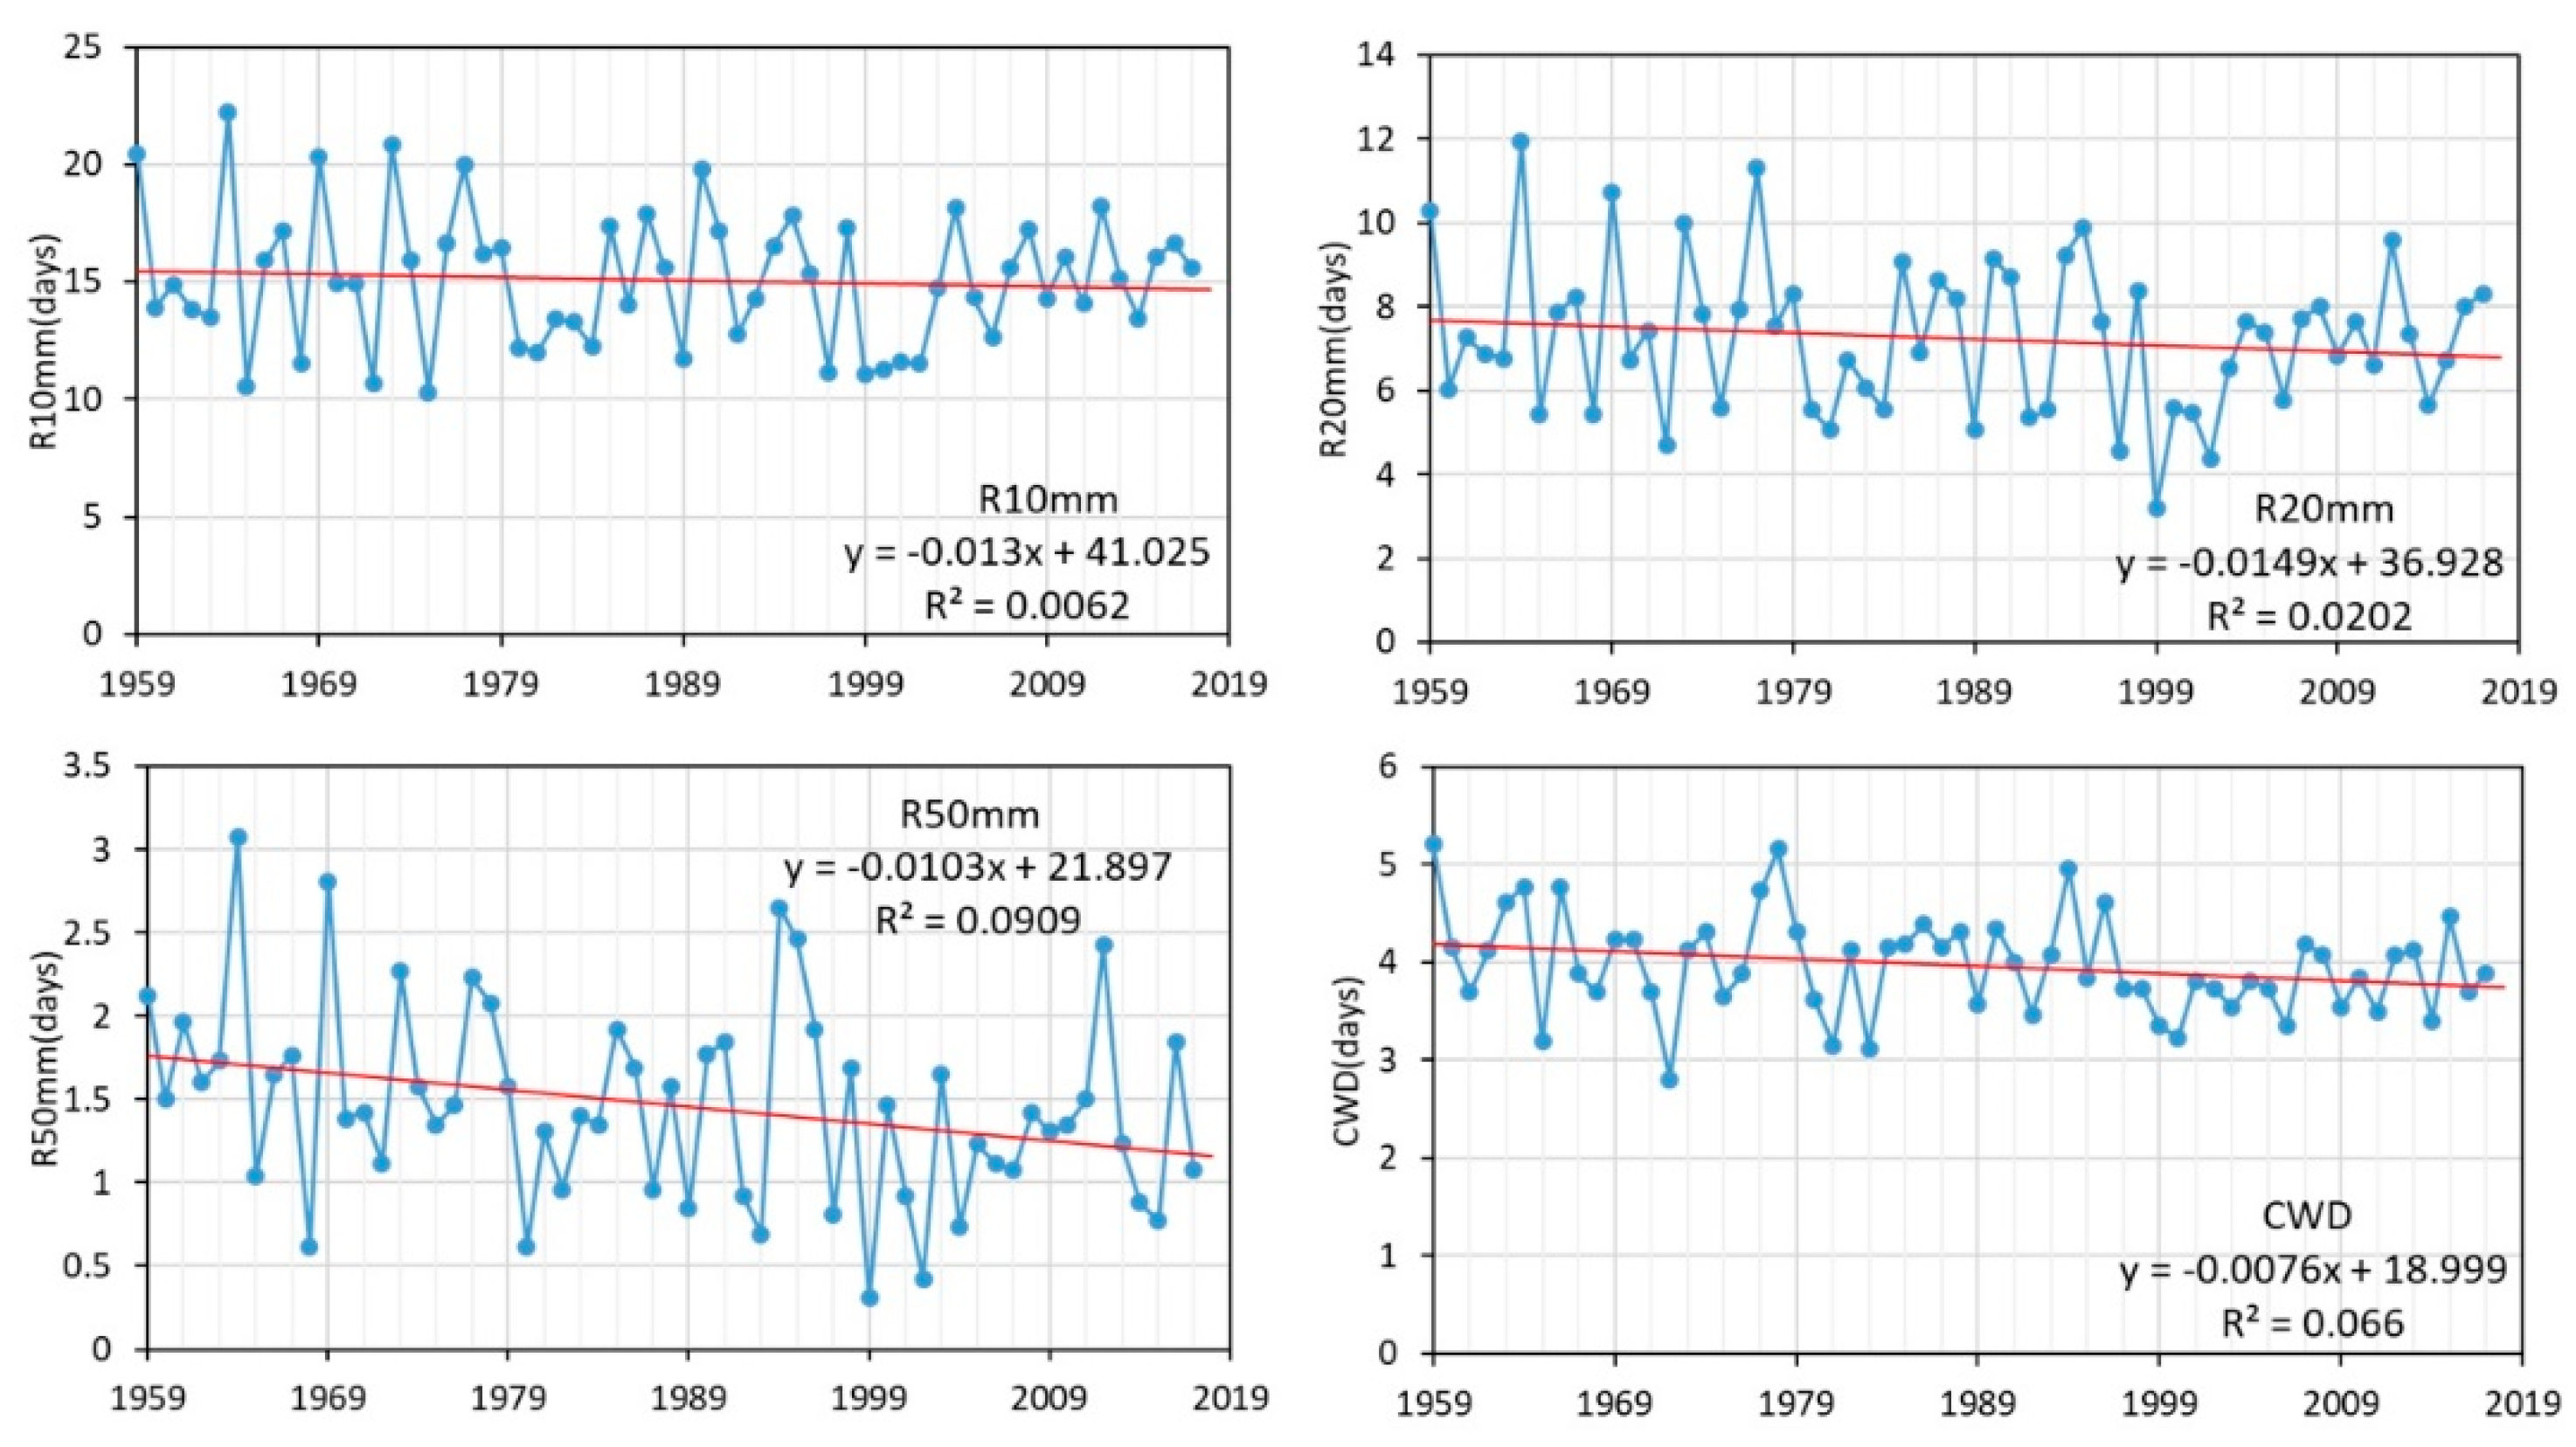
3.1. Trends of Extreme Precipitation Events on a Regional Scale
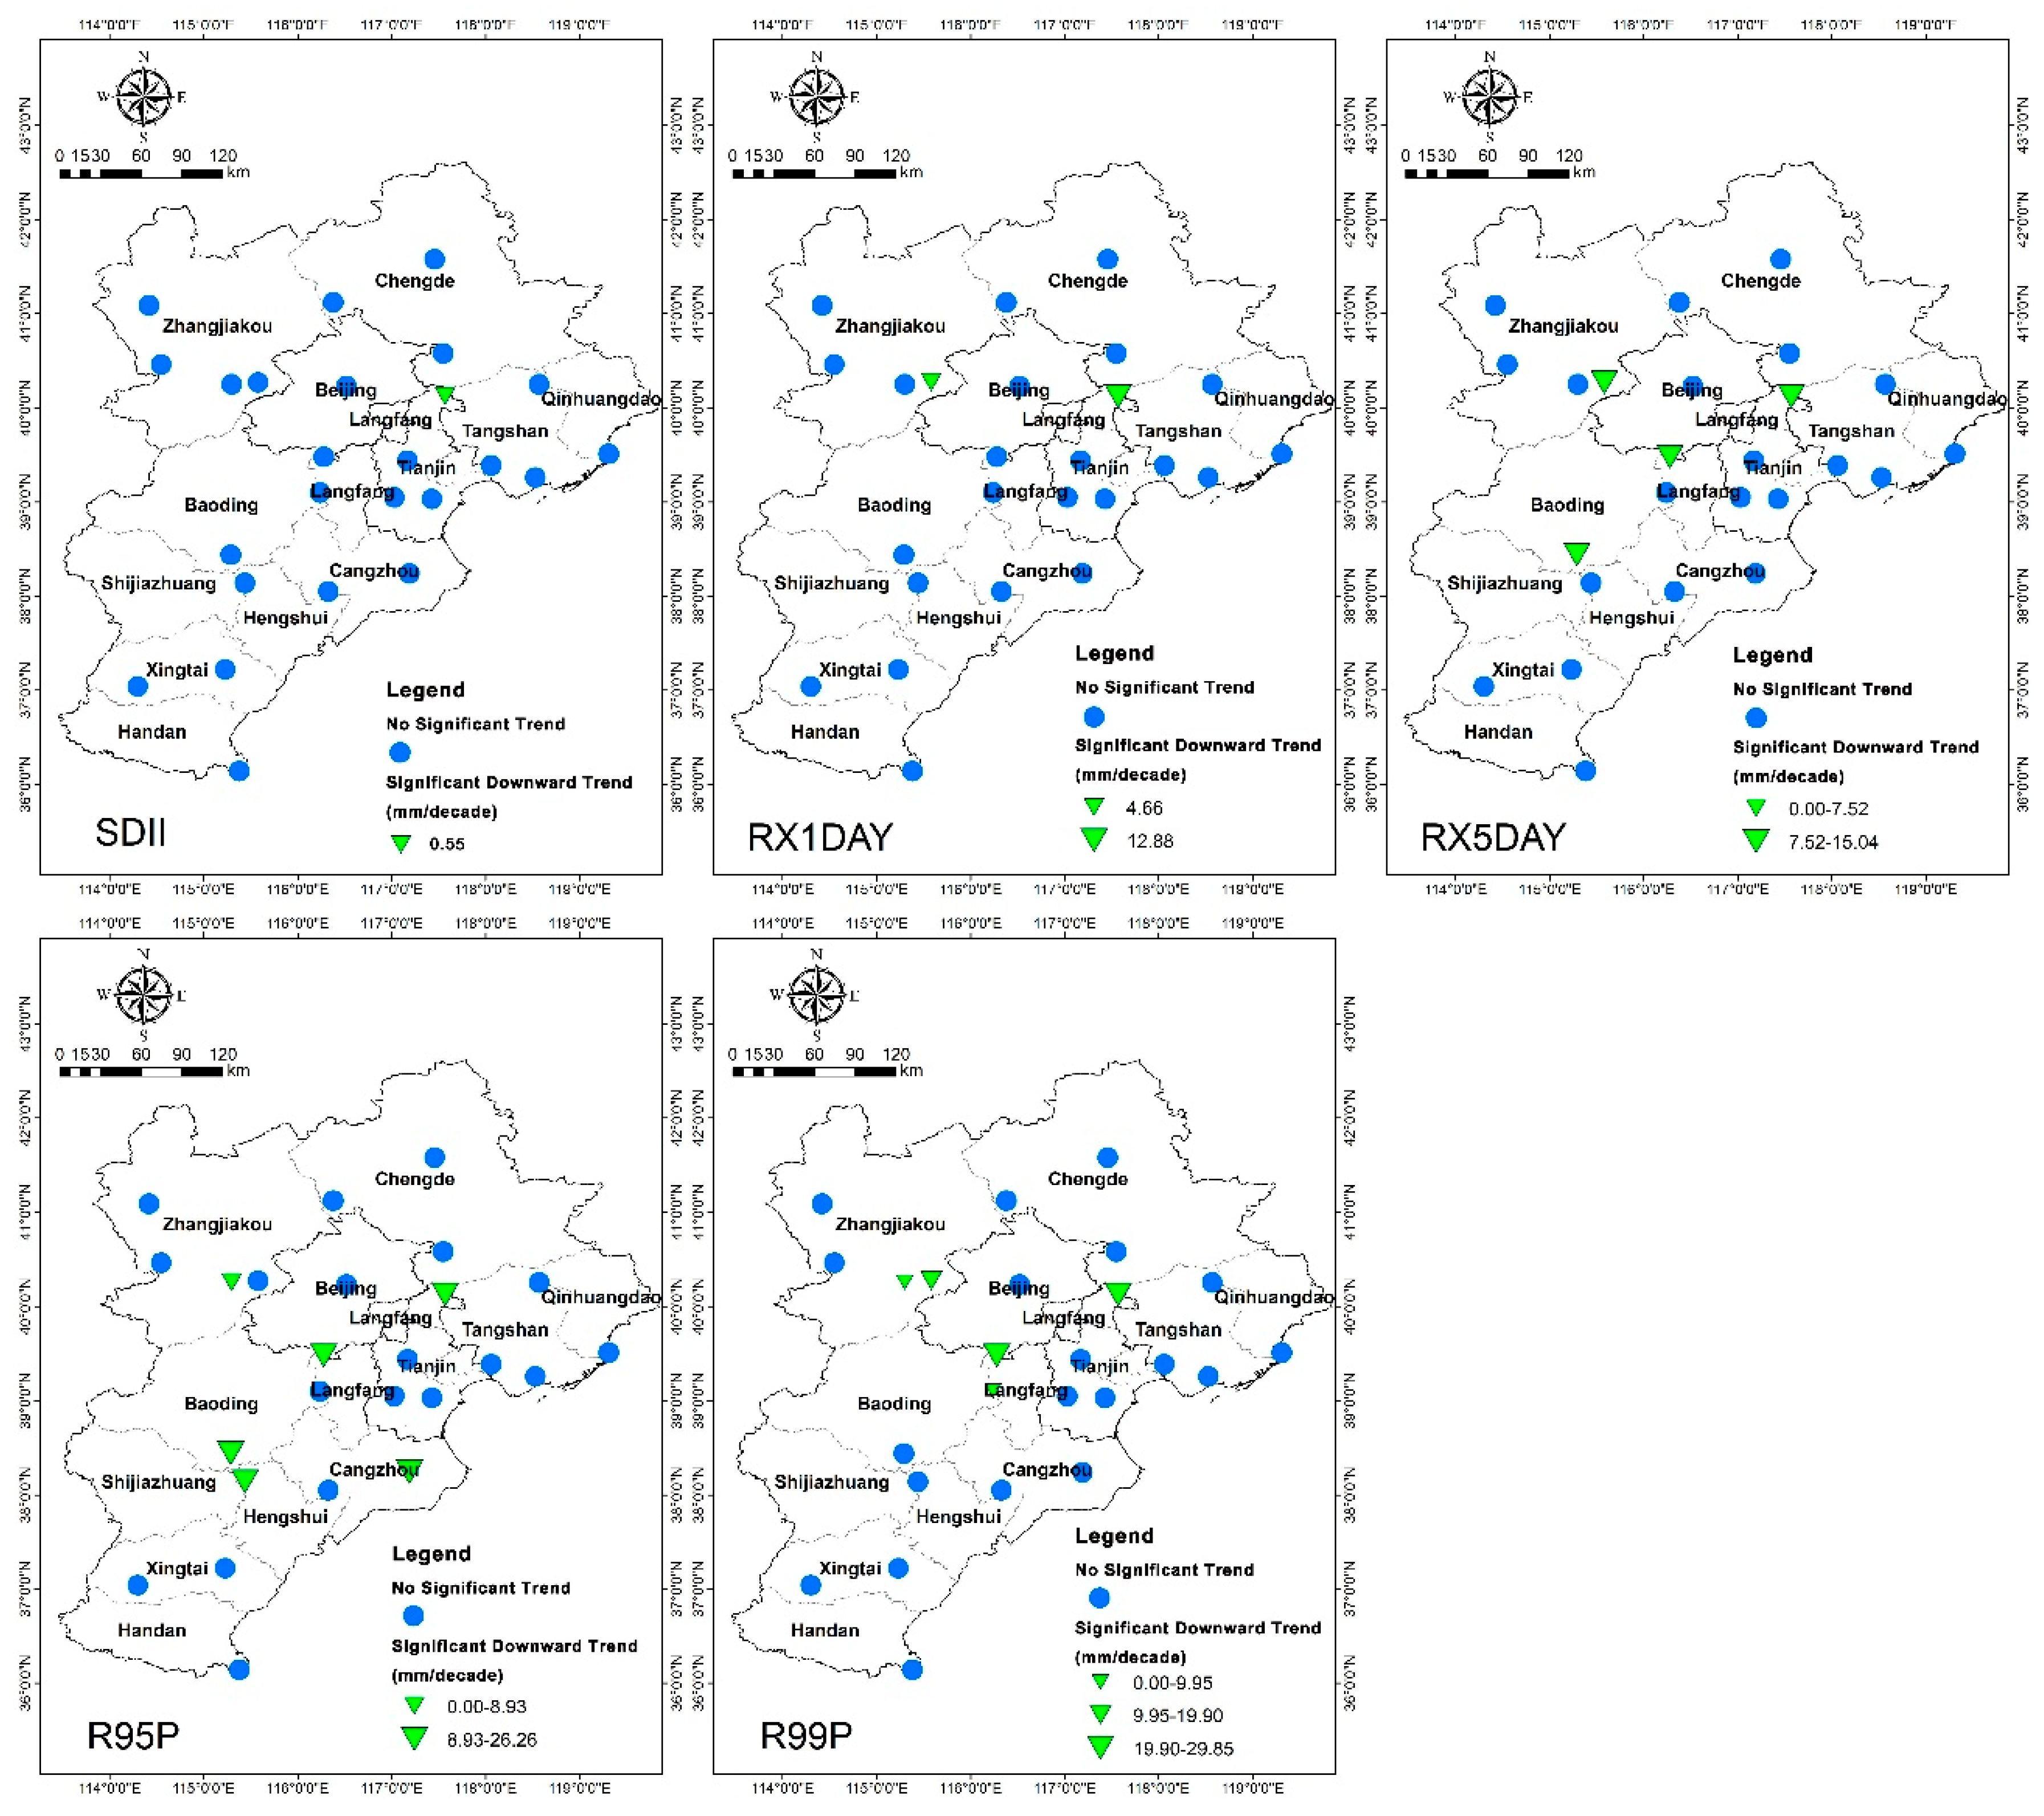
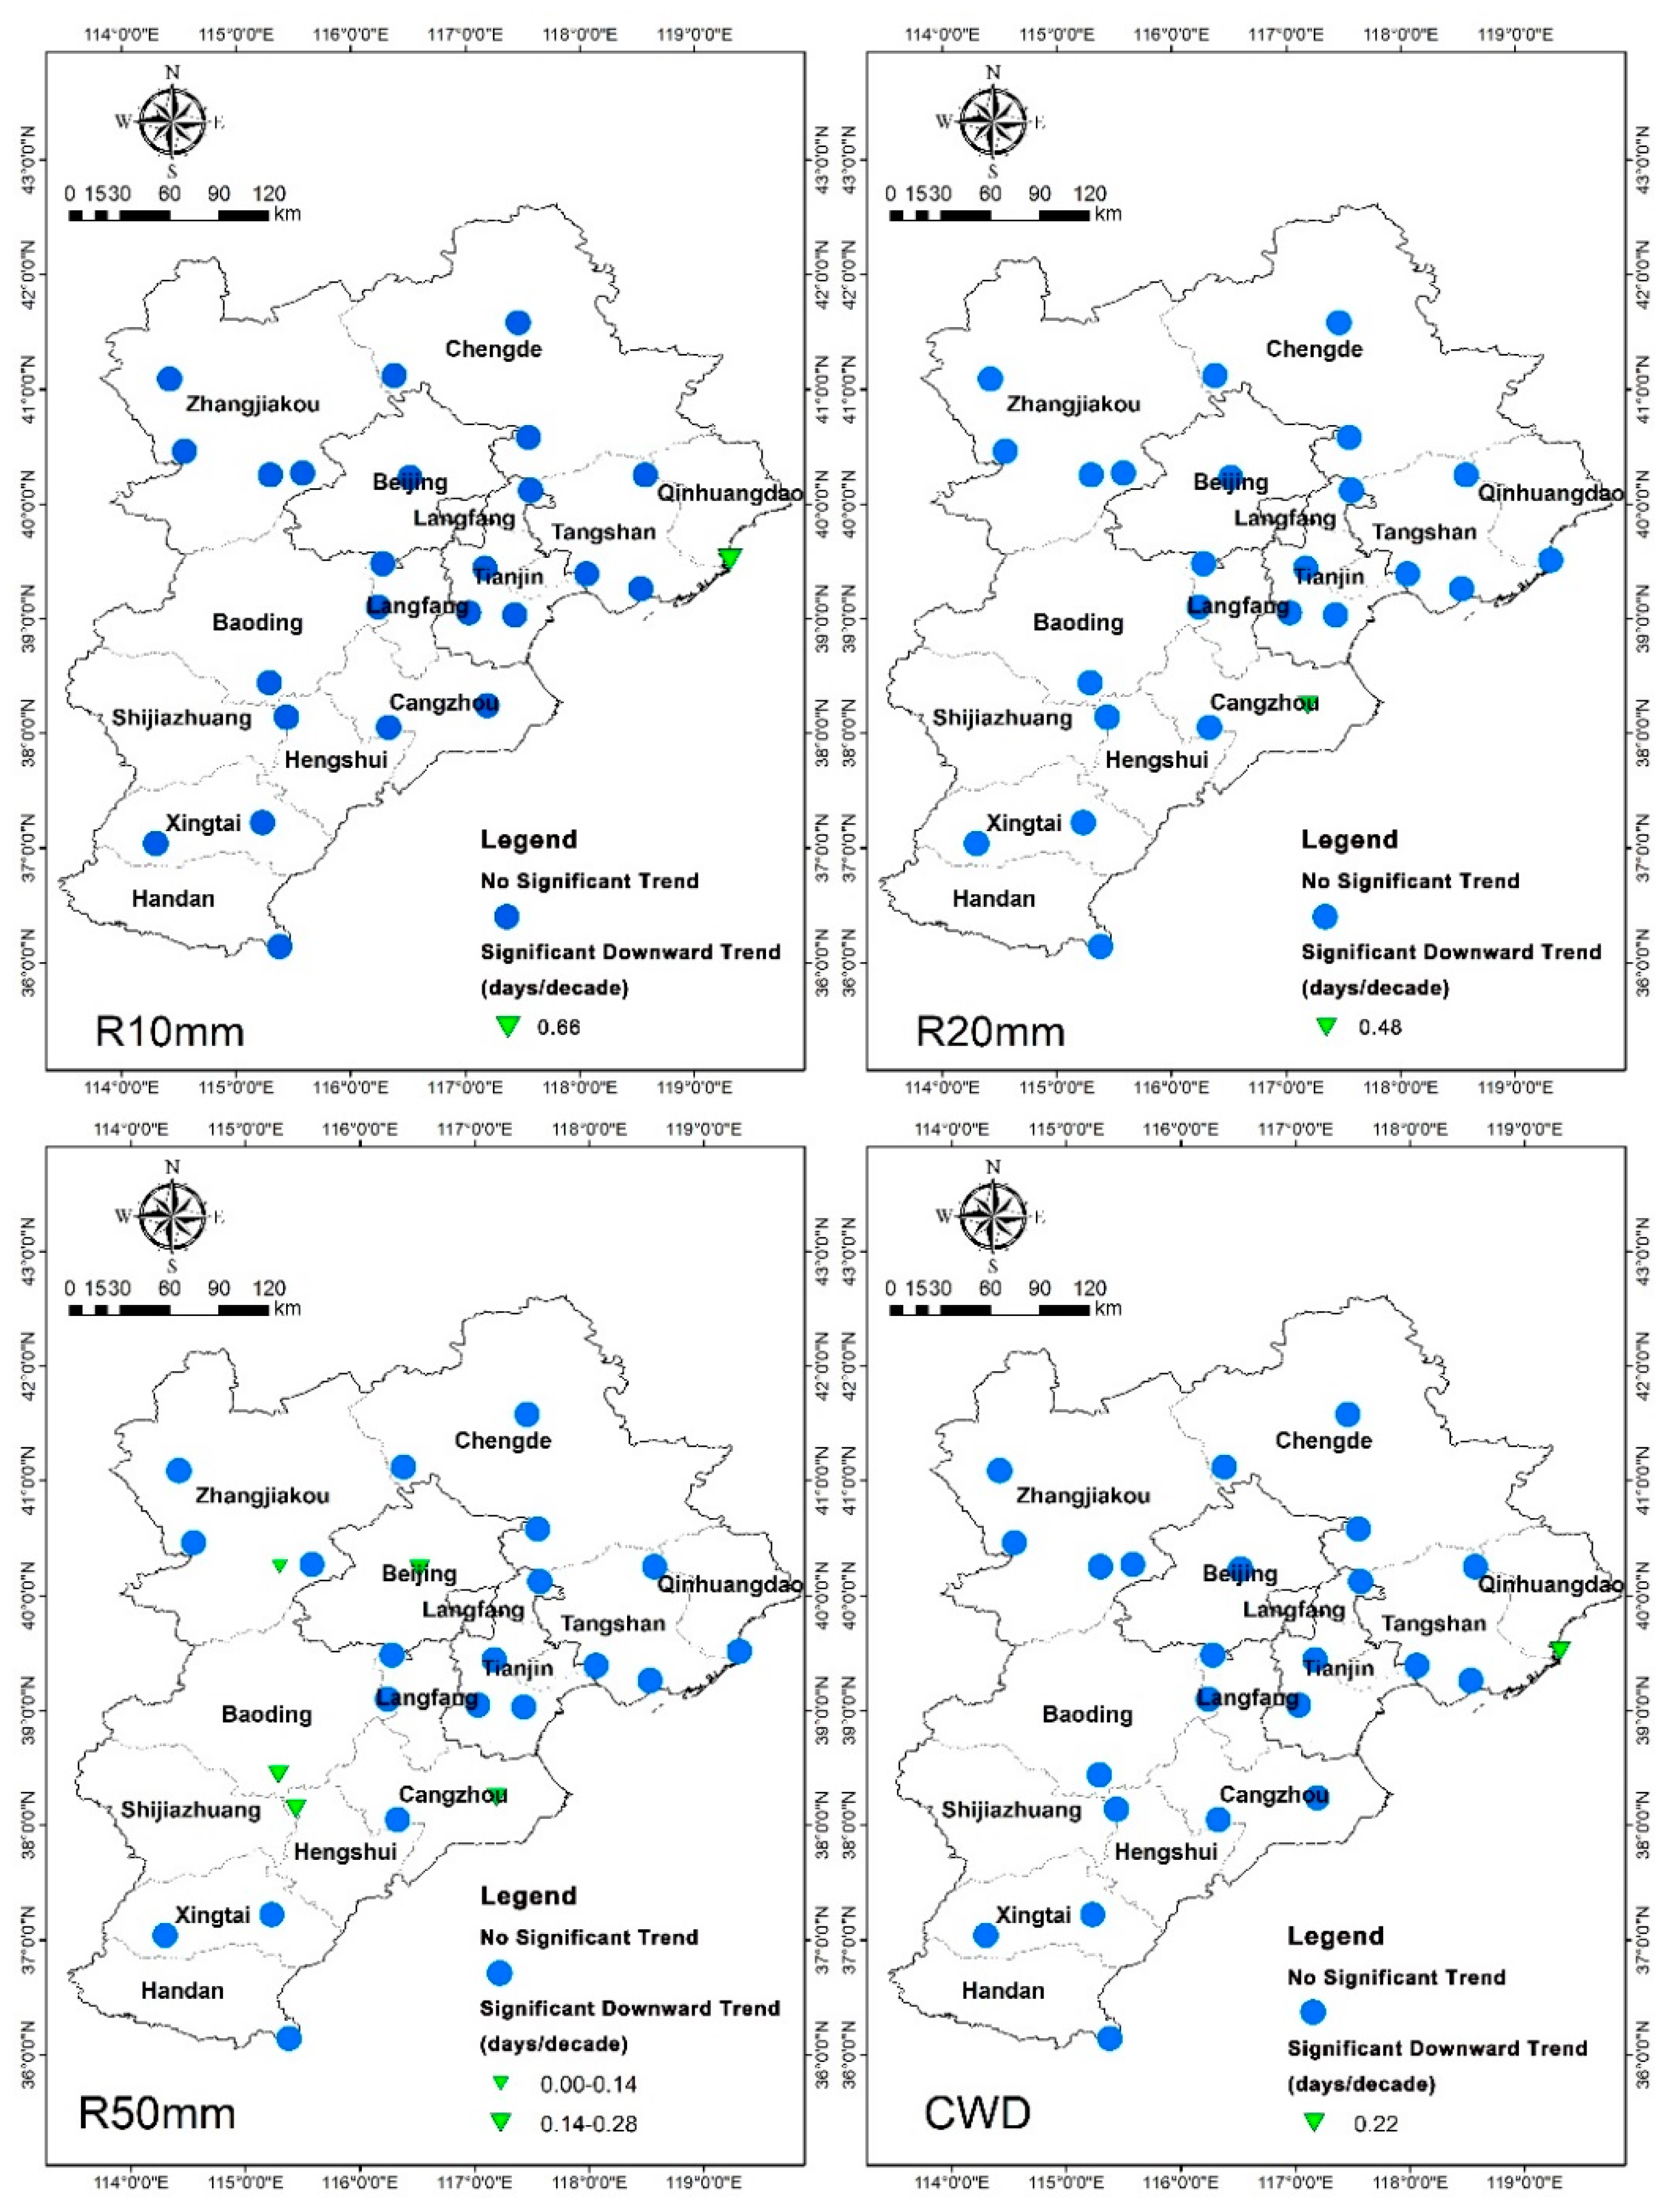
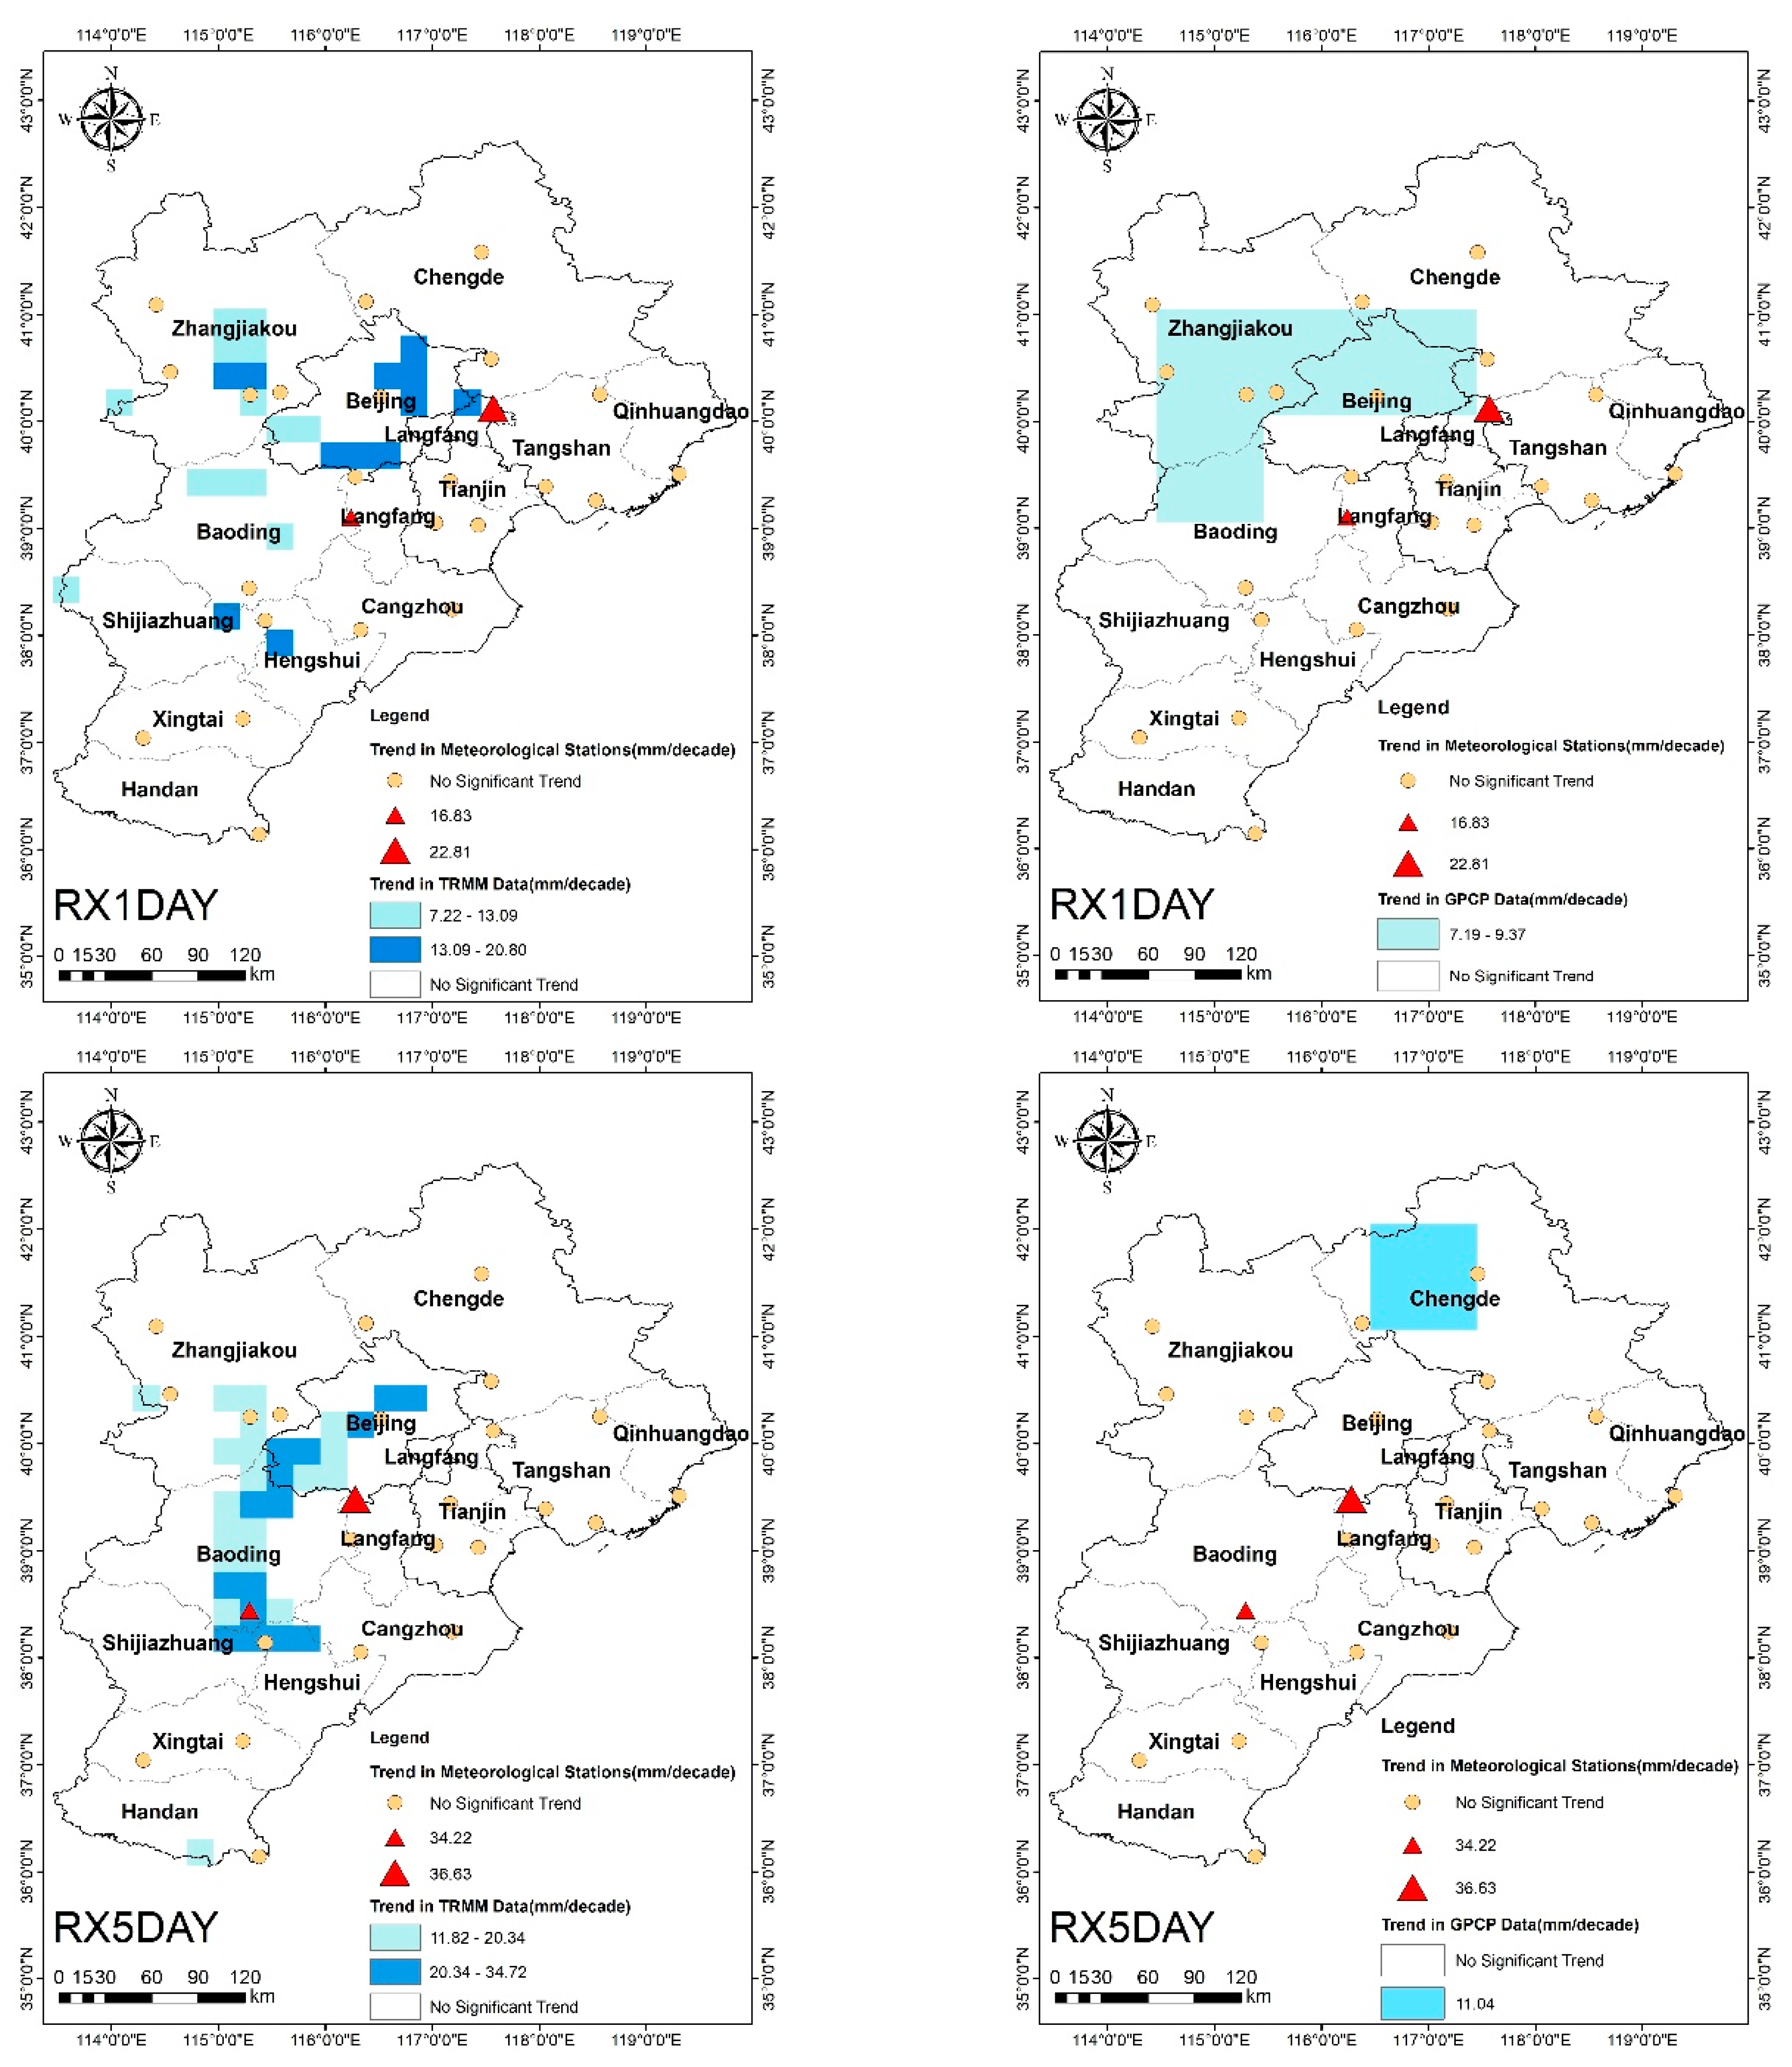
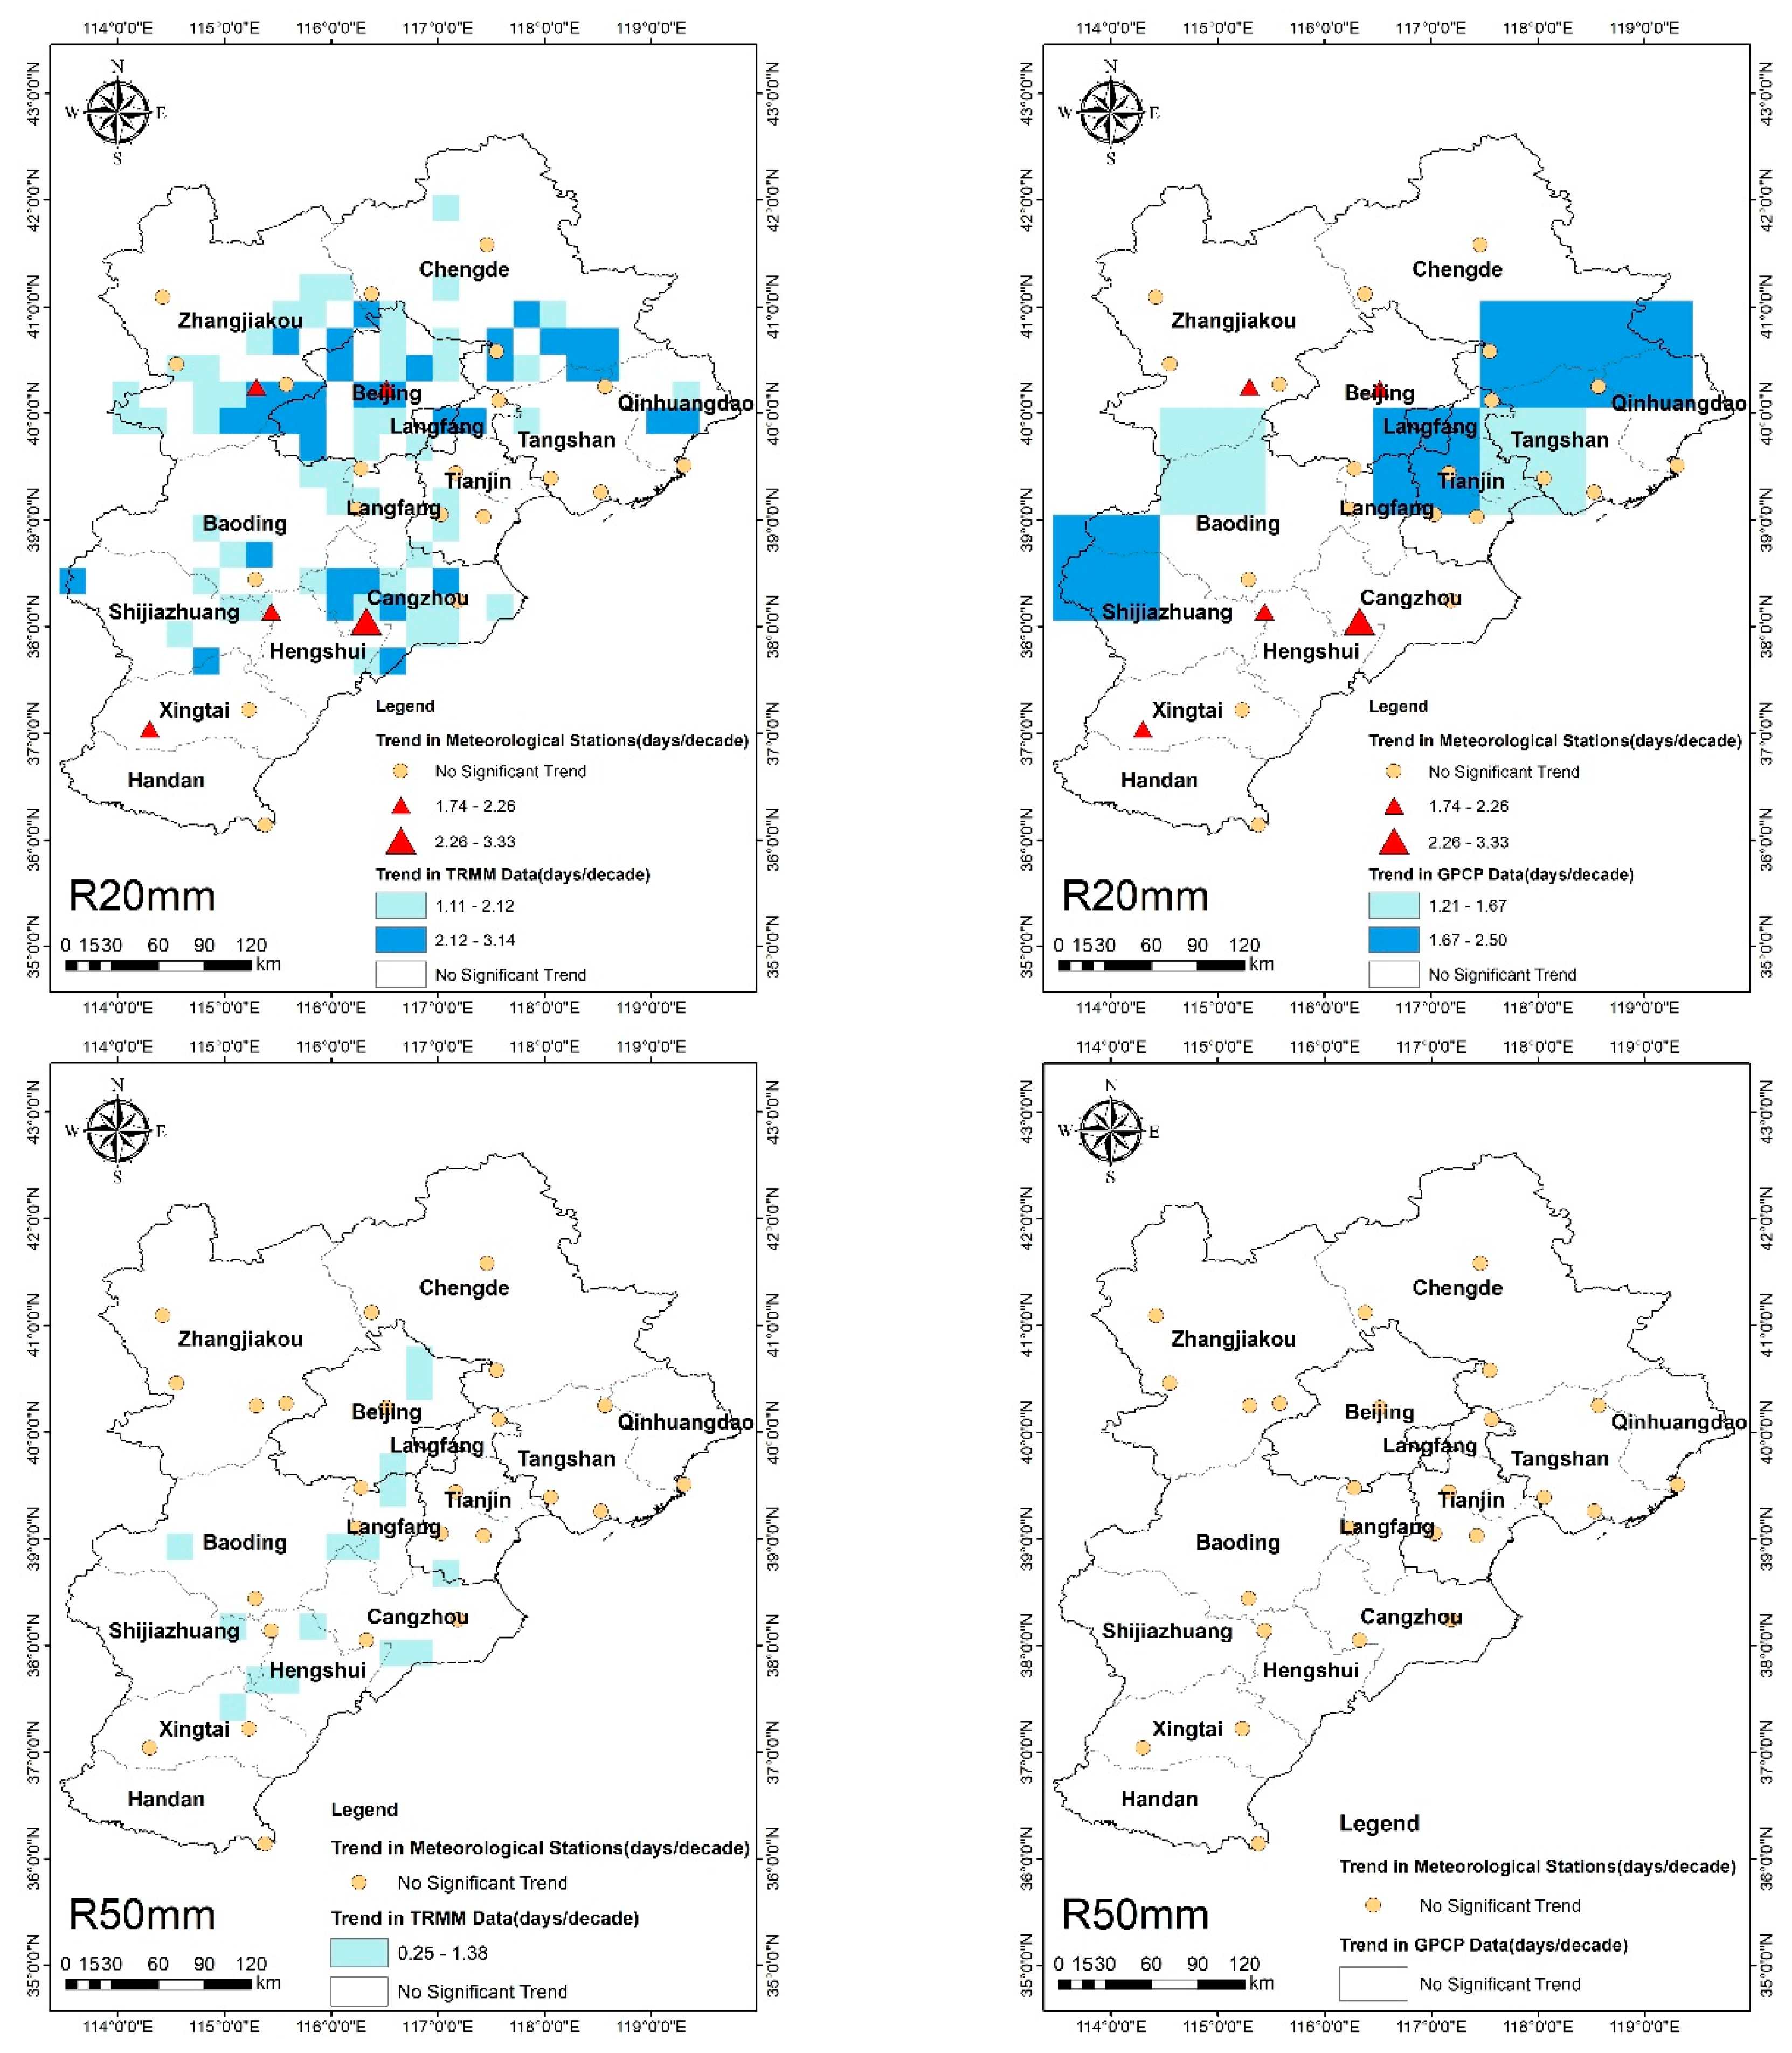
3.2. Spatial Distribution of Temporal Trends in Extreme Precipitation Events
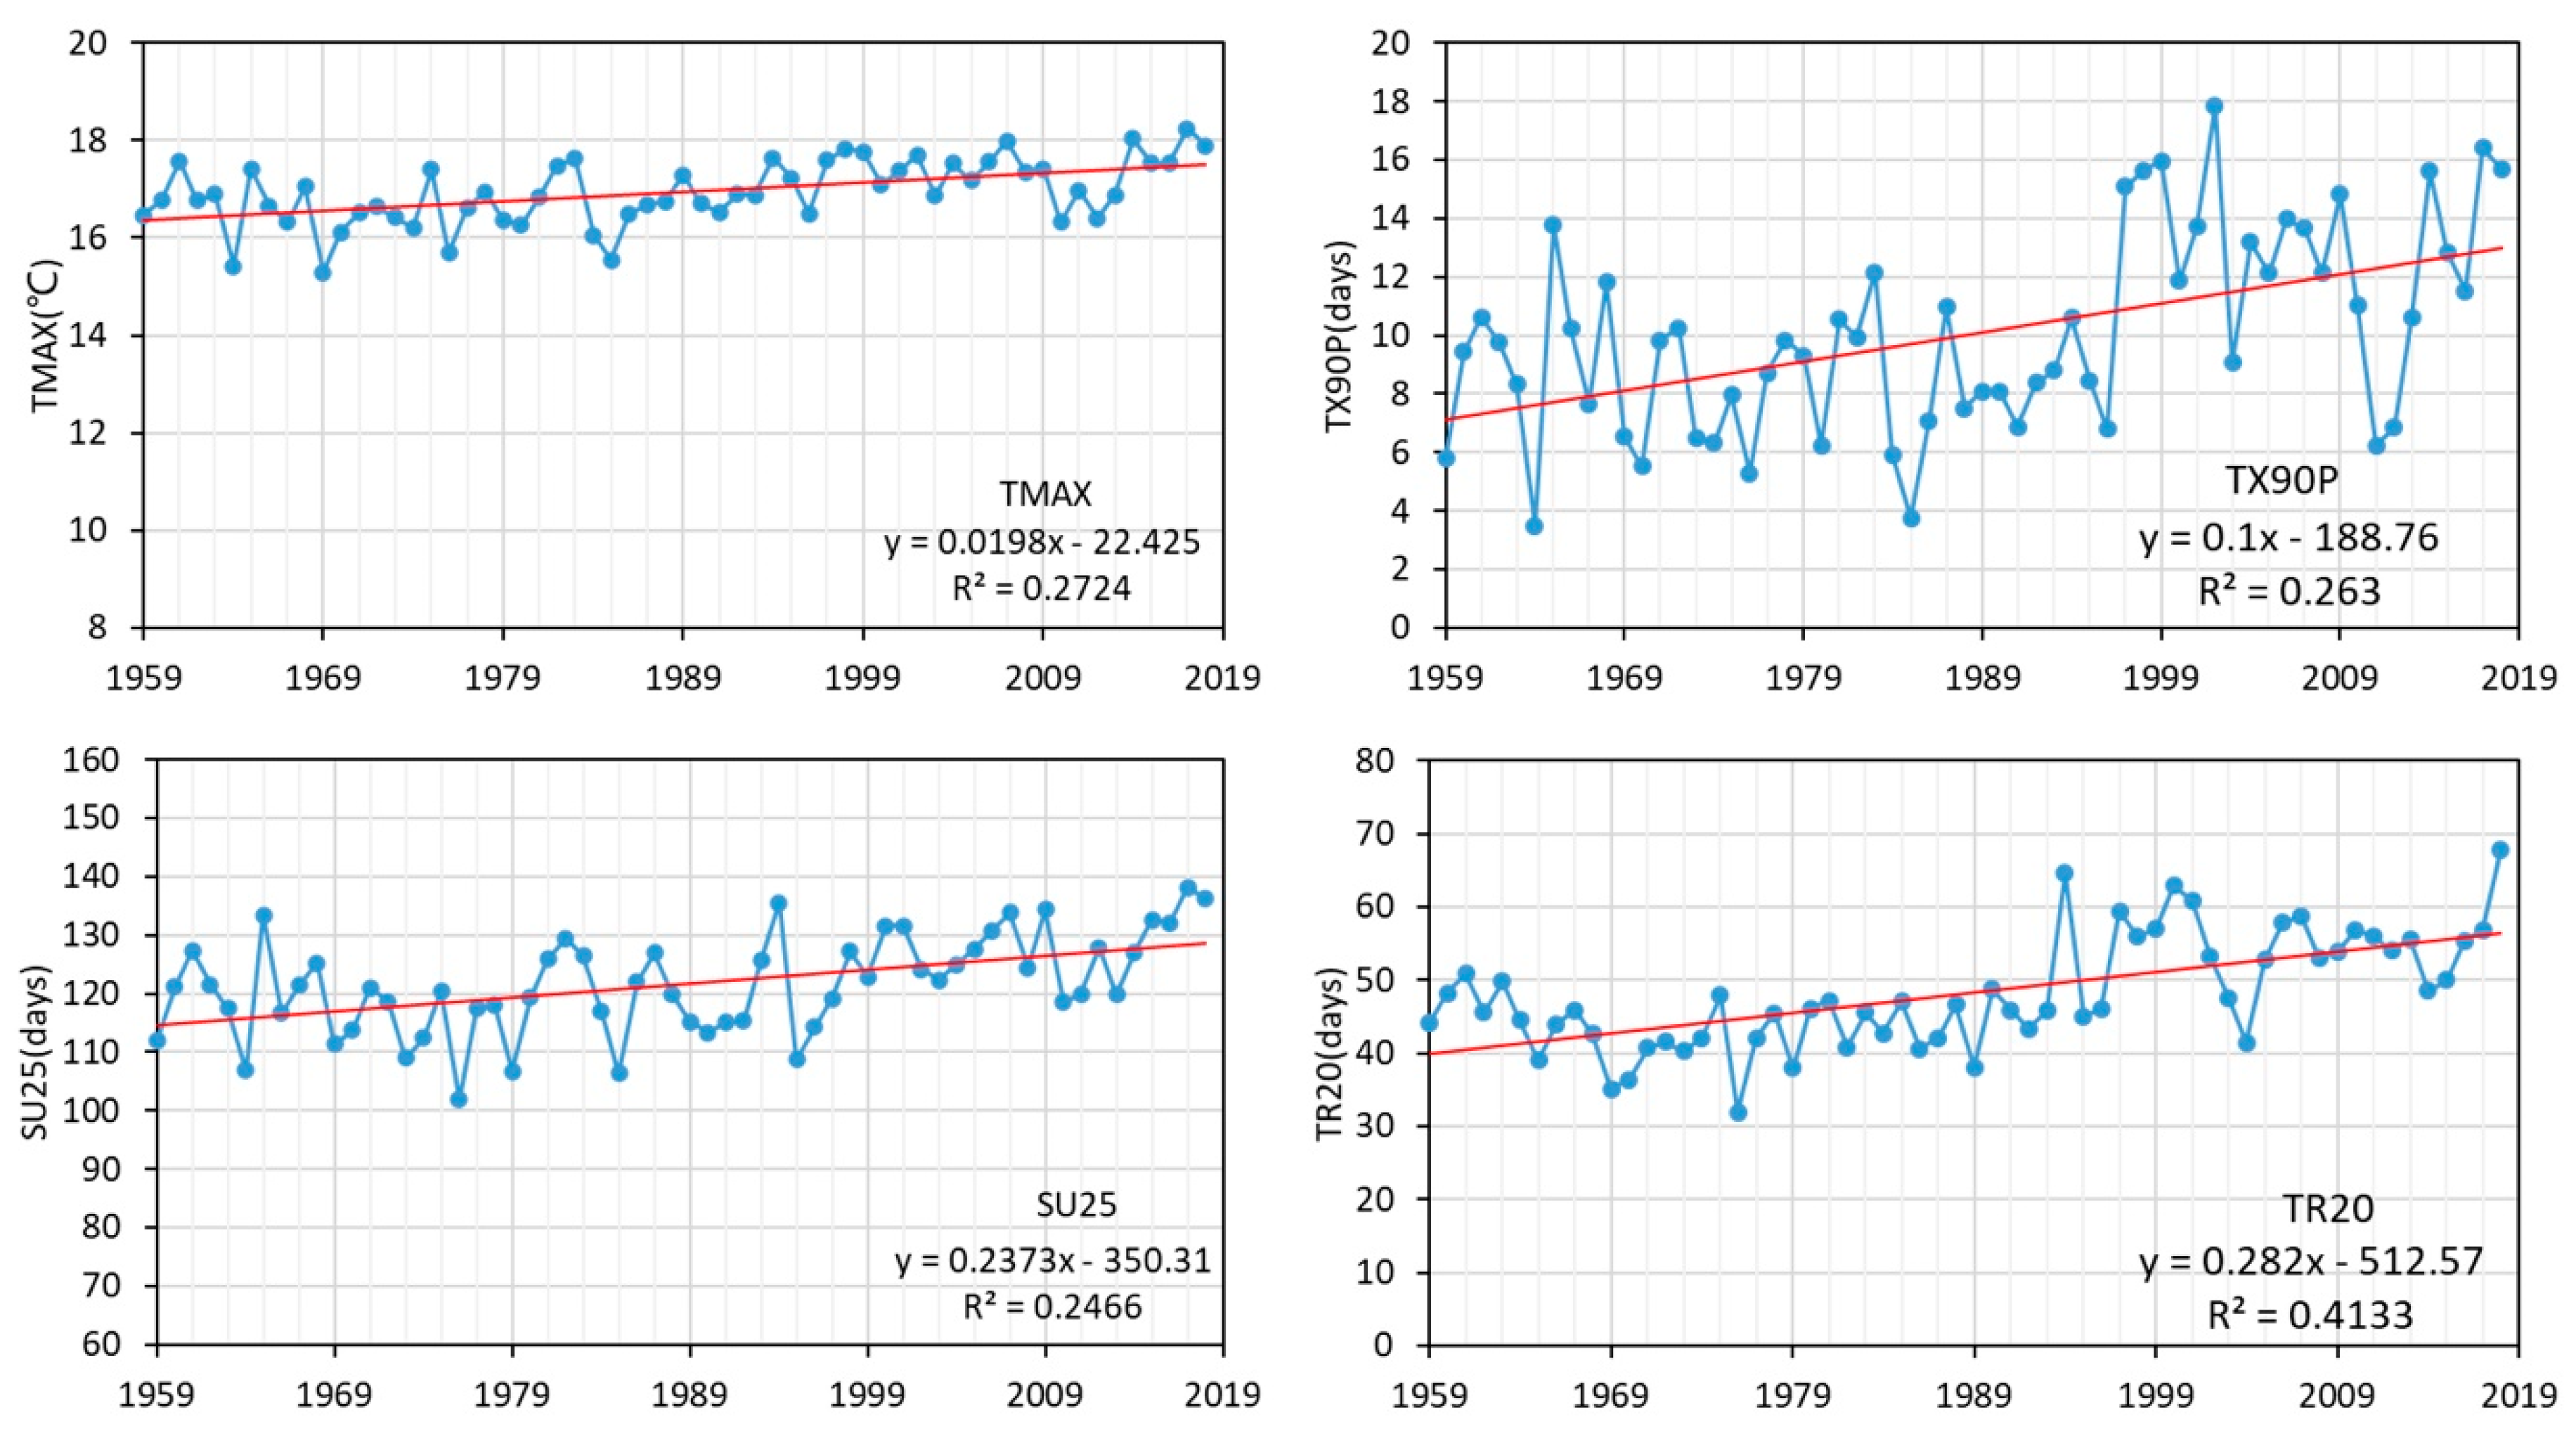
3.3. Trends of Extreme Temperature Events on a Regional Scale
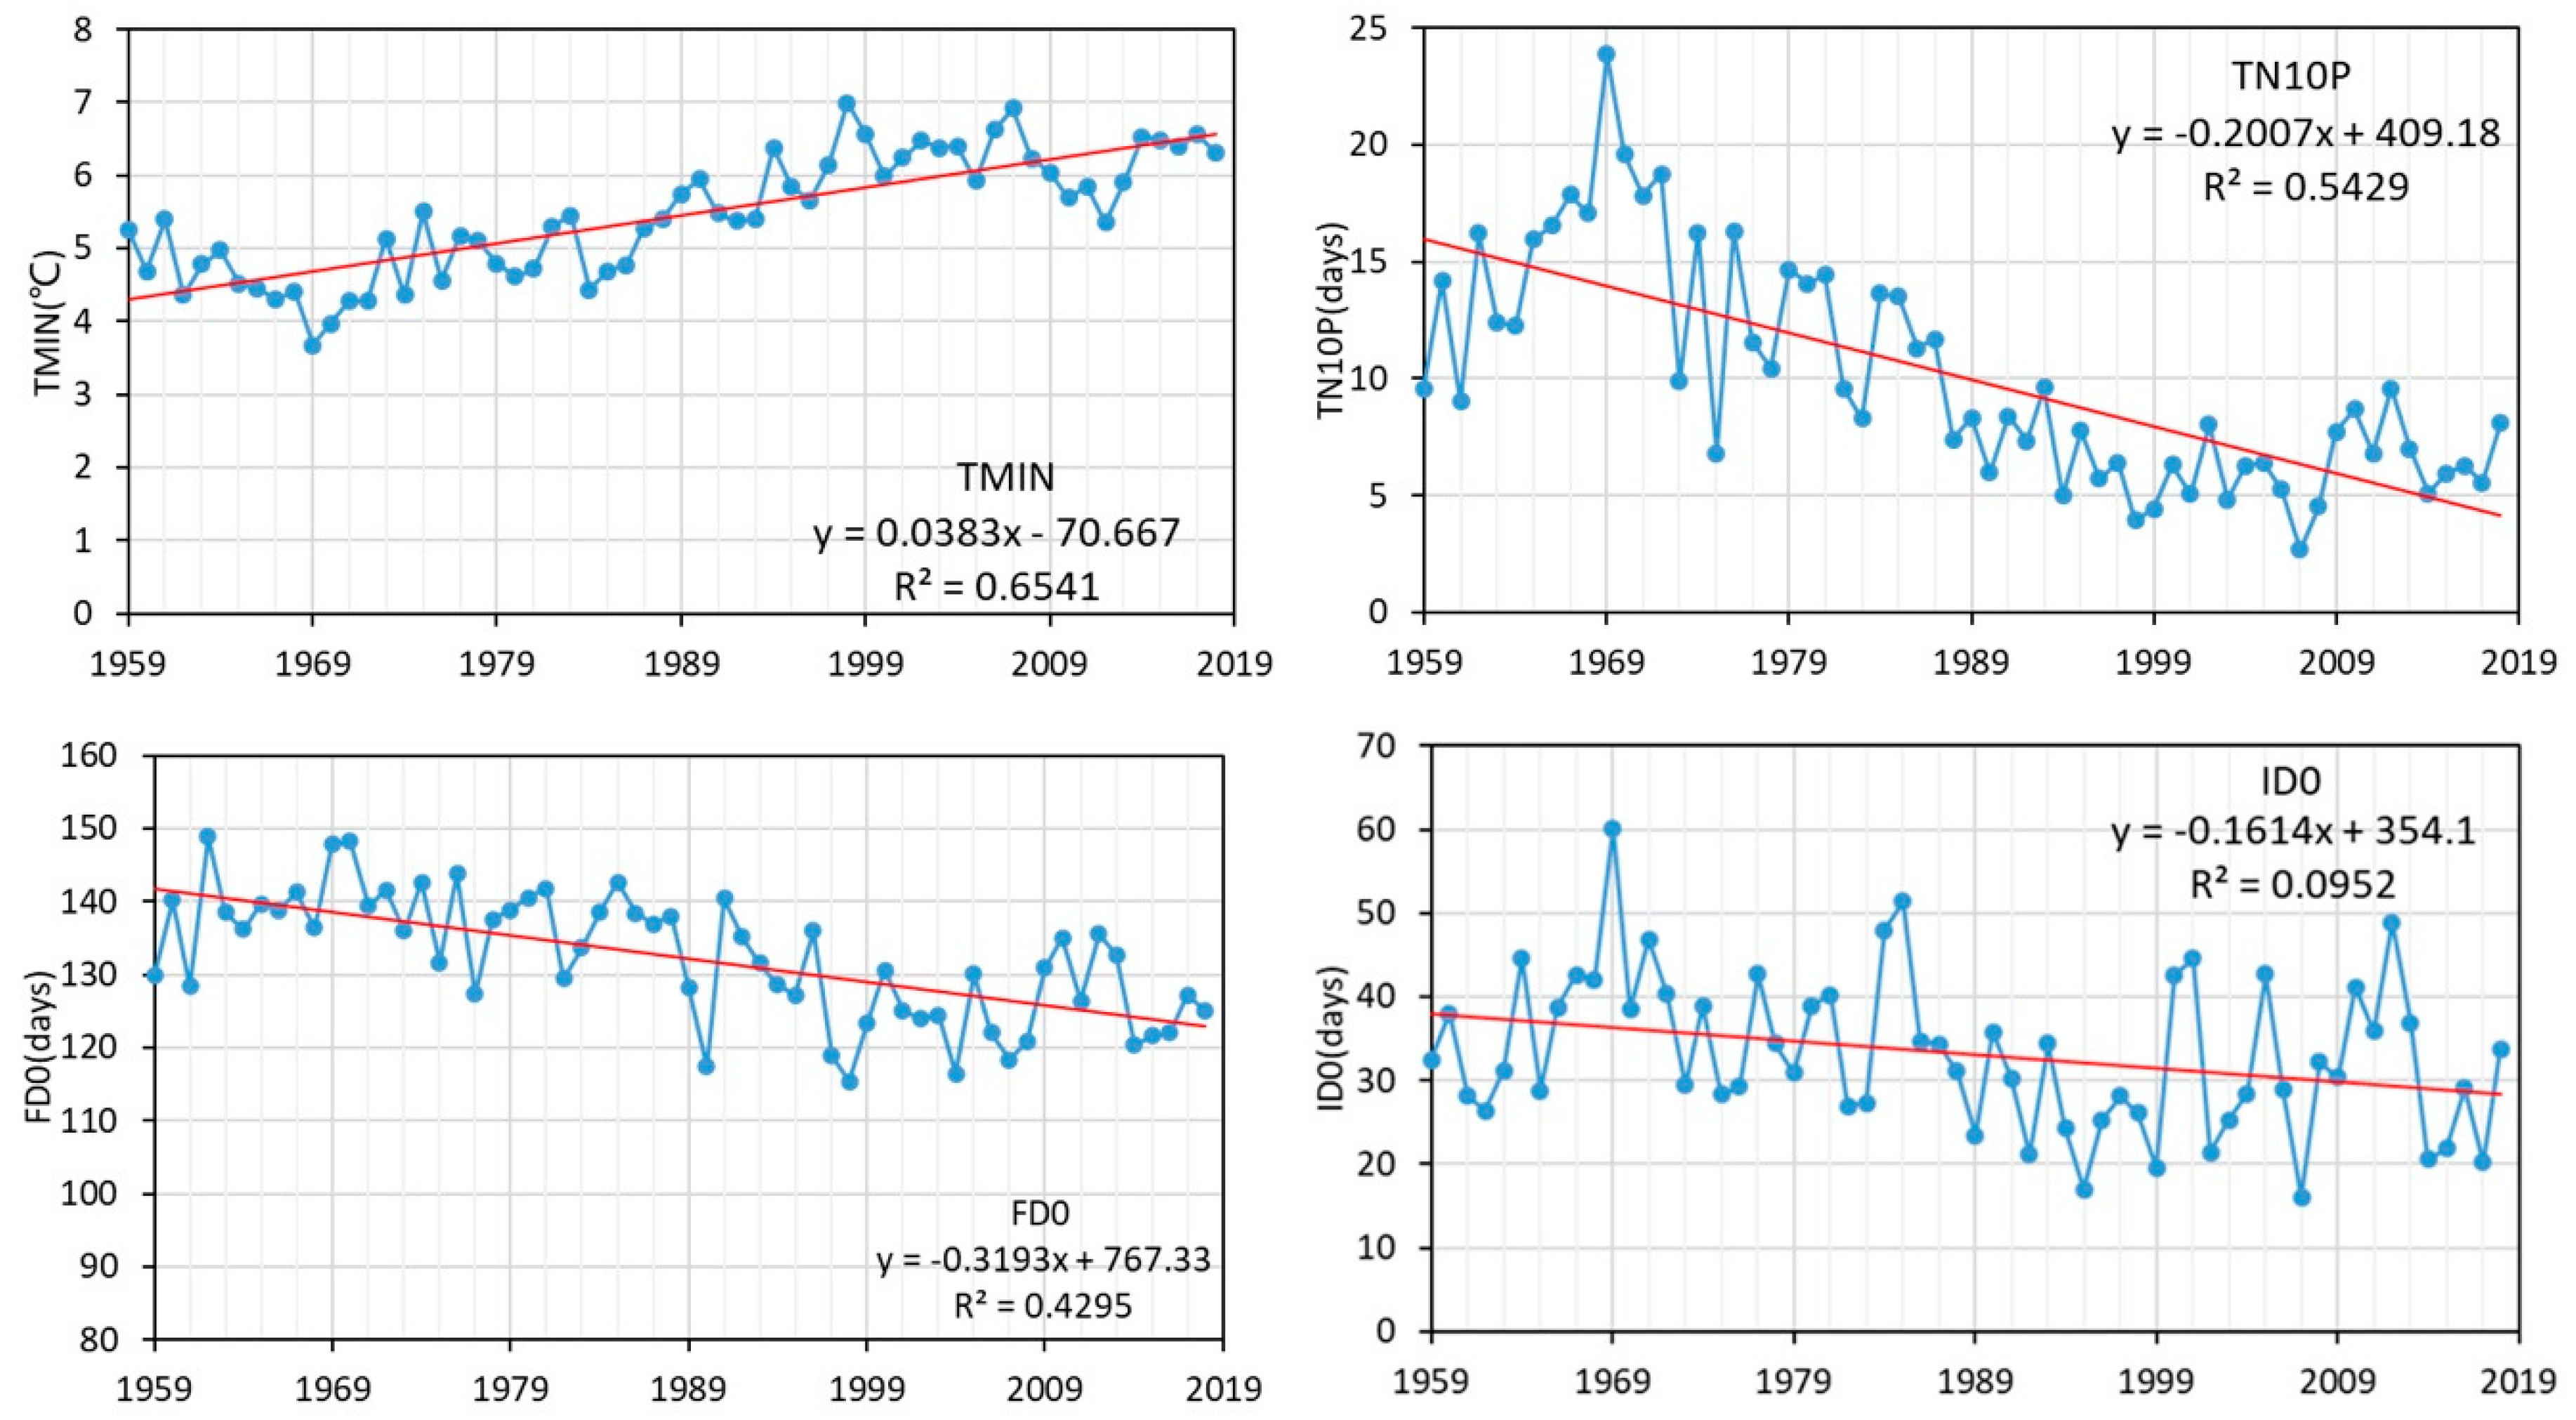
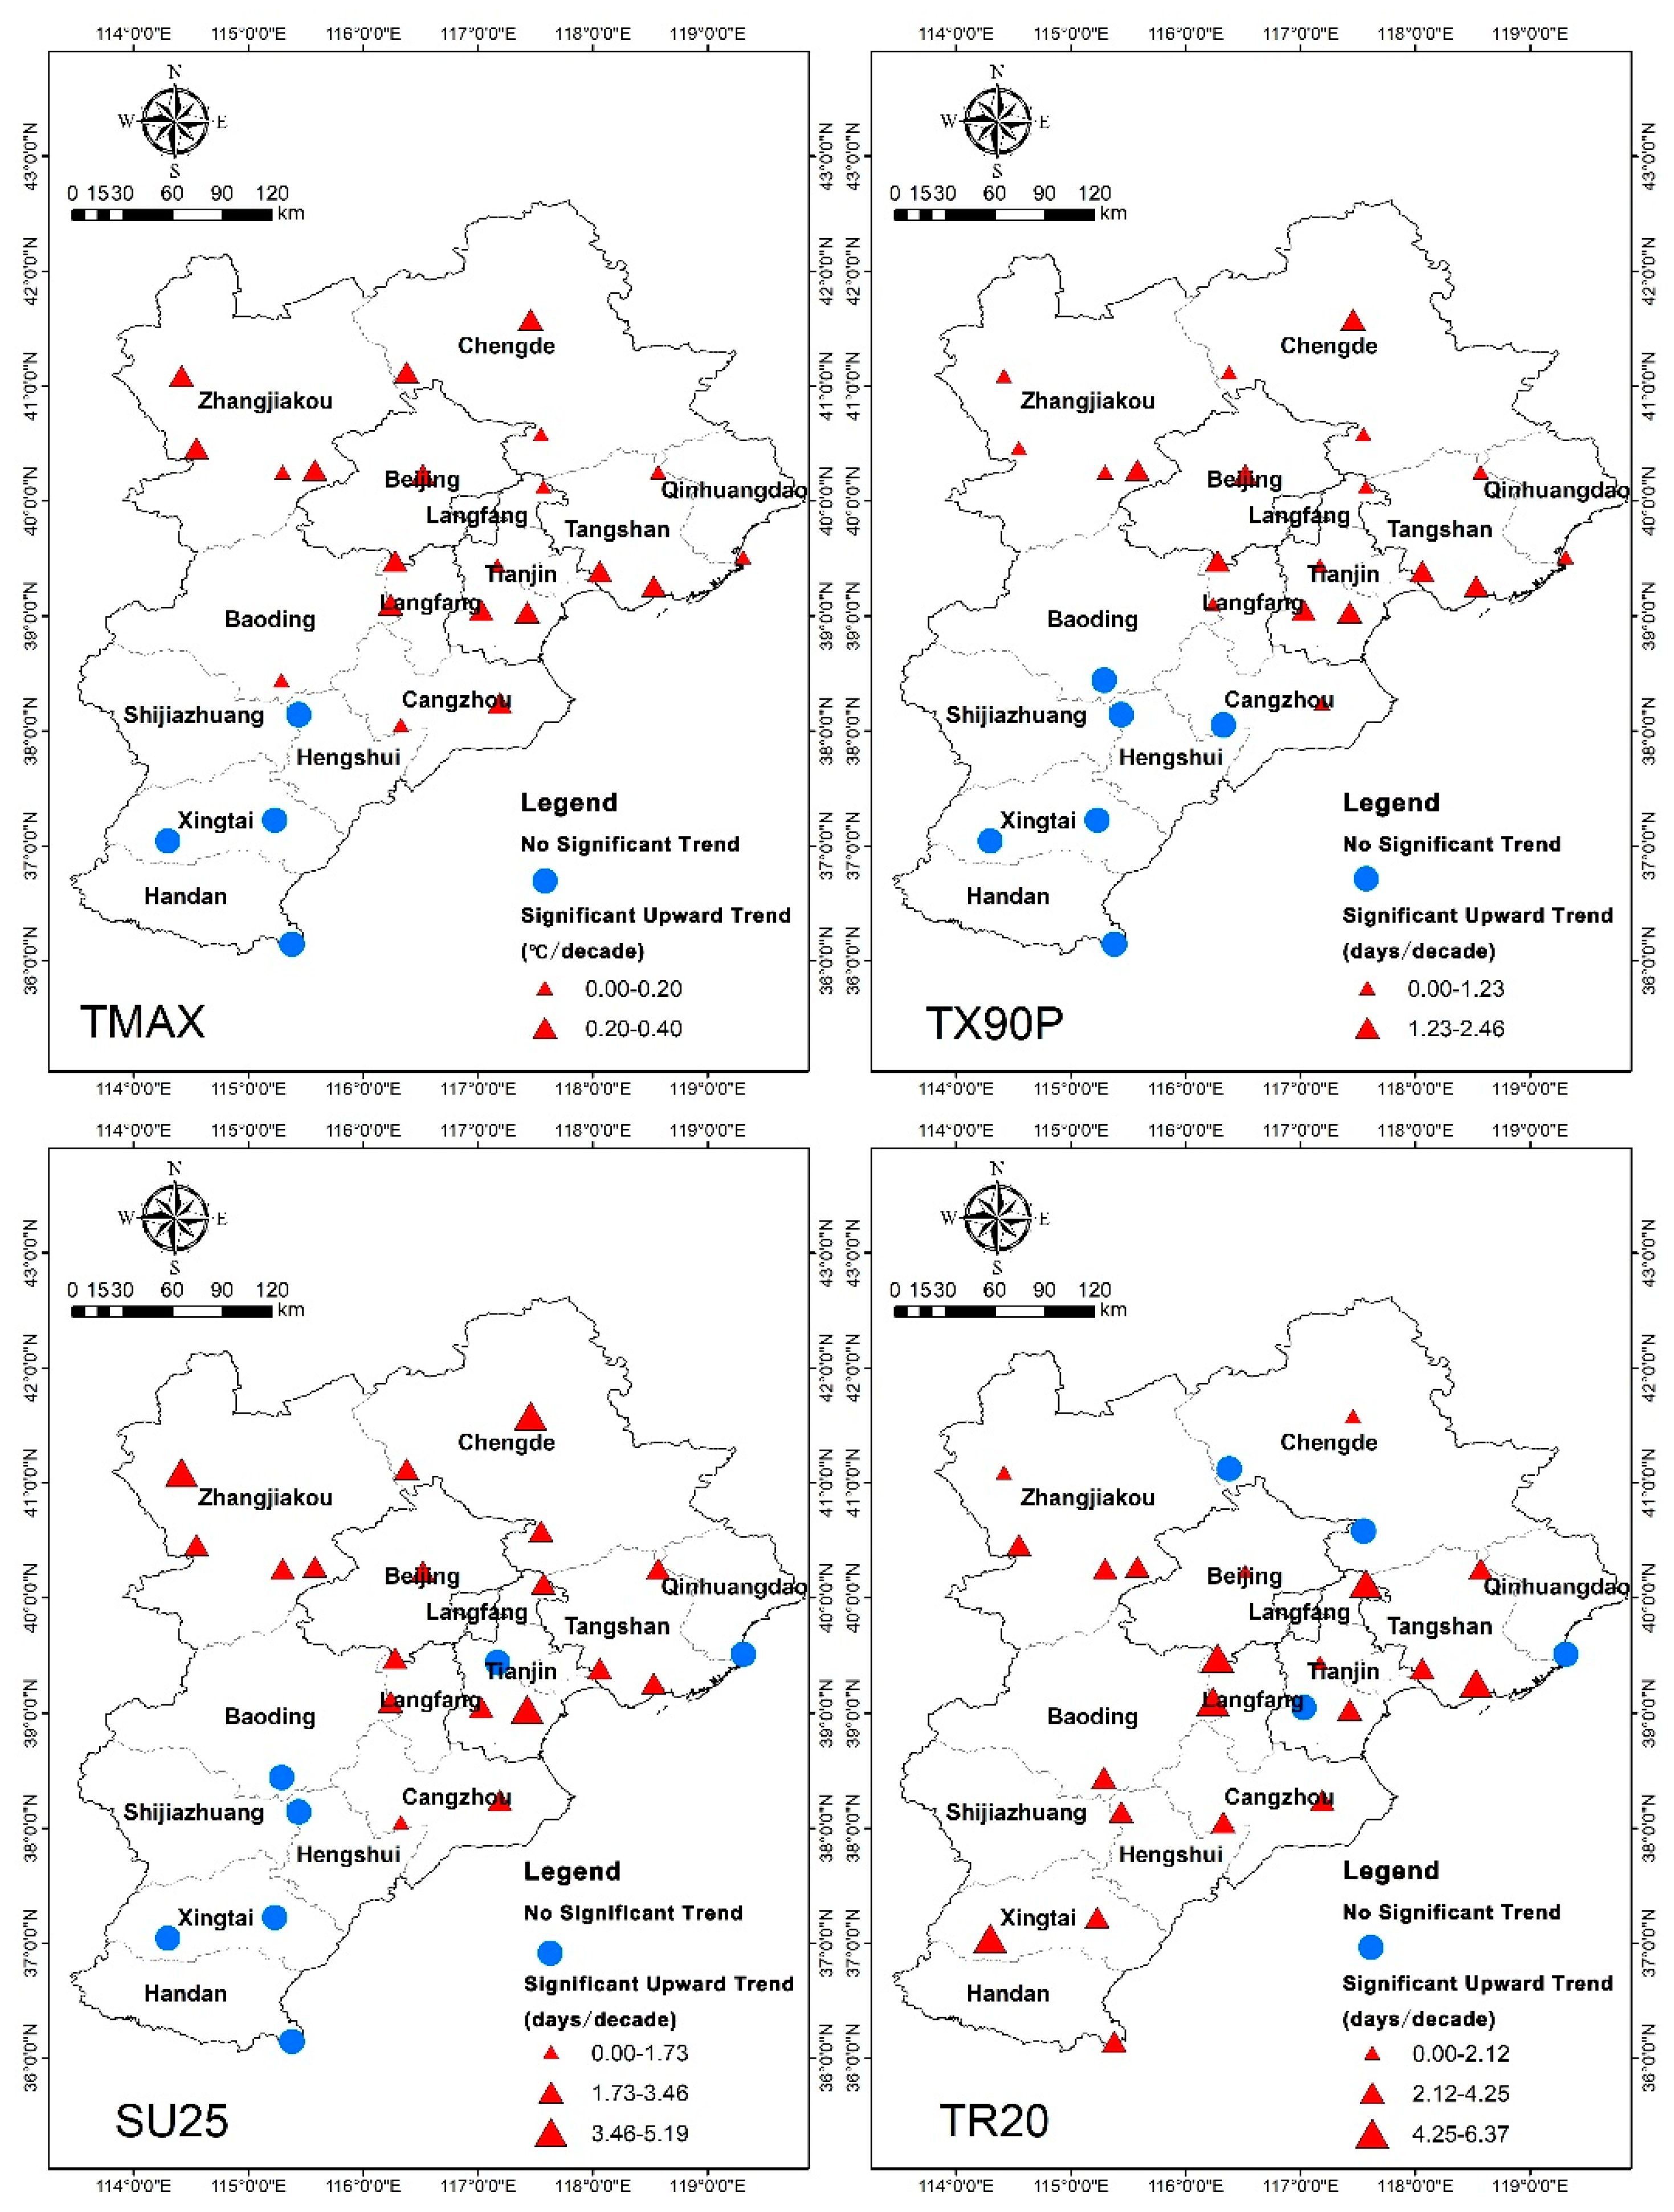
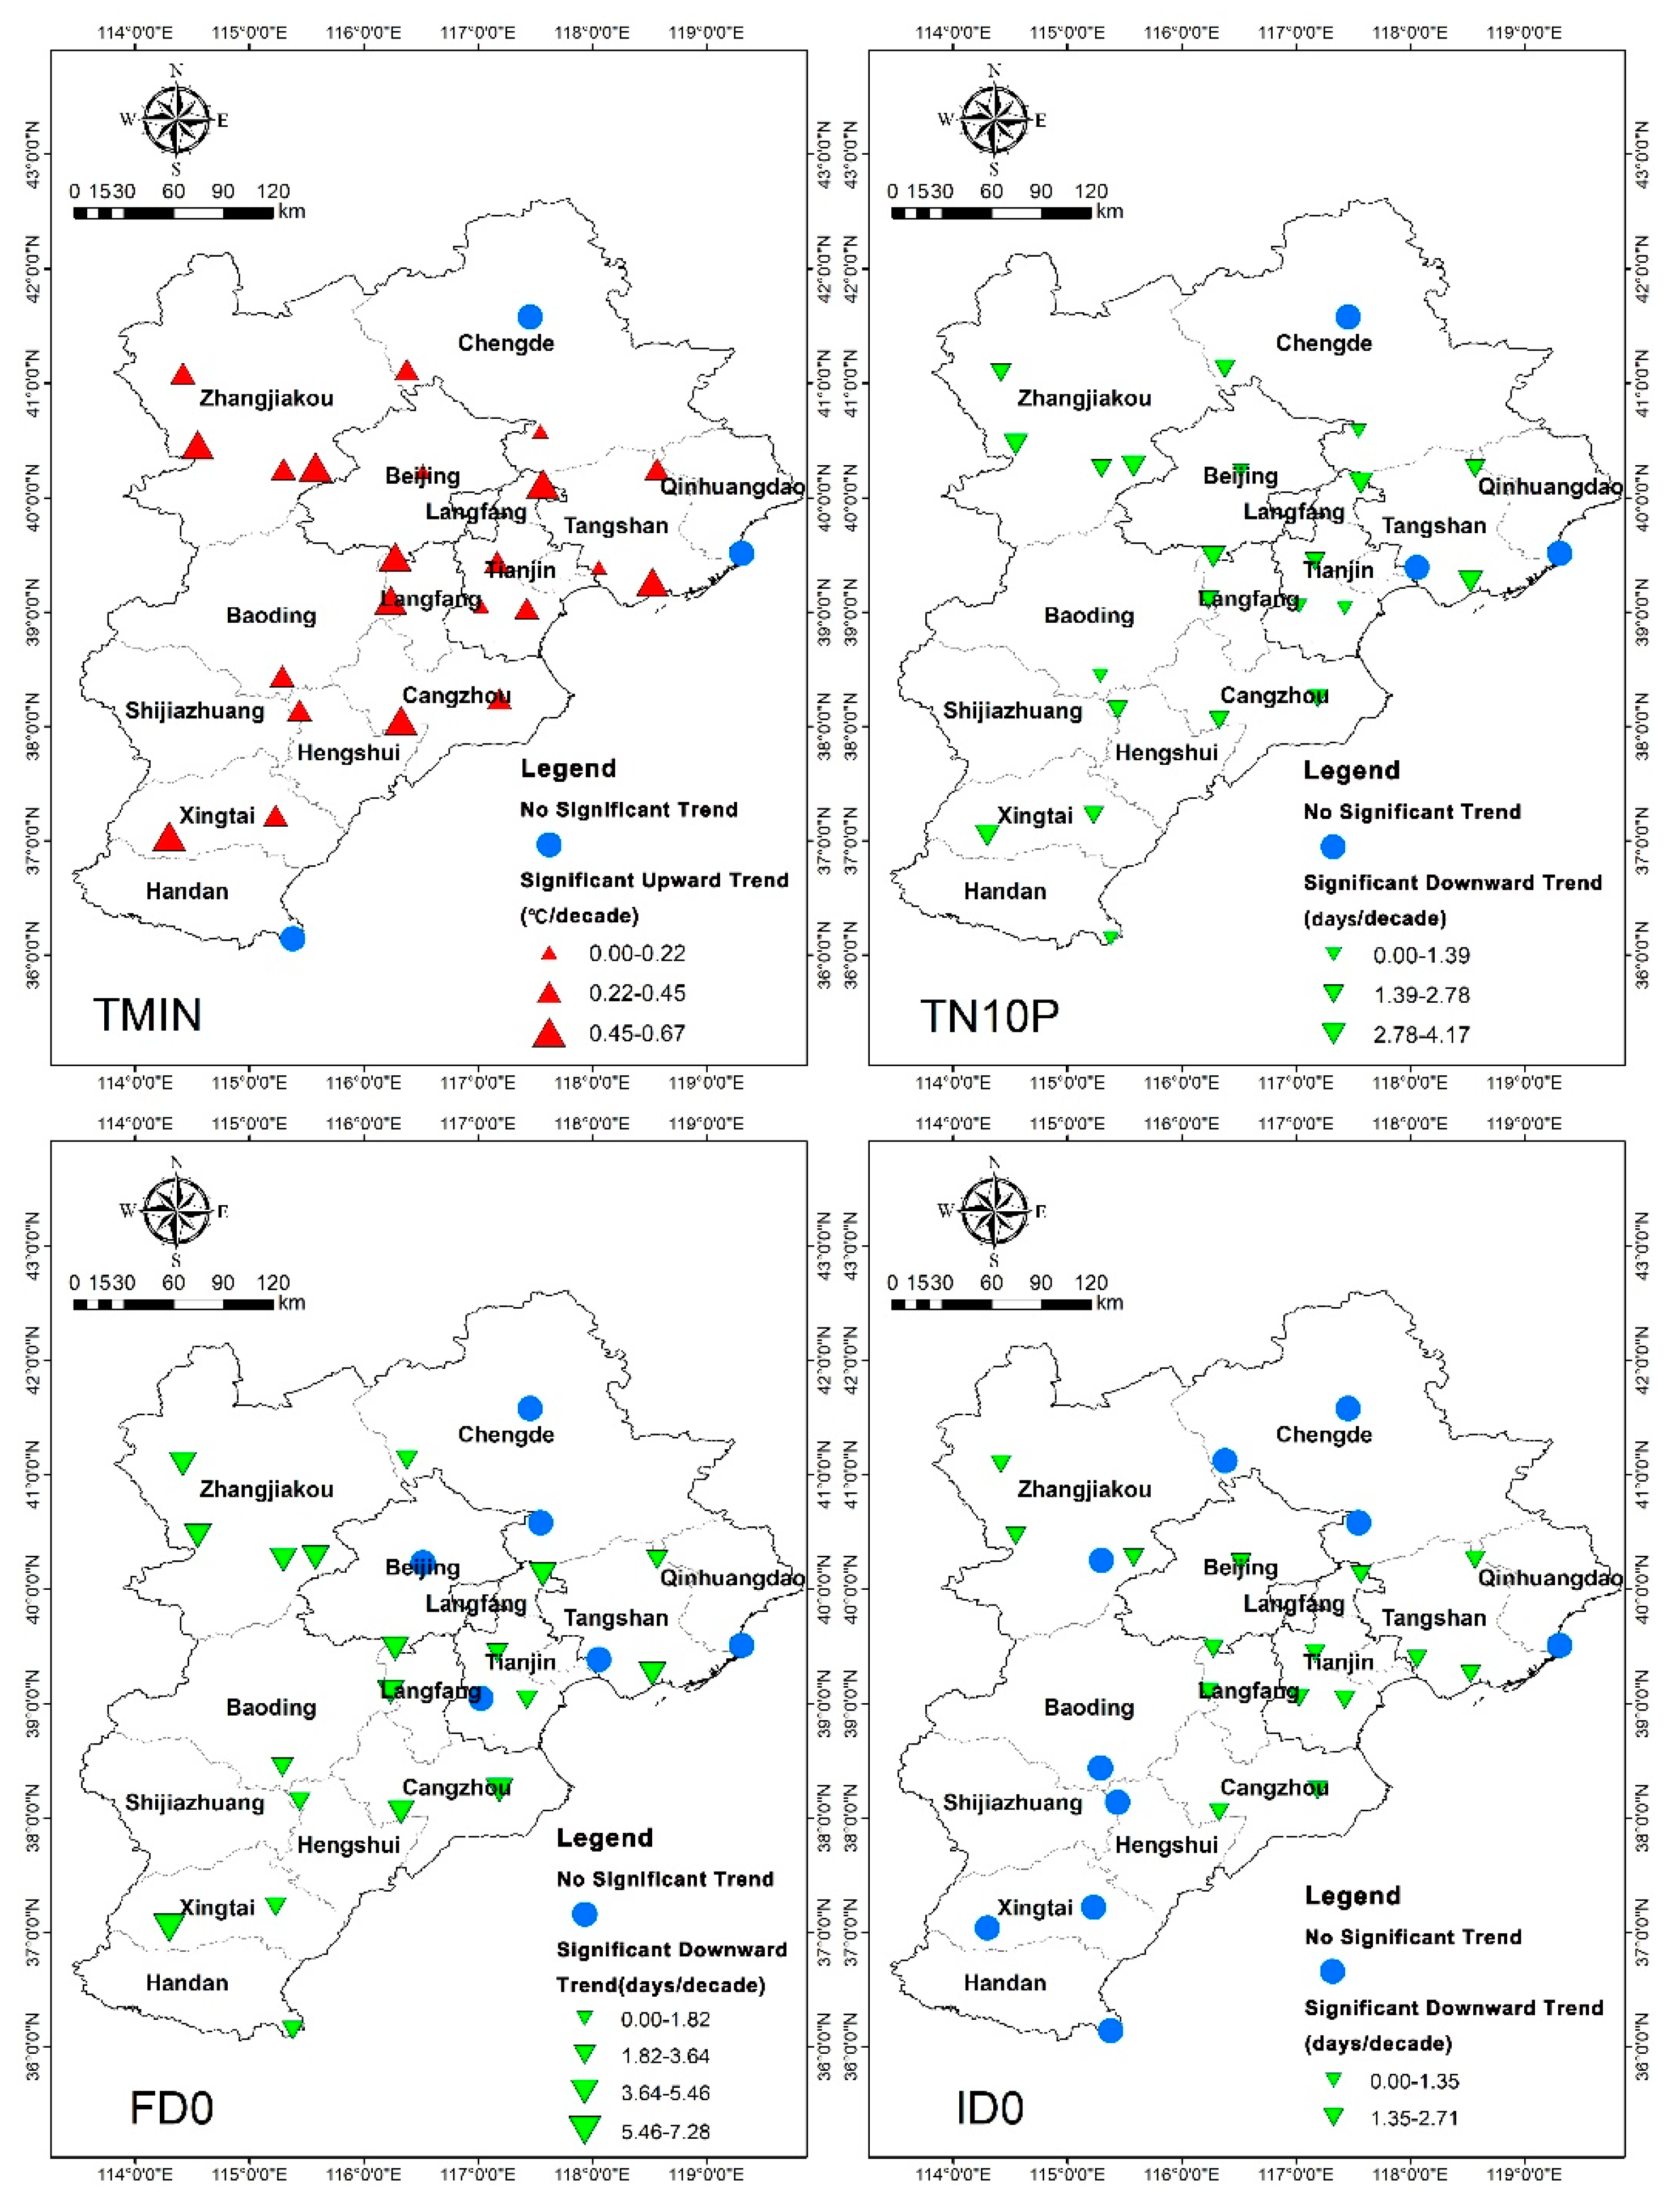
3.4. Spatial Distribution of Temporal Trends during Extreme Temperature Events
4. Discussion
5. Conclusions
Author Contributions
Funding
Conflicts of Interest
References
- Easterling, D.R.; Evans, J.L.; Groisman, P.Y.; Karl, T.R.; Kunkel, K.E.; Ambenje, P. Observed Variability and Trends in Extreme Climate Events: A Brief Review. Bull. Am. Meteorol. Soc. 2000, 81, 417–425. [Google Scholar] [CrossRef] [Green Version]
- Lassa, J.; Teng, P.; Caballero, A.M.; Shrestha, M.R. Emergency Food Reserve Policy and Practice under Disaster and Extreme Climate Events. Int. J. Disaster Risk Sci. 2019, 10, 1–13. [Google Scholar] [CrossRef] [Green Version]
- Solow, A.R. On Detecting Ecological Impacts of Extreme Climate Events and Why It Matters. Philos. Trans. R. Soc. B Biol. Sci. 2017, 372, 1723. [Google Scholar] [CrossRef] [PubMed]
- Kevin, E.T.; John, T.F.; Theodore, G.S. Attribution of Climate Extreme Events. Nat. Clim. Chang. 2015, 5, 725–730. [Google Scholar]
- Begueria, S.; Angulo-Martinez, M.; Vicente-Serrano, S.M.; Lopez-Moreno, J.I.; El-Kenawy, A. Assessing Trends in Extreme Precipitation Events Intensity and Magnitude Using Non-stationary Peaks-over-threshold Analysis: A Case Study in Northeast Spain from 1930 to 2006. Int. J. Climatol. 2011, 31, 2102–2114. [Google Scholar] [CrossRef] [Green Version]
- Grotjahn, R.; Black, R.; Leung, R.; Wehner, M.F.; Barlow, M.; Bosilovich, M.; Gershunov, A.; Gutowski, W.J.; Gyakum, J.R.; Katz, R.W.; et al. North American Extreme Temperature Events and Related Large Scale Meteorological Patterns: A Review of Statistical Methods, Dynamics, Modeling, and Trends. Clim. Dyn. 2016, 46, 1151–1184. [Google Scholar] [CrossRef] [Green Version]
- Alexander, L.V.; Zhang, X.; Peterson, T.C.; Caesar, J.; Gleason, B.; Klein Tank, A.M.G.; Haylock, M.; Collins, D.; Trewin, B.; Rahimzadeh, F.; et al. Global Observed Changes in Daily Climate Extremes of Temperature and Precipitation. J. Geophys. Res. Atmos. 2006, 111, D05109. [Google Scholar] [CrossRef] [Green Version]
- Diffenbaugh, N.S.; Singh, D.; Mankin, J.S.; Horton, D.E.; Swain, D.L.; Touma, D.; Charland, A.; Liu, Y.J.; Haugen, M.; Tsiang, M.; et al. Quantifying The Influence of Global Warming on Unprecedented Extreme Climate Events. Proc. Natl. Acad. Sci. USA 2017, 114, 4881–4886. [Google Scholar] [CrossRef] [Green Version]
- Choi, G.; Collins, D.; Ren, G.Y.; Trewin, B.; Baldi, M.; Fukuda, Y.; Afzaal, M.; Pianmana, T.; Gomboluudev, P.; Huong, P.T.T.; et al. Changes in Means and Extreme Events of Temperature and Precipitation in the Asia-Pacific Network Region, 1955-2007. Int. J. Climatol. 2009, 29, 1906–1925. [Google Scholar] [CrossRef]
- Du, H.; Xia, J.; Zeng, S.D.; She, D.X.; Liu, J.J. Variations and Statistical Probability Characteristic Analysis of Extreme Precipitation Events Under Climate Change in Haihe River Basin, China. Hydrol. Process. 2014, 28, 913–925. [Google Scholar] [CrossRef]
- Soltani, M.; Laux, P.; Kunstmann, H.; Stan, K.; Sohrabi, M.M.; Molanejad, M.; Sabziparvar, A.A.; SaadatAbadi, A.R.; Ranjbar, F.; Rousta, I.; et al. Assessment of Climate Variations in Temperature and Precipitation Extreme Events over Iran. Theor. Appl. Climatol. 2016, 126, 775–795. [Google Scholar] [CrossRef] [Green Version]
- Kao, L.S.; Chiu, Y.H.; Tsai, C.Y. An Evaluation Study of Urban Development Strategy Based on of Extreme Climate Conditions. Sustainability 2017, 9, 284. [Google Scholar] [CrossRef] [Green Version]
- Fan, J.A.; Sun, W.C.; Zhao, Y.; Xue, B.L.; Zuo, D.P.; Xu, Z.X. Trend Analyses of Extreme Precipitation Events in the Yarlung Zangbo River Basin, China Using a High-Resolution Precipitation Product. Sustainability 2018, 10, 1369. [Google Scholar] [CrossRef] [Green Version]
- Harris, R.M.B.; Beaumont, L.J.; Vance, T.R.; Tozer, C.R.; Remenyi, T.A.; Perkins-Kirkpatrick, S.E.; Mitchell, P.J.; Nicotra, A.B.; McGregor, S.; Andrew, N.R.; et al. Biological Responses to the Press and Pulse of Climate Trends and Extreme Events. Nat. Clim. Chang. 2018, 8, 579–587. [Google Scholar] [CrossRef]
- Han, Z.Y.; Shi, Y.; Wu, J.; Xu, Y.; Zhou, B.T. Combined Dynamical and Statistical Downscaling for High-Resolution Projections of Multiple Climate Variables in the Beijing-Tianjin-Hebei Region of China. J. Appl. Meteorol. Climatol. 2019, 58, 2387–2403. [Google Scholar] [CrossRef]
- Zhang, J.; Sun, F.B.; Liu, W.B.; Liu, J.H.; Wang, H. Spatio-temporal Patterns of Drought Evolution over the Beijing-Tianjin-Hebei Region, China. J. Geogr. Sci. 2019, 29, 863–876. [Google Scholar] [CrossRef] [Green Version]
- Wang, J.H.; Jiang, D.; Huang, Y.H.; Wang, H. Drought Analysis of the Haihe River Basin Based on GRACE Terrestrial Water Storage. Sci. World J. 2014. [Google Scholar] [CrossRef] [Green Version]
- Zhang, S.; Huang, G.; Qi, Y.J.; Jia, G.S. Impact of Urbanization on Summer Rainfall in Beijing–Tianjin–Hebei Metropolis under Different Climate Backgrounds. Theor. Appl. Climatol. 2018, 133, 1093–1106. [Google Scholar] [CrossRef]
- Zhao, N.; Yue, T.X.; Li, H.; Zhang, L.L.; Yin, X.Z.; Liu, Y. Spatio-temporal Changes in Precipitation over Beijing-Tianjin-Hebei Region, China. Atmos. Res. 2018, 202, 156–168. [Google Scholar] [CrossRef]
- Zhang, Y.; Huang, G.H.; Wang, X.Q.; Liu, Z.P. Observed Changes in Temperature Extremes for the Beijing-Tianjin-Hebei Region of China. Meteorol. Appl. 2017, 24, 74–83. [Google Scholar] [CrossRef] [Green Version]
- Wang, X.L.; Feng, Y. RHtestsV4 User Manual; Climate Research Division, Atmospheric Science and Technology Directorate, Science and Technology Branch, Environment Canada: 2013. Available online: http://etccdi.pacificclimate.org/software.shtml (accessed on 1 July 2013).
- Wang, X.L. Accounting for Autocorrelation in Detecting Mean-shifts in Climate Data Series Using the Penalized Maximal t or F Test. J. Appl. Meteor. Climatol. 2008, 47, 2423–2444. [Google Scholar] [CrossRef]
- Wang, X.L. Penalized Maximal F-test for Detecting Undocumented Mean-shifts without Trend-change. J. Atmos. Ocean. Technol. 2008, 25, 368–384. [Google Scholar] [CrossRef]
- Zhang, P.F.; Ren, G.Y.; Xu, Y.; Wang, X.L.; Qin, Y.; Sun, X.B.; Ren, Y.Y. Observed Changes in Extreme Temperature over the Global Land Based on a Newly Developed Station Daily Dataset. J. Clim. 2019, 32, 8489–8509. [Google Scholar] [CrossRef]
- Wang, X.H.; Wang, B.T.; Xu, X.Y. Effects of Large-scale Climate Anomalies on Trends in Seasonal Precipitation over the Loess Plateau of China from 1961 to 2016. Ecol. Indic. 2019, 107. [Google Scholar] [CrossRef]
- Zhai, Y.Z.; Guo, Y.L.; Zhou, J.; Guo, N.; Wang, J.S.; Teng, Y.G. The Spatio-temporal Variability of Annual Precipitation and its Local Impact Factors during 1724–2010 in Beijing, China. Hydrol. Process. 2014, 28, 2192–2201. [Google Scholar] [CrossRef]
- Wang, B.; Xu, Z.X. Spatial and Temporal Variations of Precipitation in Haihe River Basin in the Recent 53 years, Remote Sensing and GIS for Hydrology and water resources. In Proceedings of the 3rd Remote Sensing and Hydrology Symposium (RSHS 14)/3rd International Conference of GIS/RS in Hydrology, Water Resources and Environment (ICGRHWE 14), Guangzhou, China, 24–27 August 2014. [Google Scholar]
- Sen, P.K. Estimates of the Regression Coefficient Based on Kendall’s tau. J. Am. Stat. Assoc. 1968, 63, 1379–1389. [Google Scholar] [CrossRef]
- Chu, J.T.; Xia, J.; Xu, C.Y.; Li, L.; Wang, Z.G. Spatial and Temporal Variability of Daily, Precipitation in Haihe River Basin, 1958–2007. J. Geogr. Sci. 2010, 20, 248–260. [Google Scholar] [CrossRef]
- Wang, Z.G.; Luo, Y.Z.; Liu, C.M.; Xia, J.; Zhang, M.H. Spatial and Temporal Variations of Precipitation in Haihe River Basin, China: Six Decades of Measurements. Hydrol. Process. 2011, 25, 2916–2923. [Google Scholar] [CrossRef]
- Yan, T.Z.; Shen, Z.Y.; Bai, J.W. Spatial and Temporal Changes in Temperature, Precipitation, and Streamflow in the Miyun Reservoir Basin of China. Water 2017, 9, 78. [Google Scholar] [CrossRef] [Green Version]
- Luo, Y.Z.; Wang, Z.G.; Liu, X.M.; Zhang, M.H. Spatial and Temporal Variability of Precipitation in Haihe River Basin, China: Characterization and Management Implications. Adv. Meteorol. 2014. [Google Scholar] [CrossRef]
- Song, X.M.; Zhang, J.Y.; AghaKouchak, A.; Sen Roy, S.; Xuan, Y.Q.; Wang, G.Q.; He, R.M.; Wang, X.J.; Liu, C.S. Rapid Urbanization and Changes in Spatiotemporal Characteristics of Precipitation in Beijing Metropolitan Area. J. Geophys. Res. Atmos. 2014, 119, 11250–11271. [Google Scholar] [CrossRef] [Green Version]
- Pielke, R.A.; Mahmood, R.; McAlpine, C. Land’s Complex Role in Climate Change. Phys. Today 2016, 69, 40–46. [Google Scholar] [CrossRef] [Green Version]
- Woldemichael, A.T.; Hossain, F.; Pielke, R.; Beltran-Przekurat, A. Understanding the Impact of Dam-Triggered Land Use/Land Cover Change on the Modification of Extreme Precipitation. Water Resour. Res. 2012. [Google Scholar] [CrossRef] [Green Version]
- Pielke, R.A.; Adegoke, J.; Beltran-Przekurat, A.; Hiemstra, C.A.; Lin, J.; Nair, U.S.; Niyogi, D.; Nobis, T.E. An Overview of Regional Land use and Land cover Impacts on Rainfall. Tellus Ser. B Chem. Phys. Meteorol. 2007, 59, 587–601. [Google Scholar] [CrossRef]
- Wang, G.; Yan, D.H.; He, X.Y.; Liu, S.H.; Zhang, C.; Xing, Z.Q.; Kan, G.Y.; Qin, T.L.; Ren, M.L.; Li, H. Trends in Extreme Temperature Indexes in Huang-Huai-Hai River Basin of China during 1961–2014. Theor. Appl. Climatol. 2018, 134, 51–65. [Google Scholar] [CrossRef]
- Song, X.P.; Wang, S.G.; Li, T.S.; Tian, J.H.; Ding, G.W.; Wang, J.X.; Wang, J.X.; Shang, K.Z. The Impact of Heat Waves and Cold Spells on Respiratory Emergency Department Visits in Beijing, China. Sci. Total Environ. 2018, 615, 1499–1505. [Google Scholar] [CrossRef]
- Zhang, J.; Li, T.T.; Tan, J.G.; Huang, C.R.; Kan, H.D. Impact of Temperature on Mortality in Three Major Chinese Cities. Biomed. Environ. Sci. 2014, 27, 485–496. [Google Scholar] [CrossRef]
- Shi, W.J.; Tao, F.L.; Liu, J.Y. Regional Temperature Change over the Huang-Huai-Hai Plain of China: The Roles of Irrigation Versus Urbanization. Int. J. Climatol. 2014, 34, 1181–1195. [Google Scholar] [CrossRef]
- He, Y.Q.; Lee, E.; McNeil, B.; Meng, L.; Warner, T.; Zégre, N. Impacts of Land Use and Land Cover Change on Regional Climate in China. Environ. Res. Lett. 2019. [Google Scholar] [CrossRef]
- Lin, S.; Feng, J.M.; Wang, J.; Hu, Y.H. Modeling the Contribution of Long-term Urbanization to Temperature Increase in Three Extensive Urban Agglomerations in China. J. Geophys. Res. Atmos. 2016, 121, 1683–1697. [Google Scholar] [CrossRef] [Green Version]
- Huang, C.C.; Zheng, X.G.; Tait, A.; Dai, Y.J.; Yang, C.; Chen, Z.Q.; Li, T.; Wang, Z.L. On Using Smoothing Spline and Residual Correction to Fuse Rain Gauge Observations and Remote Sensing Data. J. Hydrol. 2014, 508, 410–417. [Google Scholar] [CrossRef]
- Choubin, B.; Khalighi-Sigaroodi, S.; Mishra, A.; Goodarzi, M.; Shamshirband, S.; Ghaljaee, E.; Zhang, F. A Novel Bias Correction Framework of TMPA 3B42 Daily Precipitation Data Using Similarity Matrix/Homogeneous Conditions. Sci. Total Environ. 2019, 694, 133680. [Google Scholar] [CrossRef] [PubMed]

| Index | Category | Definition | Units |
|---|---|---|---|
| SDII | intensity | annual average daily precipitation on wet days | mm |
| RX1DAY | intensity | annual maximum daily precipitation | mm |
| RX5DAY | intensity | annual maximum consecutive 5-day precipitation | mm |
| R95P | intensity | annual total precipitation when daily precipitation >the 95th percentile of daily precipitation in the 60-year period | mm |
| R99P | intensity | annual total precipitation when daily precipitation >the 99th percentile of daily precipitation in the 60-year period | mm |
| R10mm | frequency | annual count of days when daily precipitation >10mm | days |
| R20mm | frequency | annual count of days when daily precipitation >20mm | days |
| R50mm | frequency | annual count of days when daily precipitation >50mm | days |
| CWD | duration | maximum number of consecutive wet days | days |
| Index | Category | Definition | Units |
|---|---|---|---|
| TMAX | hot weather | annual daily maximum temperature | °C |
| TX90P | hot weather | annual count of days when TMAX >the 90th percentile of daily TMAX in the 60-year period | days |
| SU25 | hot weather | annual count of days when TMAX >25 °C | days |
| TR20 | hot weather | annual count of days when TMIN >20 °C | days |
| TMIN | cold weather | annual minimum temperature | °C |
| TN10P | cold weather | annual count of days when TMIN <the 10th percentile of daily TMIN in the 60-year period | days |
| FD0 | cold weather | annual count of days when TMIN <0 °C | days |
| ID0 | cold weather | annual count of days when TMAX <0 °C | days |
| Index | Average Value | Trend | Significant or Not |
|---|---|---|---|
| SDII | 11.1mm | −0.086 mm/decade | No |
| RX1DAY | 74.1 mm | −2.650 mm/decade | Yes |
| RX5DAY | 110.7 mm | −4.544 mm/decade | Yes |
| R95P | 161.3 mm | −8.645 mm/decade | Yes |
| R99P | 132.1 mm | −5.896 mm/decade | Yes |
| Index | Average Value | Trend | Significant or Not |
|---|---|---|---|
| R10mm | 15.10 days | −0.130 days/decade | No |
| R20mm | 7.25 days | −0.149 days/decade | No |
| R50mm | 1.46 days | −0.103 days/decade | Yes |
| CWD | 3.97 days | −0.076 days/decade | Yes |
| Index | Average Value | Trend | Significant or Not |
|---|---|---|---|
| TMAX | 16.93 °C | 0.198 °C/decade | Yes |
| TX90P | 10.04 days | 1.000 days/decade | Yes |
| SU25 | 121.61 days | 2.373 days/decade | Yes |
| TR20 | 48.24 days | 2.820 days/decade | Yes |
| Index | Average Value | Trend | Significant or Not |
|---|---|---|---|
| TMIN | 5.44 °C | 0.383 °C/decade | Yes |
| TN10P | 10.08 days | −2.070 days/decade | Yes |
| FD0 | 132.41 days | −3.193 days/decade | Yes |
| ID0 | 33.23 days | −1.614 days/decade | Yes |
© 2020 by the authors. Licensee MDPI, Basel, Switzerland. This article is an open access article distributed under the terms and conditions of the Creative Commons Attribution (CC BY) license (http://creativecommons.org/licenses/by/4.0/).
Share and Cite
Tong, R.; Sun, W.; Han, Q.; Yu, J.; Tian, Z. Spatial and Temporal Variations in Extreme Precipitation and Temperature Events in the Beijing–Tianjin–Hebei Region of China over the Past Six Decades. Sustainability 2020, 12, 1415. https://doi.org/10.3390/su12041415
Tong R, Sun W, Han Q, Yu J, Tian Z. Spatial and Temporal Variations in Extreme Precipitation and Temperature Events in the Beijing–Tianjin–Hebei Region of China over the Past Six Decades. Sustainability. 2020; 12(4):1415. https://doi.org/10.3390/su12041415
Chicago/Turabian StyleTong, Runze, Wenchao Sun, Quan Han, Jingshan Yu, and Zaifeng Tian. 2020. "Spatial and Temporal Variations in Extreme Precipitation and Temperature Events in the Beijing–Tianjin–Hebei Region of China over the Past Six Decades" Sustainability 12, no. 4: 1415. https://doi.org/10.3390/su12041415
APA StyleTong, R., Sun, W., Han, Q., Yu, J., & Tian, Z. (2020). Spatial and Temporal Variations in Extreme Precipitation and Temperature Events in the Beijing–Tianjin–Hebei Region of China over the Past Six Decades. Sustainability, 12(4), 1415. https://doi.org/10.3390/su12041415