Article

Benchmarking the Swedish Diet Relative to Global and National Environmental Targets—Identification of Indicator Limitations and Data Gaps

1
Department of Energy and Technology, Swedish University of Agricultural Sciences, SE-750 07 Uppsala, Sweden
2
Stockholm Resilience Centre, Stockholm University, SE-106 91 Stockholm, Sweden
*
Author to whom correspondence should be addressed.
Sustainability 2020, 12(4), 1407; https://doi.org/10.3390/su12041407
Submission received: 4 December 2019 / Revised: 31 January 2020 / Accepted: 2 February 2020 / Published: 14 February 2020
(This article belongs to the Special Issue Healthy Sustainable Diets)

Abstract

:
To reduce environmental burdens from the food system, a shift towards environmentally sustainable diets is needed. In this study, the environmental impacts of the Swedish diet were benchmarked relative to global environmental boundaries suggested by the EAT-Lancet Commission. To identify local environmental concerns not captured by the global boundaries, relationships between the global EAT-Lancet variables and the national Swedish Environmental Objectives (SEOs) were analysed and additional indicators for missing aspects were identified. The results showed that the environmental impacts caused by the average Swedish diet exceeded the global boundaries for greenhouse gas emissions, cropland use and application of nutrients by two- to more than four-fold when the boundaries were scaled to per capita level. With regard to biodiversity, the impacts caused by the Swedish diet transgressed the boundary by six-fold. For freshwater use, the diet performed well within the boundary. Comparison of global and local indicators revealed that the EAT-Lancet variables covered many aspects included in the SEOs, but that these global indicators are not always of sufficiently fine resolution to capture local aspects of environmental sustainability, such as eutrophication impacts. To consider aspects and impact categories included in the SEO but not currently covered by the EAT-Lancet variables, such as chemical pollution and acidification, additional indicators and boundaries are needed. This requires better inventory data on e.g., pesticide use and improved traceability for imported foods.

1. Introduction

The food system is a major contributor to many environmental pressures, threatening the functioning of several Earth systems [1]. Food-related activities account for 19%–29% of global greenhouse gas emissions (GHGs) [2], occupy about 40% of the Earth’s land surface [3] and are the main driver of deforestation of tropical forests, causing large GHG emissions and threatening biodiversity [4]. Moreover, the agriculture sector is responsible for 70% of global freshwater withdrawals and pollutes aquatic and terrestrial ecosystems through emissions of nitrogen and phosphorus from fertiliser use [1].
To reduce these environmental burdens, profound changes in the food system are needed, including a shift towards environmentally sustainable diets [1]. These are often regarded as diets causing lower environmental impacts (e.g., [5]), which several studies have identified as diets with a low to moderate amount of meat and animal-based products and a larger share of plant-based foods than in current diets in many high-income countries [6,7,8,9]. This conclusion was also reached by Martin and Brandão [10], who investigated implications of dietary changes by the Swedish population. The average Swedish diet involves high intake of meat and dairy products in comparison with both the European and global average [11,12], and Martin and Brandão [10] demonstrated that switching to a vegetarian or vegan diet could decrease several environmental burdens. However, although such results give valuable insights into the relative performance of diets, they do not show whether the diets are sustainable ‘enough’ to reach environmental targets. For this, it is necessary to evaluate the environmental performance of the diets relative to absolute thresholds, beyond which they can be considered unsustainable. Such thresholds are highly challenging to establish, but some attempts have been made. One example is the ‘One Planet Plate’ concept, where the World Wildlife Fund (WWF) in Sweden sets absolute limits for GHG emissions from yearly consumption of food [13]. Another example is given by Röös et al. [14], who investigated the environmental sustainability of the average Swedish diet by defining per capita thresholds for GHG emissions and occupation of agricultural land for Swedish food consumption, and then benchmarking the impacts of the diet against these boundaries. Furthermore, the EAT-Lancet Commission [1] recently proposed absolute boundaries for six Earth system processes, within which the global food system should operate to be environmentally sustainable.
As previous studies evaluating sustainable diets have primarily focused on GHG emissions and land use as indicators of sustainability [15,16], the boundaries proposed by the EAT-Lancet Commission make it possible to evaluate the absolute environmental sustainability of diets with a more comprehensive set of indicators than before. However, although the EAT-Lancet Commission proposes several environmental indicators, these do not capture all environmental sustainability issues. One such example is the use of pesticides, which can have toxic impacts on humans and ecosystems. Furthermore, the EAT-Lancet boundaries are defined on a global level, so applying them at national scale might risk overlooking important aspects. The indicator for GHG emissions is the only exception, since emissions of GHGs cause global problems, regardless of the source of the emissions. For other aspects such as freshwater use, the impacts have a strong local connection, i.e., where and how water is used is highly important [16]. Hence, national indicators may add perspectives on the conditions where the majority of the foods in the diet are produced. For Sweden, such national indicators are found in the framework of the Swedish Environmental Objectives (SEOs). These are intended to steer Sweden’s environmental policy towards solving environmental issues for the next generation, without causing environmental problems outside Sweden’s borders [17] (Summary in English available at: http://www.swedishepa.se/Documents/publikationer6400/978-91-620-8620-6.pdf).
The aim of the present study was to assess the environmental sustainability of the Swedish diet and evaluate how well global indicators capture local environmental sustainability concerns. This was achieved by assessing and benchmarking the environmental impacts of the Swedish diet against global environmental sustainability boundaries and identifying potential missing aspects and indicators for capturing the environmental sustainability of the diet in a local context.

2. Materials and Methods

We used the variables proposed by the EAT-Lancet Commission [1] as the starting point for evaluation of the environmental sustainability of the average Swedish diet. Absolute boundaries for the environmental sustainability of key Earth systems affected by global food production are proposed by the EAT-Lancet Commission, making it one of the most comprehensive frameworks for assessing food system environmental sustainability against absolute boundaries.
To calculate the impacts caused by the average Swedish diet, we retrieved data on average per capita food supply (Section 2.1), assessed environmental impacts per kg or litre of food and then multiplied the amounts of food by the environmental impacts. Inventory data used for assessment of the foods are described in Section 2.2 and are available with references, in the Supplementary Material. We then benchmarked the environmental impacts from the per capita average diet against the downscaled EAT-Lancet boundaries (Section 2.3) for each environmental variable. To identify local environmental concerns not captured by the EAT-Lancet variables, we analysed the relationships between the SEOs, which are designed for describing and monitoring the local environmental status in Sweden, and the global EAT-Lancet variables. Based on this, we looked for additional indicators relevant for capturing the environmental sustainability of diets in the local context (Section 2.4).

2.1. Data on Food Supply for the Average Swedish Diet

Data on food supply for the average Swedish diet were obtained from the Swedish Board of Agriculture [18,19]. We used data on the average direct consumption of food, i.e., the amount of food available for consumption. This food could be either eaten or wasted, but is the amount of food that needs to be produced to sustain the Swedish diet. A full list of the food supply is available in the Supplementary Material (Table S4). To reduce impacts from variations between years, an average of the food consumed in the years 2011 to 2015 was used. Lists of raw materials in processed and prepared products were obtained from the Swedish National Food Agency (as unpublished data on the amount of raw agricultural commodities (RAC)) [20], from Life Cycle Assessment (LCA) studies [21] and from reports [22,23].

2.2. Global Boundaries, Indicators and Inventory Data

The EAT-Lancet framework [1] (Table 1) builds on the ‘Planetary Boundaries’ concept [24,25], which defines absolute environmental sustainability limits for nine Earth system processes pressured by human activities. The majority of the boundaries in the EAT-Lancet framework are set in relation to the Planetary Boundaries framework, i.e., are based on absolute biophysical limits for Earth systems affected specifically by food production within which humanity should operate.

2.2.1. Climate Change

We evaluated the climate impact caused by the average Swedish diet by using the control variable of GHG emissions, as suggested by the EAT-Lancet Commission [1]. While the majority of the boundaries in the EAT-Lancet framework are set in relation to the absolute biophysical Planetary Boundaries [24,25], the boundary for climate change was established considering the feasibility of reducing emissions from the food system based on an emissions pathway compatible with the 2 °C climate boundary. In this scenario, it is assumed that by 2050, emissions of CO2 from fossil fuels and land use change will need to be reduced to zero. With regard to emissions of methane (CH4) and nitrous oxide (N2O) from the food system, these will need to be gradually reduced, finally plateauing at approximately 4.7 Gt CO2e in 2050. The boundary in the EAT-Lancet framework is therefore set at 5 Gt CO2e (uncertainty range 4.7–5.4 Gt), including minor emissions of CO2 from biomass burning. Hence, the boundary can be expressed as 5 Gt for CH4, N2O and CO2 from biomass burning, and zero for other fossil energy-related emissions of CO2.
Datasets on the GHG emissions associated with food sold on the Swedish market were taken from Moberg et al. [26]. These datasets account for the average emissions of CO2, CH4, N2O and the hydrochlorofluorocarbon R22 (HCFC-22) directly associated with the production of the foods, following these from cradle to Swedish retail including losses and waste along the chain. The data represent the average emissions between 2011 and 2015. Minor updates were made to the datasets with updated statistics for energy use in Swedish and Dutch greenhouses [27,28,29] and updated fertiliser data for some crops [30]. With regard to olives used for processing to olive oil, data were adjusted to exclude drying of the olives, as this production step is only used for the production of table olives [31]. Additionally, values for extensive beef production systems with suckler cows outside Europe were adjusted to account for grazing all year around with no housing period, based on Cederberg, Meyer and Flysjö [32]. See Supplementary Material for more information.
For GHG emissions caused by the production of foods that are part of the Swedish diet, but are not included in the datasets of Moberg et al. [26], land-specific data were collected in the following order of priority based on availability: data from the World Food LCA Database [33] (available through the Ecoinvent database [34]); peer-reviewed LCA studies [35,36,37,38]; LCA reports [39,40,41].
All data were adjusted to match the methodology in Moberg et al. [26], i.e., to include the same factors for emissions from packaging and transportation, emissions/sequestration to and from soils due to land use, and emissions from land use change for soy-based and oil palm-based products. Additionally, all data were adjusted to account for waste and losses along the production chain, as well as to account for allocation between by-products in multi-output production systems [42,43,44,45,46,47,48,49,50]. Using import statistics for the largest production countries [3,30,51,52,53,54], an average value was established for each food group to represent food sold on the Swedish market.

2.2.2. Land-System Change

For land-system change, we calculated overall cropland use associated with Swedish food consumption, which is the control variable used in the EAT-Lancet framework [1]. The EAT-Lancet boundary for land-system change is based on preventing further expansion of agriculture into forest areas and other natural ecosystems. From this, a limit was established for cropland use for which a minimum cover of forest is maintained and biodiversity and key biomes are conserved at certain intactness levels.
Data for the calculations were primarily retrieved from Moberg et al. [26], using yield levels for plant-based products and feed to calculate the cropland area needed to sustain the average Swedish diet. As for GHG emissions, values for extensive beef production systems with suckler cows outside Europe were adjusted to account for grazing all year around with no housing period [32]. Data for products not included in the datasets of Moberg et al. [26] were primarily taken from the FAOSTAT statistical database [3], or otherwise taken from peer-reviewed LCA studies or LCA reports [38,39,41,47]. For honey, data were obtained from The Swedish Professional Beekeepers [55] and the European Commission [56]. All data were adjusted to match the methodology in Moberg et al. [26], using the additional data for waste, losses, allocation and import statistics, as described in Section 2.2.1.

2.2.3. Nitrogen and Phosphorus Cycling

We calculated the impacts of Swedish food consumption on the nitrogen and phosphorus cycles by using nitrogen and phosphorus application as indicators, as suggested by the EAT-Lancet Commission [1]. The indicator for nitrogen includes addition of ‘new’ reactive nitrogen to agricultural land, i.e., nitrogen from application of mineral fertiliser and from biological fixation by plants. The boundary for nitrogen is based on two aspects: limiting nitrogen concentrations in runoff water to avoid eutrophication, and maintaining a certain level of nitrogen application to feed the global population.
The control variable for phosphorus includes application of phosphorus as mineral fertiliser, for which the EAT-Lancet Commission set a boundary based on maximum inputs that do not lead to eutrophication of terrestrial and marine systems.
Data on mineral fertiliser application rates for nitrogen were obtained from Moberg et al. [26]. For other products not included in Moberg et al. [26], data were collected from other sources in the same order of priority as for climate change. Data on the rate of biological nitrogen fixation by plants were primarily obtained from a study by Lassaletta et al. [57]. For nitrogen fixation in pastures, data were obtained from Cederberg and Nilsson [58]. Data on phosphorus application rates were primarily obtained as site-specific data from national authorities and advisory services [59,60,61,62,63], and otherwise taken from the World Food LCA database [33], peer-reviewed LCA studies [46,64,65,66] or LCA reports [39,41,47,67].
All data were adjusted to match the methodology in Moberg et al. [26], using the additional data for waste, losses, allocation and import statistics, as stated in Section 2.2.1.

2.2.4. Freshwater Use

The use of freshwater to sustain the average Swedish diet was assessed by calculating consumptive blue water use, i.e., groundwater and surface water use in food production, which reduces the flows in watersheds by not flowing back to the same river or aquifer. This is the control variable suggested by the EAT-Lancet Commission [1]. The EAT-Lancet boundary for freshwater use is based on the estimated volume of freshwater that will be available for human use while maintaining a minimum water volume and quality to support environmental functions of river basins.
Freshwater consumption was primarily assessed for agricultural production, i.e., for irrigation of crops and for rearing of animals, as this phase accounts for the majority of the water consumed globally [1]. Inventory data on blue water consumption for the majority of food products were obtained from the WaterStat database [68,69], except for spices, for which data were retrieved from an LCA report [41]. Freshwater consumed as an ingredient in processed products such as bread and canned drinks was also accounted for. These data were primarily obtained from the Swedish National Food Agency [20]. All data were adjusted to match the methodology in Moberg et al. [26], using the additional data for waste, losses, allocation and import statistics, as stated in Section 2.2.1.

2.2.5. Biodiversity Loss

To analyse the impacts of Swedish food consumption on biodiversity loss, extinction rate was used as the control variable, as suggested by the EAT-Lancet Commission [1]. The boundary in the EAT-Lancet framework is based on limiting the rate of extinctions that will not cause irreversible changes to the Earth system.
To calculate the extinction rate from Swedish food consumption, we first estimated potential species loss (PSL) per kg of food, following the methodology in Chaudhary and Brooks [70]. Characterisation factors (CFs) were obtained for potential endemic species loss of five taxa i (mammals, birds, reptiles, amphibians, plants), differentiated by country j, for occupation of 1 m2 of two different land use types related to food production: cropland and pasture. The CFs were then multiplied by the cropland or pasture land area in each country needed to produce 1 kg of the food (including waste, losses and allocation along the chain based on Moberg et al. [26], as stated in Section 2.2.1). From this, the overall PSL per kg of food in each production country j was calculated as:
P S L   p e r   k g   o f   f o o d j = i ( C F i , j , c r o p l a n d × c r o p l a n d   a r e a j   +   C F i , j , p a s t u r e × p a s t u r e   a r e a j )
To calculate the impact per kg of the average foods found on the Swedish market, the country-specific PSL per kg of food was multiplied by the market share of different countries for that food type:
P S L   p e r   k g   o f   f o o d   o n   t h e   S w e d i s h   m a r k e t = j ( P S L   p e r   k g   o f   f o o d j × m a r k e t   s h a r e j ) .
To obtain the overall impact for the total Swedish consumption, the PSL per kg food was multiplied with the total consumption of different foods (i.e., total amount of food available for consumption, see Section 2.1):
P S L   f o r   S w e d i s h f o o d   c o n s u m p t i o n   =   P S L   p e r   k g   o f   f o o d   o n   t h e   S w e d i s h   m a r k e t   × k g   f o o d   c o n s u m e d
In order to benchmark the biodiversity impact to the EAT-Lancet boundary, expressed in extinctions per million species year (E/MSY), it was necessary to convert the PSL, which is the total potential species lost that will eventually take place, to a yearly extinction rate. To do this, the overall biodiversity loss (PSL) for the occupation of land to sustain the average Swedish diet was first allocated over a time horizon of 100 years.
To the best of our knowledge, no convention exists for the choice of such time period. However, expansion of agricultural land has escalated the last century due to an increase in human population and per capita consumption, causing severe destruction of natural habitats [71]. The choice of 100 years as a time horizon could also be argued to be in line with the choice of time period for our chosen climate metric, i.e., GWP100, which is used to characterise the impacts of different GHGs (see Moberg et al. [26]). The limitations of this (arbitrary) choice of time horizon are further discussed in Section 3.4.
Finally, to obtain the E/MSY for Swedish food consumption, the PSL for Swedish food consumption per year was divided by one-millionth of the total number of recognised species (mammals [72], birds [73,74], reptiles [75], amphibians [76], plants [77]) included in the analysis.

2.3. Downscaling of the Global Boundaries

In order to benchmark the environmental impacts of the per capita Swedish diet relative to the global EAT-Lancet boundaries, the boundaries were downscaled to equal per capita boundaries for the global population in 2015 (7.4 billion [3]). This approach attributes equal responsibility for consumption to each global citizen and enables a straightforward and simple illustration of the contribution of the average Swede’s diet to different environmental problems. Thus, this downscaling approach offers insights into how much each global citizen uses of the globally ‘allowed’ emissions and resource use from the food systems, regardless of where the impacts are caused. Using equal per capita boundaries also enables straightforward comparison between consumption in Sweden and other countries, regardless of population. Several other methods could be used to allocate the emissions and resource space of the global boundaries. For example, the boundaries could be allocated based on perspectives of equity of factors, such as historical emissions or resource use. Less developed countries could then be allowed higher levels of emissions or resource extraction, based on their lower contribution to the problem historically and on their ability to pay [78].

2.4. Comparisons of Global and Local Indicators and Boundaries

To identify local environmental concerns potentially not captured by the EAT-Lancet framework, we investigated how the SEOs relate to the EAT-Lancet variables and how well the global variables reflect the environmental sustainability of diets in a local context in Sweden. Based on the analysis, we sought to identify additional indicators relevant for capturing both global and local aspects in an assessment of the environmental sustainability of the Swedish diet.
The SEO framework (Figure 1) derives from The Generation Goal, a policy document which aims to steer Sweden’s environmental policy towards solving environmental issues for the next generation without causing environmental problems outside Sweden’s borders. Based on this, 16 environmental quality objectives reflecting environmental concerns of importance for the Swedish context have been established. To evaluate the progress towards achieving each objective, several indicators with different focal points are used. For example, the SEO Reduced climate impact, which aims at keeping the atmospheric concentration of GHGs on a level that does not threaten the climate system objective, is evaluated with four indicators, including “Atmospheric GHG concentration” and “Consumption-based emissions in Sweden and other countries” (Figure 1) [17].

3. Results and Discussion

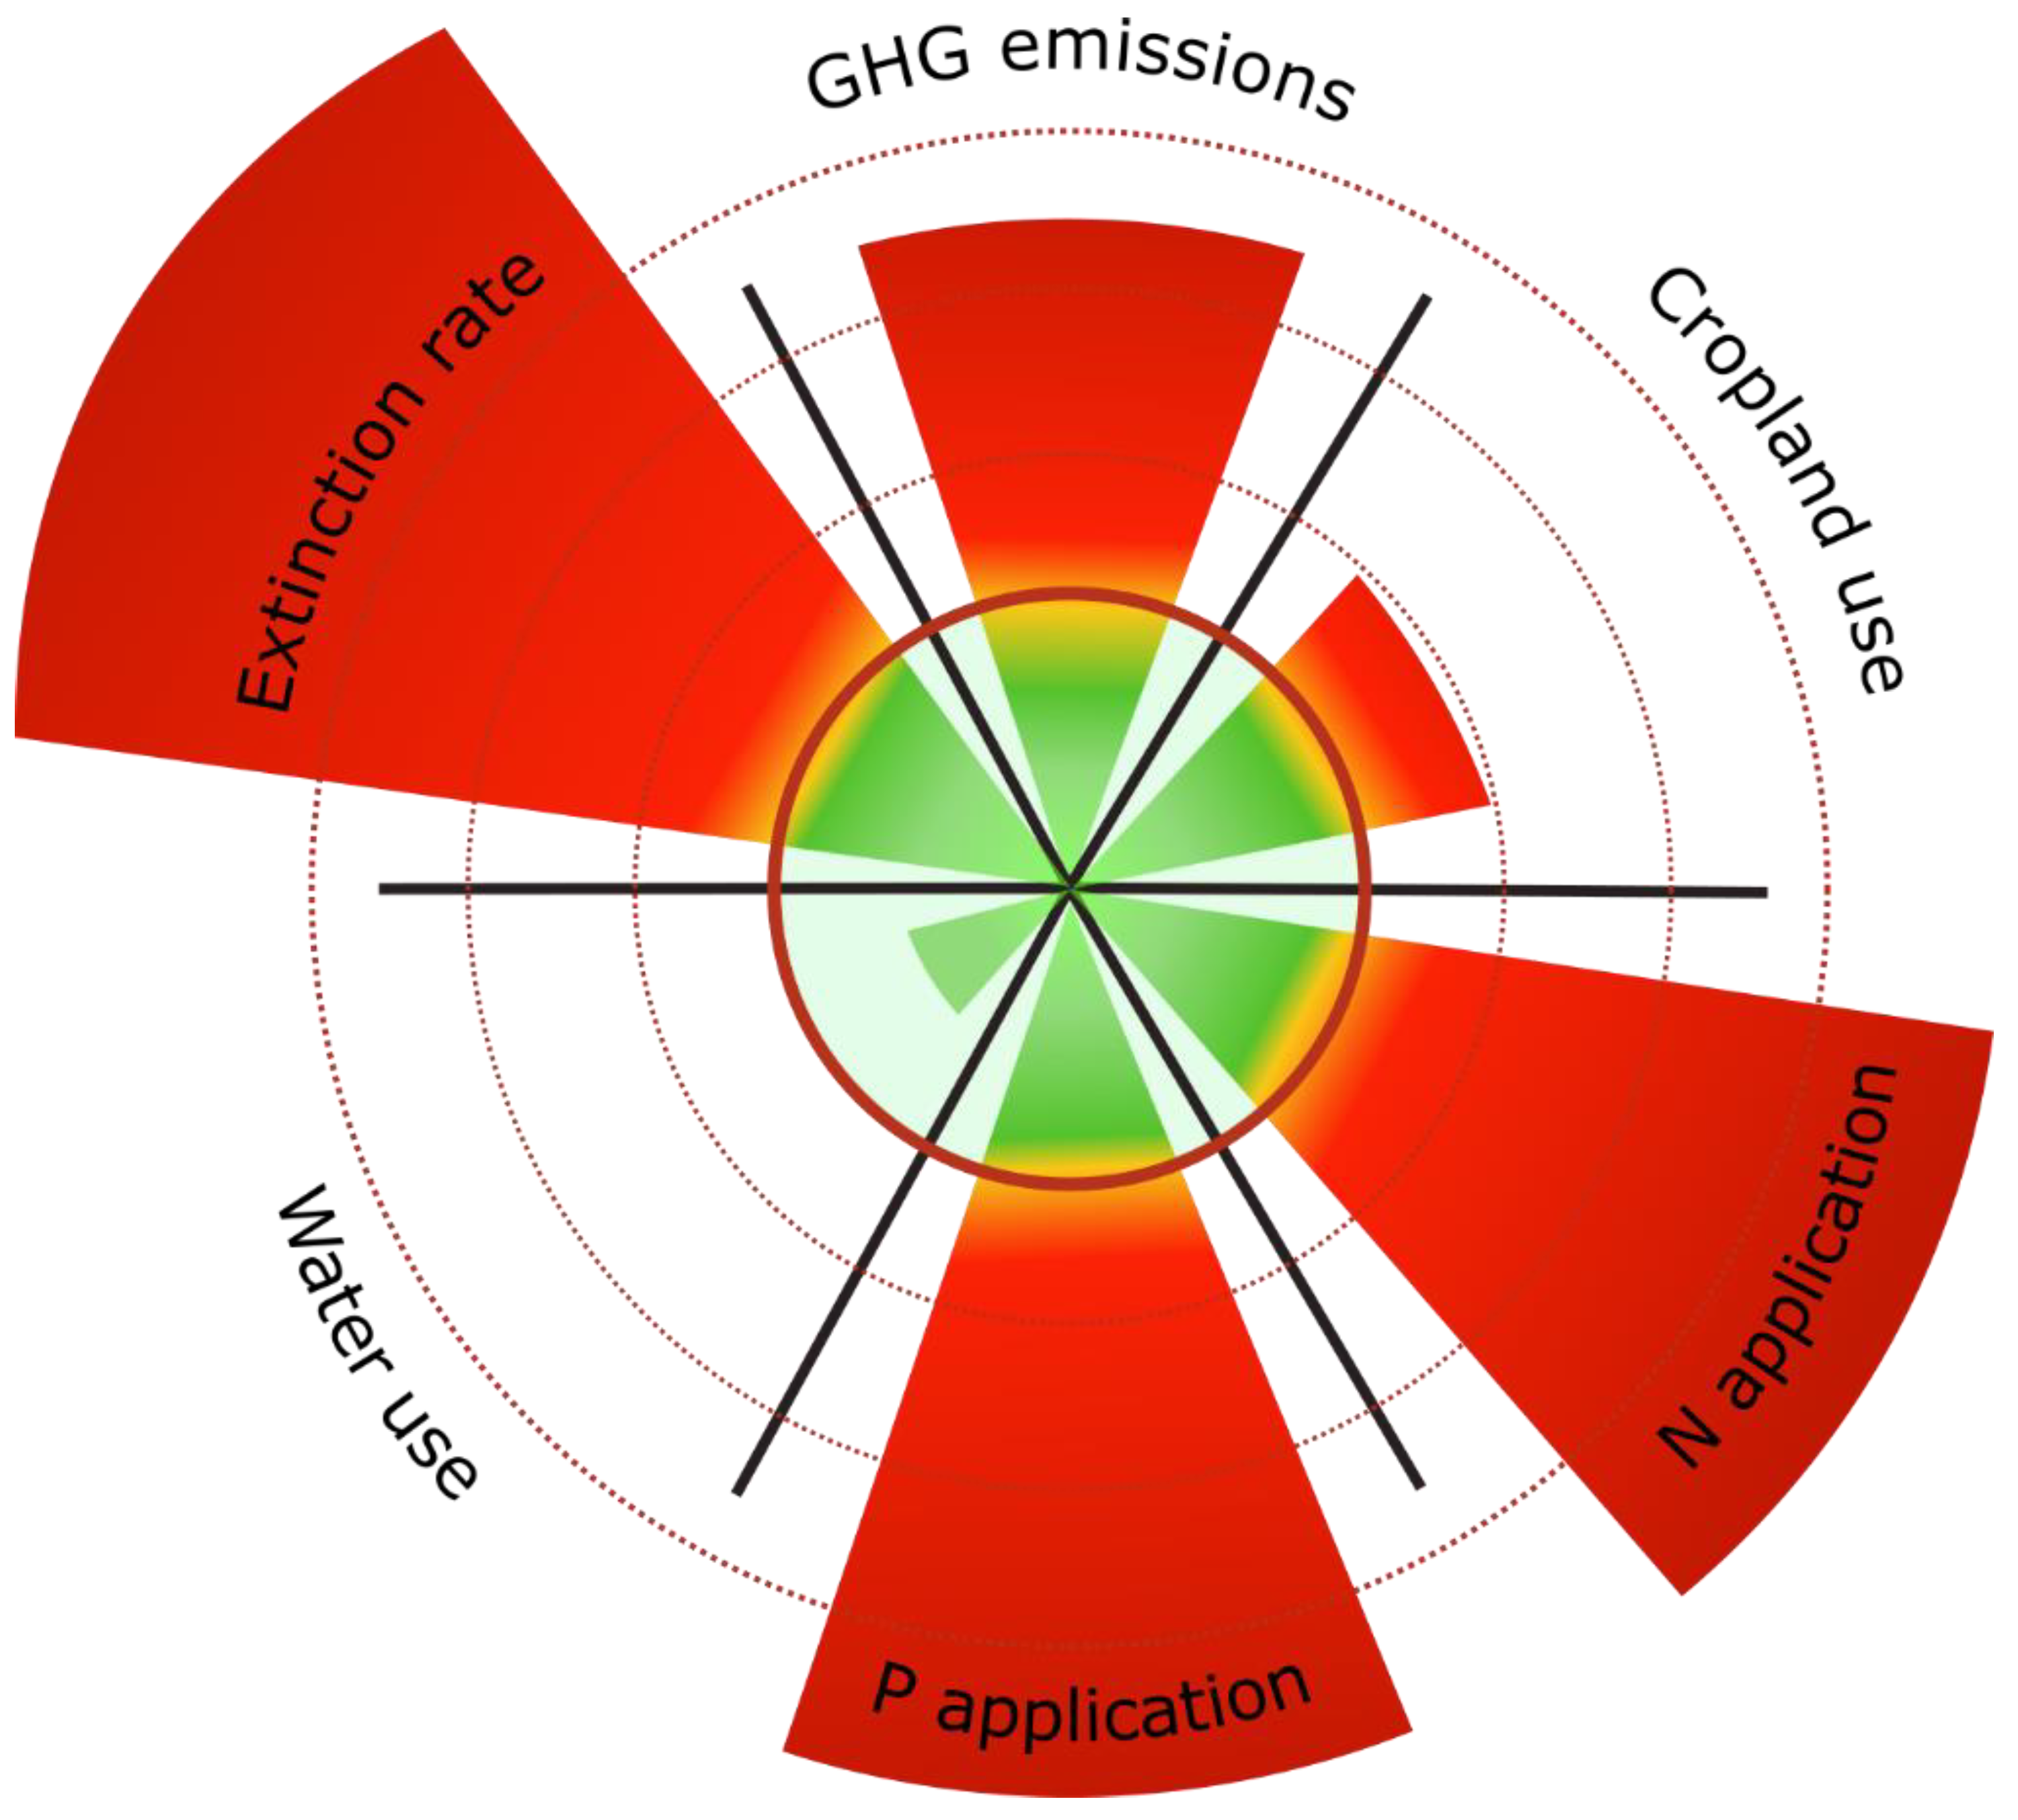
3.1. Benchmarking the Environmental Impacts of the Average Swedish Diet Relative to Global Boundaries

The environmental impacts of the average Swedish diet benchmarked relative to the EAT-Lancet boundaries are illustrated in Figure 2 and presented in absolute numbers in Table 2, together with per capita boundaries.
It was found that the average Swedish diet exceeded the allowed boundary for overall emissions of GHGs by more than three-fold. The boundary was transgressed with regard to emissions of CO2, CH4 and N2O. Of the 2.2 ton CO2e emitted per capita and year, emissions of CO2 accounted for 0.92 ton (~41%), but should be zero. Emissions of CH4 and N2O together accounted for 1.3 ton CO2e (~58% of total emissions), but should be below 0.68 ton CO2e. Emissions of HCFC-22 (0.01 ton CO2e) made up a minor fraction (<1%). Hence, even if emissions of CO2 were reduced to zero, the boundary would still be exceeded by almost two-fold.
With regard to cropland use, the average diet required use of almost twice the cropland area per capita compared to the EAT-Lancet boundary. The results on GHG emissions and land use were similar to those reported by Röös et al. [14], who found that the average Swedish diet far exceeds the sustainable level of climate impact (2.5-fold the limit) and also transgresses the identified sustainable level for land use (by ~1.1-fold the limit).
Concerning application of nutrients, the Swedish diet transgressed the boundary for both nitrogen and phosphorus by more than four-fold. For consumptive water use on the other hand, the Swedish diet performed well below the boundary. For rate of extinctions, the Swedish diet caused six-fold more extinctions than the boundary. It should be emphasised that the results for extinction rate heavily depend on the choice of amortisation period for the extinctions, see discussion in Section 3.4. For all categories where the boundaries were transgressed, the impact was well above the zones of uncertainty (Table 2).
Comparison of our Swedish results against the corresponding results given for the global food consumption as assessed by the EAT-Lancet Commission revealed similar trends, with current (2010) global consumption exceeding the safe operating spaces for climate, phosphorus cycling and biodiversity loss while current freshwater use lay below the boundary. With regard to nitrogen cycling, the 2010 impact was above the boundary but within the range of uncertainty for the boundary. For cropland use, the global food system was still, in 2010, within the boundary but with increasing population up until 2050, the boundary was projected to be transgressed on the global level if measures to reduce waste, improve production or change diets are not imposed. However, as was seen in the results from the present study, the boundary is already exceeded for the Swedish diet.

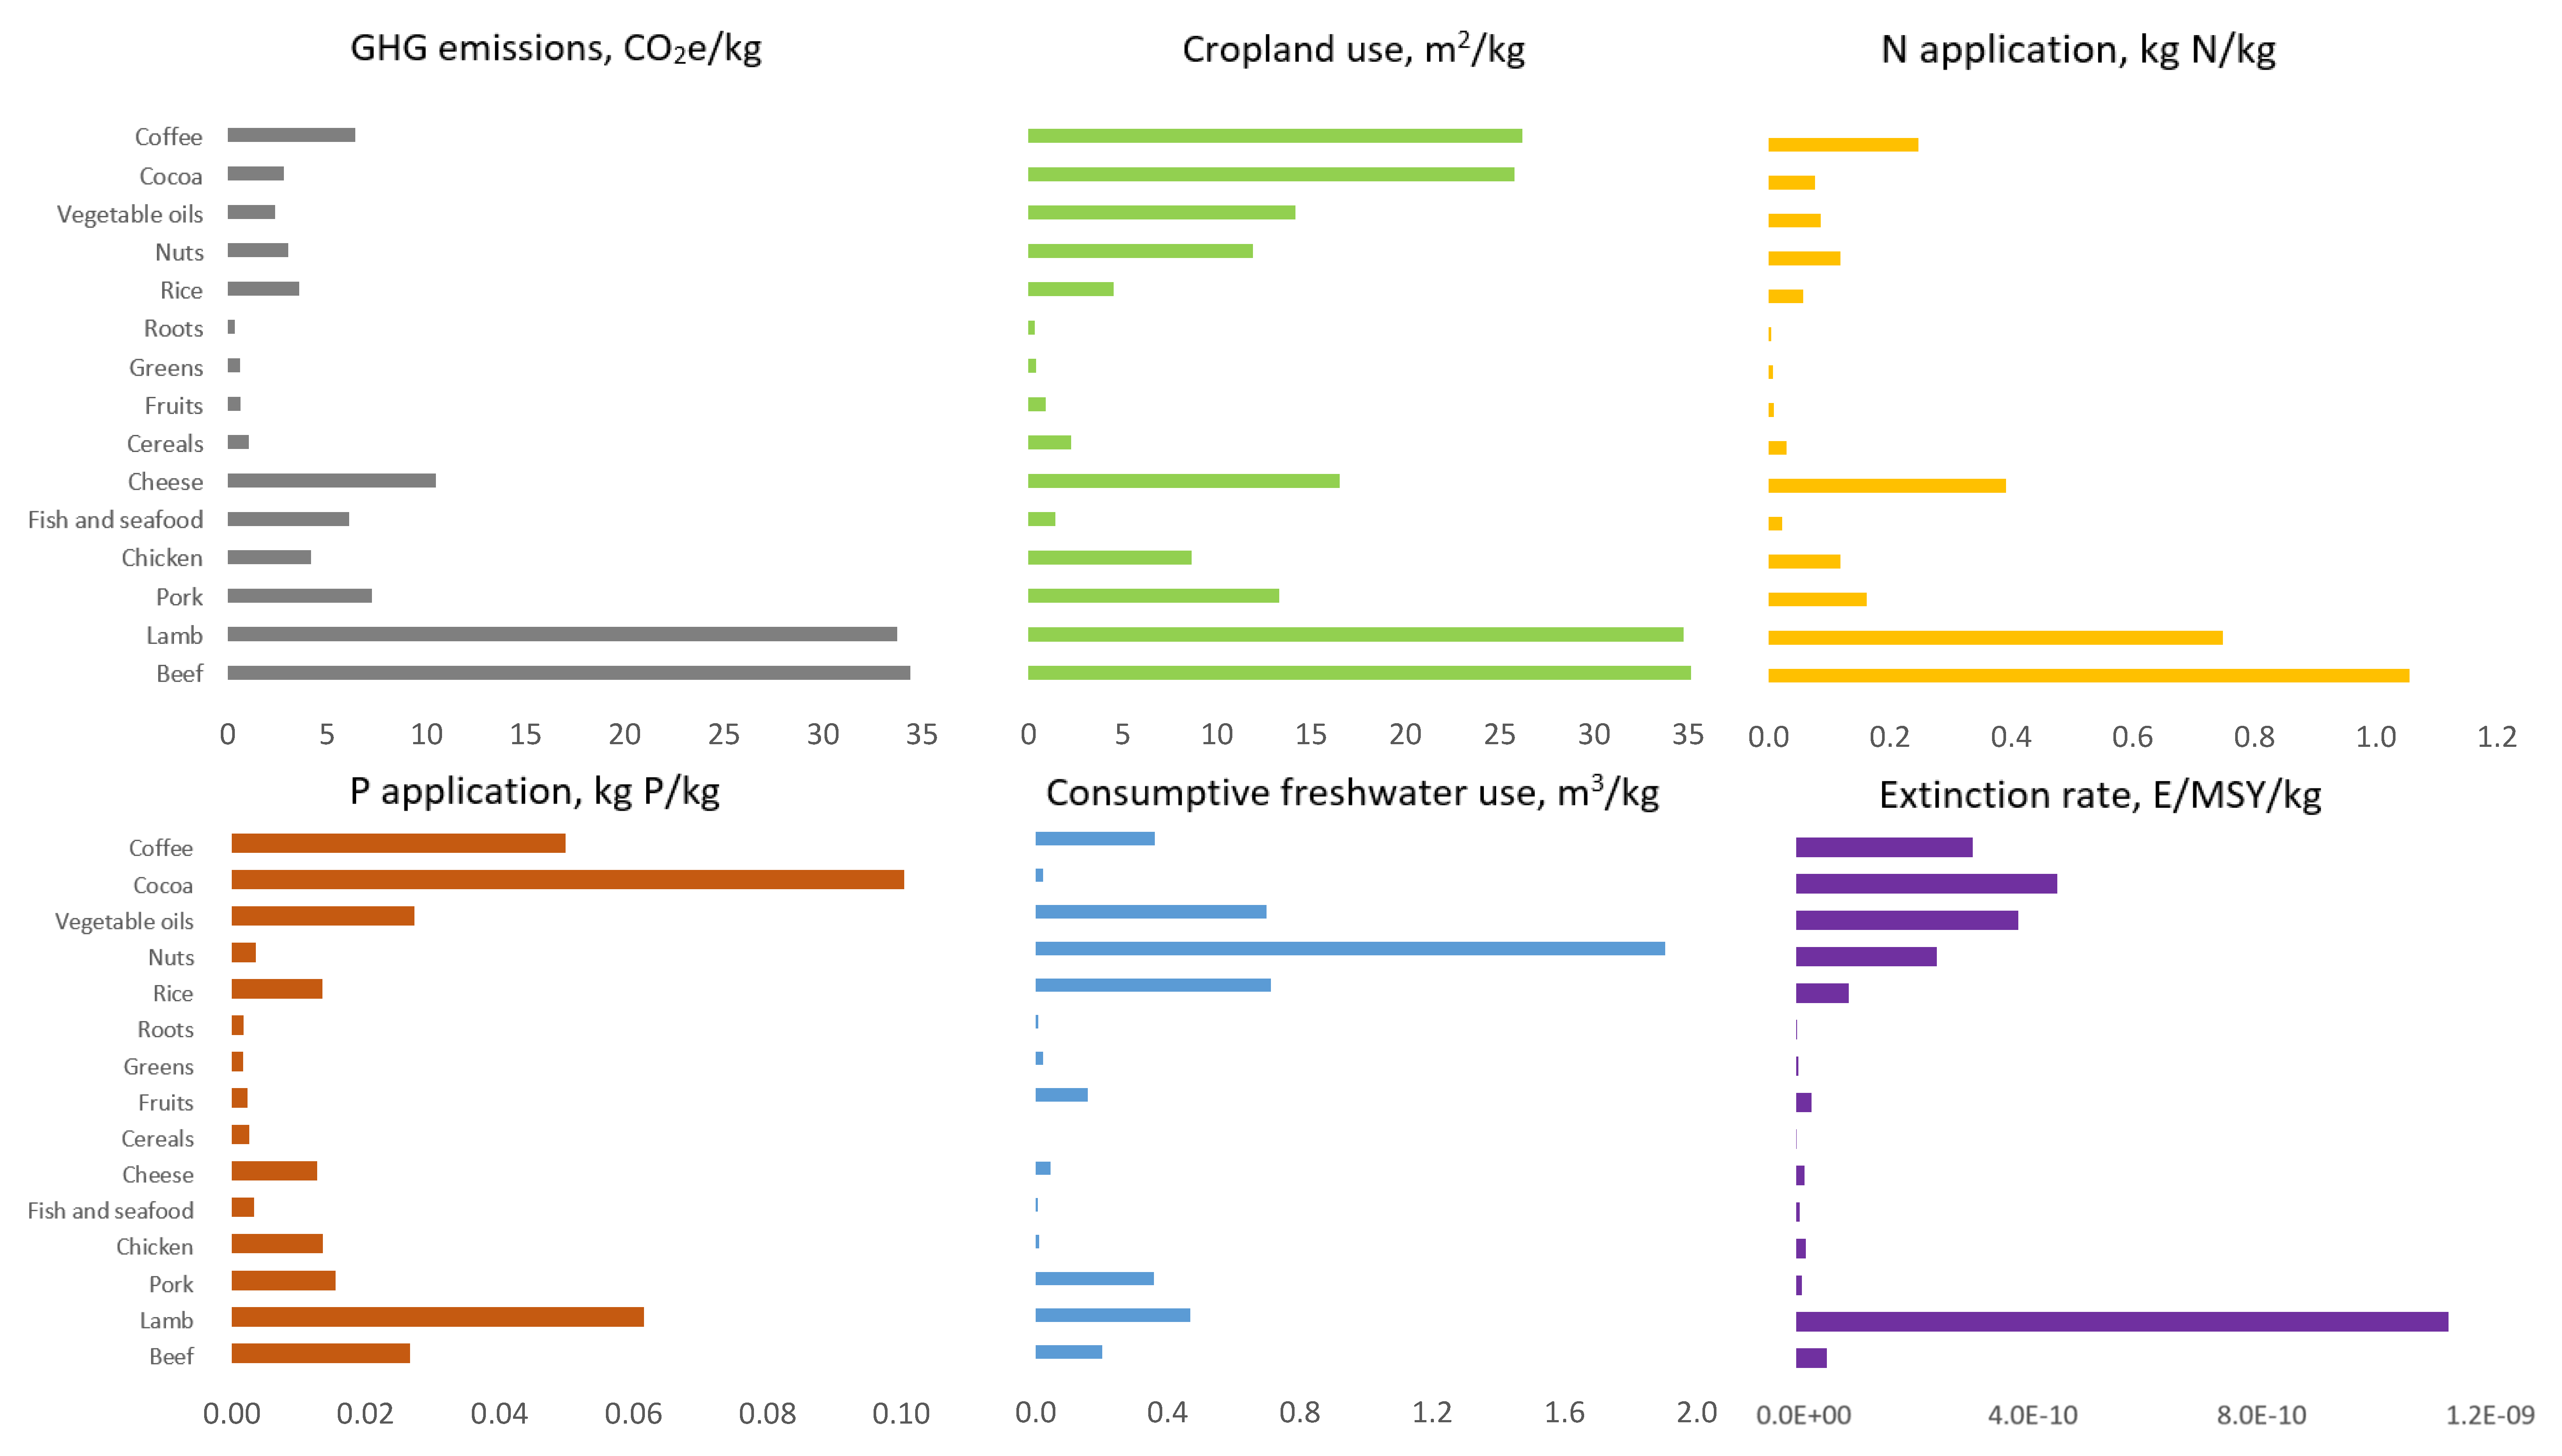
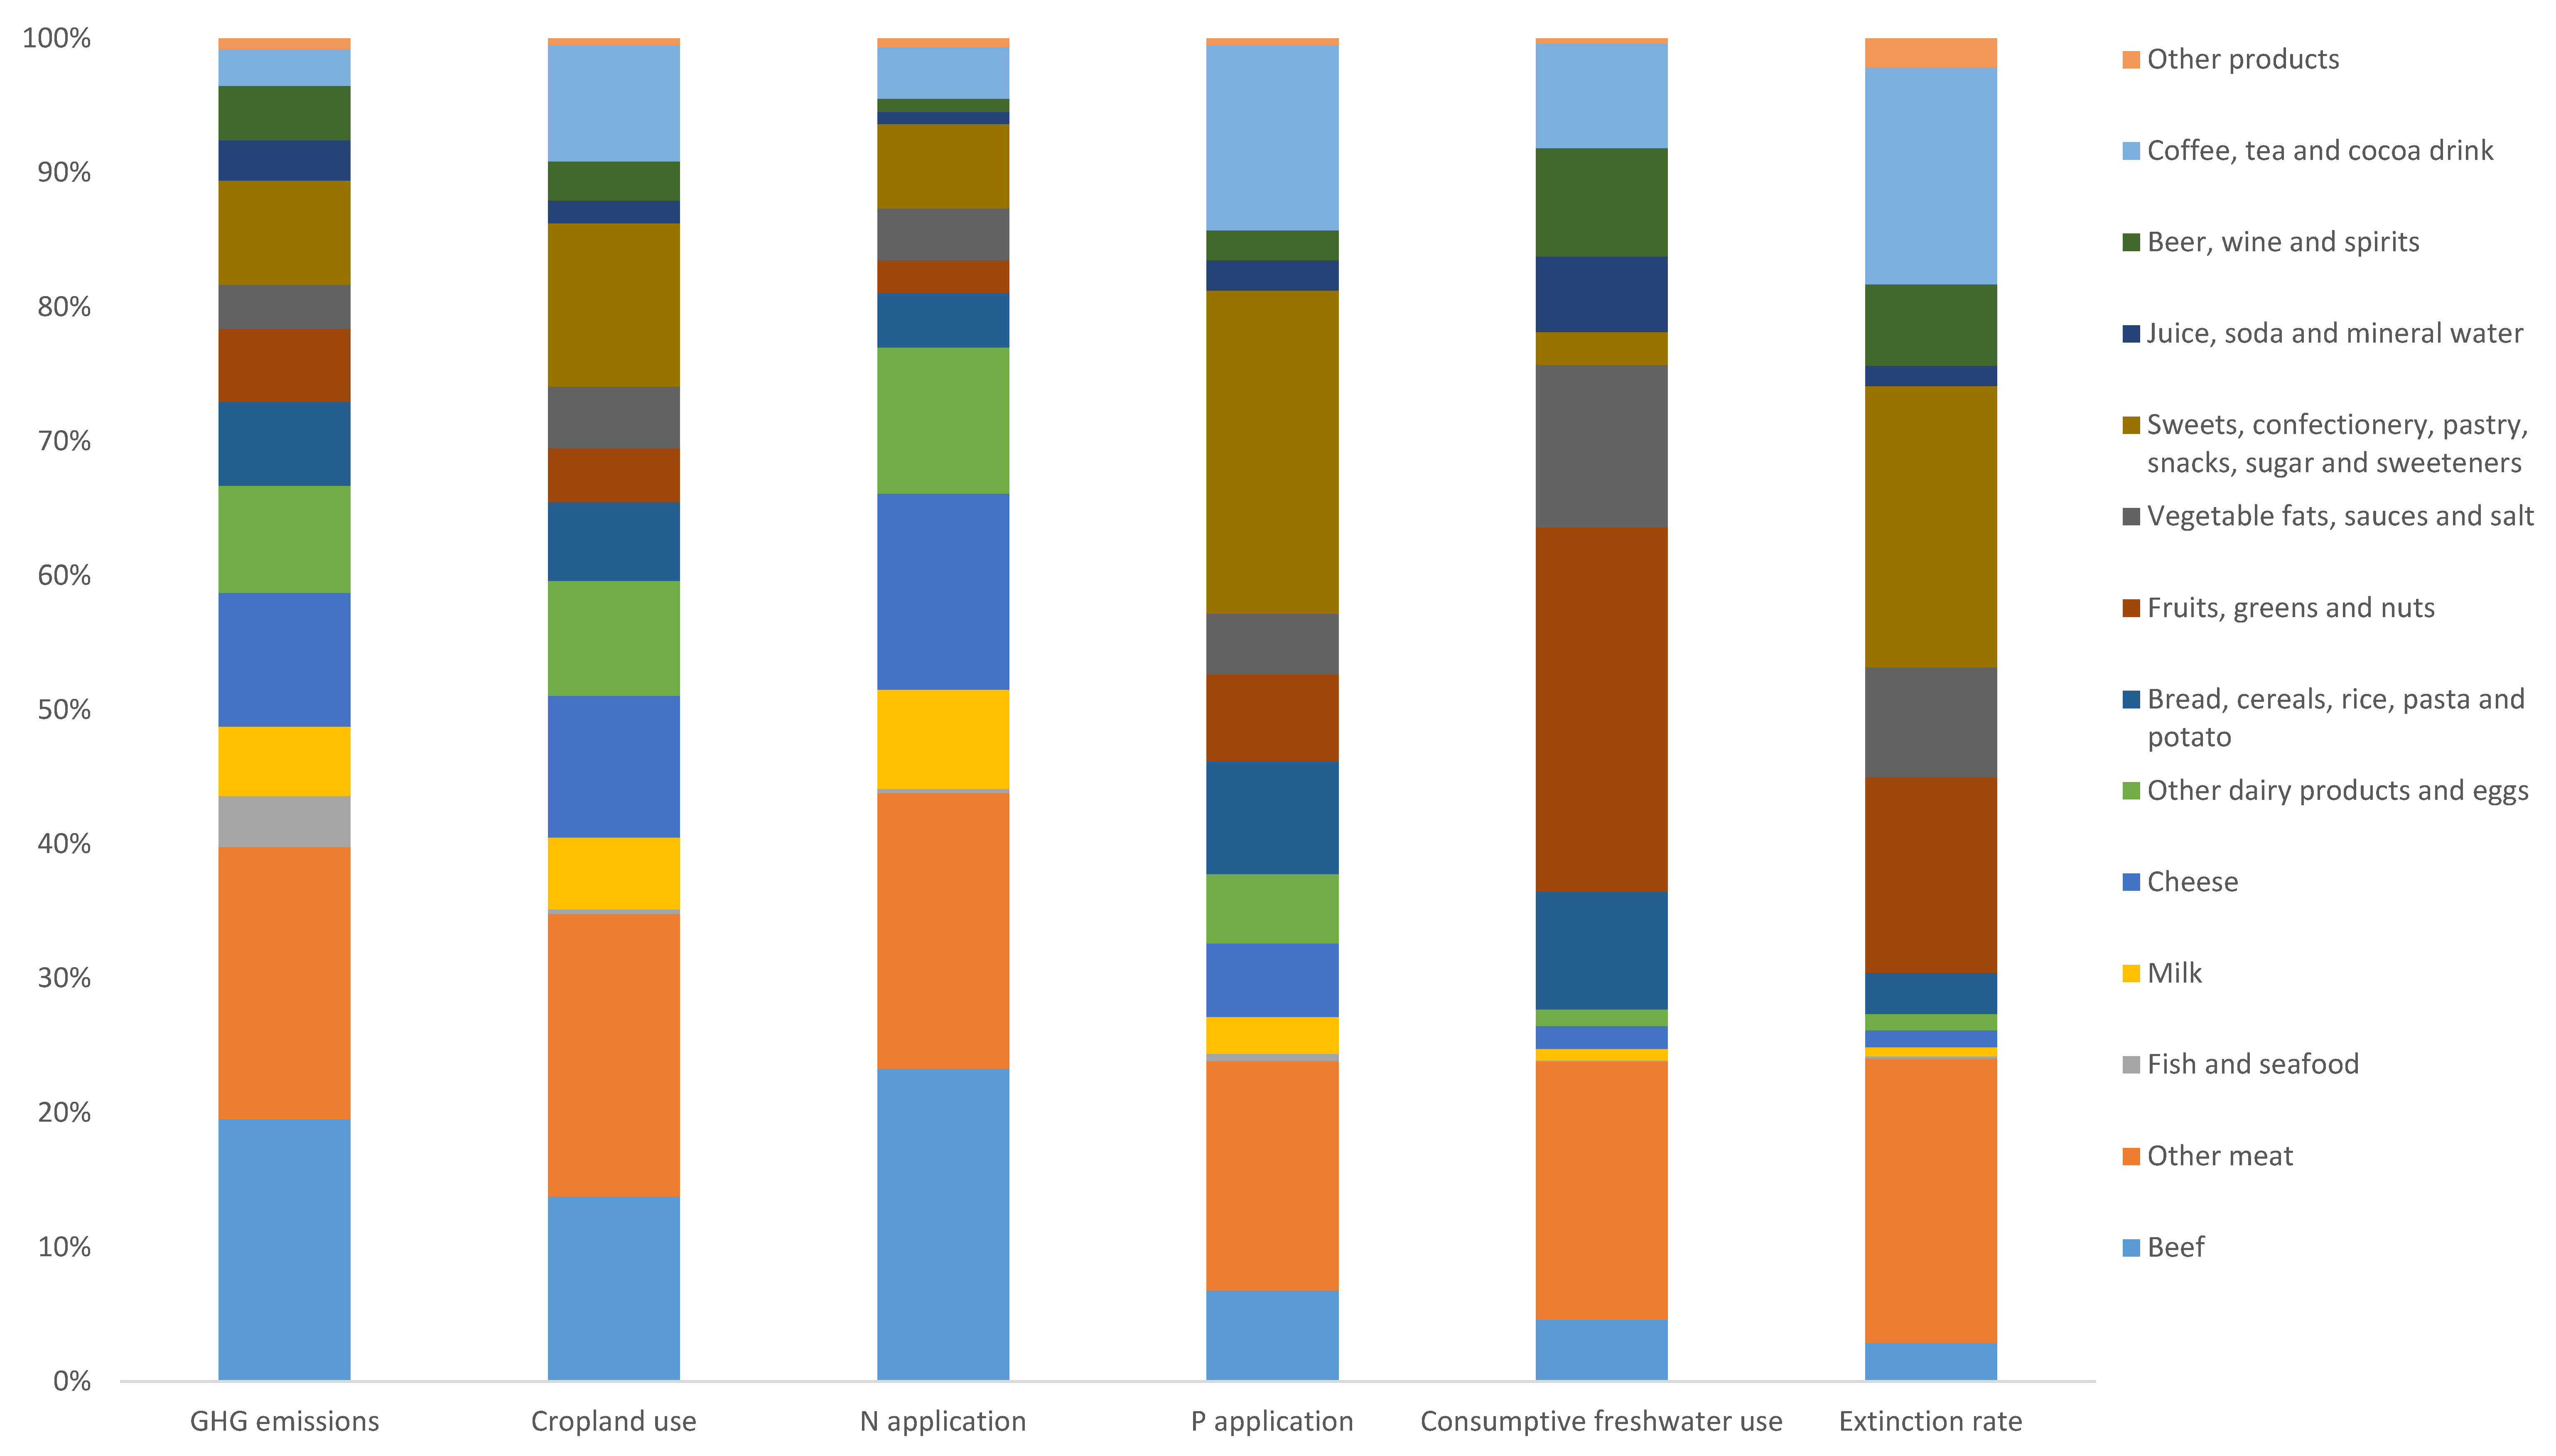
3.2. Relative Contribution of Foods to Environmental Impacts of the Average Swedish Diet

Figure 3 provides an illustration of the environmental impacts broken down per kg of food on the Swedish market and Figure 4 presents the environmental impacts per capita from the overall diet and the relative contribution from different food groups to each impact category. For more detailed results, see Supplementary Material (Tables S2 and S3).
Looking at larger food categories, animal products contributed the largest share of GHG emissions (about 67%), 18% were caused by the consumption of sweets, snacks and drinks (excluding milk) and the remaining 15% were caused by the consumption of other plant-based foods (Figure 4). A similar trend was seen for cropland use per capita and use of nitrogen, with animal products causing the largest impact (60% and 77% respectively). With respect to phosphorus application, animal products contributed 38% of the overall impact. The consumption of sweets, snacks and drinks contributed between 12% and 42% of the overall impacts for the mentioned categories, with the lowest contribution for nitrogen application and the highest for phosphorus. Other plant-based products contributed between 10% and 19% of the overall impact for these categories (lowest for application of nitrogen and highest for phosphorus). Sweets, snacks and drinks as a group, thus made the highest contribution to phosphorus application. This group also made the highest contribution to species extinction rates with 45% of the overall impact whereas other plant-based products and animal products contributed 26% and 27% of the overall impact respectively. Finally, for consumptive water use, the contribution was highest from plant-based products with 48% of the overall impact. Animal products and sweets, snacks and drinks caused similar impacts with 28% and 24% of the overall impact respectively.
The low contribution from many plant-based foods to the environmental impacts of GHG emissions and cropland use (Figure 4) is mainly explained by the relatively low impact per kg for products such as fruits, leafy vegetables, root vegetables and cereals (Figure 3), which is in line with earlier findings [7,48]. Important exceptions with regard to GHG emissions and cropland use per kg were found, e.g., for coffee, cocoa and vegetable oils (especially olive oil), for which cropland use made an important relative contribution to the overall impact (Figure 4).
Sweets, snacks and drinks and the category of other plant-based foods contributed relatively more than animal products to the categories of extinction rate, consumptive water use and phosphorus application (Figure 4). For biodiversity, this was explained by the high impact per kg of food caused by plant-based products such as vegetable oils (especially olive oil), fruits, nuts, coffee, cocoa and rice (Figure 3). Together with high consumption of these foods, this led to important overall impacts (Figure 4). The high biodiversity impact per kg of olive oil, coffee and cocoa was mainly explained by the high cropland use, while for products such as bananas, which are imported from South and Central America, the occupation of land for production in these areas caused high impacts due to high biodiversity loss per occupied m2. In general, animal products such as beef caused low biodiversity impacts per kg despite high land use (Figure 3), due to that most livestock production for the Swedish market take place on relatively biodiversity-poor land (Sweden and Northern Europe). However, the impacts on biodiversity loss would change considerably if production were to take place in countries where the occupation of land causes higher biodiversity loss per occupied m2 in comparison to countries that currently represent the largest shares on the Swedish market, such as Sweden, Ireland, Poland and Germany. An important exception was seen for lamb, which was found to have the highest biodiversity impacts per kg (Figure 3) and also gave a high contribution to the overall impact (Figure 4), despite low consumption rates. This was explained by its high land use (especially pasture), together with the high biodiversity loss from occupation of land for sheep production in New Zealand, a country which represents about 20% of the Swedish market (Supplementary Material).
Freshwater consumption per kg was especially high for nuts (almonds in particular), rice and vegetable oils (Figure 3), as also seen in its relative contribution (Figure 4). High freshwater consumption per kg was also seen for coffee and fruits in comparison with other plant-based products (Figure 3). An important share of the relative contribution was made by fruits and leafy vegetables (Figure 4), because, e.g., a large proportion of fruits are imported from areas where high irrigation levels are often required (see Supplementary Material). With regard to Swedish products, irrigation is generally carried out on a small proportion of Swedish agricultural land, with crops that often require irrigation including root crops, vegetables and fruits [79]. Grains and ley for animal feed and pasture are seldom irrigated, either in Sweden or in other production countries [69,79]. Due to freshwater use for rearing animals [68], animal-based products still had higher consumptive freshwater use per kg than many plant-based products (Figure 3).
With regard to phosphorus application, fertiliser application was generally low per kg for plant-based products except for cocoa, coffee and olive oil (Figure 3), for which the application rates were found to be particularly high. This was also reflected in their relative contribution (Figure 4).
The highest impact on the climate and several other environmental categories per kg of food was found for ruminant meat, i.e., beef and lamb (Figure 3), which is in line with earlier findings [7,48]. This led to important contributions to the impacts of the average diet for all variables, but were especially pronounced for GHG emissions, cropland use and nitrogen application (Figure 4). Pork, chicken, processed meat products and dairy products such as cheese also had high environmental impacts per kg (Figure 3) and made a high contribution to all impacts (Figure 4). The impacts of fish and seafood varied depending on fish species (Supplementary Material), but the relative contribution to the overall impacts was generally low compared with that of other animal products (Figure 4).

3.3. Comparison of Global and Local Indicators and Boundaries

Clear links were identified between the scope of several of the SEOs and the aim of one or more of the boundaries of the Earth system processes in the EAT-Lancet framework (Figure 5). Below, we discuss how the SEOs link to each of the Earth system processes in the EAT-Lancet framework and assess how well the global boundaries reflect environmental sustainability in the local context (Section 3.3.1, Section 3.3.2, Section 3.3.3, Section 3.3.4, Section 3.3.5 and Section 3.3.6). Based on this, we suggest additional indicators that capture both global and local aspects in assessment of the environmental sustainability of the average Swedish diet (Section 3.3.7).

3.3.1. Climate Change

With regard to Reduced climate impact (SEO 1), the scope of the SEO is clearly in line with the aim of the boundary on climate change in the EAT-Lancet framework, as both are based on limiting global warming to a maximum of 2 °C above pre-industrial levels [1,17]. The scope of the boundary in the EAT-Lancet framework has a global perspective and matches one of the indicators used for assessing the SEO, i.e., “Consumption-based emissions in Sweden and other countries”. This indicator measures emissions from Swedish consumption, caused in Sweden and other countries. For this indicator, food-related emissions are reported separately. However, as no specific boundary has been set for food-related emissions for the SEO indicator, it does not permit assessment of the absolute environmental sustainability of the Swedish diet. Such assessment is possible using the EAT-Lancet boundary.

3.3.2. Land-System Change

The scope of A varied agricultural landscape (SEO 13) relates to the Earth system process of Land-system change in the EAT-Lancet framework, as both aim at preserving biodiversity and key biomes [1,17]. Interestingly, while the EAT-Lancet boundary was set to limit further expansion of agricultural land globally, the SEO aims at maintaining current Swedish agricultural land. The rationale for the SEO is the decline in agricultural land in Sweden in recent decades, caused by reduced profitability and rationalisation of agricultural holdings, fewer grazing animals and expansion of settlements and infrastructure on agricultural land, which threatens farmland-associated biodiversity [80]. While the benchmarking of the Swedish diet against the EAT-Lancet boundary serves to emphasise the need for a more land-efficient diet, the SEO offers the insight that agricultural production in Sweden could be maintained or even increase. Considering cropland availability within the country, Sweden could thus become a net exporter of food, i.e., increase food production for both domestic and international markets. The SEO A varied agricultural landscape also includes an indicator for the preservation of pastures, in order to protect important biodiversity-rich biomes such as semi-natural pastures by continued grazing by animals. As the EAT-Lancet focuses on cropland use, this is an important addition to capture local environmental sustainability aspects in Sweden. The SEO also captures quality aspects of land use that are important for productivity, such as soil fertility and drainage, which could be an important complement to the EAT-Lancet framework, although this aspect might fall into the category of social sustainability rather than environmental sustainability.

3.3.3. Nitrogen and Phosphorus Cycling

The SEOs on Zero eutrophication (SEO 7) and A balanced marine environment, flourishing coastal areas and archipelagos (SEO 10) are partly captured by the EAT-Lancet indicators of Nitrogen cycling and Phosphorus cycling, as these focus on limiting emissions of nutrients in order to reduce eutrophication of terrestrial and marine ecosystems [17]. The EAT-Lancet boundaries are related to the amount of new reactive nitrogen and phosphorus added [17] to ecosystems on a global level, i.e., nitrogen from synthetic fertiliser or via fixation in legume crops and mined phosphorus [1]. While ‘added nutrients’ can serve as a proxy of the risk of eutrophication to sustain Swedish food consumption, they do not consider local aspects, including the status of the aquatic recipient of the nutrients. In contrast, the SEOs focus specifically on limiting emissions of nutrients to local recipients such as the Baltic Sea and on the eutrophication status of the recipients. The SEOs thus directly target regional problems of eutrophication, which gives a complementary view of impacts. However, current indicators in the SEOs are designed to measure overall emission loads from Sweden and neighbouring countries and are difficult to link to specific foods and diets. Furthermore, although boundaries have been set which serve to benchmark Sweden’s overall territorial performance, no specific limit has been set for the maximum emissions load from specific sectors such as agriculture. Hence, it cannot be used to benchmark impacts from the diet. Moreover, as the indicators are production-based, they do not cover eutrophication impacts caused in other parts of the world due to Swedish consumption of food. Site-dependent eutrophication models can be used for such assessments, which would also enable estimation of the impacts on local recipients (e.g., [81,82]). However, these models require detailed data on, e.g., emission intensities for specific catchments. Due to limited availability of emissions data and limited traceability of foods to the Swedish market at that level of detail, it is currently very difficult to carry out such an assessment of the whole Swedish diet.

3.3.4. Freshwater Use

The SEOs Flourishing lakes and streams (SEO 8) and Good-quality groundwater (SEO 9) include aspects that are partly captured by the EAT-Lancet Earth system process of Freshwater use. However, while the latter addresses both surface and groundwater, these water sources are considered separately in the two SEOs. Moreover, the SEOs address both the quantity and quality of water sources in a regional perspective, while the EAT-Lancet boundary only focuses on quantity of water used from a global viewpoint, i.e., more from the perspective of water as a resource [1,17]. Quality aspects of water pollution are instead, to a certain extent, covered by the EAT-Lancet variables for nitrogen and phosphorus application. Hence, there is a link between the SEOs Flourishing lakes and streams and Good-quality groundwater and the Earth system processes Nitrogen cycling and Phosphorus cycling (Figure 5). When applying a global perspective on freshwater use, there is a risk of overlooking regional variations in water scarcity. Therefore, an indicator for freshwater use should ideally include aspects of local water availability [16]. The SEOs offer this on a national level for Sweden, but the methodology is currently limited to analysing the overall status of water scarcity of, e.g., groundwater resources, rather than impacts from a diet perspective. Impacts of local scarcity could instead be assessed in a consumption-based analysis where water consumption in a certain area is weighted according to the local availability [83,84]. This would require more detailed inventory data, ideally on catchment level.

3.3.5. Biodiversity Loss

Apart from focusing on limiting excessive nutrient application, the SEO A balanced marine environment, flourishing coastal areas and archipelagos (SEO 10), also has a link to the EAT-Lancet Earth system process of Biodiversity loss, as both aim at conserving marine and terrestrial biodiversity [1,17]. With regard to marine biodiversity, today, about 90% of global fish stocks are estimated to be overfished or fished at capacity [1]. Due to methodological limitations, however, it may be difficult to account for the extinctions of marine species on a global level. On a national level, the SEO includes an indicator that focuses specifically on sustainable fish stocks in Swedish fishing waters, which could be used as a complement to the EAT-Lancet boundary. However, as 75% of the fish and seafood in the average Swedish diet is imported [85], an additional indicator of the status of fish stocks should ideally be used to include the international perspective.
Other SEOs also have clear links to the Earth system process Biodiversity loss in the EAT-Lancet framework, including A varied agricultural landscape (SEO 13), A magnificent mountain landscape (SEO 14) and A rich diversity of plant and animal life (SEO 16). While A rich diversity of plant and animal life focuses on biodiversity conservation in general, A varied agricultural landscape and A magnificent mountain landscape concentrate on conservation of biodiversity in agricultural land and mountain areas, respectively [17]. The methodology used in this paper allows for site-specific evaluation of biodiversity impacts from land use [70,86]. However, the EAT-Lancet boundary for benchmarking the environmental sustainability of biodiversity impacts is set on a global level, with an overall threshold for species extinctions. As biodiversity impacts are primarily manifested on a local or regional level, the SEOs targeting biodiversity impacts can therefore serve as important complements to the global EAT-Lancet boundary. Regarding A magnificent mountain landscape, one of the indicators used in the assessment considers reindeer grazing, as this is a prerequisite for conservation of threatened species in mountain areas of Sweden [17]. However, the indicator does not state a certain threshold for the area or number of animals needed for landscape maintenance, and thus, it is currently difficult to assess this aspect. One of the indicators for A rich diversity of plant and animal life is represented by an index of the state of a threatened species in certain areas in Sweden [17]. Agricultural land is one such area and the indicator could therefore be used to assess local aspects of biodiversity impacts. Similarly, one of the indicators for the SEO A varied agricultural landscape is an index focusing on population trends in birds and butterflies on farmland [17]. However, it is difficult to link the impacts measured with these indices to a diet, and the indicators can currently be used only to assess overall territorial performance of Swedish agriculture.

3.3.6. Additional Aspects not Captured by the EAT-Lancet Framework

Several of the SEOs were found to have no direct link to the Earth system processes in the EAT-Lancet framework. Many are part of the Planetary Boundaries framework [24,25], but, to the best of our knowledge, no boundary related to the food system has been set for these. Nevertheless, they provide important aspects for assessing the environmental sustainability of the Swedish diet. For example, Clean air (SEO 2) relates to environmental impacts of diets due to emissions of nitrogen oxides (NOx) and particles, where agricultural activities contribute 12% and 10%, respectively, of overall emissions in Sweden [87]. Indicators including these pollutants could therefore serve to capture local environmental sustainability issues. Furthermore, it may be relevant to include aspects of Natural acidification only (SEO 3) in environmental assessments of the Swedish diet, as a large proportion of acidifying emissions in Swedish production originates from agriculture. A key issue within agriculture is ammonia emissions from manure management [88], which could therefore be used as an indicator.
Food production is highly relevant for the SEO A non-toxic environment (SEO 4) due to the use of pesticides in agriculture, which can cause damage to humans, animals and ecosystems [17]. This could be included in an environmental assessment of diets through an indicator on the use of pesticides. As the majority of the current Swedish pesticide footprint arises in production abroad, it is important to assess pesticide use in both domestic production and production of imported products, as suggested by Steinbach et al. [89]. However, there is currently limited availability of data on pesticide use for countries outside Europe [89], so better data are needed to increase the accuracy of such assessments.
A protective ozone layer (SEO 5) links to food production by emissions of chlorofluorocarbons (CFCs) and nitrous oxide (N2O). In food production, CFCs arise due to the use of refrigerants in the fishing industry, but these are currently being phased out under an EU directive [90]. This affects the largest fishing countries that export fish to Sweden [26]. The main concern with regard to impacts on ozone depletion from the food system is, instead, N2O emissions. These emissions, which mainly arise due to fertilisation of arable land and manure management, currently have greater depletion potential than any other ozone-depleting gas [91]. Including emissions of N2O as an indicator of stratospheric ozone depletion in assessment of environmentally sustainable diets is therefore important.
The SEOs where no direct connection was found relative to diets and which were not considered relevant for further analysis are presented in the Supplementary Material (Table S1).

3.3.7. Summary of Comparisons of Global and Local Frameworks and Suggested Indicators

Based on the discussion in Section 3.3.1, Section 3.3.2, Section 3.3.3, Section 3.3.4, Section 3.3.5 and Section 3.3.6, Table 3 summarises aspects in the SEO framework that are not covered by the EAT-Lancet framework and lists areas where additional indicators could be developed for assessing these aspects. The indicators for assessing the environmental impacts of the Swedish diet (Table 3) should be consumption-based, i.e., cover impacts both from food produced within Sweden and from imported food. For this, there is a need for better availability of inventory data on resource use and emission intensities on a detailed level and for consideration of environmental aspects in import countries that might not be an issue in Sweden. There is also a need for better traceability of foods entering the Swedish market. Furthermore, indicators should ideally be designed together with specific environmental boundaries, to enable benchmarking at the level of detail for foods or diets.
Another important framework for sustainability assessment is, naturally, the United Nations Sustainability Development Goals (SDGs) [93]. Ridoutt, Hendrie and Noakes [16] investigated the extent to which the current literature on sustainable diets covers the aspects included in the SDG targets. They found 14 different environmental areas of concern in the SDGs: Water scarcity, Natural resource depletion, Urban air quality, Ozone depletion, Human and ecotoxicity, climate change, Marine debris, Marine eutrophication, Freshwater ecosystem quality, Depletion of fish stocks, Deforestation, Land degradation and desertification, Biodiversity loss and Invasive species. All, except Marine debris and Invasive species, are covered in our discussion on the SEO in relation to the EAT-Lancet global boundaries. Developing indicators to relate these two missing aspects to diets is probably challenging, as it is difficult to relate the amount of marine debris and invasive species to specific foods, and hence, diets.

3.4. Study Limitations

The global boundaries, indicators and corresponding inventory data used to assess the environmental impacts of Swedish food consumption in this study are all associated with uncertainties and limitations and thus, there is potential for increasing the accuracy of the results in future research.
As for setting absolute global boundaries for the food system, as highlighted by the EAT-Lancet authors, this is highly challenging since the drivers of Earth system processes are complex and interconnected. In addition, some of the EAT-Lancet boundaries have been criticised for not relating to the original absolute threshold levels of the Planetary Boundaries, i.e., based on absolute biophysical limits for Earth systems within which humanity should operate. The boundaries for GHG emissions and nitrogen application are, instead, based on the unavoidable share of emissions and resources needed to feed the global population. Einarsson, McCrory and Persson [94] pointed out that in order for the boundaries to be scientifically consistent, they should rely upon scientific evidence on the limits of the Earth systems, although this causes trade-offs between reaching environmental targets and maintaining current levels of prosperity.
As for calculating the environmental impacts from the Swedish diet for different indicators, these assessments are also associated with model and data uncertainties. For calculating cropland use, there is, in general, good data availability on yield levels through statistics databases (e.g., [3,18]). Further, as the indicator focuses solely on one variable, i.e., crop productivity levels, calculations are straight-forward. For GHG emissions, on the other hand, important emissions arise in several process steps in the life cycle of various food products. In many of these steps, emissions are variable due to, e.g., climate conditions and soil characteristics. Furthermore, different methodological choices can be made to account for the emissions, which can substantially affect the results, e.g., when accounting for emissions from land use and land use change. Other limitations to assessment of GHG emissions include lack of detailed inventory data for countries outside Europe and lack of data on food groups such as fish and seafood [26]. For example, the GHG emissions for meat on the Swedish market have been found to vary from approximately −40% to +100% [95]. Uncertainties are always important to consider, and even more so when benchmarking against absolute boundaries. Establishing uncertainty ranges for the environmental impacts of the Swedish diet is, hence, an important topic for coming studies, but is associated with major difficulties due to data limitations, e.g., on variations in input data, that become increasingly important as impacts are reduced to fit within the boundaries.
With respect to nitrogen and phosphorus application, site-specific data from statistical databases or advisory services are primarily available for Sweden and other European countries (e.g., [30]), while data for production countries outside Europe mainly are available through databases (e.g., the World Food LCA Database [33]), peer-reviewed studies or LCA reports.
Regarding consumptive freshwater use, inventory data for the present study were primarily obtained from the WaterStat database [68,69]. A limitation in the inventory data is that consumptive water use for crops does not necessarily represent the actual water consumed. Rather, it is based on modelling crop water requirements using inventory data on crop parameters and climate parameters such as temperature and precipitation [69].
Concerning estimation of potential extinctions due to land occupation, there are several uncertainties, deriving from both general modelling and variables, and from data gaps and uncertainties in inventory data, in the methodology developed by Chaudhary and Brooks [70]. There is potential to extend the modelling to include additional land use classes (e.g., by distinguishing between annual and permanent crops) and taxa (e.g., by including invertebrates) [70]. For these indicators, data on uncertainties are largely missing; a gap that needs to be filled in future research. Furthermore, the choice of time horizon for allocation of overall potential species loss had to be chosen arbitrarily, which had large impacts on the results for biodiversity loss. For example, allocating all of the impacts to the same year would, naturally, lead to a 100 times larger impact, which would be 600-fold the EAT-Lancet boundary. Using 20 years would show impacts 30 times the boundary while allocating the species loss over 500 years would cause impacts 1.2-fold the boundary.
Another limitation in the present study relates to the food supply data, which were obtained from the statistical database of the Swedish Board of Agriculture [18]. For some of the product groups, e.g., vegetable fats, sauces, fish and seafood, detailed statistics are lacking and assumptions have to be made based on, e.g., food surveys and reports [87,96].

4. Conclusions

The environmental impacts of the average Swedish diet were shown to exceed the global EAT-Lancet environmental boundaries for GHG emissions, cropland use and application of nitrogen and phosphorus by two- to more than four-fold. For extinction rate, the boundary was exceeded by nearly six-fold. The only environmental category for which the global boundary was not transgressed was freshwater use, where the impact of the diet was well below the limit.
Comparisons of global and local indicators for assessing the environmental sustainability of Swedish food consumption revealed that the EAT-Lancet variables cover many aspects included in the SEOs, such as reducing emissions of GHGs and limiting input of nutrients to ecosystems in order to reduce eutrophication of terrestrial and marine ecosystems. While these global indicators capture the overall impact of diets from a ‘global allowance’ perspective, for many aspects, more fine-resolution indicators are needed to capture actual impacts in the local context. For example, when assessing eutrophication impacts, site-dependent variables should ideally be included, e.g., emissions intensities to specific catchments and nutrient status of recipients.
Aspects in the SEOs not covered by the EAT-Lancet variables include chemical pollution and acidification of freshwater and land. Such aspects could be covered by additional indicators, but absolute boundaries for these are currently lacking.
To enable inclusion of complementary aspects covering the environmental sustainability of diets, there is a need for reliable inventory data on resource use (e.g., for pesticide use) and emission intensities on a detailed level (e.g., for nutrients to assess eutrophication impacts), together with better traceability data for foods imported to the Swedish market.

Supplementary Materials

The following are available online at https://www.mdpi.com/2071-1050/12/4/1407/s1, Table S1: Scope of SEOs where no direct connection was found relative to diets and which were not considered relevant for further analysis, Table S2: Environmental impacts of food products and categories in the Swedish diet, per kg of food and per capita, Table S3: Benchmarking of the Swedish diet relative to the EAT-Lancet boundaries with % of performance relative to each boundary together with lower and higher uncertainty boundaries, Table S4: Overview of modeling choices and food supply data, Inventory data.

Author Contributions

Conceptualization, E.M., H.K.P., P.-A.H., A.W. and E.R.; methodology, E.M., H.K.P. and E.R.; software, E.M.; validation, E.M., H.K.P., A.W., P.-A.H. and E.R.; formal analysis, E.M.; investigation, E.M.; resources, E.M.; data curation, E.M.; writing—original draft preparation, E.M.; writing—review and editing, E.M., H.K.P., A.W., P.-A.H. and E.R.; visualization, E.M.; supervision, P.-A.H. and E.R.; project administration, E.R.; funding acquisition, E.R. All authors have read and agreed to the published version of the manuscript.

Funding

This research was funded by the Swedish Environmental Protection Agency, grant number NV03211-15.

Acknowledgments

We thank the Swedish Environmental Protection Agency for funding this project.

Conflicts of Interest

The authors declare no conflict of interest.

References

  1. Willett, W.; Rockström, J.; Loken, B.; Springmann, M.; Lang, T.; Vermeulen, S.; Garnett, T.; Tilman, D.; DeClerck, F.; Wood, A.; et al. Food in the Anthropocene: The EAT–Lancet Commission on healthy diets from sustainable food systems. Lancet 2019, 393, 447–492. [Google Scholar] [CrossRef]
  2. Vermeulen, S.J.; Campbell, B.M.; Ingram, J.S. Climate change and food systems. Annu. Rev. Environ. Resour. 2012, 37, 195. [Google Scholar] [CrossRef] [Green Version]
  3. FAO. FAOSTAT Statistical Database; Food and Agricultural Organization of the United Nations: Rome, Italy, 2019. [Google Scholar]
  4. Cederberg, C.; Persson, U.M.; Schmidt, S.; Hedenus, F.; Woodl, R. Beyond the borders–burdens of Swedish food consumption due to agrochemicals, greenhouse gases and land-use change. J. Clean. Prod. 2019, 214, 644–652. [Google Scholar] [CrossRef]
  5. Burlingame, B.; Dernini, S. Sustainable Diets and Biodiversity: Directions and Solutions for Policy, Research and Action. In Proceedings of the International Scientific Symposium, Biodiversity and Sustainable Diets United Against Hunger, FAO Headquarters, Rome, Italy, 3–5 November 2010; Food and Agriculture Organization of the United Nations (FAO): Rome, Italy, 2012. [Google Scholar]
  6. Chai, B.C.; van der Voort, J.R.; Grofelnik, K.; Eliasdottir, H.G.; Klöss, I.; Perez-Cueto, F.J.A. Which Diet Has the Least Environmental Impact on Our Planet? A Systematic Review of Vegan, Vegetarian and Omnivorous Diets. Sustainability 2019, 11, 4110. [Google Scholar] [CrossRef] [Green Version]
  7. Clark, M.; Tilman, D. Comparative analysis of environmental impacts of agricultural production systems, agricultural input efficiency, and food choice. Environ. Res. Lett. 2017, 12, 064016. [Google Scholar] [CrossRef]
  8. Springmann, M.; Clark, M.; Mason-D’Croz, D.; Wiebe, K.; Bodirsky, B.L.; Lassaletta, L.; de Vries, W.; Vermeulen, S.J.; Herrero, M.; Carlson, K.M.; et al. Options for keeping the food system within environmental limits. Nature 2018, 562, 519–525. [Google Scholar] [CrossRef]
  9. Hallström, E.; Carlsson-Kanyama, A.; Börjesson, P. Environmental impact of dietary change: A systematic review. J. Clean. Prod. 2015, 91, 1–11. [Google Scholar] [CrossRef]
  10. Martin, M.; Brandão, M. Evaluating the Environmental Consequences of Swedish Food Consumption and Dietary Choices. Sustainability 2017, 9, 2227. [Google Scholar] [CrossRef] [Green Version]
  11. Swedish Board of Agriculture. Konsumtion och Förbrukning av Kött 2019. Available online: http://www.jordbruksverket.se/amnesomraden/konsument/livsmedelskonsumtionisiffror/kottkonsumtionen.4.465e4964142dbfe44705198.html (accessed on 4 October 2019).
  12. Swedish Board of Agriculture. Marknadsrapport Mjölk och Mejeriprodukter—Utvecklingen Till och Med 2018; Swedish Board of Agriculture: Jönköping, Sweden, 2019. [Google Scholar]
  13. WWF. One Planet Plate 2019—Kriterier och Bakgrund; WWF: Stockholm, Sweden, 2019. [Google Scholar]
  14. Röös, E.; Karlsson, H.; Witthöft, C.; Sundberg, C. Evaluating the sustainability of diets–combining environmental and nutritional aspects. Environ. Sci. Policy 2015, 47, 157–166. [Google Scholar] [CrossRef]
  15. Jones, A.D.; Hoey, L.; Blesh, J.; Miller, L.; Green, A.; Shapiro, L.F. A systematic review of the measurement of sustainable diets. Adv. Nutr. 2016, 7, 641–664. [Google Scholar] [CrossRef] [Green Version]
  16. Ridoutt, B.G.; Hendrie, G.A.; Noakes, M. Dietary strategies to reduce environmental impact: A critical review of the evidence base. Adv. Nutr. 2017, 8, 933–946. [Google Scholar] [CrossRef] [PubMed] [Green Version]
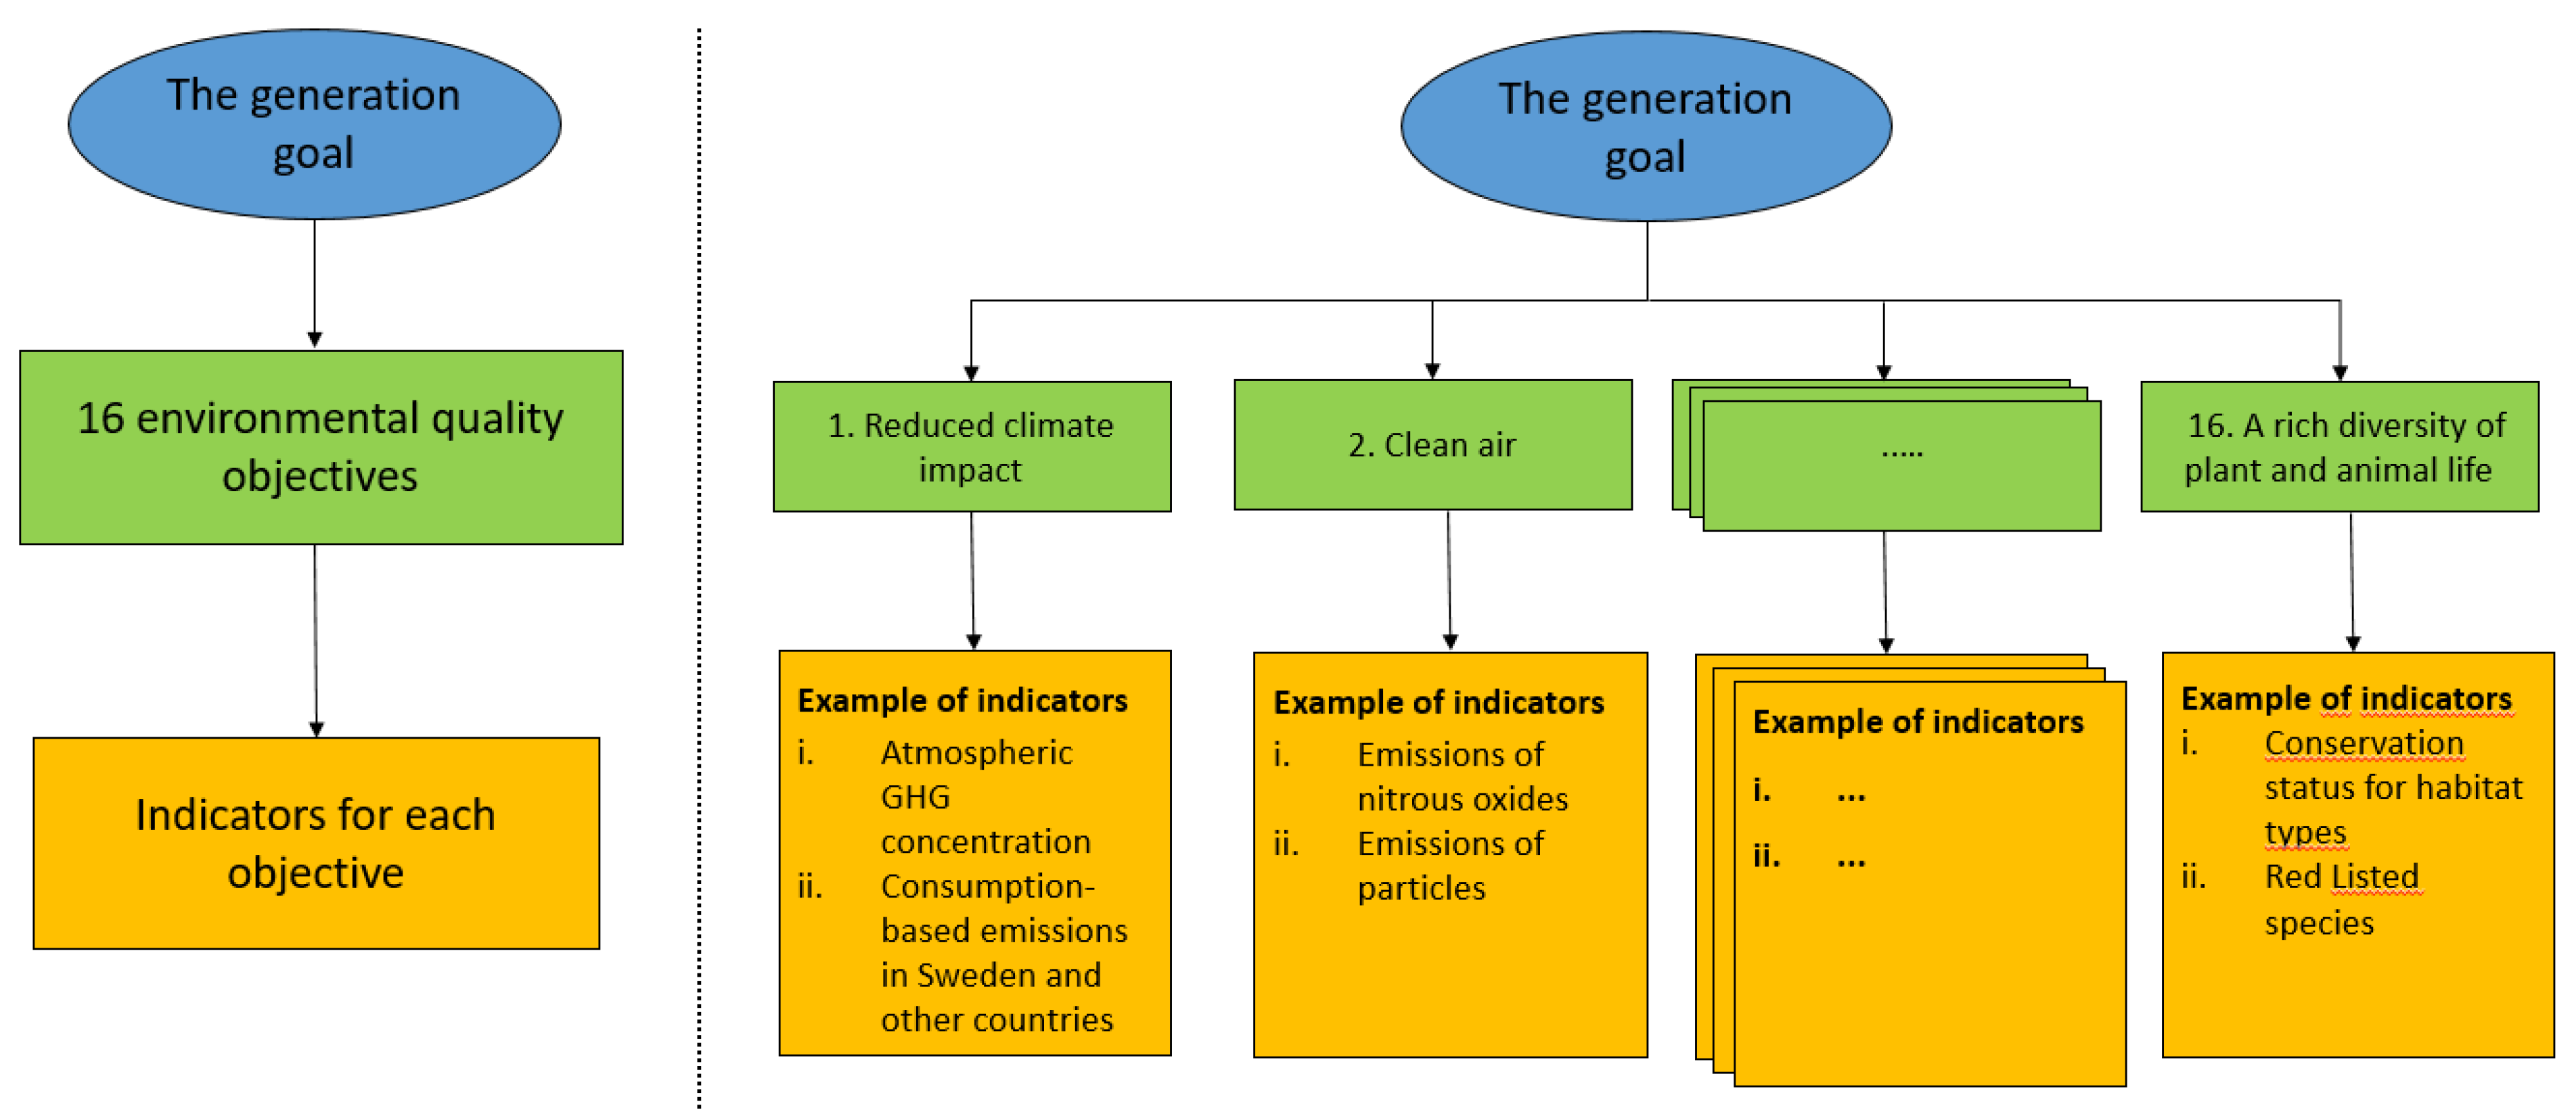
  17. Sveriges Miljömål. Sveriges Miljömål. 2019. Available online: http://www.sverigesmiljomal.se/ (accessed on 4 November 2019).
  18. SBA. Statistical Database; Swedish Board of Agriculture: Jönköping, Sweden, 2019. [Google Scholar]
  19. Eidstedt, M.; Swedish Board of Agriculture, Jönköping, Sweden. Personal communication, 2018.
  20. Swedish National Food Agency. The Food Database; Swedish National Food Agency: Uppsala, Sweden, 2019; Available online: http://www7.slv.se/SokNaringsinnehall/ (accessed on 10 May 2019).
  21. Notarnicola, B.; Tassielli, G.; Nicoletti, G. Life cycle assessment (LCA) of wine production. Environ. Friendly Food Process. 2003, 306, 326. [Google Scholar]
  22. Garnett, T. The Alcohol We Drink and Its Contribution to the UK’s Greenhouse Gas Emissions: A Discussion Paper; Centre for Environmental Strategy, University of Surrey: London, UK, 2007. [Google Scholar]
  23. Röös, E. Mat-Klimat-Listan; Department of Energy and Technology, Swedish University of Agricultural Sciences: Uppsala, Sweden, 2014. [Google Scholar]
  24. Steffen, W.; Richardson, K.; Rockström, J.; Cornell, S.E.; Fetzer, I.; Bennett, E.M.; Biggs, R.; Carpenter, S.R.; de Vries, W.; de Wit, C.A.; et al. Planetary boundaries: Guiding human development on a changing planet. Science 2015, 347, 1259855. [Google Scholar] [CrossRef] [PubMed] [Green Version]
  25. Rockström, J.; Steffen, W.; Noone, K.; Persson, Å.; Chapin, S., III; Lambin, E.F.; Lenton, T.M.; Scheffer, M.; Folke, C.; Schellnhuber, H.J.; et al. A safe operating space for humanity. Nature 2009, 461, 472–475. [Google Scholar] [CrossRef]
  26. Moberg, E.; Andersson, M.W.; Säll, S.; Hansson, P.-A.; Röös, E. Determining the climate impact of food for use in a climate tax—Design of a consistent and transparent model. Int. J. Life Cycle Assess. 2019, 24, 1715–1728. [Google Scholar] [CrossRef] [Green Version]
  27. Swedish Board of Agriculture. Energianvändning i Växthus 2017. Tomat, Gurka och Prydnadsväxter. Greenhouse Energy Use in 2017; Swedish Board of Agriculture: Jönköping, Sweden, 2018. [Google Scholar]
  28. Velden, N.; Smit, P. Energiemonitor van de Nederlandse Glastuinbouw 2016; LEI Wageningen UR (University & Research Centre): Wageningen, The Netherlands, 2017. [Google Scholar]
  29. Velden, N.; Smit, P. Energiemonitor van de Nederlandse Glastuinbouw 2017; LEI Wageningen UR (University & Research Centre): Wageningen, The Netherlands, 2018. [Google Scholar]
  30. Statistics Sweden. Statistical Database; Statistics Sweden: Stockholm, Sweden, 2019. [Google Scholar]
  31. Kailis, S.; Harris, D.J. Producing Table Olives; Landlinks Press: Collingwood, Australia, 2007. [Google Scholar]
  32. Cederberg, C.; Meyer, D.; Flysjö, A. Life Cycle Inventory of Greenhouse Gas Emissions and Use of Land and Energy in Brazilian Beef Production; SIK Institutet för Livsmedel och Bioteknik: Gothenburg, Sweden, 2009. [Google Scholar]
  33. Nemecek, T.; Bengoa, X.; Lansche, J.; Mouron, P.; Riedener, E.; Rossi, V.; Humbert, S. World Food LCA Database: Methodological Guidelines for the Life Cycle Inventory of Agricultural Products. Version 3.0.; World Food LCA Database (WFLDB), Quantis and Agroscope: Lausanne and Zurich, Switzerland, 2015. [Google Scholar]
  34. Ecoinvent Centre. Ecoinvent Database Version 3.5.; Swiss Centre for Life Cycle Inventories: Dübendorf, Switzerland, 2018. [Google Scholar]
  35. Ledgard, S.F.; Lieffering, M.; Coup, D.; O’Brien, B. Carbon footprinting of New Zealand lamb from the perspective of an exporting nation. Anim. Front. 2011, 1, 40–45. [Google Scholar] [CrossRef]
  36. Kendall, A.; Yuan, J.; Brodt, S.B. Carbon footprint and air emissions inventories for US honey production: Case studies. Int. J. Life Cycle Assess. 2013, 18, 392–400. [Google Scholar] [CrossRef]
  37. Hallström, E.; Håkansson, N.; Åkesson, A.; Wolk, A.; Sonesson, U. Climate impact of alcohol consumption in Sweden. J. Clean. Prod. 2018, 201, 287–294. [Google Scholar] [CrossRef]
  38. O’Brien, D.; Bohan, A.; McHugh, N.; Shalloo, L. A life cycle assessment of the effect of intensification on the environmental impacts and resource use of grass-based sheep farming. Agric. Syst. 2016, 148, 95–104. [Google Scholar] [CrossRef]
  39. Wallman, M.; Cederberg, C.; Sonesson, U. Life Cycle Assessment of Swedish Lamb Production; SIK Rapport; SIK Institutet för Livsmedel och Bioteknik: Gothenburg, Sweden, 2011. [Google Scholar]
  40. Nilsson, K.; Sund, V.; Florén, B. The Environmental Impact of the Consumption of Sweets, Crisps and Soft Drinks; Nordic Council of Ministers: Copenhagen, Denmark, 2011. [Google Scholar]
  41. Landqvist, B.; Woodhouse, A. Klimatavtryck av Rotfrukter, Grönsaker och Kryddor: Analys av 10 Produkter Odlade i Sverige; SIK Rapport; SIK Institutet för Livsmedel och Bioteknik: Gothenburg, Sweden, 2014. [Google Scholar]
  42. Chapagain, A.K.; Hoekstra, A.Y. The water footprint of coffee and tea consumption in the Netherlands. Ecol. Econ. 2007, 64, 109–118. [Google Scholar] [CrossRef]
  43. Alsterberg, E. Animaliska Restprodukter vid Köttproduktion: Effektiv Användning och Livsmedelspotential; Teknisk-naturvetenskaplig fakultet, UTH-enheten, Uppsala University: Uppsala, Sweden, 2012. [Google Scholar]
  44. Clune, S.; Crossin, E.; Verghese, K. Systematic review of greenhouse gas emissions for different fresh food categories. J. Clean. Prod. 2017, 140, 766–783. [Google Scholar] [CrossRef] [Green Version]
  45. Gustavsson, J.; Cederberg, C.; Sonesson, U. Global Food Losses and Food Waste; FAO: Rome, Italy, 2011. [Google Scholar]
  46. Nilsson, K.; Flysjö, A.; Davis, J.; Sim, S.; Unger, N.; Bell, S. Comparative life cycle assessment of margarine and butter consumed in the UK, Germany and France. Int. J. Life Cycle Assess. 2010, 15, 916–926. [Google Scholar] [CrossRef]
  47. Flysjö, A.; Cederberg, C.; Strid, I. LCA-Databas för Konventionella Fodermedel: Miljöpåverkan i Samband Med Produktion; SIK Institutet för Livsmedel och Bioteknik: Uppsala and Gothenburg, Sweden, 2008. [Google Scholar]
  48. Poore, J.; Nemecek, T. Reducing food’s environmental impacts through producers and consumers. Science 2018, 360, 987–992. [Google Scholar] [CrossRef] [PubMed] [Green Version]
  49. FAO. Definition and Classification of Commodities, 5. Nuts and Derived Products; Food and Agricultural Organization of the United Nations: Rome, Italy, 1994. [Google Scholar]
  50. FAO. Definition and Classification of Commodities, 6. Oil-Bearing Crops and Derived Products; Food and Agricultural Organization of the United Nations: Rome, Italy, 1994. [Google Scholar]
  51. Swedish Board of Agriculture. Marknadsrapport FÅR & LAMM—Utvecklingen Till och Med 2018; Swedish Board of Agriculture: Jönköping, Sweden, 2019. [Google Scholar]
  52. Swedish Board of Agriculture. Marknadsöversikt Potatis Till Mat och Stärkelseproduktion; Fredagsmys och Husmanskost, Swedish Board of Agriculture: Jönköping, Sweden, 2015. [Google Scholar]
  53. Swedish Board of Agriculture. Bli Biodlare—Utveckla Ditt Företag; Swedish Board of Agriculture: Jönköping, Sweden, 2011. [Google Scholar]
  54. Swedish Alcohol Monopoly. Swedish Alcohol Monopoly Sales Statistics. 2019. Available online: https://www.systembolaget.se/om-systembolaget/om-foretaget/forsaljningsstatistik/ (accessed on 4 November 2019).
  55. Alfsdotter, A.-S.; (Swedish Beekeepers Association, Skänninge, Sweden). Personal communication, 2019.
  56. European Commission. EU Beekeeping Sector. National Apiculture Programmes 2020–2022; European Commission: Brussels, Belgium; Available online: https://ec.europa.eu/info/sites/info/files/food-farming-fisheries/animals_and_animal_products/presentations/national-apiculture-programmes_en.pdf (accessed on 4 November 2019).
  57. Lassaletta, L.; Billen, G.; Grizzetti, B.; Anglade, J.; Garnier, J. 50 year trends in nitrogen use efficiency of world cropping systems: The relationship between yield and nitrogen input to cropland. Environ. Res. Lett. 2014, 9, 105011. [Google Scholar] [CrossRef]
  58. Cederberg, C.; Nilsson, B. Livscykelanalys (LCA) av Ekologisk Nötköttsproduktion i Ranchdrift; SIK Institutet för Livsmedel och Bioteknik: Gothenburg, Sweden, 2004. [Google Scholar]
  59. Ministerio de Medio Ambiente y Medio Rural y Marino. Guía Práctica de la Fertilización Racional de los Cultivos en España. Abonado de los Principales Cultivos en España; Ministerio de Medio Ambiente y Medio Rural y Marino, Gobierno de España: Madrid, Spain; Available online: https://www.mapa.gob.es/es/agricultura/publicaciones/02_FERTILIZACI%C3%93N(BAJA)_tcm30-57891.pdf (accessed on 4 October 2019).
  60. Marmolin, C.; Björkholm, A.-M. Växtnäringsrekommendationer Till Frilandsgrönsaker En Sammanställning av Rekommendationer Som Ges i Sverige, Norge, Finland, Tyskland, Holland och UK; Hushållningssällskapet: Skara and Kristianstad, Sweden, 2014. [Google Scholar]
  61. Nilsson, T. Gödsling av Hallon. LTJ-Fakultetens Faktablad; Fakulteten för Landskapsplanering, Trädgårds-Och Jordbruksvetenskap, Swedish University of Agricultural Sciences: Alnarp, Sweden, 2011. [Google Scholar]
  62. Swedish Board of Agriculture. Gödslings-Och Kalkningsråd för Fruktodling 2004; Swedish Board of Agriculture: Jönköping, Sweden, 2004. [Google Scholar]
  63. Spruijt, J.; van der Voort, M. Kwantitatieve Informatie Akkerbouw en Vollegrondsgroenteteelt 2015; Wageningen University & Research: Wageningen, The Netherlands, 2015. [Google Scholar]
  64. Blengini, G.A.; Busto, M. The life cycle of rice: LCA of alternative agri-food chain management systems in Vercelli (Italy). J. Environ. Manag. 2009, 90, 1512–1522. [Google Scholar] [CrossRef]
  65. Fusi, F.; Bacenetti, J.; González-García, S.; Vercesi, A.; Bocchi, S.; Fiala, M. Environmental profile of paddy rice cultivation with different straw management. Sci. Total Environ. 2014, 494, 119–128. [Google Scholar] [CrossRef]
  66. Röös, E.; Karlsson, H. Effect of eating seasonal on the carbon footprint of Swedish vegetable consumption. J. Clean. Prod. 2013, 59, 63–72. [Google Scholar] [CrossRef]
  67. Davis, J. Emissions of Greenhouse Gases from Production of Horticultural Products: Analysis of 17 Products Cultivated in Sweden; SIK Institutet för Livsmedel och Bioteknik: Gothenburg, Sweden, 2011. [Google Scholar]
  68. Mekonnen, M.M.; Hoekstra, A.Y. A global assessment of the water footprint of farm animal products. Ecosystems 2012, 15, 401–415. [Google Scholar] [CrossRef] [Green Version]
  69. Mekonnen, M.M.; Hoekstra, A.Y. The green, blue and grey water footprint of crops and derived crop products. Hydrol. Earth Syst. Sci. 2011, 15, 1577–1600. [Google Scholar] [CrossRef] [Green Version]
  70. Chaudhary, A.; Brooks, T.M. Land use intensity-specific global characterization factors to assess product biodiversity footprints. Environ. Sci. Technol. 2018, 52, 5094–5104. [Google Scholar] [CrossRef]
  71. Ritchie, H.; Roser, M. Land Use. In Our World in Data; 2020; Available online: https://ourworldindata.org/land-use (accessed on 4 October 2019).
  72. Burgin, C.J.; Colella, J.P.; Kahn, P.L.; Upham, N.S. How many species of mammals are there? J. Mammal. 2018, 99, 1–14. [Google Scholar] [CrossRef] [Green Version]
  73. Dickinson, E.C.; Remsen, J.V.J. The Howard and Moore Complete Checklist of the Birds of the World, 4th ed.; Non-Passerines, Aves Press: Eastbourne, UK, 2013; Volume 1. [Google Scholar]
  74. Dickinson, E.C.; Christidis, L. The Howard and Moore Complete Checklist of the Birds of the World, 4th ed.; Non-Passerines, Aves Press: Eastbourne, UK, 2014; Volume 2. [Google Scholar]
  75. Pincheira-Donoso, D.; Bauer, A.M.; Meiri, S.; Uetz, P. Global taxonomic diversity of living reptiles. PLoS ONE 2013, 8, e59741. [Google Scholar] [CrossRef] [PubMed] [Green Version]
  76. Frost, D.R.; Grant, T.; Faivovich, J.; Bain, R.H.; Haas, A.; Haddad, C.F.B.; De Sa, R.O.; Channing, A.; Wilkinson, M.; Donnellan, S.C. The amphibian tree of life. Bull. Am. Mus. Nat. Hist. 2006, 2006, 1–291. [Google Scholar] [CrossRef]
  77. Christenhusz, M.J.; Byng, J.W. The number of known plants species in the world and its annual increase. Phytotaxa 2016, 261, 201–217. [Google Scholar] [CrossRef] [Green Version]
  78. Baer, P.; Kartha, S.; Athanasiou, T.; Kemp-Benedict, E. The greenhouse development rights framework: Drawing attention to inequality within nations in the global climate policy debate. Dev. Chang. 2009, 40, 1121–1138. [Google Scholar] [CrossRef]
  79. Swedish Board of Agriculture. Jordbrukets Behov av Vattenförsörjning; Swedish Board of Agriculture: Jönköping, Sweden, 2018. [Google Scholar]
  80. Swedish Board of Agriculture. Ett Rikt Odlingslandskap. Fördjupad Utvärdering 2019; Swedish Board of Agriculture: Jönköping, Sweden, 2018. [Google Scholar]
  81. Henryson, K.; Hansson, P.-A.; Sundberg, C. Spatially differentiated midpoint indicator for marine eutrophication of waterborne emissions in Sweden. Int. J. Life Cycle Assess. 2018, 23, 70–81. [Google Scholar] [CrossRef] [Green Version]
  82. Gallego, A.; Rodríguez, L.; Hospido, A.; Moreira, M.T.; Feijoo, G. Development of regional characterization factors for aquatic eutrophication. Int. J. Life Cycle Assess. 2010, 15, 32. [Google Scholar] [CrossRef]
  83. Boulay, A.-M.; Bare, J.; Benini, L.; Berger, M.; Lathuillière, M.J.; Manzardo, A.; Margni, M.; Motoshita, M.; Núñez, M.; Pastor, A.V.; et al. The WULCA consensus characterization model for water scarcity footprints: Assessing impacts of water consumption based on available water remaining (AWARE). Int. J. Life Cycle Assess. 2018, 23, 368–378. [Google Scholar] [CrossRef] [Green Version]
  84. Pfister, S.; Koehler, A.; Hellweg, S. Assessing the environmental impacts of freshwater consumption in LCA. Environ. Sci. Technol. 2009, 43, 4098–4104. [Google Scholar] [CrossRef] [Green Version]
  85. Ziegler, F.; Bergman, K. Svensk Konsumtion av Sjömat—En Växande Mångfald; RISE Research Institutes of Sweden: Gothenburg, Sweden, 2017. [Google Scholar]
  86. Chaudhary, A.; Verones, F.; de Baan, L.; Hellweg, S. Quantifying land use impacts on biodiversity: Combining species–area models and vulnerability indicators. Environ. Sci. Technol. 2015, 49, 9987–9995. [Google Scholar] [CrossRef]
  87. Swedish Environmental Protection Agency. Frisk Luft—Underlagsrapport Till Den Fördjupade Utvärderingen av Miljömålen 2019; Swedish Environmental Protection Agency: Stockholm, Sweden, 2019. [Google Scholar]
  88. Swedish Environmental Protection Agency. Bara Naturlig Försurning—Underlagsrapport Till Den Fördjupade Utvärderingen av Miljömålen 2019; Swedish Environmental Protection Agency: Stockholm, Sweden, 2019. [Google Scholar]
  89. Steinbach, N.; Palm, V.; Cederberg, C.; Finnveden, G.; Persson, L.; Persson, M.; Berglund, M.; Björk, I.; Fauré, E.; Trimmer, C. Miljöpåverkan Från Svensk Konsumtion-Nya Indikatorer för Uppföljning: Slutrapport Från Forskningsprojektet Prince; Swedish Environmental Protection Agency: Stockholm, Sweden, 2018. [Google Scholar]
  90. European Union. European Parliament and Cote, Regulation (EU) No 517/2014 of the European Parliament and of the Council of 16 April 2014 on fluorinated greenhouse gases and repealing regulation (EC) No 842/2006 Text with EEA relevance. Off. J. Eur. Union 2014, 57, 195–230. [Google Scholar]
  91. Swedish Environmental Protection Agency. Skyddande Ozonskikt—Underlagsrapport Till Den Fördjupade Utvärderingen av Miljömålen 2019; Swedish Environmental Protection Agency: Stockholm, Sweden, 2019. [Google Scholar]
  92. Rosenbaum, R.K.; Bachmann, T.M.; Swirsky Gold, L.; Huijbregts, M.A.J.; Jolliet, O.; Juraske, R.; Koehler, A.; Larsen, H.F.; MacLeod, M.; Margni, M.; et al. USEtox—The UNEP-SETAC toxicity model: Recommended characterisation factors for human toxicity and freshwater ecotoxicity in life cycle impact assessment. Int. J. Life Cycle Assess. 2008, 13, 532. [Google Scholar] [CrossRef] [Green Version]
  93. Nations, United. Transforming our world: The 2030 agenda for sustainable development. In Proceedings of the General Assembley 70 Session, New York, NY, USA, 15–23 December 2015. [Google Scholar]
  94. Einarsson, R.; McCrory, G.; Persson, U.M. Healthy diets and sustainable food systems. Lancet 2019, 394, 215. [Google Scholar] [CrossRef]
  95. Hallström, E.; Röös, E.; Börjesson, P. Sustainable meat consumption: A quantitative analysis of nutritional intake, greenhouse gas emissions and land use from a Swedish perspective. Food Policy 2014, 47, 81–90. [Google Scholar] [CrossRef]
  96. Amcoff, E. Riksmaten-Vuxna 2010–11: Livsmedels-Och Näringsintag Bland Vuxna i Sverige; Swedish National Food Agency: Uppsala, Sweden, 2012. [Google Scholar]
Figure 1. Illustration of (left) the framework for the Swedish Environmental Objectives and (right) examples of objectives and indicators (based on Sveriges miljömål [17]).
Sustainability 12 01407 g001
Figure 2. Environmental impacts of the average Swedish diet relative to the boundaries in the EAT-Lancet framework [1]. The red inner circle shows the per capita boundaries, i.e., 100% of the ‘allowed’ boundary, and each dotted outer circle shows transgression of the boundary by another 100%. Water use refers to consumptive water use.
Sustainability 12 01407 g002
Figure 3. Environmental impacts per kg of food (per kg bone-free weight for meat and edible weight for fish and seafood) for food products on the Swedish market.
Sustainability 12 01407 g003
Figure 4. Relative contribution by different food groups to the environmental impacts from Swedish food consumption.
Sustainability 12 01407 g004
Figure 5. Links between Swedish Environmental Objectives [17] and the EAT-Lancet framework [1].
Sustainability 12 01407 g005
Table 1. Earth system processes, control variables and global food system boundaries defined by the EAT-Lancet Commission [1]. GHG = greenhouse gases, CO2e = carbon dioxide equivalents, E/MSY = extinctions per million species-years. Range of uncertainty for the global boundaries is given in parentheses.
Earth System ProcessClimate ChangeLand-System ChangeNitrogen (N) CyclingPhosphorus (P) CyclingFreshwater UseBiodiversity Loss
Control variableGHG emissionsCropland useN applicationP applicationConsumptive water useExtinction rate
Global boundary5 Gton CO2e per year
(4.7–5.4) *
13 million km2
(11–15)
90 Tg N per year
(65–130)
8 Tg P per year
(6–16)
2500 km3 per year
(1000–4000)
10 E/MSY (1–80)
* Represented by emissions of methane and nitrous oxide from agriculture and minor emissions of CO2 from biomass burning. CO2 emissions from fossil sources and land use change should be zero (see Section 2.2.1).
Table 2. Environmental impacts of the average Swedish diet, benchmarked against downscaled per capita boundaries for the control variables given in the EAT-Lancet framework [1]. CO2e = carbon dioxide equivalents, E/MSY = extinctions per million species-years. Range of uncertainty for the boundaries is given in parentheses.
Earth System ProcessClimate ChangeLand-System ChangeNitrogen (N) CyclingPhosphorus (P) CyclingFreshwater UseBiodiversity Loss
Control variableGreenhouse gas emissionsCropland useN applicationP applicationConsumptive water useExtinction rate
Environmental impact per capita (results from this study)2.2 ton CO2e per year of which 0.92 ton CO2, 0.82 ton CH4 *, 0.5 ton N2O * and 0.01 ton HCFC-22 *.0.34 ha57 kg N per year5.0 kg P per year55 m3 per year8.3 × 10−9 E/MSY **
Per capita boundary (downscaled from the global boundaries given by the EAT-Lancet Commission)0.68 ton CO2e per year for CH4 and N2O and zero for CO2 from fossil fuels and land use and land use change (0.68–0.73)0.18 ha (0.15–0.2)12 kg N per year (8.8–18)1.1 kg P per year (0.8–2.2)339 m3 per year (136–542)1.4 × 10⁻⁹ E/MSY (1.4 × 10⁻¹⁰–1.1 × 10⁻⁸)
* Expressed in CO2e. ** Allocated over 100 years (see Section 2.2.5).
Table 3. Summary of comparisons between global and local indicators, aspects not covered by the EAT-Lancet framework, suggested indicators and areas where new data or methods are needed. SEO = Swedish Environmental Objectives, GHG = greenhouse gases, NOx = nitrogen oxides.
Earth System ProcessAspects in the SEO not Covered by the EAT-Lancet Framework and Other Aspects Covering Environmental Sustainability Suggested IndicatorNeed for Additional Data or Method Development
Climate change-GHG emissions-
Land-system changeMaintain Swedish agricultural land, quality aspects of land useSwedish agricultural land and soil fertility aspects System for monitoring soil fertility that can be connected to foods. Soil organic content could potentially be used.
Maintain Swedish pasture, including semi-natural pasturesPasture useImproved statistics on different land types and uses of pasture
Nitrogen and phosphorus cyclingSite-dependent eutrophication impacts, i.e., emissions to specific catchments and nutrient status of recipientsSite-dependent eutrophication impactsData on emission intensities for specific catchments and on nutrient status of recipients
Freshwater useSite-dependent impacts of consumptive freshwater use Site-dependent consumptive freshwater impacts Data on consumptive freshwater use and availability on catchment level
Biodiversity lossLocal aspects of biodiversity, e.g., state of threatened species on agricultural landTerrestrial extinction rateMethods that allow local impacts to be linked to foods
Marine extinctionMarine extinction rateMethods that allow local impacts to be linked to foods
Atmospheric aerosolsAir pollutionEmissions of NOx and particles-
Acidification of freshwater and land Acidification of freshwater and landEmissions of ammonia-
Chemical pollutionToxic substances to the environmentPesticide useData on the type and amount of pesticides used for different crops, especially for outside the European Union. Methods like UseTox [92] can then be applied.
Ozone depletionEmissions of ozone depleting substancesEmissions of N2O-

