Predicting Unconfined Compressive Strength Decrease of Carbonate Building Materials against Frost Attack Using Nondestructive Physical Tests


Abstract
1. Introduction
2. Materials and Methods
2.1. Raw Materials
2.2. Petrographic Properties
2.3. Frost Attack Process
2.4. Unconfined Compression Test
2.5. Porosity and Water Absorption
2.6. Ultrasonic System
3. Results and Discussions
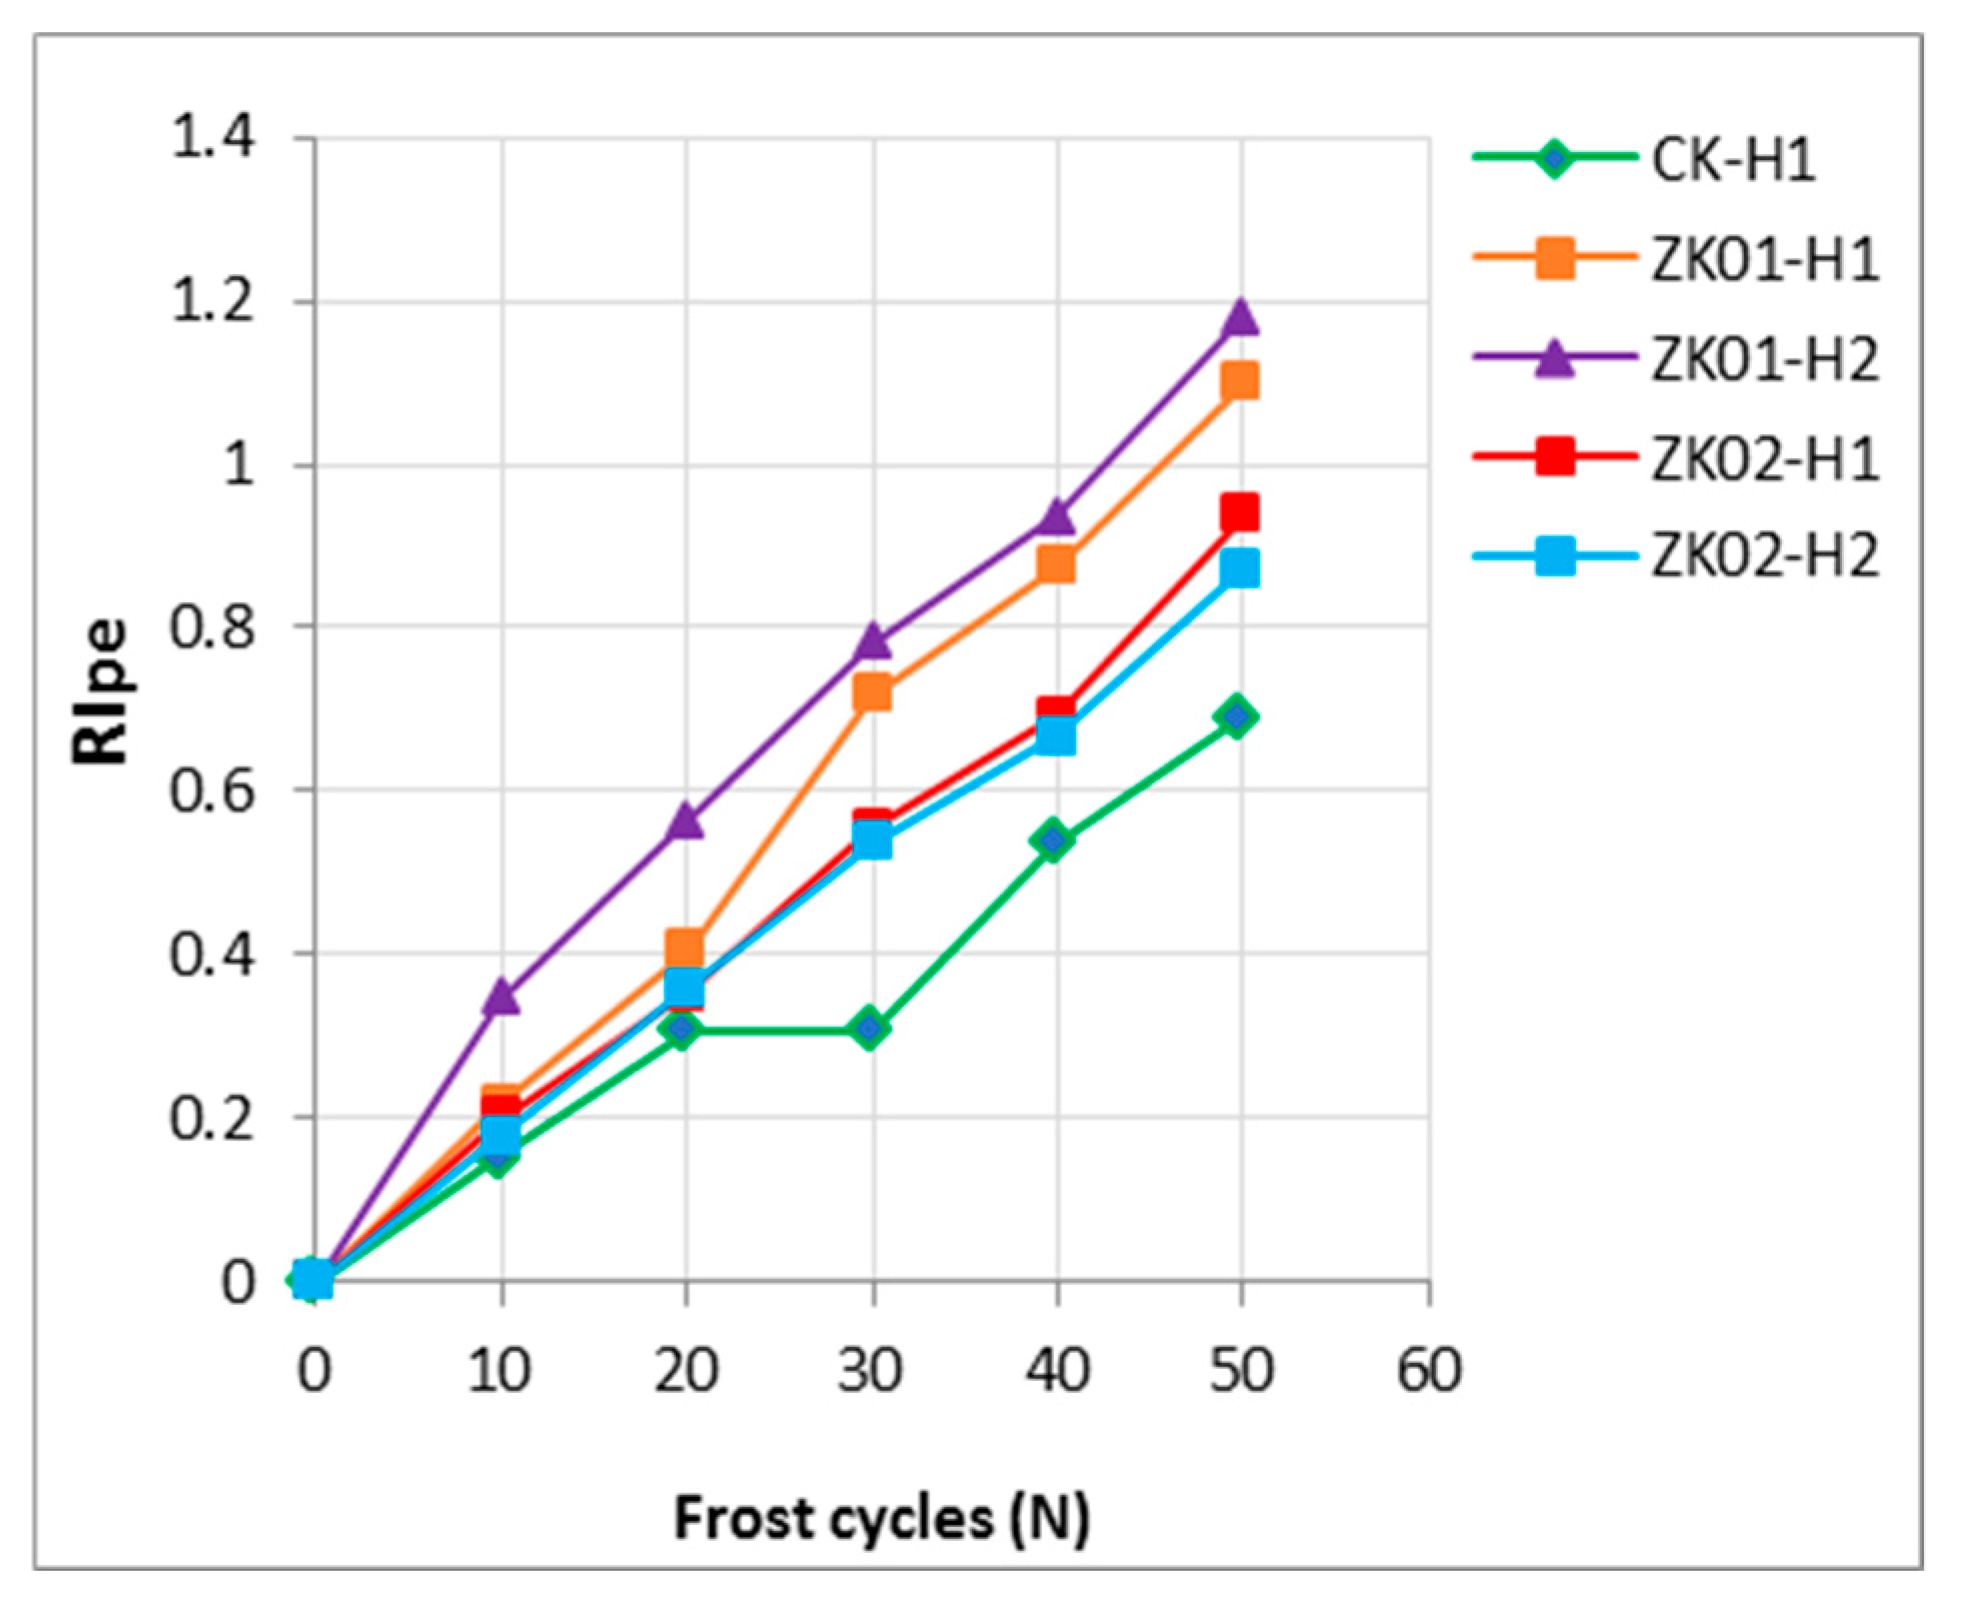
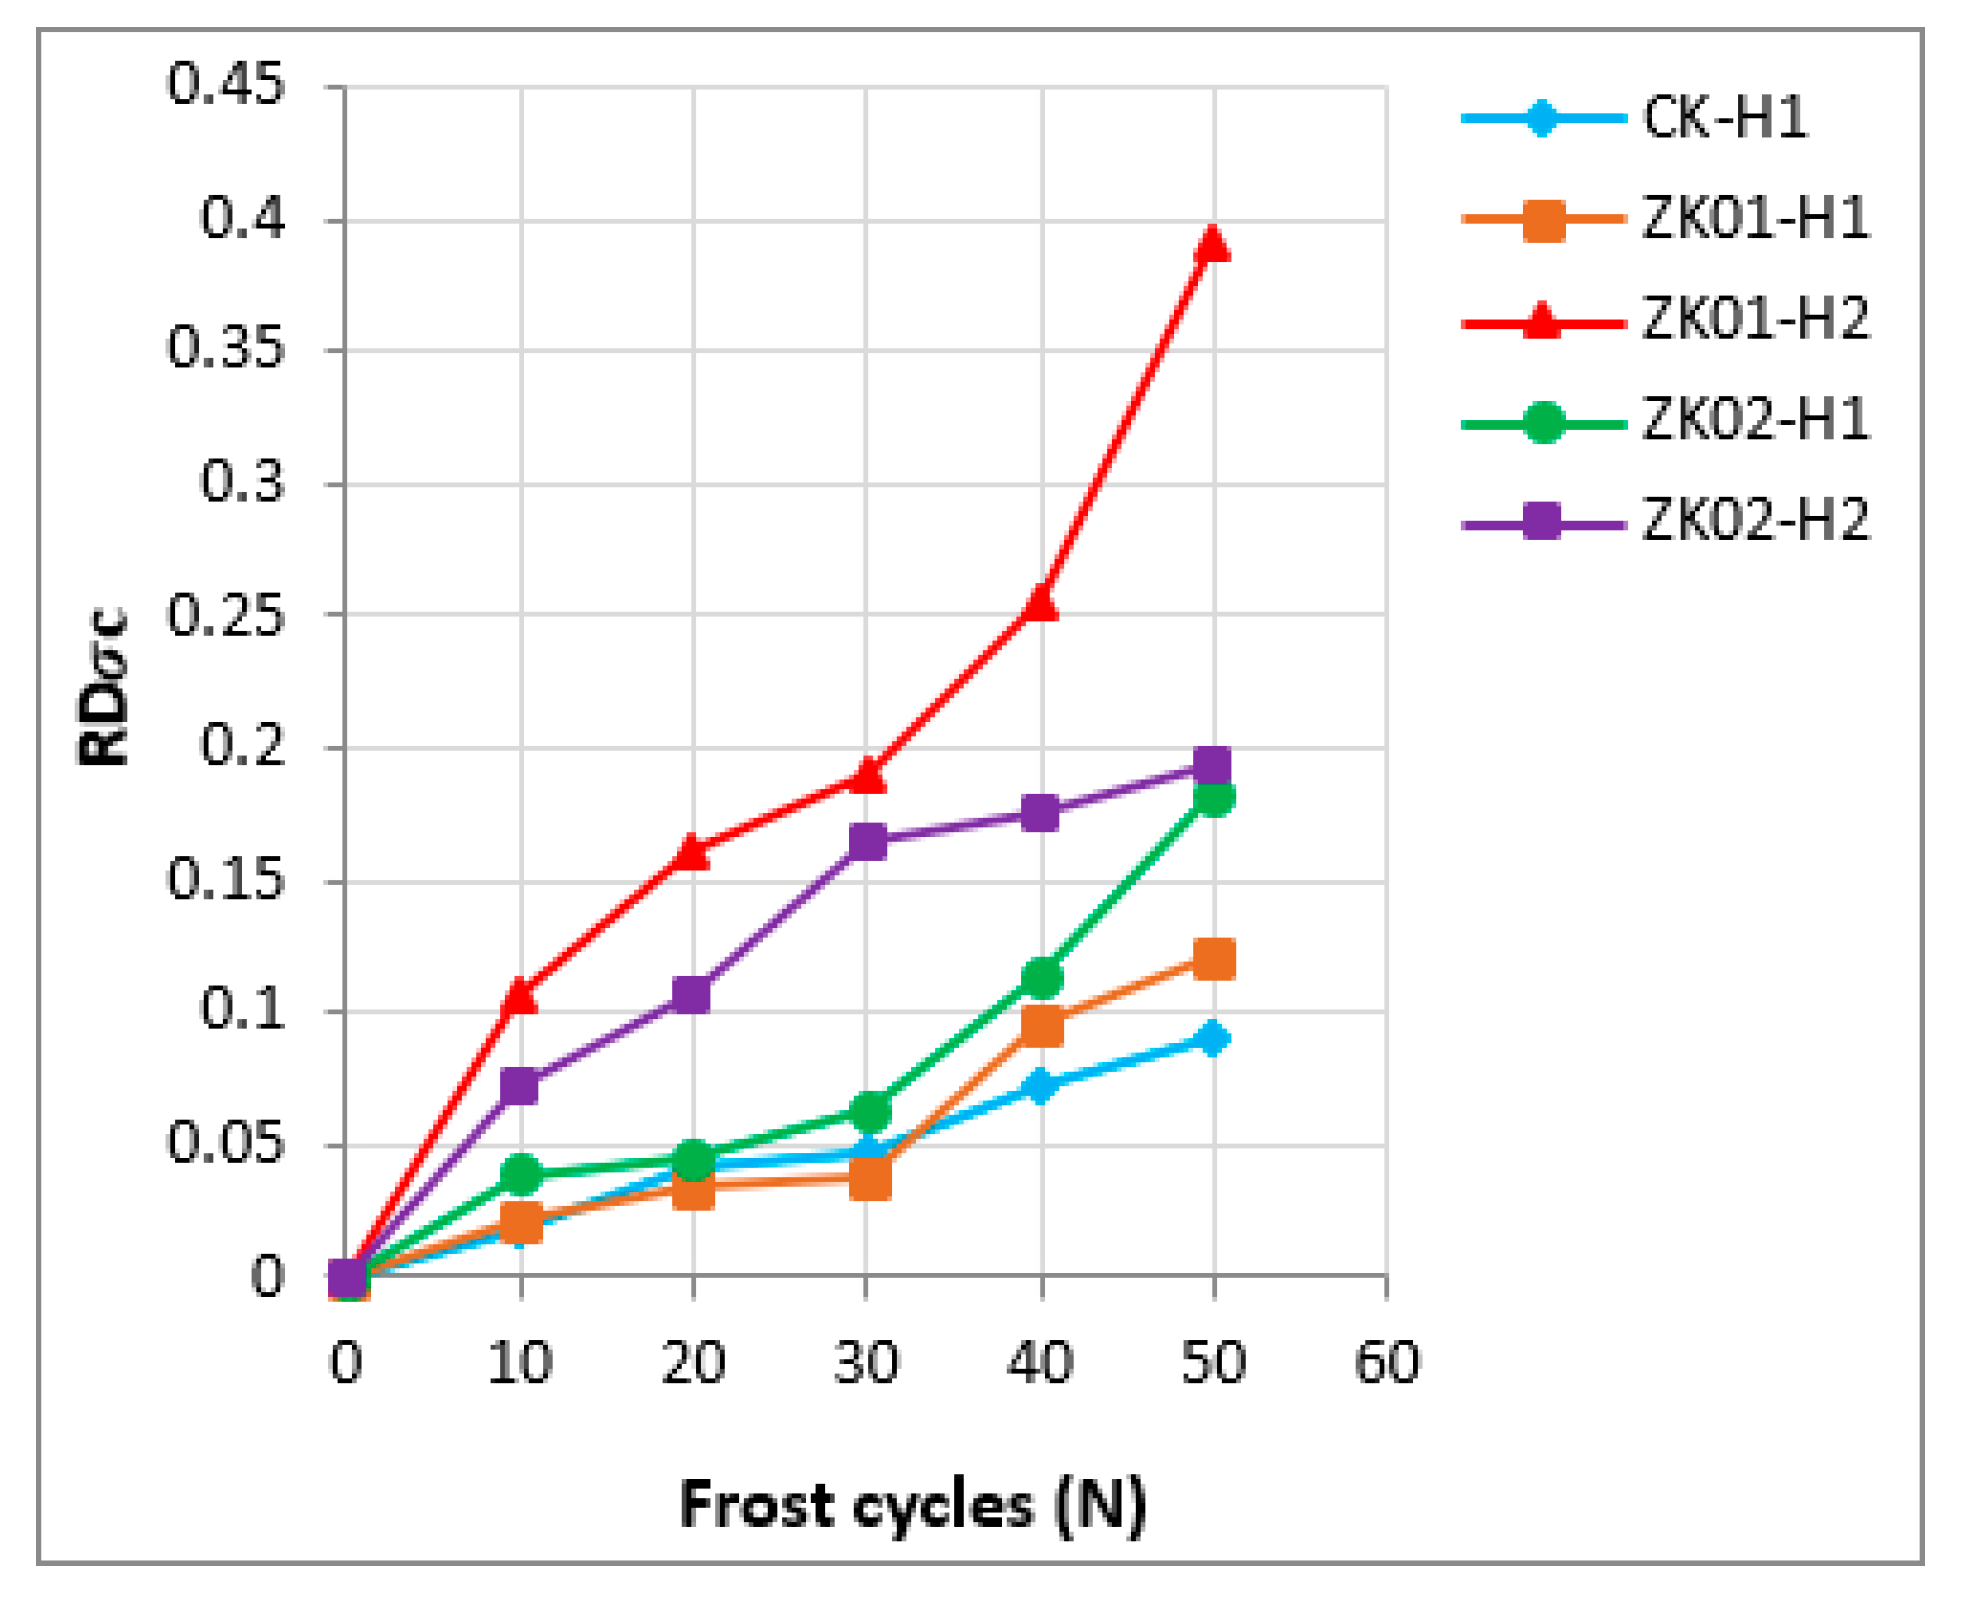
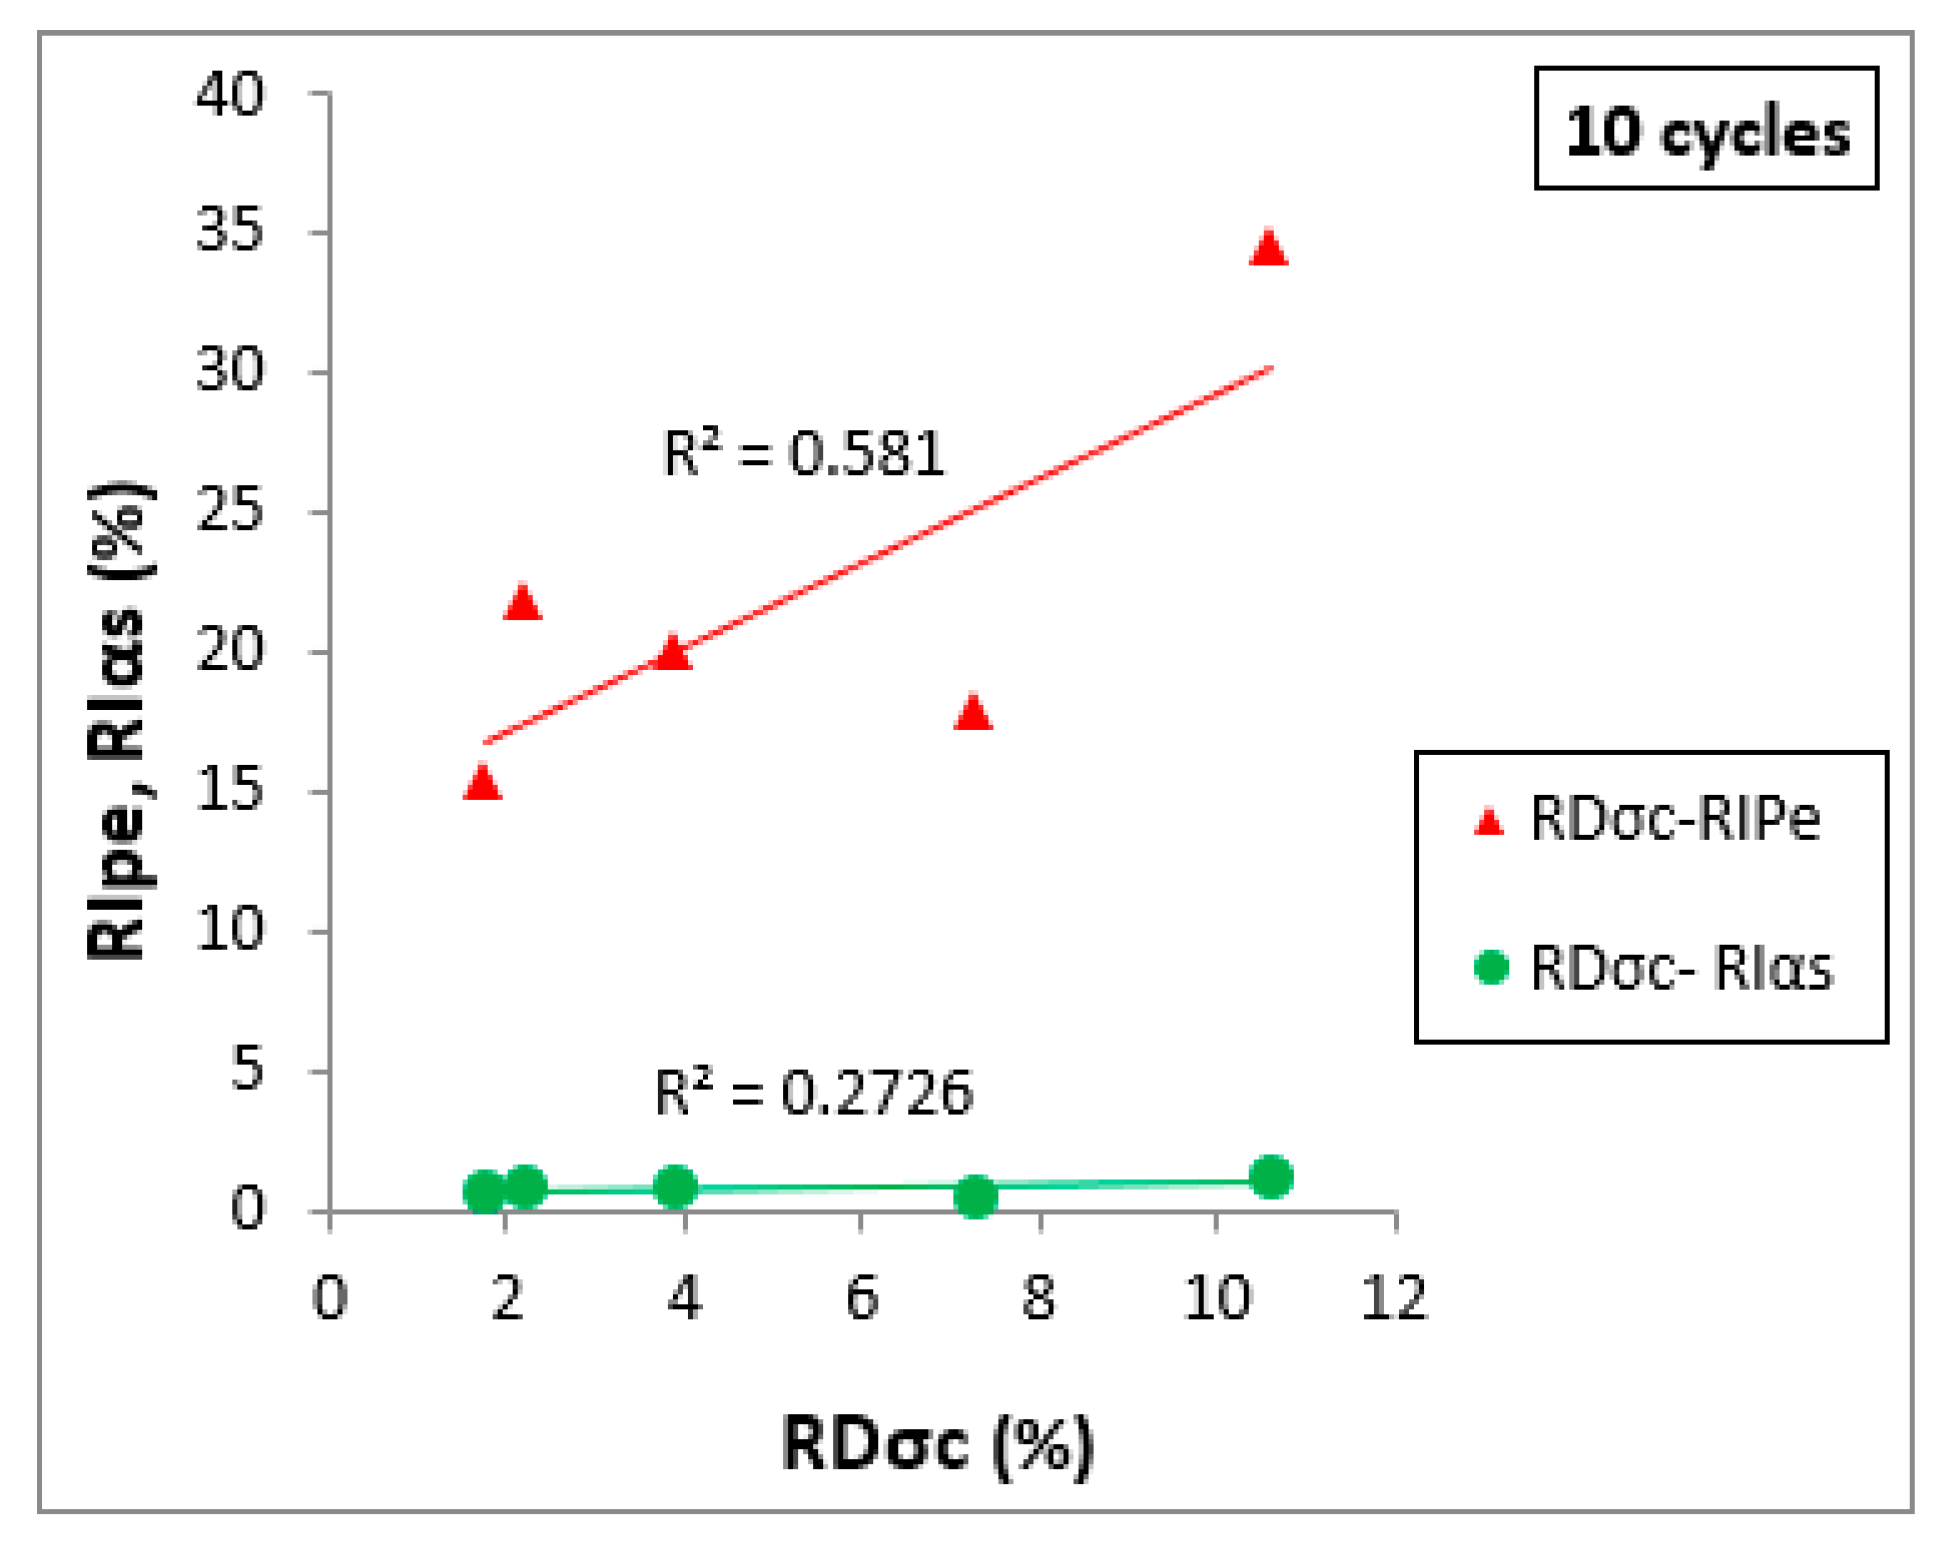
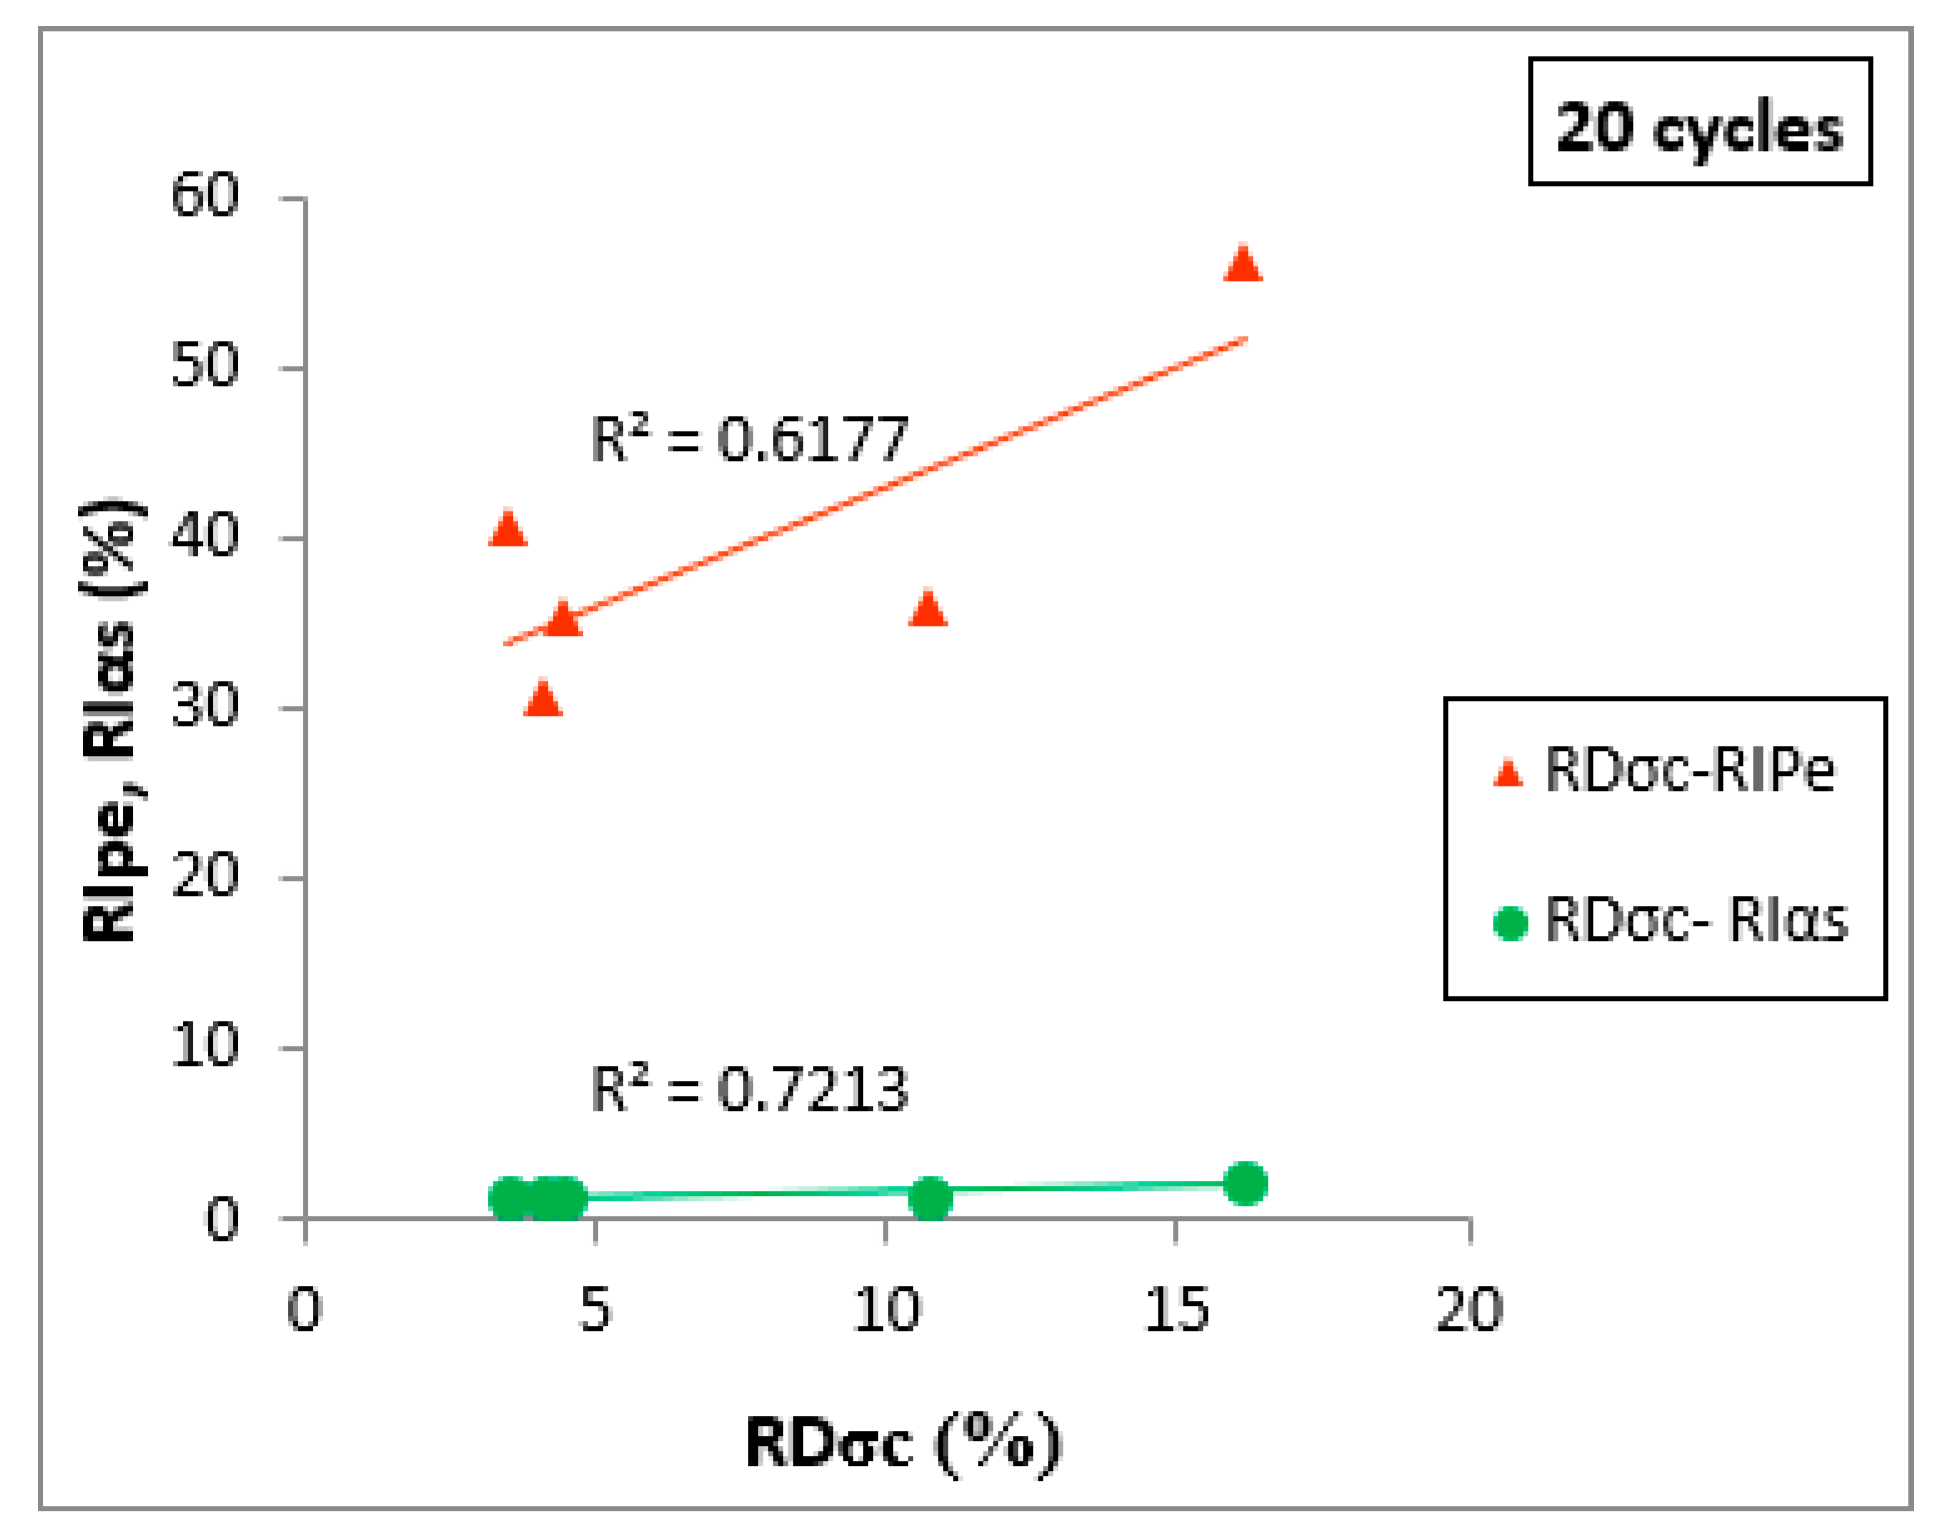
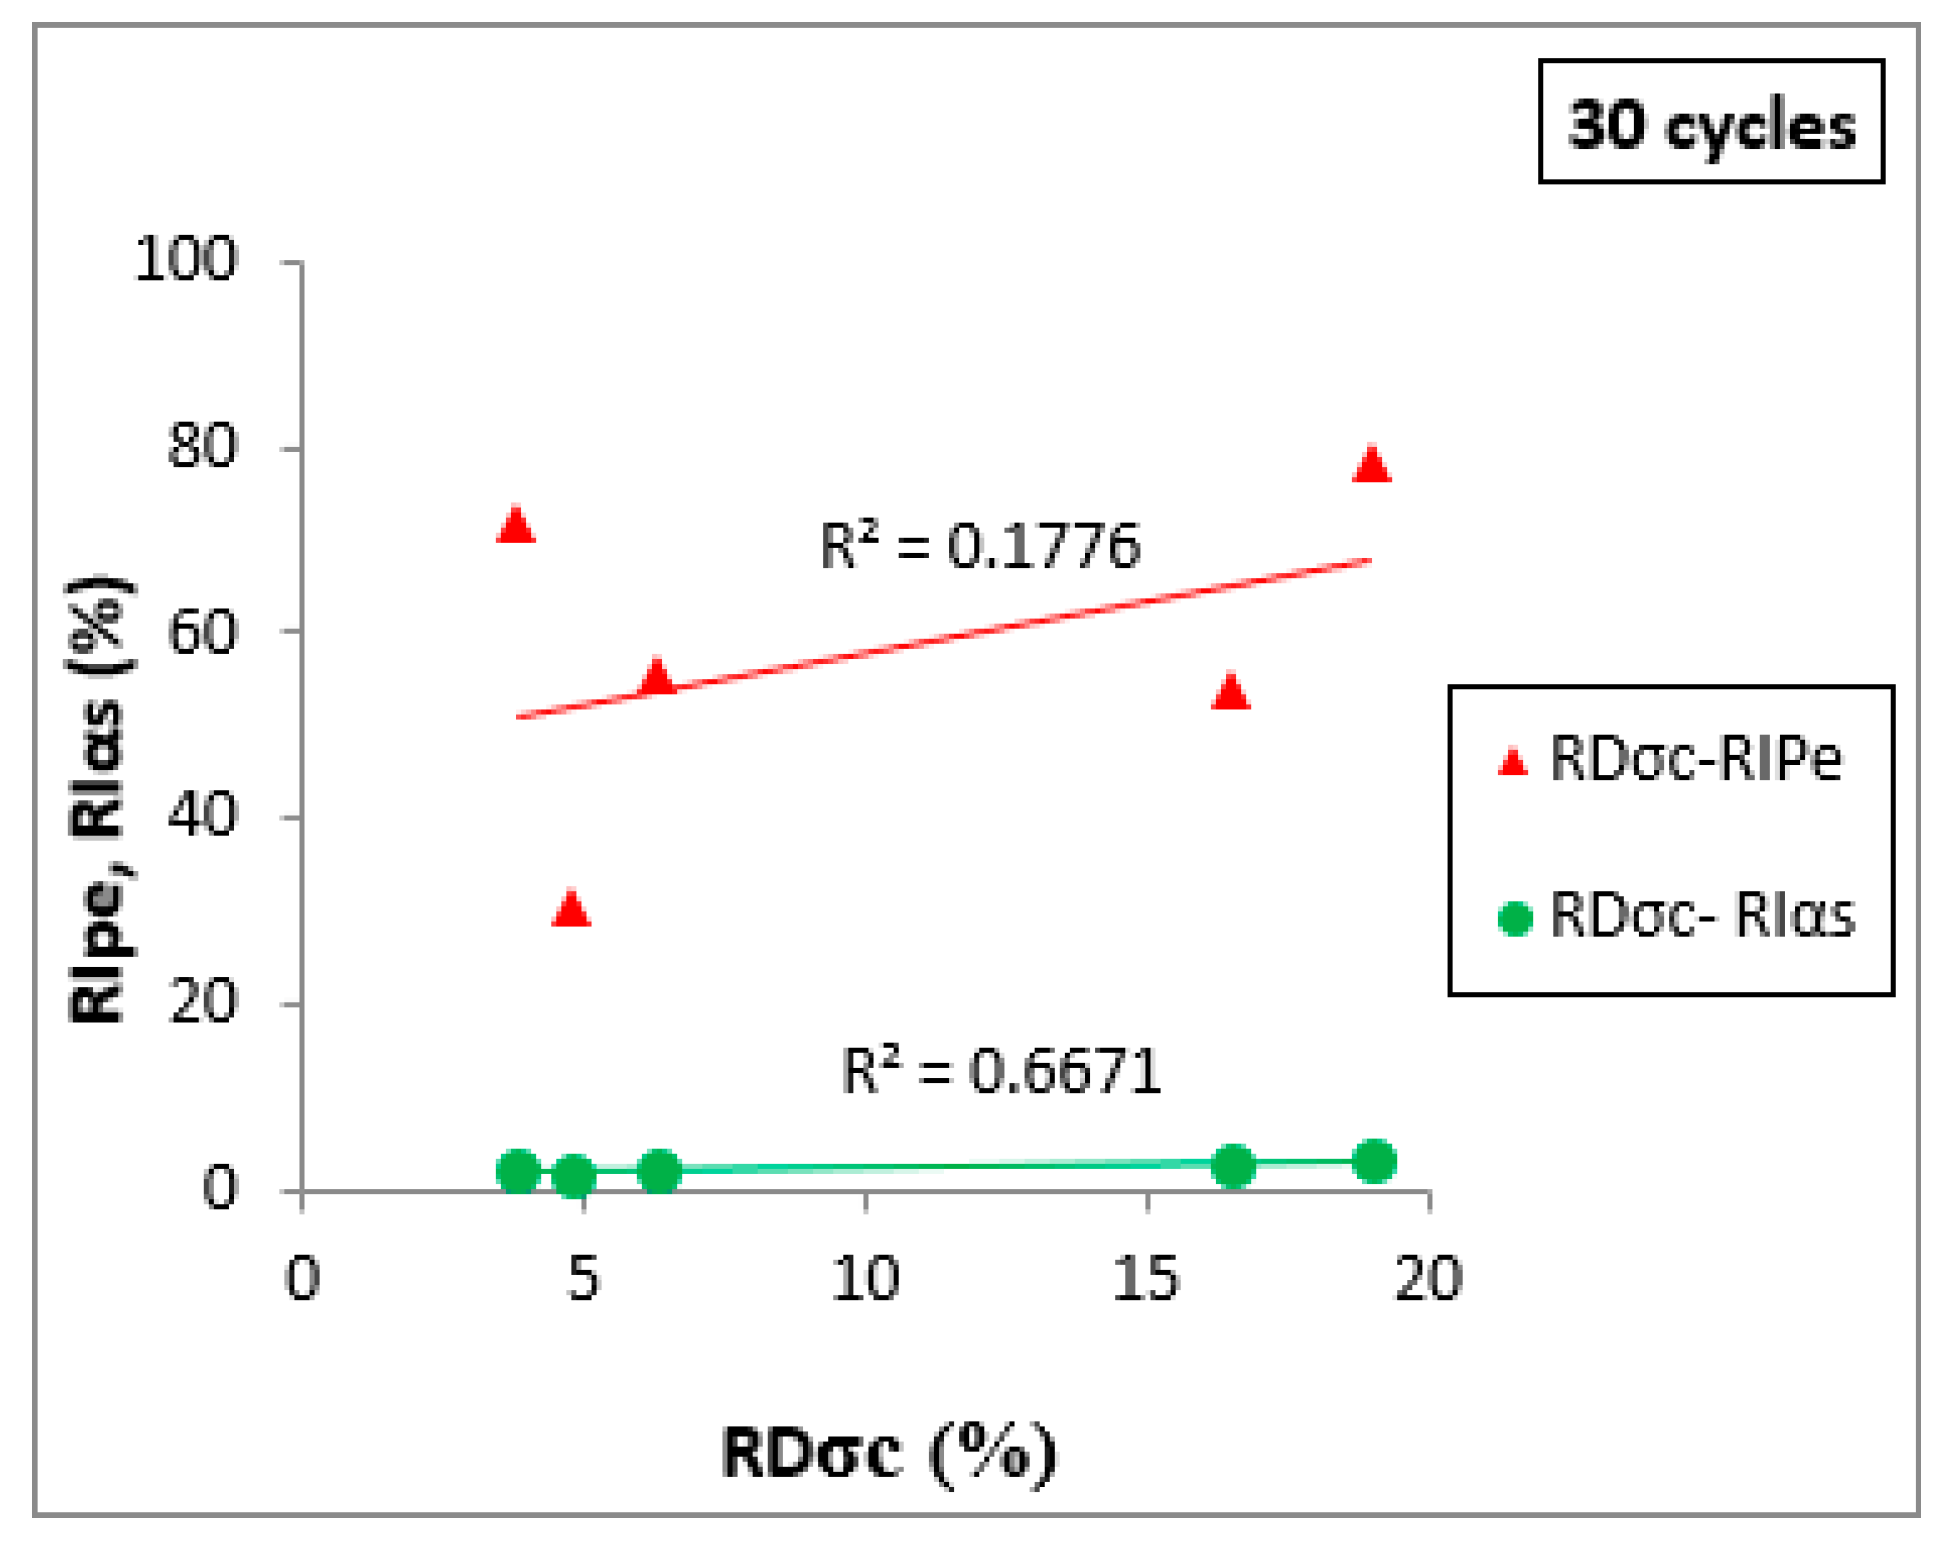
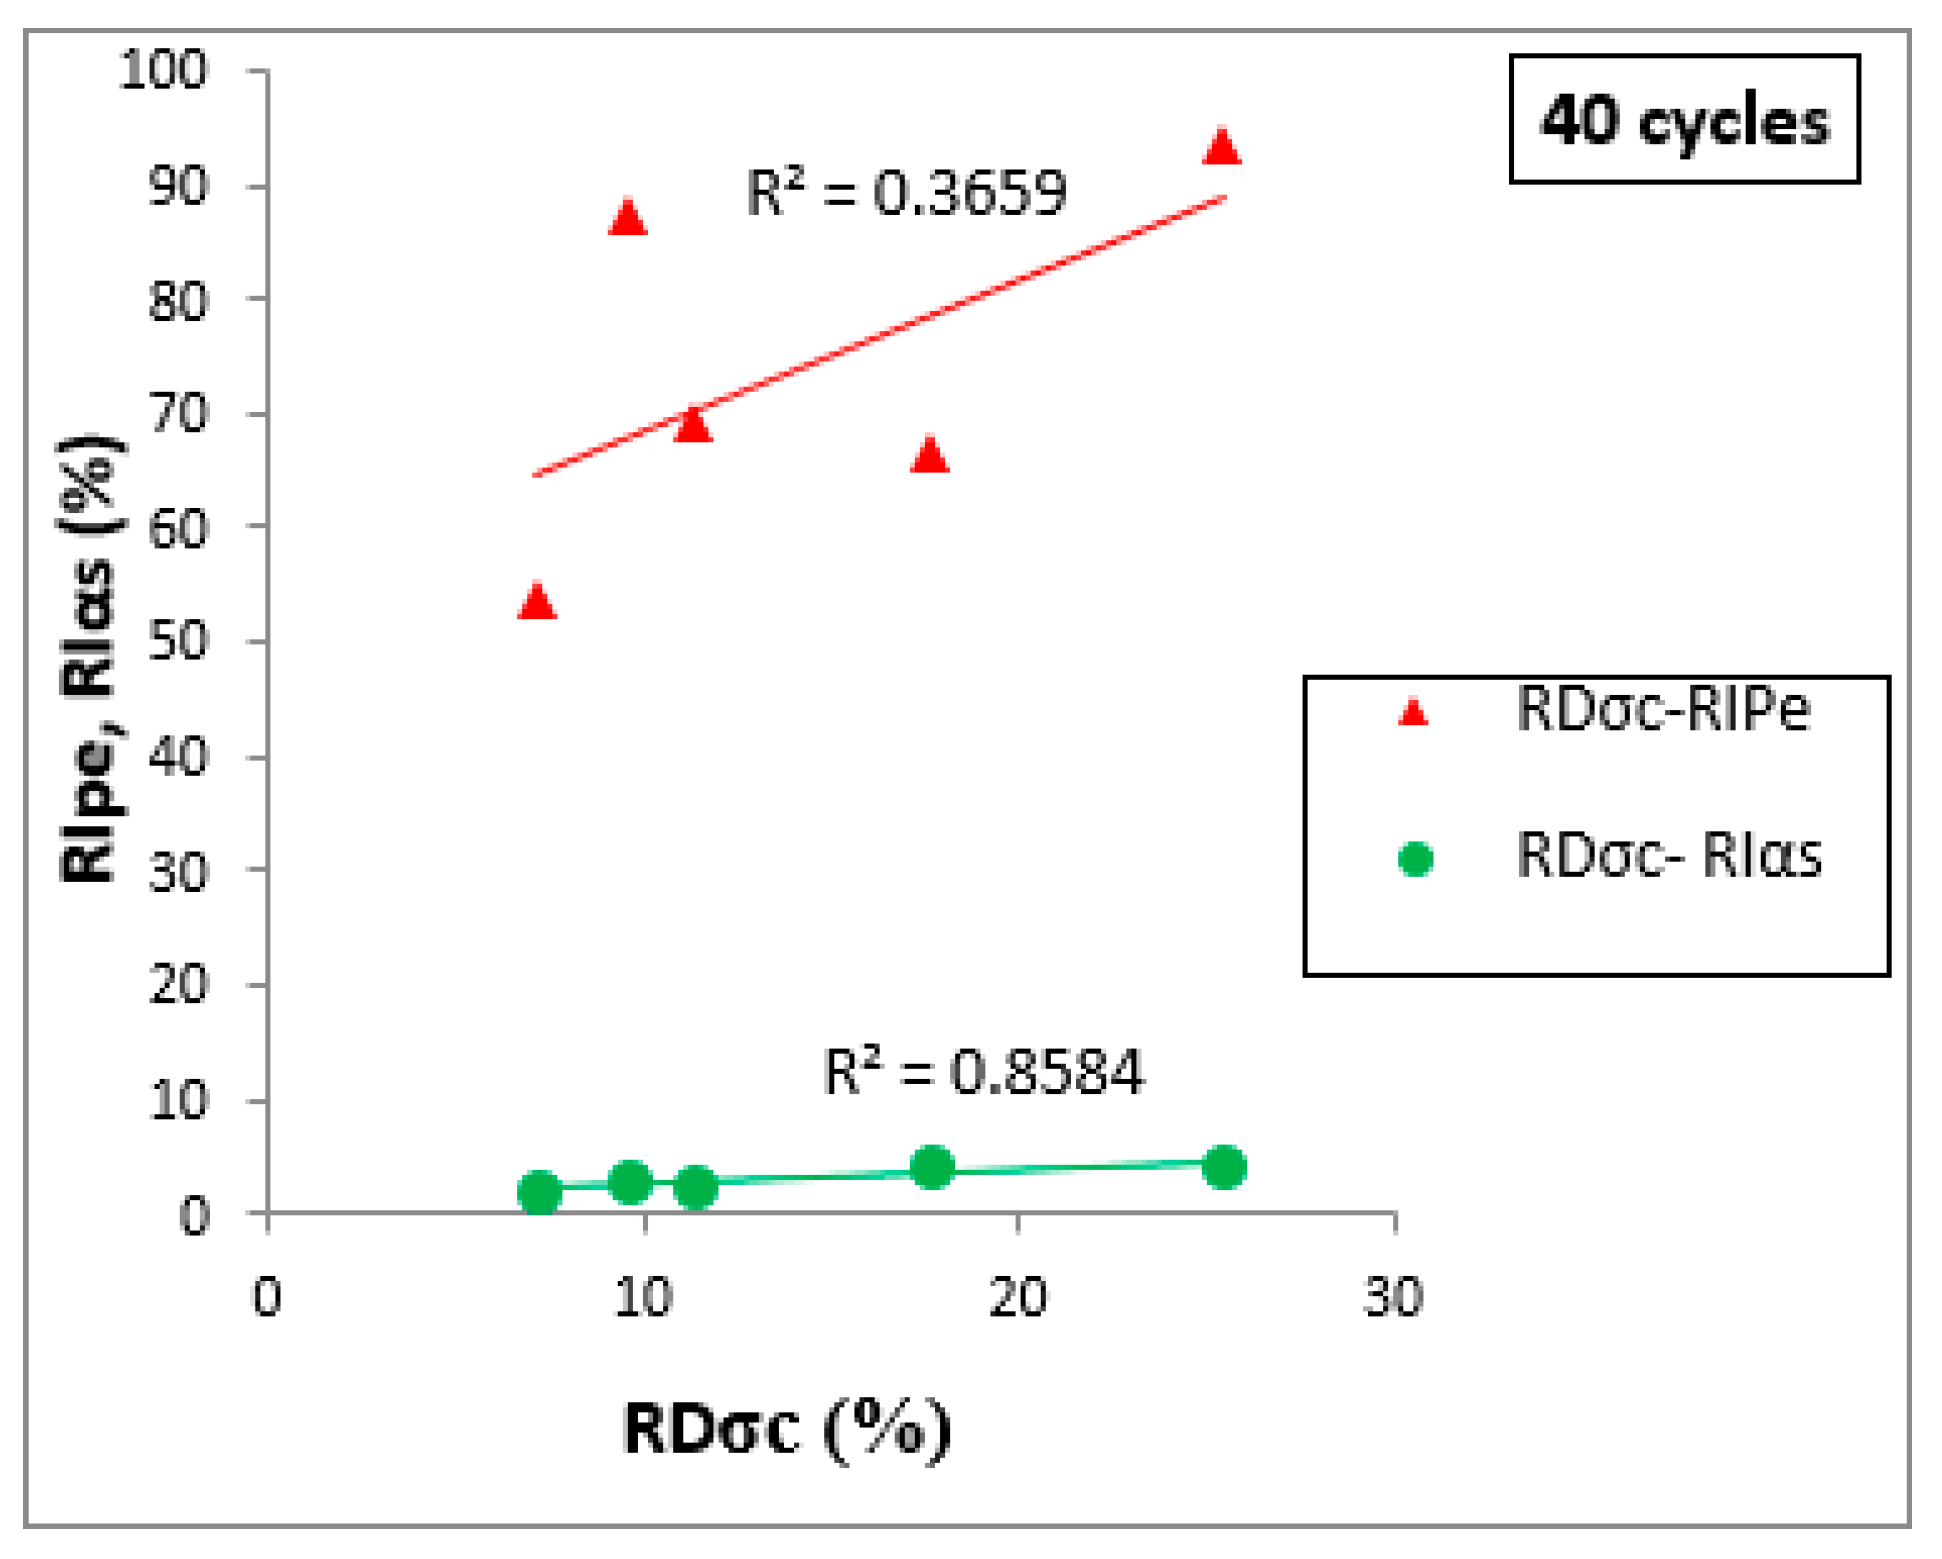
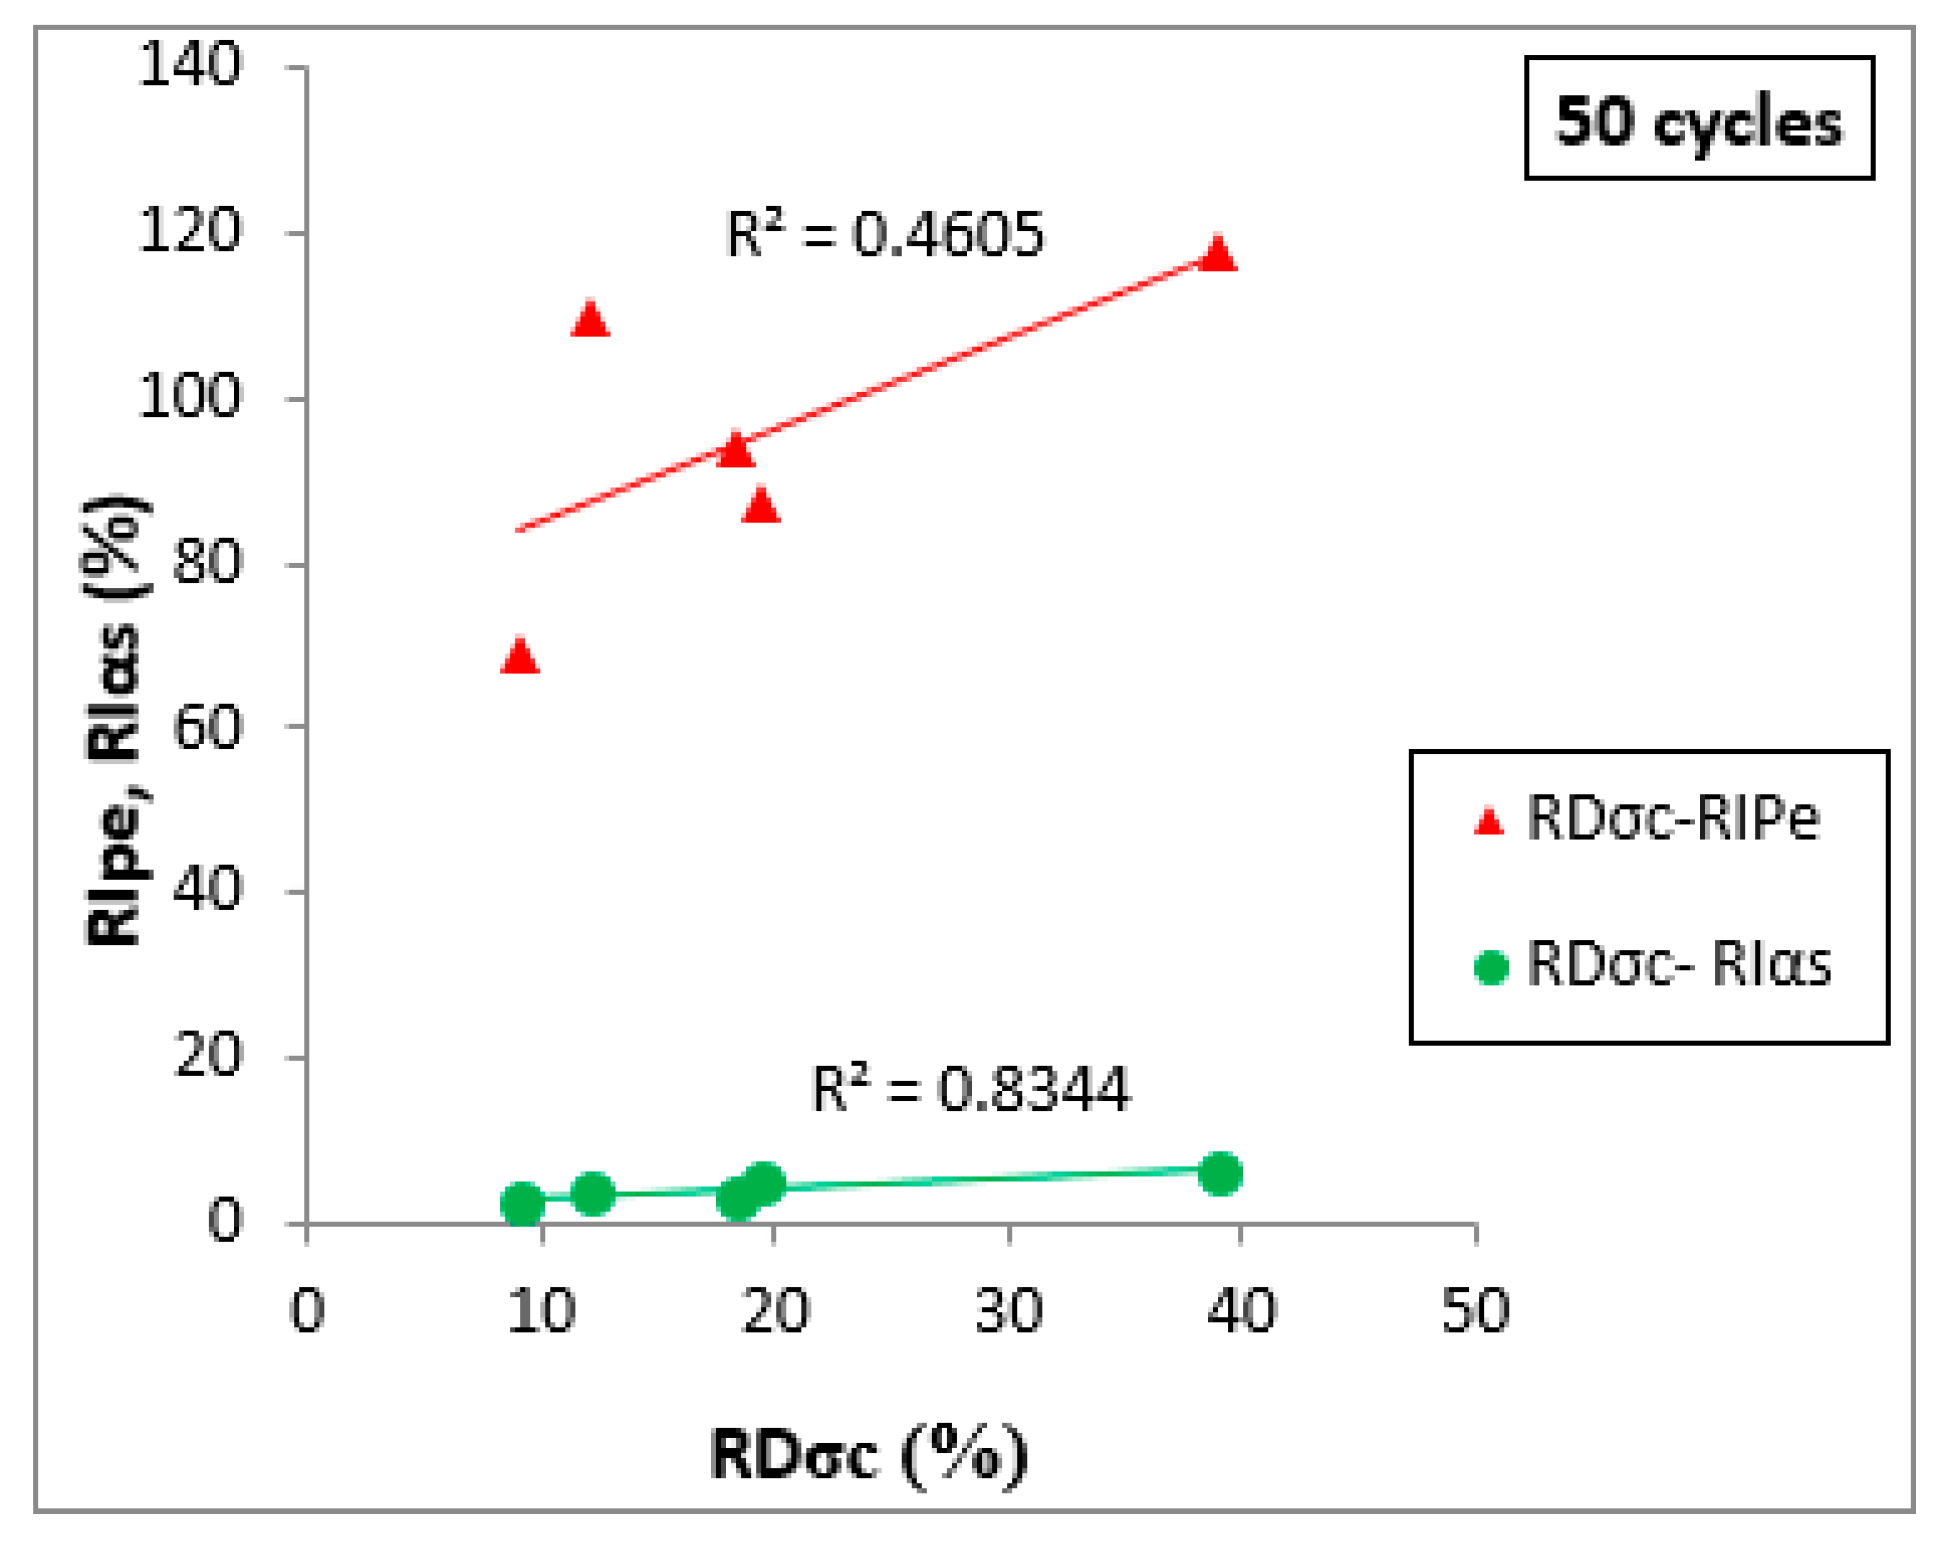
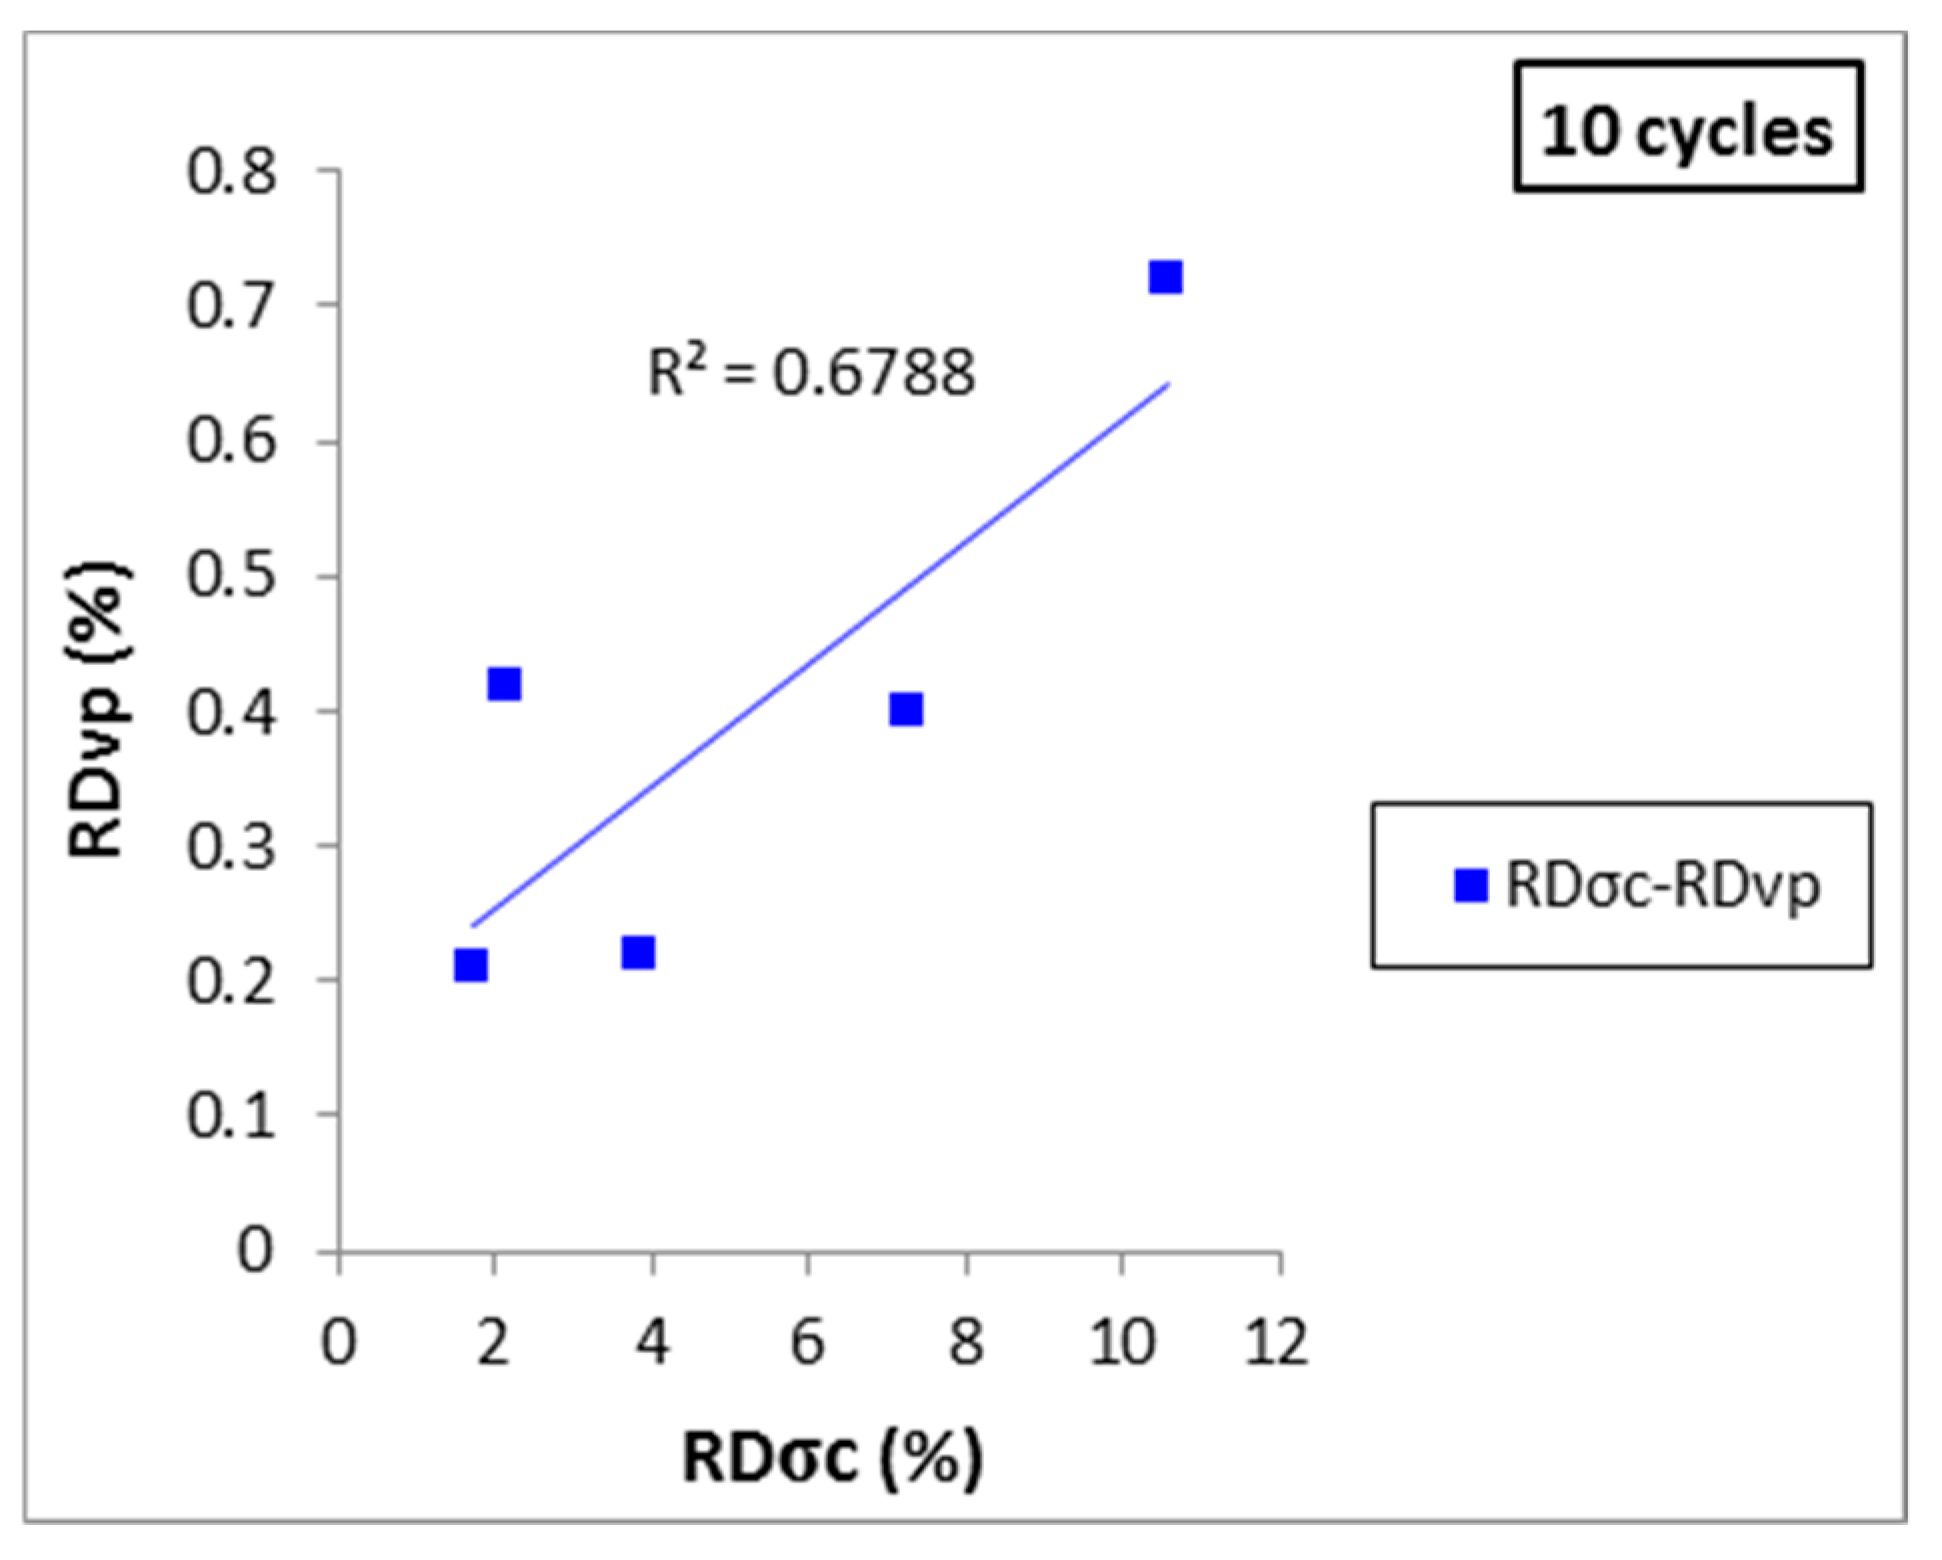
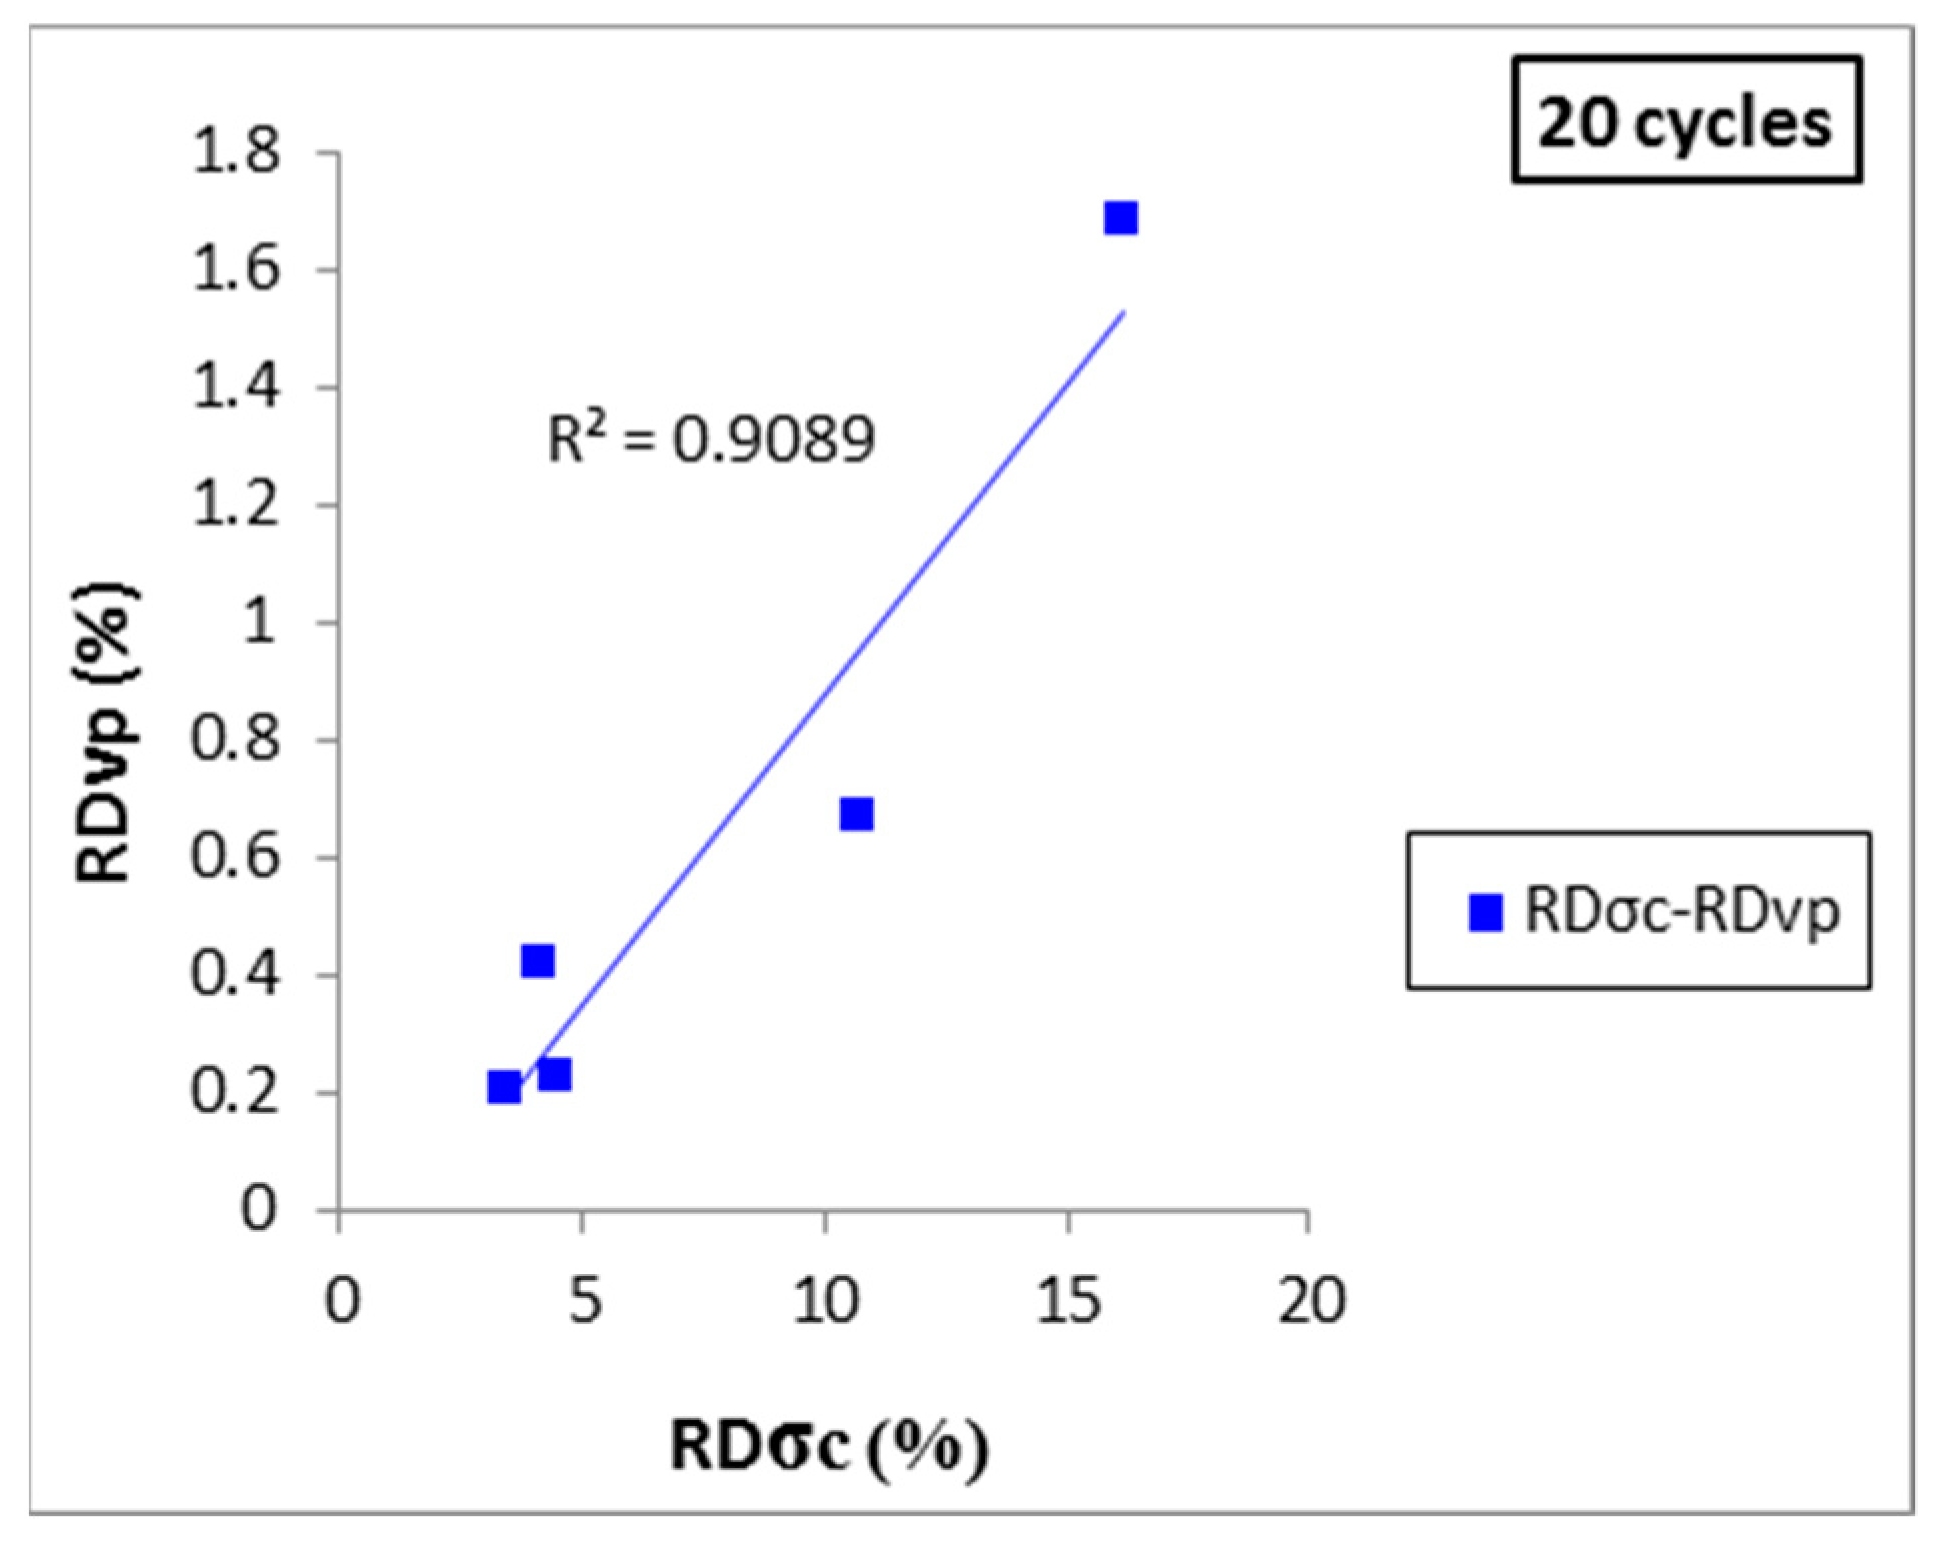
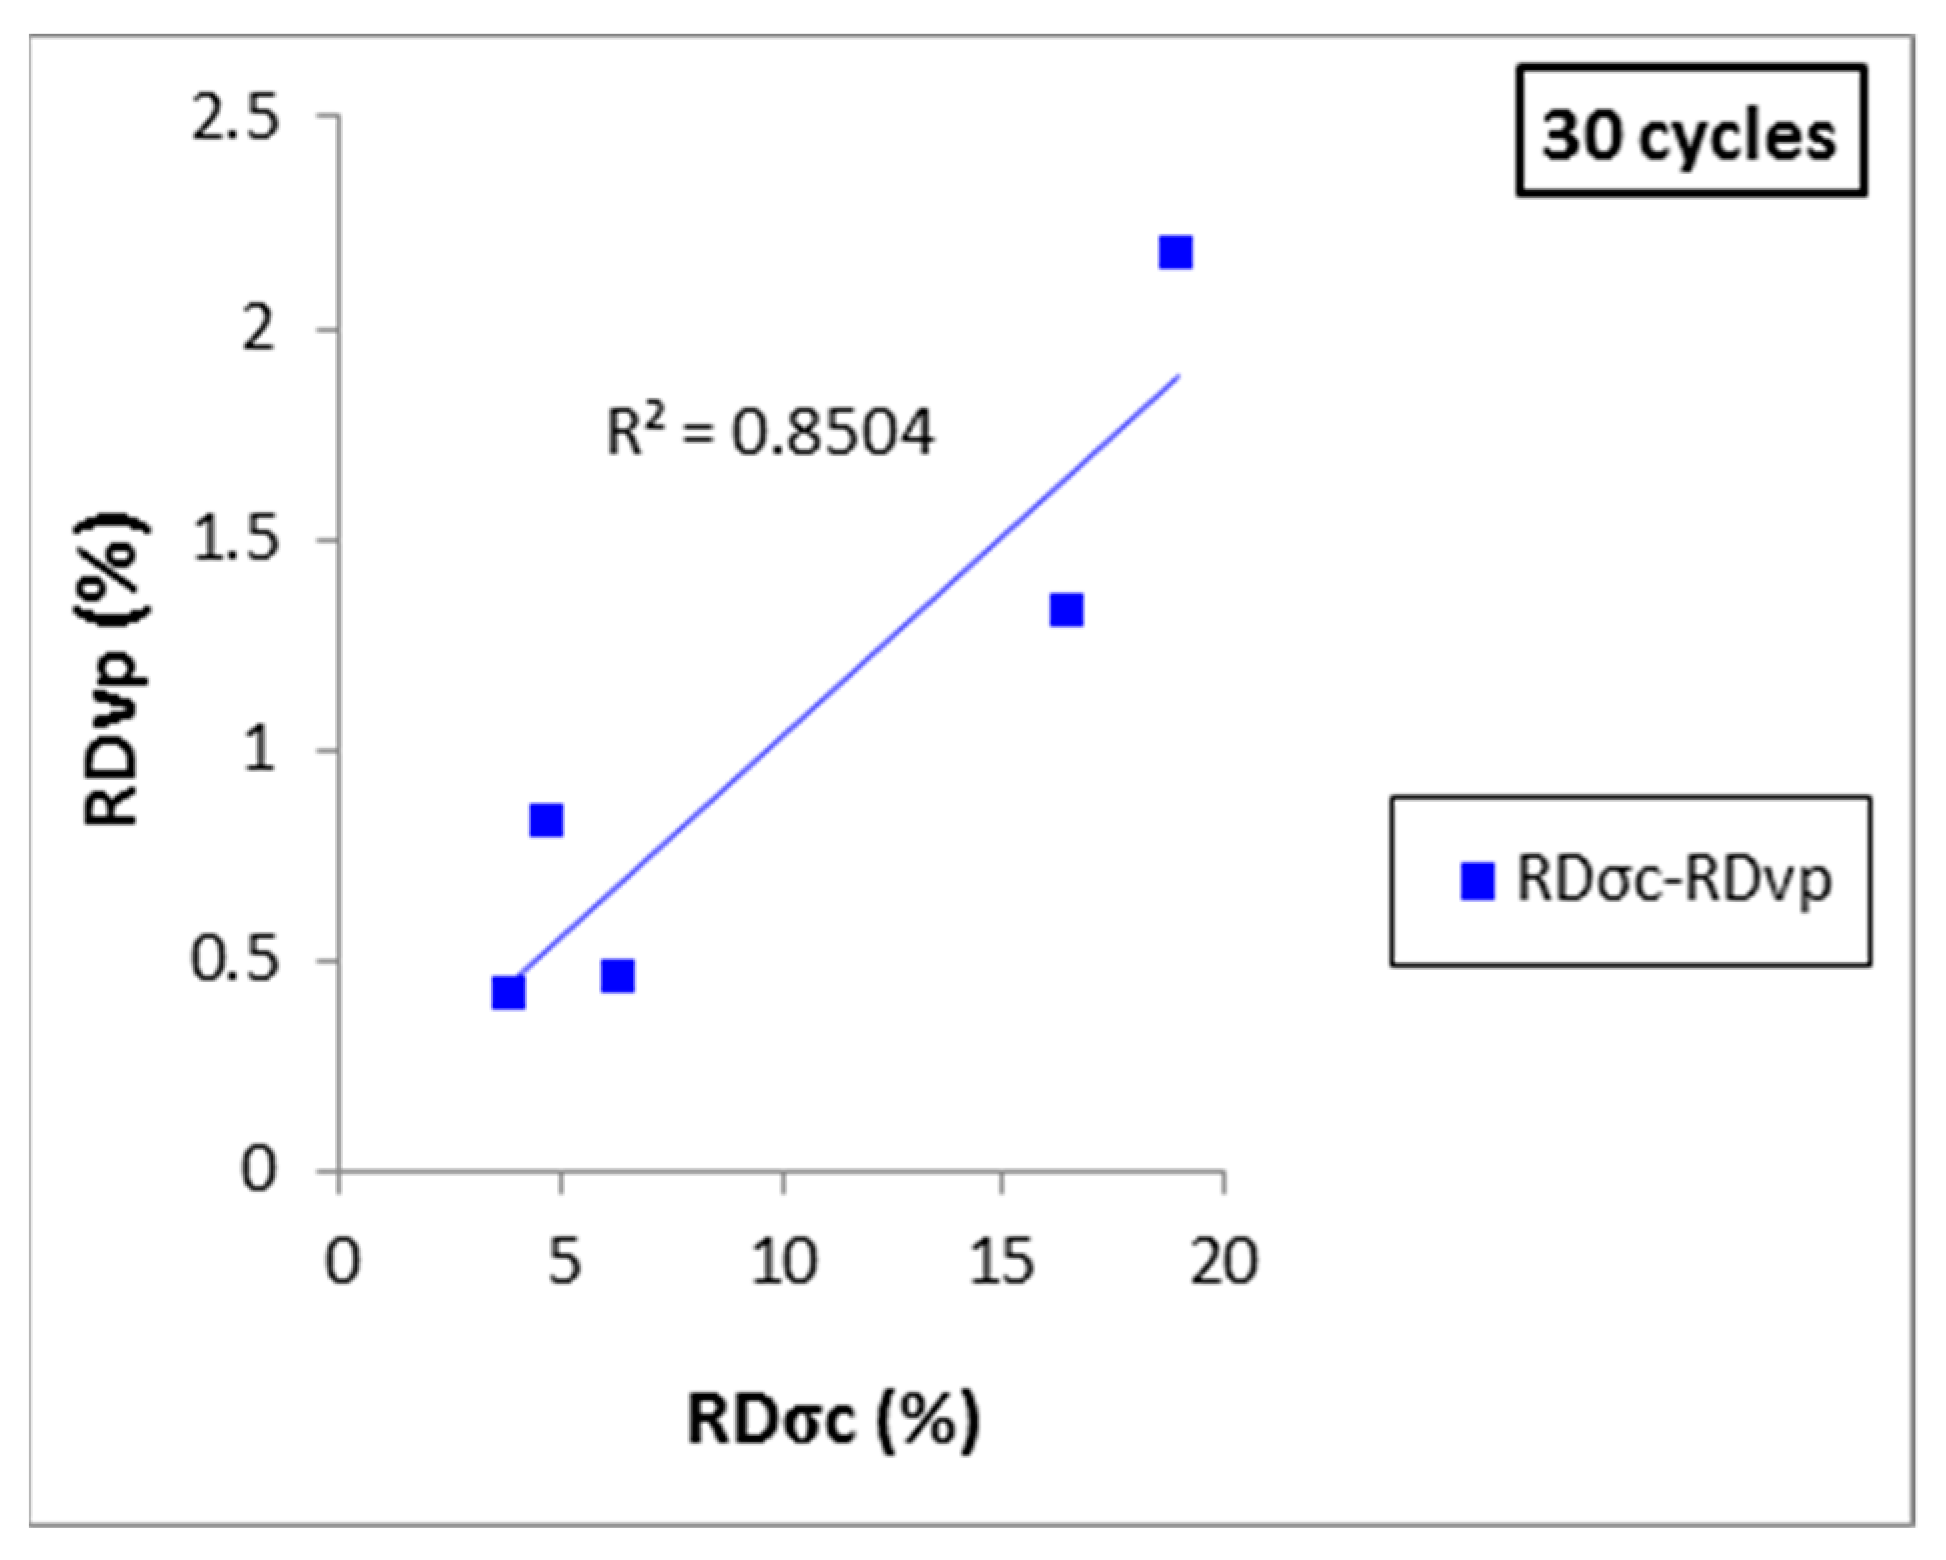
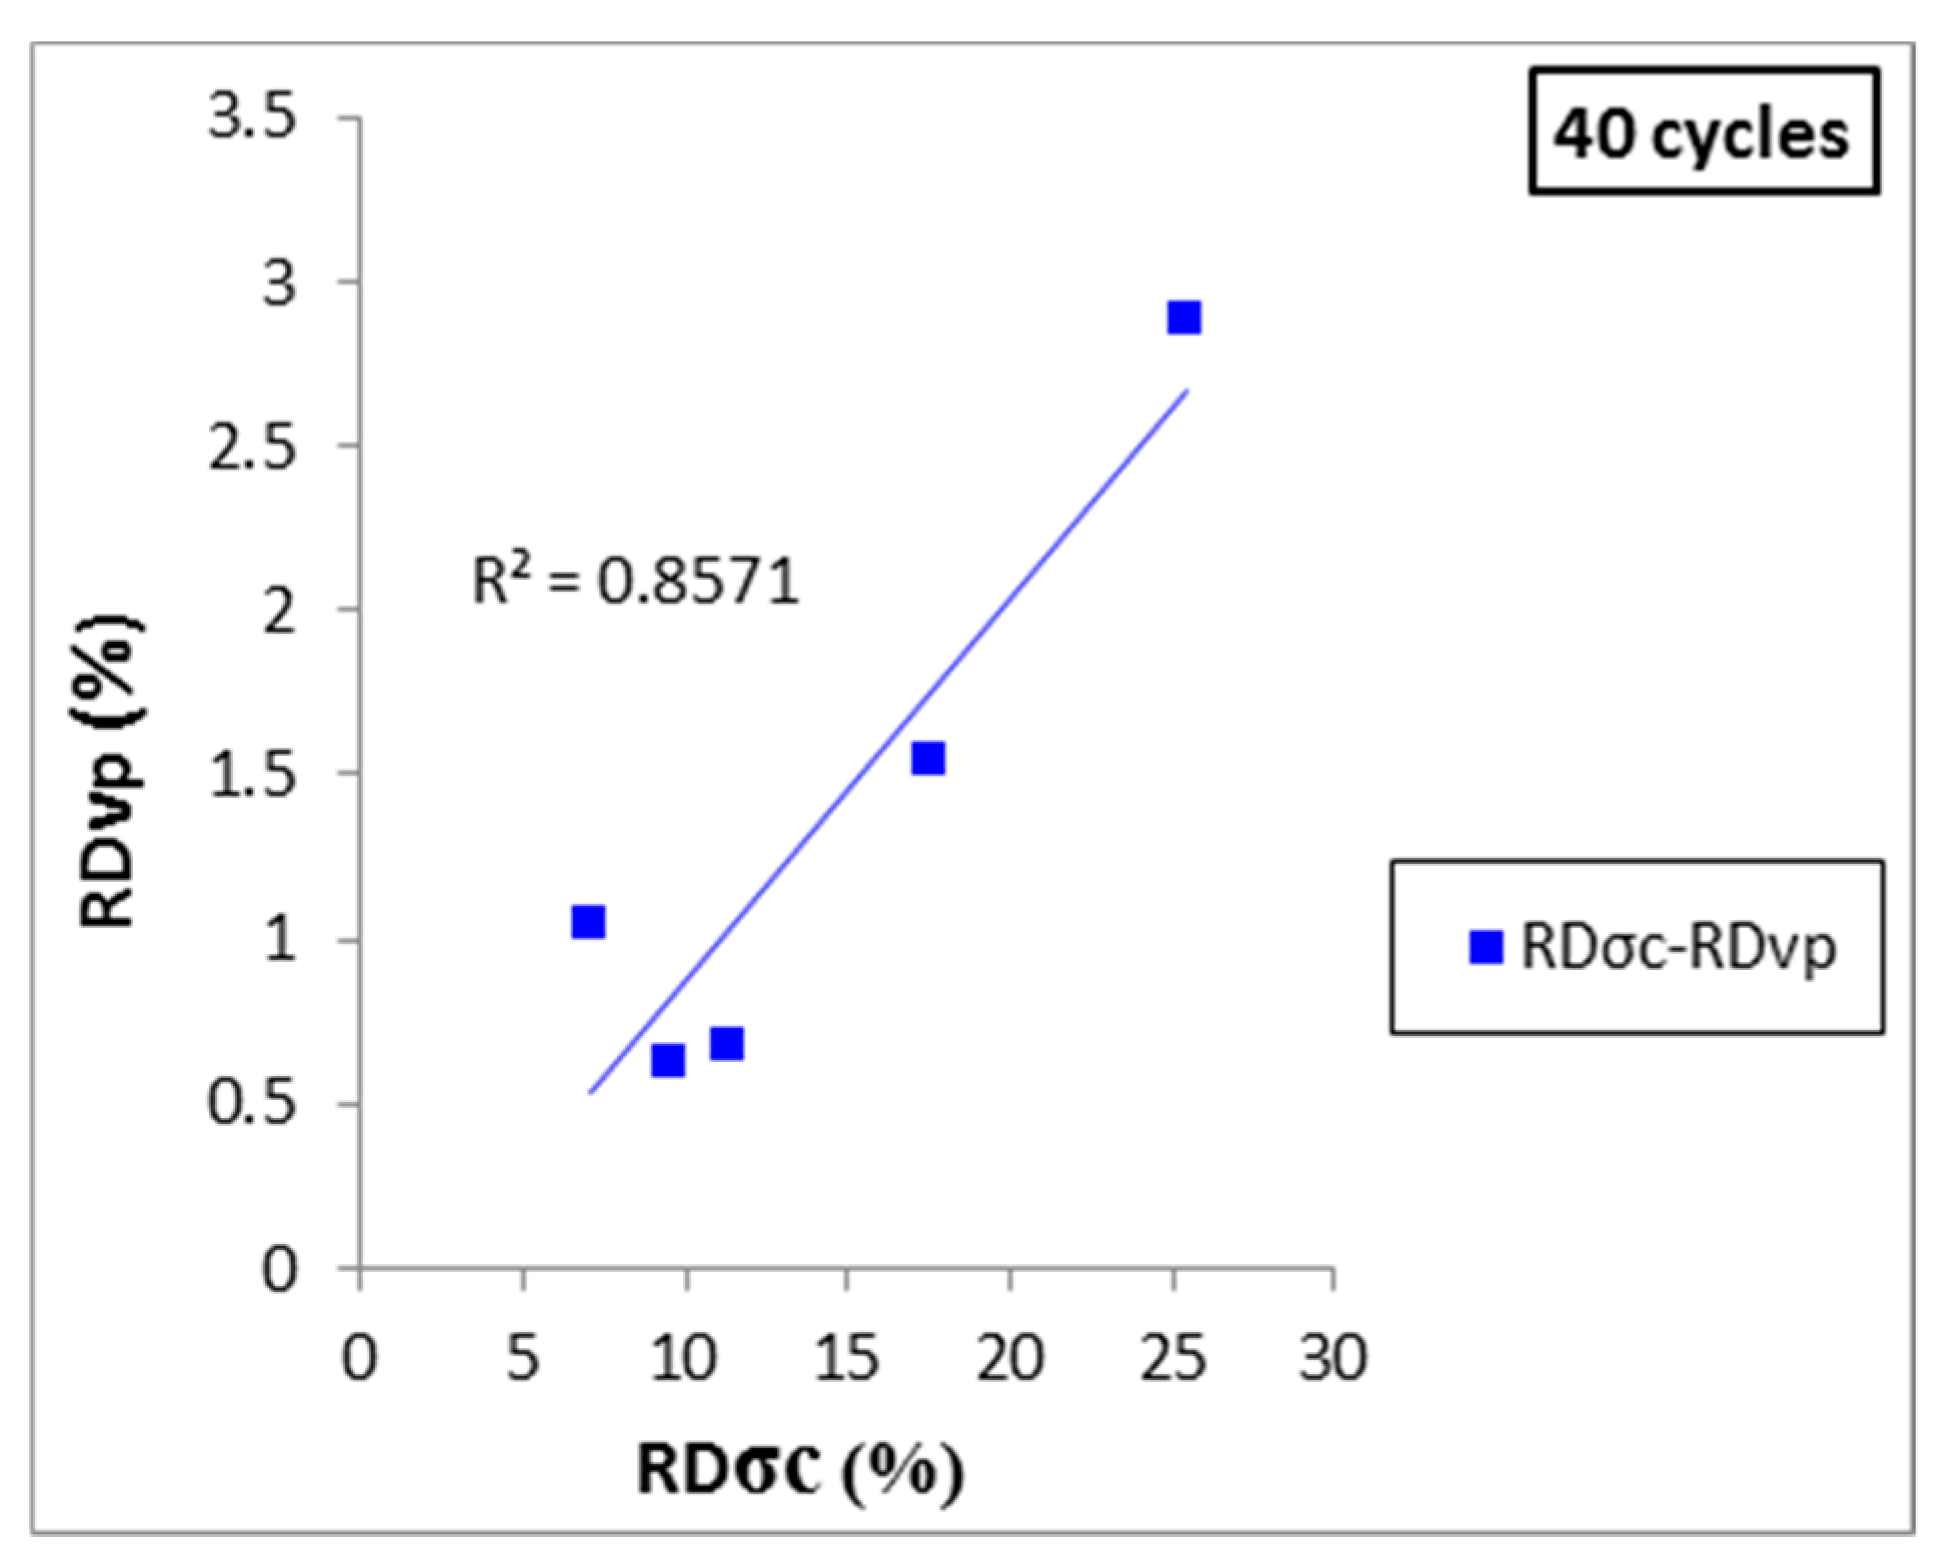
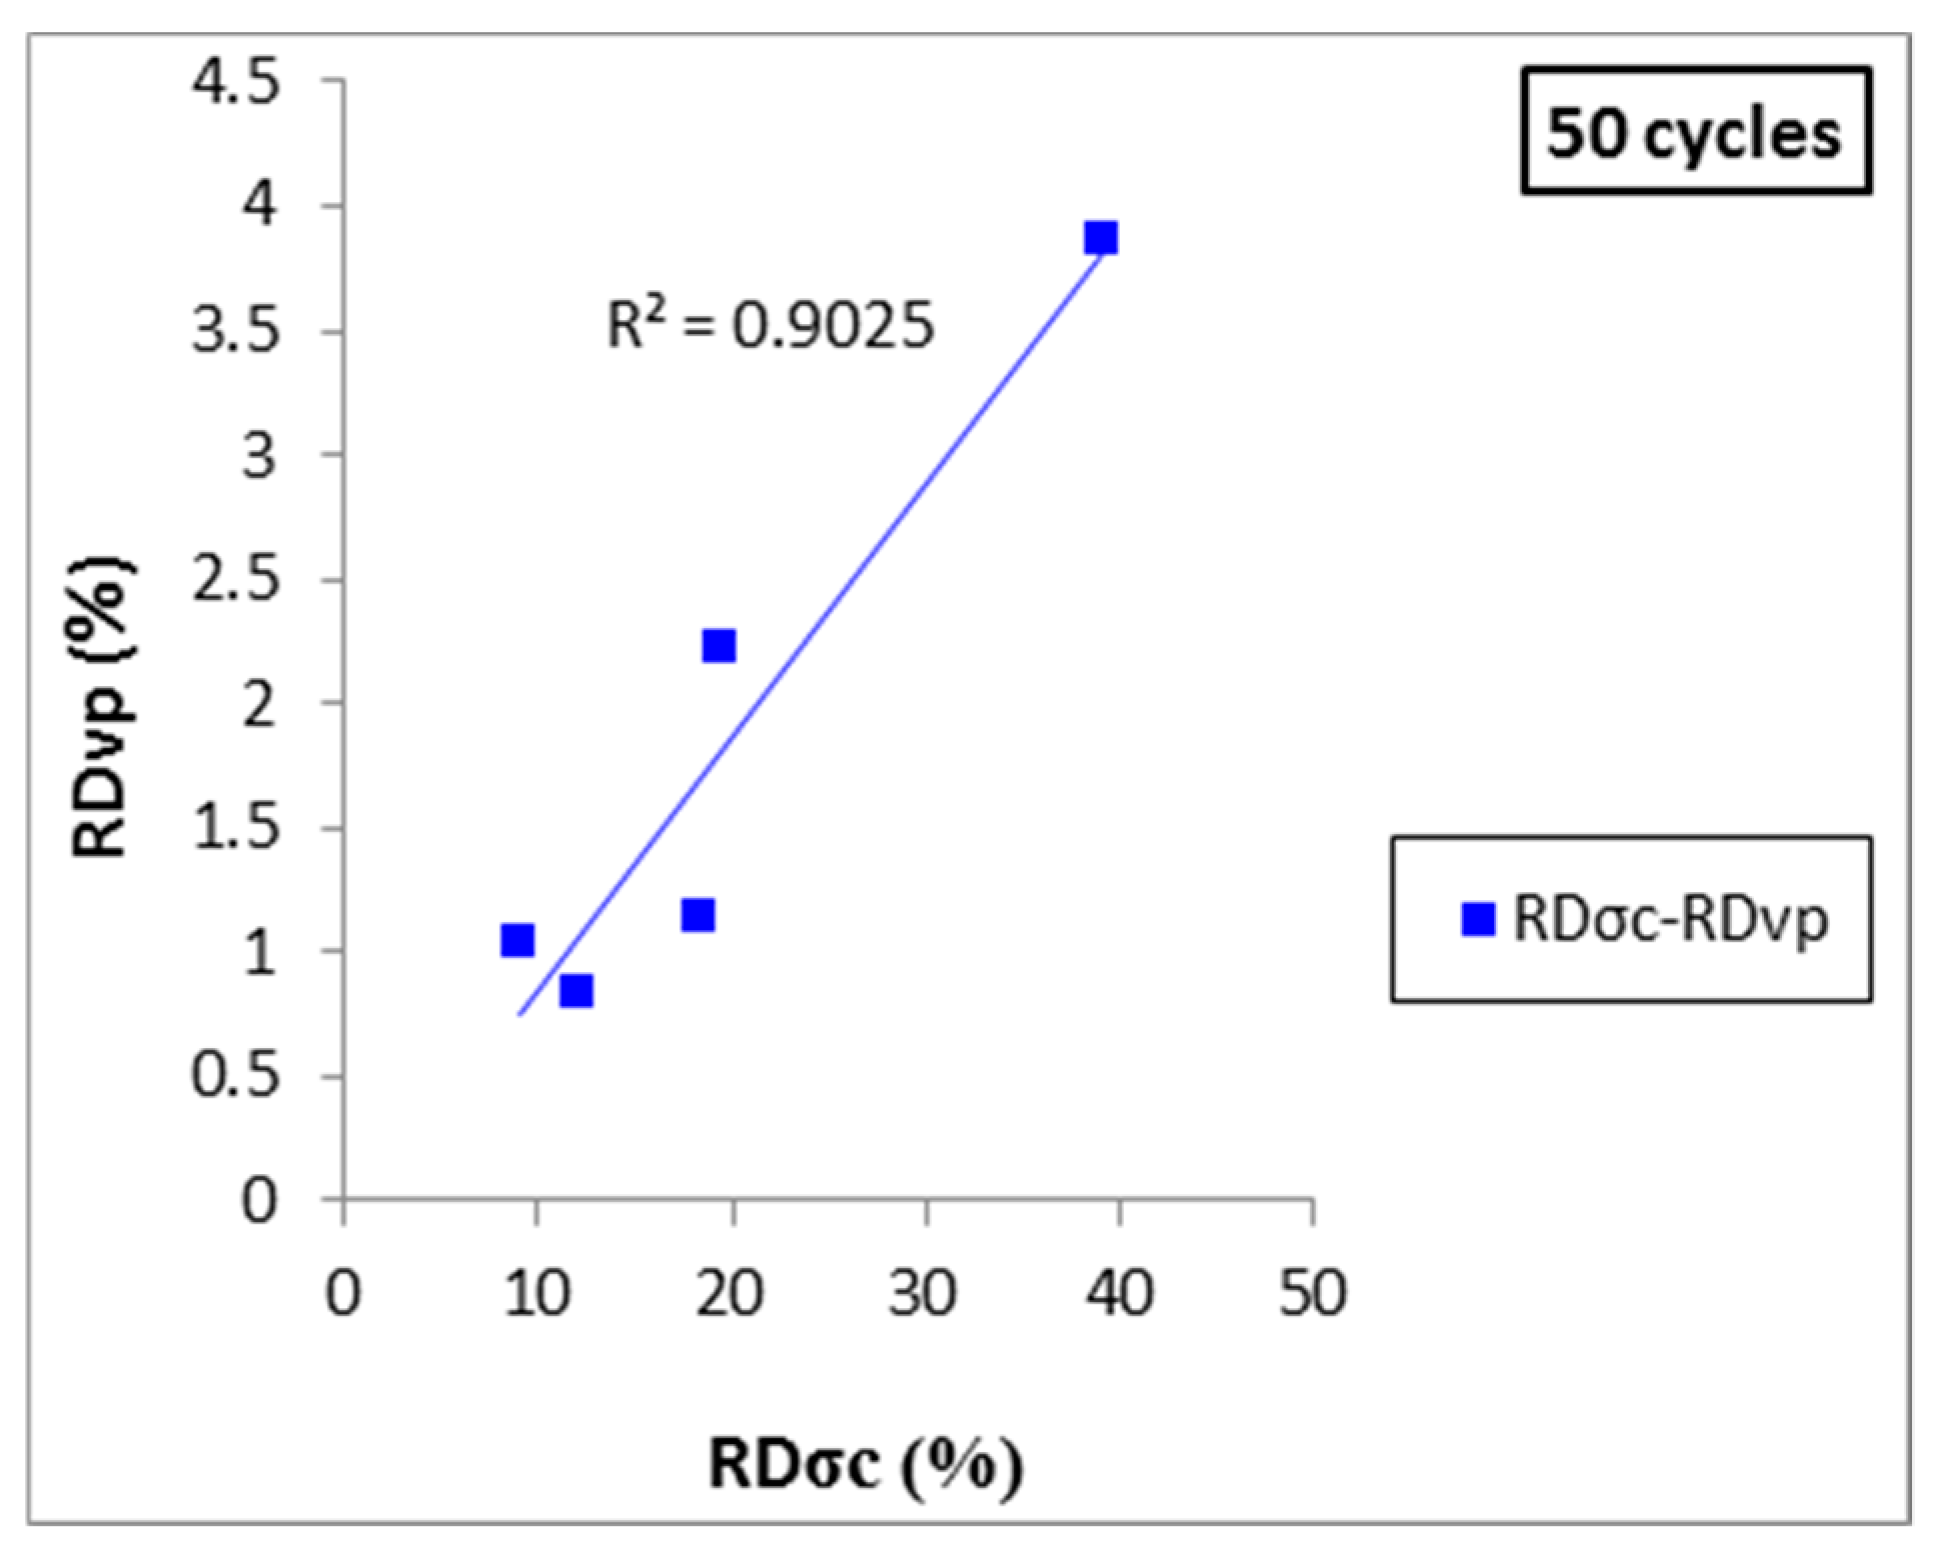
Relationtionships Evolution between RDσc and Limestone Properties Variations
4. Conclusions
Author Contributions
Funding
Acknowledgments
Conflicts of Interest
References
- Yu, J.; Chen, X.; Li, H.; Zhou, J.; Cai, Y. Effect of freeze–thaw cycles on mechanical properties and permeability of red sandstone under triaxial compression. J. Mt. Sci. 2015, 12, 218–231. [Google Scholar] [CrossRef]
- Grossi, C.M.; Brimblecombe, P.; Harris, I. Predicting long term freeze–thaw risks on Europe built heritage and archaeological sites in a changing climate. Sci. Total Environ. 2007, 377, 273–281. [Google Scholar]
- Singer, D.A.; Bliss, J.D. Use of a Probabilistic Neural Network to Reduce Costs of Selecting Construction Rock. Nat. Resour. Res. 2003, 12, 135–140. [Google Scholar] [CrossRef]
- Zhou, Z.; Cai, X.; Chen, L.; Cao, W.; Zhao, Y.; Xiong, C. Influence of cyclic wetting and drying on physical and dynamic compressive properties of sandstone. Eng. Geol. 2017, 220, 1–12. [Google Scholar] [CrossRef]
- Zhou, Z.; Cai, X.; Ma, D.; Chen, L.; Wang, S.; Tan, L. Dynamic tensile properties of sandstone subjected to wetting and drying cycles. Constr. Build. Mater. 2018, 182, 215–232. [Google Scholar] [CrossRef]
- Jamshidi, A.; Nikudel, M.R.; Khamehchiyan, M. Predicting the long-term durability of building stones against freeze–thaw using a decay function model. Cold Reg. Sci. Technol. 2013, 92, 29–36. [Google Scholar] [CrossRef]
- Zhang, S.J.; Lai, Y.M.; Zhang, X.F.; Pu, Y.B.; Yu, W.B. Study on the damage propagation of surrounding rock from a cold-region tunnel under freeze–thaw cycle condition. Tunn. Space. Technol. 2004, 19, 295–302. [Google Scholar] [CrossRef]
- Khanlari, G.; Sahamieh, R.Z.; Abdilor, Y. The effect of freeze—Thaw cycles on physical and mechanical properties of Upper Red Formation sandstones, central part of Iran. Arab J. Geosci. 2015, 8, 5991–6001. [Google Scholar] [CrossRef]
- Jamshidi, A.; Nikudel, M.R.; Khamehchiyan, M. Evaluation of the durability of Gerdoee travertine after freeze–thaw cycles in fresh water and sodium sulfate solution by decay function models. Eng. Geol. 2016, 202, 36–43. [Google Scholar] [CrossRef]
- Takarli, M.; Prince, W.; Siddique, R. Damage in granite under heating/cooling cycles and water freeze–thaw condition. Int. J. Rock Mech. Min. Sci. 2008, 45, 1164–1175. [Google Scholar] [CrossRef]
- Tuğrul, A. The effect of weathering on the pore geometry and compressive strength of selected rock types from Turkey. Eng. Geol. 2004, 75, 215–227. [Google Scholar] [CrossRef]
- Chen, T.C.; Yeung, M.R.; Mori, N. Effect of water saturation on deterioration of welded tuff due to freeze–thaw action. Cold Reg. Sci. Technol. 2004, 38, 127–136. [Google Scholar] [CrossRef]
- Bayram, F. Predicting mechanical strength loss of natural stones after freeze–thaw in cold regions. Cold Reg. Sci. Technol. 2012, 83–84, 98–102. [Google Scholar] [CrossRef]
- Fort, R.; Alvarez de Buergo, M.; Perez-Monserrat, E.M. Nondestructive testing for the assessment of granite decay in heritage structures compared to quarry stone. Int. J. Rock Mech. Min. Sci. 2013, 61, 296–305. [Google Scholar] [CrossRef]
- Martínez-Martínez, J.; Benavente, D.; García-del-Cura, M.A. Spatial attenuation: The most sensitive ultrasonic parameter for detecting petrographic features and decay processes in carbonate rocks. Eng. Geol. 2011, 119, 84–95. [Google Scholar] [CrossRef]
- Martínez-Martínez, J.; Benavente, D.; Gomez-Heras, M.; Marco-Castaño, L.; García-del-Cura, M.A. Non-linear decay of building stones during freeze–thaw weathering processes. Constr. Build. Mater. 2013, 38, 443–454. [Google Scholar] [CrossRef]
- Hashemi, M.; Goudarzi, M.B.; Bashiri, A.; Jamshidi, A. Experimental investigation on the performance of Schmidt hammer test in durability assessment of carbonate building stones against freeze–thaw weathering. Environ. Earth Sci. 2018, 77, 684. [Google Scholar] [CrossRef]
- Yavuz, H.; Altindag, R.; Sarac, S.; Ugur, I.; Sengun, N. Estimating the index properties of deteriorated carbonate rocks due to freeze–thaw and thermal shock weathering. Int. J. Rock Mech. Min. Sci. 2006, 43, 767–775. [Google Scholar] [CrossRef]
- Saad, A.; Guedon, S.; Martineau, F. Microstructural Weathering of Sedimentary Rocks by Freeze—Thaw Cycles: Experimental Study of State and Transfer Parameters. Comptes. Rendus Geosci. 2010, 342, 197–203. [Google Scholar] [CrossRef]
- Karaca, Z.; Oztank, N.; Gokce, M.V.; Elci, H. Effects of Surface-Finishing Forms and Cement-Filling on Porous Dimension Limestone Deterioration in Cold Regions. Cold Reg. Sci. Technol. 2011, 68, 124–129. [Google Scholar] [CrossRef]
- Tan, X.; Chen, W.; Tian, H.; Cao, J. Laboratory Investigations on the Mechanical Properties Degradation of Granite under Freeze—Thaw Cycles. Cold Reg. Sci. Technol. 2011, 68, 130–138. [Google Scholar] [CrossRef]
- Mutluturk, M.; Altindag, R.; Turk, G. A decay function model for the integrity loss of rock when subjected to recurrent cycles of freezing–thawing and heating–cooling. Int. J. Rock Mech. Min. Sci. 2004, 41, 237–244. [Google Scholar] [CrossRef]
- Sousa, L.M.O.; Suarez del Rio, L.M.; Calleja, L.; Ruiz de Argondona, V.G.; Rey, A.R. Influence of microfractures and porosity on the physico-mechanical properties and weathering of ornamental granites. Eng. Geol. 2005, 77, 153–168. [Google Scholar] [CrossRef]
- Baud, P.; Wong, T.F.; Zhu, W. Effects of porosity and crack density on the compressive strength of rocks. Int. J. Rock Mech. Min. Sci. 2014, 67, 202–2011. [Google Scholar] [CrossRef]
- Momeni, A.; Abdilor, Y.; Khanlari, G.; Heidari, M.; Sepahi, A. The effect of freeze—Thaw cycles on physical and mechanical properties of granitoid hard rocks. Bull. Eng. Geol. Environ. 2016, 75, 1649–1656. [Google Scholar] [CrossRef]
- Ghobadi, M.H.; Babazadeh, R. Experimental studies on the effects of cyclic freezing—Thawing, salt crystallization, and thermal shock on the physical and mechanical characteristics of selected sandstones. Rock Mech. Rock. Eng. 2015, 48, 1001–1016. [Google Scholar] [CrossRef]
- Iñigo, A.C.; García-Talegón, J.; Vicente-Tavera, S.; Martín-González, S.; Casado-Marína, S.; Vargas-Muñoz, M.; Pérez-Rodríguez, J.L. Colour and ultrasound propagation speed changes by different ageing of freezing/thawing and cooling/heating in granitic materials. Cold Reg. Sci. Technol. 2013, 85, 71–78. [Google Scholar] [CrossRef]
- Liu, Q.; Huang, S.; Kang, Y.; Liu, X. A prediction model for uniaxial compressive strength of deteriorated rocks due to freeze–thaw. Cold Reg. Sci. Technol. 2015, 120, 96–107. [Google Scholar] [CrossRef]
- Diamantis, K.; Gartzos, E.; Migiros, G. Study on uniaxial compressive strength, point load strength index, dynamic and physical properties of serpentinites from Central Greece: Test results and empirical relations. Eng. Geol. 2009, 108, 199–207. [Google Scholar] [CrossRef]
- Xu, G.; Liu, Q. Analysis of mechanism of rock failure due to freeze–thaw cycling and mechanical testing study on frozen-thawed rocks. Chin. J. Rock Mech. Eng. 2005, 17, 3076–3082. [Google Scholar]
- Hale, P.A.; Shakoor, A. A laboratory investigation of the effects of cyclic heating and cooling, wetting and drying and freezing and thawing on the compressive strength of selected sandstones. Environ. Eng. Geosci. 2003, 9, 117–130. [Google Scholar] [CrossRef]
- Yavuz, A.B.; Akal, C.; Turk, N.; Colak, M.; Tanyu, B.F. Investigation of discrepancy between tuff used as building stones in historical and modern buildings in western Turkey. Constr. Build. Mater. 2015, 93, 439–448. [Google Scholar] [CrossRef]
- Fener, M.; Ince, I. Effects of the freeze–thaw (F–T) cycle on the andesitic rocks (Sille-Konya/Turkey) used in construction building. J. Afr. Earth Sci. 2015, 109, 96–106. [Google Scholar] [CrossRef]
- National Development and Reform Commission of the People’s Republic of China, Code for Rock Tests of Hydroelectric and Water Conservancy Engineering (DL/T 5368-2007); National Development and Reform Commission of the People’s Republic of China: Beijing, China, 2007; pp. 11–12.
- Zhou, Y.X.; Xia, K.; Li, X.B.; Li, H.B.; Ma, G.W.; Zhao, J.; Zhou, Z.L.; Dai, F. Suggested methods for determining the dynamic strength parameters and mode-I fracture toughness of rock materials. Int. J. Rock Mech. Min. Sci. 2014, 35–44. [Google Scholar] [CrossRef]
- Zhou, Z.; Cai, X.; Li, X.; Cao, W.; Du, X. Dynamic response and energy evolution of sandstone under coupled static–dynamic compression: Insights from experimental study into deep rock engineering applications. Rock Mech. Rock. Eng. 2019, 1–27. [Google Scholar] [CrossRef]
- Kou, M.; Liu, X.; Tang, S.; Wang, Y. 3-D X-ray computed tomography on failure characteristics of rock-like materials under coupled hydro-mechanical loading. Theor. Appl. Fracture Mech. 2019, 104, 102396. [Google Scholar] [CrossRef]
- ISRM; Ulusay, R.; Hudson, J. (Eds.) The Complete ISRM Suggested Methods for Rock Characterization, Testing and Monitoring (1974–2006). Int. Soc. Rock Mech. 2007. [Google Scholar]
- Fairhurst, C.E.; Hudson, J.A. Draft ISRM suggested method for the complete stress strain curve for intact rock in uniaxial compression. Int. J. Rock Mech. Min. Sci. 1999, 36, 279–289. [Google Scholar]
- ISRM. Rock Characterization, Testing, and Monitoring. ISRM Suggested Methods; Pergamon Press: Oxford, UK, 1981. [Google Scholar]
- Cai, X.; Zhou, Z.; Liu, K.; Du, X.; Zang, H. Water-weakening effects on the mechanical behavior of different rock types: Phenomena and mechanisms. Appl. Sci. 2019, 9, 4450. [Google Scholar] [CrossRef]
- Sarici, D.E.; and Ozdemir, E. Determining point load strength loss from porosity, Schmidt hardness, and weight some sedimentary rocks under freeze–thaw conditions. Environ. Earth Sci. 2018, 77, 62. [Google Scholar] [CrossRef]
- Sun, H.; Sun, Q.; Deng, W.; Zhang, W.; Lü, C. Temperature effect on microstructure and P-wave propagation in Linyi sandstone. Appl. Therm. Eng. 2017, 115, 913–922. [Google Scholar] [CrossRef]
- Mokhtari, M.; Behnia, M. Comparison of LLNF, ANN, and COA-ANN Techniques in Modeling the Uniaxial Compressive Strength and Static Young’s Modulus of Limestone of the Dalan Formation. Nat. Resour. Res. 2019, 28, 223–239. [Google Scholar] [CrossRef]
- Ruedrich, J.; Kirchner, D.; Siegesmund, S. Physical weathering of building stones induced by freeze-thaw action: A laboratory long-term study. Environ. Earth Sci. 2011, 63, 1573–1586. [Google Scholar] [CrossRef]
- De Kock, T.; Turmel, A.; Fronteau, G.; Cnudde, V. Rock fabric heterogeneity and its influence on the petrophysical properties of a building limestone: Lede stone (Belgium) as an example. Eng. Geol. 2017, 216, 31–41. [Google Scholar] [CrossRef]
- Erguvanli, K. Engineering Geology; Sec Publication: Istanbul, Turkey, 1995; Volume 43. [Google Scholar]


| Rock Type | Code | Mineralogical Composition | Photomicrograph |
|---|---|---|---|
| Limestone.1 | CK-H1 |  |  |
| Limestone.2 | ZK01-H1 |  |  |
| Limestone.3 | ZK01-H2 |  |  |
| Limestone.4 | ZK02-H1 |  |  |
| Limestone.5 | ZK02-H2 |  |  |
| Rock Type | Code | ρb | Wa | Pe | Vp | αs | σc |
|---|---|---|---|---|---|---|---|
| (Gr/cm3) | (%) | (%) | (km/s) | (dB/cm) | (MPa) | ||
| Limestone 1 | CK-H1 | 2.61 | 0.05 | 0.13 | 4.81 | 3.0 | 92.4 |
| Limestone 2 | ZK01-H1 | 2.61 | 0.13 | 0.32 | 4.76 | 3.23 | 83.70 |
| Limestone 3 | ZK01-H2 | 2.59 | 0.31 | 0.78 | 4.15 | 3.99 | 53.80 |
| Limestone 4 | ZK02-H1 | 2.60 | 0.26 | 0.65 | 4.39 | 3.56 | 69.70 |
| Limestone 5 | ZK02-H2 | 2.60 | 0.15 | 0.39 | 4.51 | 3.38 | 72.0 |
| Unconfined Compressive Strength σc (Mpa) | ||||||||||
|---|---|---|---|---|---|---|---|---|---|---|
| Cycles | 10 | 20 | 30 | 40 | 50 | |||||
| Mean | SD | Mean | SD | Mean | SD | Mean | SD | Mean | SD | |
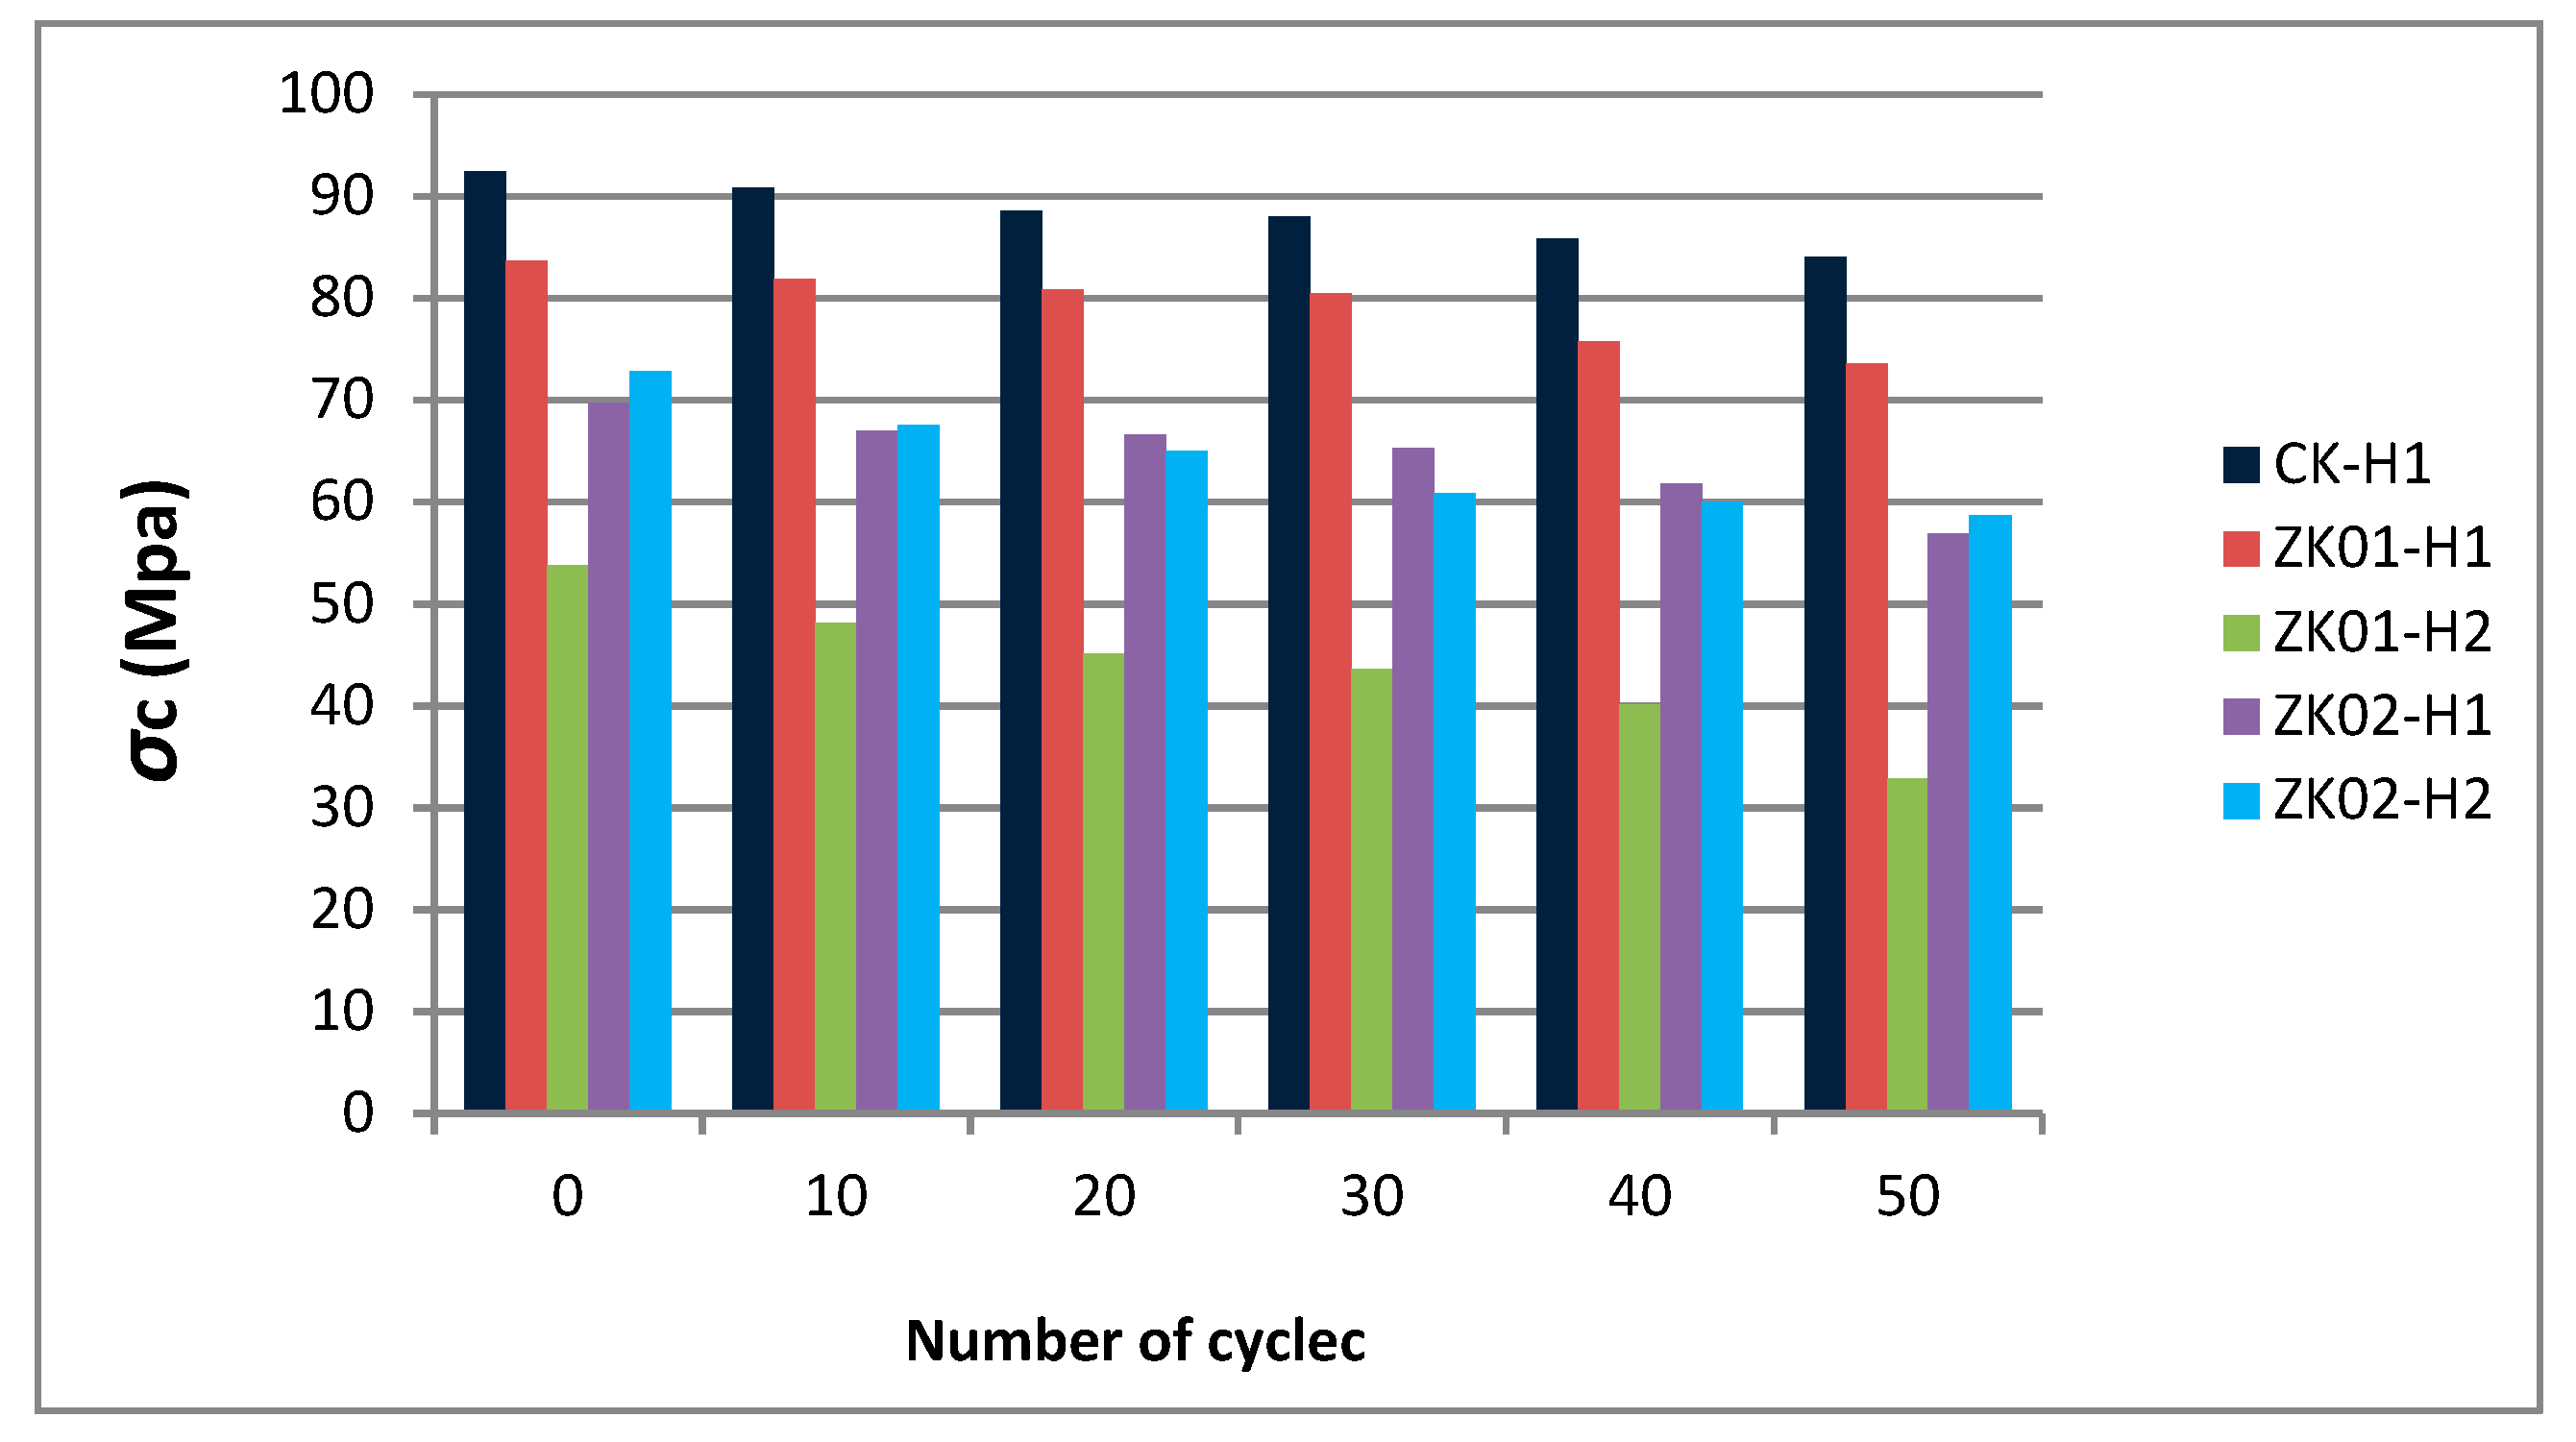
| CK-H1 | 90.8 | 10.2 | 88.6 | 11.1 | 88.0 | 8.6 | 85.8 | 12.3 | 84.0 | 13.1 |
| ZK01-H1 | 81.9 | 8.9 | 80.8 | 10.8 | 80.5 | 11.7 | 75.7 | 13.8 | 73.6 | 13.4 |
| ZK01-H2 | 48.1 | 11.9 | 45.1 | 12.6 | 43.6 | 13.8 | 40.1 | 10.2 | 32.8 | 14.6 |
| ZK02-H1 | 67.0 | 14.6 | 66.6 | 13.2 | 65.3 | 14.9 | 61.8 | 13.6 | 56.9 | 15.6 |
| ZK02-H2 | 67.5 | 12.3 | 65.0 | 13.9 | 60.8 | 10.6 | 60.0 | 14.1 | 58.7 | 11.5 |
| Effective Porosity Pe (%) | ||||||||||
|---|---|---|---|---|---|---|---|---|---|---|
| Cycles | 10 | 20 | 30 | 40 | 50 | |||||
| Mean | SD | Mean | SD | Mean | SD | Mean | SD | Mean | SD | |
| CK-H1 | 0.15 | 0.02 | 0.17 | 0.01 | 0.17 | 0.03 | 0.20 | 0.01 | 0.22 | 0.04 |
| ZK01-H1 | 0.39 | 0.03 | 0.47 | 0.04 | 0.55 | 0.06 | 0.60 | 0.03 | 0.67 | 0.06 |
| ZK01-H2 | 1.05 | 0.05 | 1.24 | 0.07 | 1.39 | 0.04 | 1.51 | 0.07 | 1.70 | 0.08 |
| ZK02-H1 | 0.78 | 0.02 | 0.88 | 0.03 | 1.04 | 0.05 | 1.10 | 0.04 | 1.26 | 0.06 |
| ZK02-H2 | 0.46 | 0.01 | 0.53 | 0.03 | 0.60 | 0.05 | 0.65 | 0.03 | 0.73 | 0.05 |
| Compressional Wave Velocity Vp (km/s) | ||||||||||
|---|---|---|---|---|---|---|---|---|---|---|
| Cycles | 10 | 20 | 30 | 40 | 50 | |||||
| Mean | SD | Mean | SD | Mean | SD | Mean | SD | Mean | SD | |
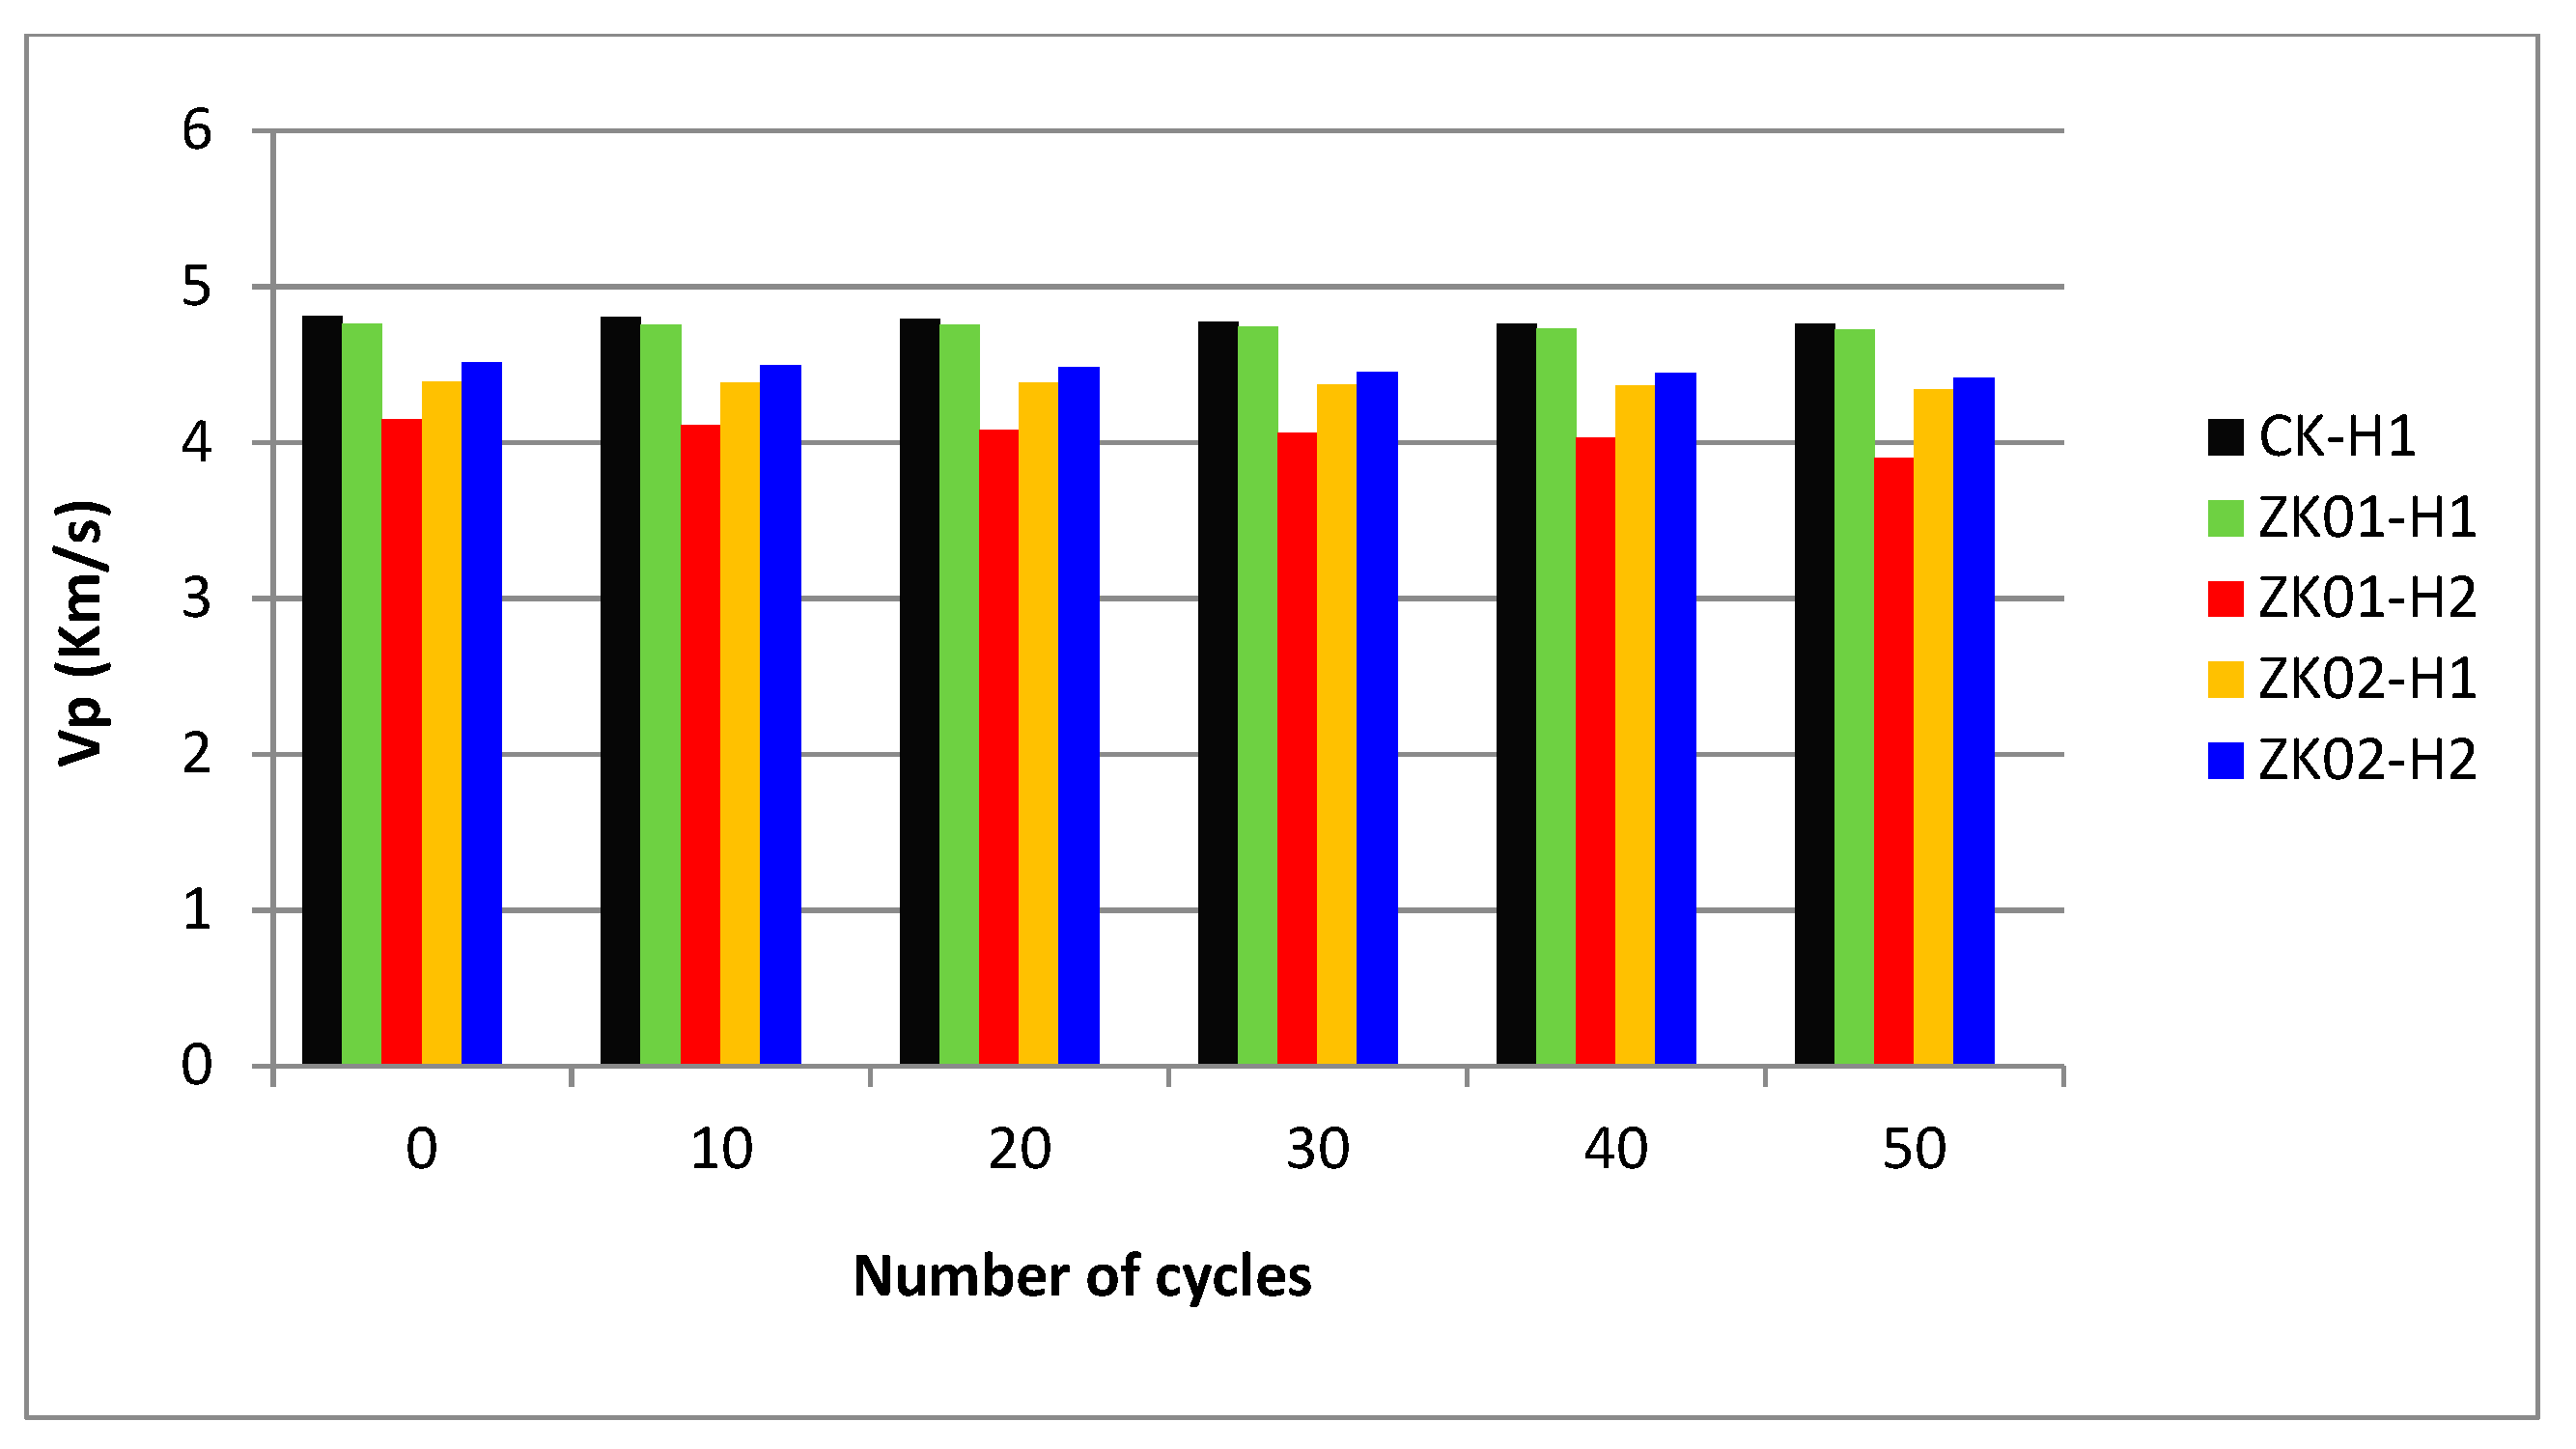
| CK-H1 | 4.80 | 0.11 | 4.79 | 0.13 | 4.77 | 0.12 | 4.73 | 0.15 | 4.76 | 0.18 |
| ZK01-H1 | 4.75 | 0.10 | 4.75 | 0.12 | 4.74 | 0.14 | 4.73 | 0.11 | 4.72 | 0.15 |
| ZK01-H2 | 4.11 | 0.13 | 4.08 | 0.15 | 4.06 | 0.16 | 4.03 | 0.14 | 3.9 | 0.15 |
| ZK02-H1 | 4.38 | 0.09 | 4.38 | 0.10 | 4.37 | 0.12 | 4.36 | 0.11 | 4.34 | 0.14 |
| ZK02-H2 | 4.49 | 0.14 | 4.48 | 0.12 | 4.45 | 0.15 | 4.44 | 0.17 | 4.41 | 0.19 |
| Spatial Attenuation αs (dB/cm) | ||||||||||
|---|---|---|---|---|---|---|---|---|---|---|
| Cycles | 10 | 20 | 30 | 40 | 50 | |||||
| Mean | SD | Mean | SD | Mean | SD | Mean | SD | Mean | SD | |
| CK-H1 | 3.02 | 0.01 | 3.04 | 0.02 | 3.05 | 0.04 | 3.07 | 0.01 | 3.08 | 0.05 |
| ZK01-H1 | 3.26 | 0.03 | 3.28 | 0.05 | 3.31 | 0.06 | 3.33 | 0.05 | 3.35 | 0.06 |
| ZK01-H2 | 4.04 | 0.01 | 4.08 | 0.03 | 4.13 | 0.02 | 4.17 | 0.04 | 4.22 | 0.07 |
| ZK02-H1 | 3.59 | 0.02 | 3.61 | 0.04 | 3.64 | 0.03 | 3.65 | 0.04 | 3.68 | 0.05 |
| ZK02-H2 | 3.40 | 0.03 | 3.43 | 0.01 | 3.47 | 0.04 | 3.52 | 0.05 | 3.544 | 0.07 |
© 2020 by the authors. Licensee MDPI, Basel, Switzerland. This article is an open access article distributed under the terms and conditions of the Creative Commons Attribution (CC BY) license (http://creativecommons.org/licenses/by/4.0/).
Share and Cite
Abdelhamid, M.M.A.; Li, D.; Ren, G. Predicting Unconfined Compressive Strength Decrease of Carbonate Building Materials against Frost Attack Using Nondestructive Physical Tests. Sustainability 2020, 12, 1379. https://doi.org/10.3390/su12041379
Abdelhamid MMA, Li D, Ren G. Predicting Unconfined Compressive Strength Decrease of Carbonate Building Materials against Frost Attack Using Nondestructive Physical Tests. Sustainability. 2020; 12(4):1379. https://doi.org/10.3390/su12041379
Chicago/Turabian StyleAbdelhamid, Marzouk Mohamed Aly, Dong Li, and Gaofeng Ren. 2020. "Predicting Unconfined Compressive Strength Decrease of Carbonate Building Materials against Frost Attack Using Nondestructive Physical Tests" Sustainability 12, no. 4: 1379. https://doi.org/10.3390/su12041379
APA StyleAbdelhamid, M. M. A., Li, D., & Ren, G. (2020). Predicting Unconfined Compressive Strength Decrease of Carbonate Building Materials against Frost Attack Using Nondestructive Physical Tests. Sustainability, 12(4), 1379. https://doi.org/10.3390/su12041379