Article

Analysis of Early Warning Spatial and Temporal Differences of Tourism Carrying Capacity in China’s Island Cities

1
China (Zhejiang) Pilot Free Trade Zone Research Institute, Zhejiang Ocean University, Zhoushan 316000, China
2
College of International Entrepreneurship, National Kunsan University, Kunsan 54150, Korea
3
School of economics and management, Zhejiang Ocean University, Zhoushan 316000, China
4
Institute of Education, Wonkwang University, Iksan-si 54538, Korea
*
Authors to whom correspondence should be addressed.
Sustainability 2020, 12(4), 1328; https://doi.org/10.3390/su12041328
Submission received: 3 January 2020 / Revised: 5 February 2020 / Accepted: 10 February 2020 / Published: 12 February 2020
(This article belongs to the Special Issue Sustainable Tourism Carrying Capacity)

Abstract

:
Tourism is the leading industry of island cities and the tourism carrying capacity is of great significance to the sustainable development of cities. This paper adopts the state-space model to construct an early warning indicator system for tourism carrying capacity from three aspects: nature, economy, and society, explores the early warning status, and spatial and temporal differences of tourism carrying capacity in Chinese island cities, and makes use of the BP(Back Propagation) neural network model to predict the development trend of early warnings. The results show that (1) from 2012 to 2018, the early warning status of China’s island cities’ tourism carrying capacity is generally on the rise, the natural carrying capacity system’s early warning situation has deteriorated, which is in a state of severe warning interval. The economic carrying capacity and social carrying capacity are on the rise, and the warning degree is from the super warning interval to the severe warning interval and then to the moderate warning degree. The forecast of the overall tourism carrying capacity early warning index from 2019 to 2021 presents an upward trend and is in the moderate warning interval. (2) The tourism carrying capacity early warning in China’s island cities shows a large spatial and temporal difference and the early warning values of each island city are different. The early warning value of Putuo tourism carrying capacity always ranks first, and Changdao has the worst performance. (3) In accordance with the contribution status of the subsystem to the total system, the Chinese island cities show regional differences in the northern, central, and southern area, showing two forms of pressure cities and pressure-carrying cities. The government can adopt different policies and measures in accordance with different characteristics of human environmental activities.

1. Introduction

An island is a geographical area that is made up of a small piece of land surrounded by sea areas, while an island city is the ecological, administrative, and economic entities that are made up of a number of islands and surrounding seas. Compared with inland cities and coastal cities, besides the natural environment characteristics, such as less land area, scarce fresh water resources, and rich marine resources [1], island cities also have other social environment characteristics, such as fragile ecological environment and single industrial structure, which is characterized by a complicated “people–sea–land” coupling system [2]. In general, island cities are relatively isolated from land and become a special type of regional unit. These special areas are called island counties, which are the most basic administrative area in Chinese urban management. There are 12 county-level island cities in mainland China. Along the 18,000 km continental coastline, they are distributed in the four areas of the Bo Sea, Yellow Sea, East China Sea, and South China Sea. The special natural conditions and industrial characteristics of island cities have unique development models and paths [3]. Tourism is the leading industry of island cities. This type of industry makes full use of island resources, such as seawater, beaches, marine life, and the extended marine culture. Thus, island tourism not only involves a certain scenic area, but also an urban tourism system that includes islands and sea areas. However, the special ecological environment of island cities means that their industrial development must meet the island’s carrying capacity [4]. The development and evolution of the tourism industry in island cities and their interaction with resources and the environment have become one of the important issues that economic geography is concerned about [5,6]. Objectively assessing the early warning tourism carrying capacity is of great significance to promote the sustainable development of island cities.
The tourism carrying capacity is the combination of the existing state and structure of a certain tourism environment (referring to the tourism environment system). It refers to the tourism behavior and activities that the sightseeing place can bear in a certain period of time [7] without causing any harmful changes to the contemporary people (including tourists and local residents) and future people (such as environmental aesthetic values, ecosystem damage, environmental pollution, and weakening of comfort, etc.). Scientifically evaluating the state of the tourism carrying capacity is a powerful judging basis for the sustainable development of the tourism industry [8]. However, the monitoring of tourism carrying capacity is only the description of the status quo and the key point is to do a good job of early warning and prediction of carrying capacity. Once the human activities deviate from the warning line, an early warning signal is issued, thereby making behavior activities controlled within the bearable range through using management tools.
In recent years, the tourism economy in China’s island areas has experienced rapid development. The coastal tourism revenue has increased from 625.8 billion yuan in 2011 to 1607.8 billion yuan in 2018, with an average annual growth of 11.49%. The coastline’s ability to absorb tourism is not unlimited. If the level of tourists’ recreational activities in island cities exceeds the level of the island’s carrying capacity, the environment will degrade; if the facilities are saturated (exceeding the carrying capacity of providing facilities), and the enjoyment of tourists will decline (perception or social carrying capacity) [9]. However, with the unrestricted exploitation of resources, the contradiction between the increase of demand for island resources and the maintenance of ecological balance is becoming more and more acute. The problems of ecological environment are gradually emerging. The island areas are facing unprecedented pressures and challenges from the ecological environment and social development [2]. Therefore, the tourism carrying capacity in coastal cities has become the focus of scholars’ research, which has also generated a lot of research achievements. In terms of areas of interest, researchers have undertaken empirical research on the tourism carrying capacity in geographical regions, such as the coastal areas [10,11], border on the sea [12,13], coasts [14], sea areas [15], beaches [16,17], and islands [4,18]; in terms of the research methods, the quantitative or quantitative and qualitative combination methods were adopted, such as fuzzy analytic hierarchy process [19], ecological footprint method [20], linear programming [21], simulation and system dynamics [22], geographic information technology [23], etc.; in terms of management tools, there is a driving force-pressure-state-influence-response model [24], tourism carrying capacity early warning system [25], tourist activity management procedures, etc.
Unlike inland areas [26], the characteristics of island tourism destinations are strong demand growth and a large occupation of island space, both of which have a serious influence on the island’s urban environment and society [11]. Thus, currently, the main task is to control and regulate the effectiveness of human activities and balance the conflict between the human and island city natural system so as to achieve sustainable development. Establishing an early warning model of the tourism carrying capacity of island cities and timely monitoring the adaptability of tourism environment will play a significant role in the development of tourism in island cities. From the search of domestic and foreign literature, currently, there are few relevant studies about early warning models of the tourism carrying capacity of island cities. The existing research on early warning of carrying capacity are mostly concerned about wetland parks [27], ocean parks [19], carbon cycle [28], and other broad resources of carrying capacity of the environment [29]; in terms of early warning models and research methods, the method that is consistent with carrying capacity is basically adopted. Some scholars have done further research through improving the existing assessment methods, but most of them stay in the description of the early warning status of a single method. Therefore, there is the urgent need to pay attention to the following three important points: first, it is necessary to establish a set of early warning index system of tourism carrying capacity of island area to objectively reflect the tourism carrying capacity of island area; second, in terms of research methods, it is necessary to pay attention to not only the static tourism carrying capacity, but also the dynamic tourism carrying capacity, that is to say, it is necessary to comprehensively describe the island area tourism carrying capacity in time and space and make a scientific prediction, so that the local governments can grasp the trend of early warning of tourism carrying capacity; the third is to understand the characteristics of regional heterogeneity, which reflect the geographical characteristics and tourism carrying capacity differences of different island areas. These three concerns are also the contribution of this study.
This paper applies the state-space method to construct a three-dimensional early warning model of tourism carrying capacity in three dimensions: natural carrying capacity, economic carrying capacity, and social carrying capacity. The spatial and temporal difference of 10 island-county cities Changhai, Changdao, Shengsi, Putuo, Daishan, Yuhuan, Dongtou, Pingto Tan, Dongshan, and Nan’ao shall be analyzed regarding the 2012–2018 tourism carrying capacity early warning calculation, thereby adopting the BP neural network model to predict the future state of tourism carrying capacity of islands and counties. The purpose of this paper is to reveal the tourism carrying capacity of Chinese island cities, the early warning status of the three subsystems of nature, economy, and society, as well as the differences of different island cities, providing scientific references for the development of island cities’ tourism and the formulation of policies.

2. The Construction of an Early Warning Indicator System and Data Source

2.1. The Construction of an Early Warning Indicator System

On the basis of the research of early warning indicators of carrying capacity and combined with the actual situation of island cities and the acquisition of indicator data, 20 indicators were selected from three aspects of nature, economy, and society so as to construct an early warning system of tourism carrying capacity:
The indicator of natural carrying capacity system indicates the state of the natural resources and environment in the tourism spatial system of island cities. (1) The tourism area of the island is mainly on the coastline, and the beach is the main place for tourists. In this paper, the coastline length per capita [5] and beach area per capita [17] are used to measure the impact of the development of human tourism on natural resources. (2) Air pollution spreads over long distances, which may affect the entire tourist destination; the forest coverage of a tourist area is also crucial to the environment, which can also solve the land problem, so that the air pollution index (also known as “air quality index”; the larger index suggests the higher pollution degree) [30] and the forest cover rate [4] are used to measure the environmental impact of resource status on island tourism destinations.
The indicator of economic carrying capacity system indicates the carrying capacity of economy on island city tourism space. (1) In this paper, the centralized sewage treatment rate [31], water supply [4], and highway density [32] are used to measure the tourism economy carrying capacity of the infrastructure construction to island cities in tourist areas. As an island city is a relatively independent environmental system, sewage treatment is crucial to the island environment; water resources are the basic resources for people to live, and the supply affects the development of tourism. Additionally, the construction of traffic facilities plays a fundamental role in ensuring the development of tourism. (2) The facility carrying capacity of tourist destinations is measured by the number of buses, taxis, star-rated hotels, travel agencies, and star-rated restaurants [13]. The number of buses and taxis show the convenience of tourists traveling in island cities, and the number of hotels, restaurants, and travel agencies affects the food, accommodation, and transportation provided for tourists, which is directly related to the quality of tourist cities. (3) The tourism reception, the proportion of tourism revenue to GDP, and GDP per capita [27] are used to measure the economic carrying capacity of tourist destinations in this paper. The development of tourism city is directly and indirectly influenced by tourism area reception, tourism income, and economic income. On the one hand, the increase of tourists brings good income, on the other hand, the increase of tourists also affects the island ecological environment.
The indicator of social carrying capacity system indicates the carrying capacity of social psychology and urban environment on island city tourism spaces. (1) The attraction of landscape resources [33] and travel-to-residential ratio [34] are used to measure the carrying capacity of social psychology in the tourist destinations. The psychological state of tourists, between tourists and local residents has a great influence on the development of tourist areas. Additionally, the attraction of tourists to scenic spots is the key to tourist destinations. (2) Perfect services play a protective role in tourism development. In this paper, the number of employees in service industry and the number of beds in medical institutions [13] are used to measure the urban service carrying capacity in tourist destinations.
Besides, in accordance with whether the evaluation of the nature of the indicators on the tourism carrying capacity is positive or not, the indicators are divided into positive and negative. On the basis of this, this research constructs an early warning index system for the tourism carrying capacity of island cities (see Table 1 for details).

2.2. Data Sources

This research involves many sample cities and it is difficult to collect, thus, three rounds of index were adopted for collection. In the first round, the investigators made use of the data from the island and county yearbooks (2013–2019) and annual bulletins (2012–2018), local statistical yearbooks (2013–2019), and provincial statistical yearbooks (2013–2019) to carry out collection, among which the data of landscape attraction came from China Ctrip.com. The data of air pollution(quality) index came from http://aqicn.org/map/china/ and https://www.aqistudy.cn/historydata/monthdata; in the second round, for the data that could not be collected and the data that existed question, the statistical departments of 10 islands and counties were visited to supplement the relevant data; the third round carried on the statistical standards for the collected data regularity. Due to the large number of island counties involved as well as the large annual span, there were four indicators which had inconsistent statistical calibers for each county. For this reason, the research team unified the caliber on the basis of consulting experts. Moreover, the data of the two counties in Chongming and Dinghai were not included in the survey because of the large missing data. The collection methods mentioned above ensured the scientific nature of the data.

3. Early Warning Models and Processes

3.1. Early Warning Model

The state-space method is an effective method for quantitatively describing system state in Euclidean geometry space. It is an important method to describe and measure regional carrying capacity and carrying state, which is also a relatively widely used method. The state space usually consists of three-dimensional state space axes representing the state vectors of the elements of the system. In this research, the three-dimensional state space axes were defined as the nature axis (X), economy axis (Y), and society axis (Z). (Figure 1). In accordance with the state-space method, a n-dimensional state space is constructed. The early warning value of the tourism carrying capacity of the island city is represented by the vector mode in the state space, that is, the vector formed by the state point in the space and the system origin (see OC in Figure 1) [28]. The early warning value of tourism carrying capacity of island cities is a unified index weighted and integrated for each state value. On the basis of this, the space early warning model of the island city’s tourism carrying capacity can be obtained as follows:
T = | E | = i = 1 n w i R i j 2
In the formula, T is the early warning value of the tourism carrying capacity of the island city, and | E | is the directed vector module of the tourism carrying capacity of the island city, as shown in Figure 2 |OC| model; R i j is the spatial coordinate value after preprocessing of indicators in the early warning system of island city tourism bearing, W i is the weight of R i j 2 which represents the weight value of the i indicator, j = 0,1,2, … 10 represents 10 island counties, including Changhai County, Changdao County ……Shengsi County.
Figure 1. State space model.
Sustainability 12 01328 g001
(this picture refers to the research results of lu zhengnan [28] and sun honghai [35]).
In order to improve the accuracy of the early warning results, the model adopted the range standardization method for index consistency. No matter the index value is positive or negative, after the range change, the standardized indicator values are between [0,1], and both positive and negative indicators are converted into positive indicators, with the optimal value of 1 and the worst value of 0.
The calculation of tourism carrying capacity early warning index and the comparison of space–time need to determine the ideal state value and index weight. Thus, ideal values are the basis for model analysis. Currently, the determination of the ideal state value is mainly on the basis of questionnaire survey methods, expert consultation methods, and on the basis of existing domestic and international standards. In consideration of the particularity of the island cities involved in this research and the demands for comparability and catch-up. With reference to the opinions of the main research experts [36], this research adopted the value of the upper third sample point as the ideal value for the pressure-carrying natural carrying capacity index. Additionally, for the indicators of economic and social carrying capacity with pressure, the value of the lower third of the original point was adopted as the ideal value.
The determination of indicator weights mainly includes expert scoring, analytic hierarchy process, entropy evaluation method, principal component analysis, etc. The first two are relatively subjective, which require fewer indicators; the latter two are relatively flexible and objective. Thus, this research adopted a wider range of entropy evaluation method to calculate the index weight.

3.2. Forecast Method

BP neural network is a multi-layer feedforward neural network trained in accordance with the error back propagation algorithm. It is currently the most widely used neural network [37]. Compared with other traditional models, the BP model has better durability and timely predictability. It has a three-layer feedforward network, that is, the input layer, the hidden layer, and the output layer. The operating principle is the input signal acts on the output node through an intermediate node (hidden nodes). The value of the connection strength between the node and the hidden node, the connection strength between the hidden node and the output node, and the threshold value. After nonlinear transformation, the error is reduced along the gradient direction. Through repeated learning and training, the network parameters corresponding to the minimum error were determined (weights and thresholds) (see Figure 2).
Figure 2. BP neural network structure.
Sustainability 12 01328 g002
In the actual running process, this paper applied the neural network toolbox of MATLAB software to first normalize the data of China’s island cities from 2012 to 2018, calculated 20 index values, and then used the 20 index values as the BP neural network model. Three subsystems and the total system, as the input vector, make use of the output vector and make use of the function newff network to create the network. The number of hidden layers is 40. Additionally Tansig and purelin were used as the transfer functions of the neurons. Other functions adopted the default form.
In order to verify the prediction accuracy and learning effect of the model, and to more accurately predict the development trend of tourism carrying capacity, this research referred to the relevant results and selected the correlation coefficient as well as the root mean square error as the prediction accuracy and learning effect of the model. The higher the R value, the smaller the R M S E value, indicating the better the fitting effect and accuracy of the prediction result. In general, R > 0.95 and R M S E < 0.04, which indicates that the prediction model has a good fitting effect, which can be used for actual prediction [28].

3.3. Warning Interval

In accordance with the state space model, the early warning values were all within the [0,1] interval. On the basis of the relevant research results [38] and the experts’ advice, the three subsystems and the early warning of carbon carrying capacity were carried out. The warning degree was divided into five levels: super warning, severe warning, moderate warning, mild warning, and no warning (Table 2). The higher the warning degree, the worse the carrying capacity of the regional total system and each subsystem.

4. Results and Analysis

According to the early warning model of spatial and temporal method and BP neural network prediction model, the early warning index of the tourism carrying capacity of Chinese island cities in 2012–2021 is obtained, as shown in Figure 3.
The prediction is on the basis of the early warning values of the existing years and is implemented in accordance with a BP neural network model. Refer to the existing research for details [28], and apply the Matlab R2013 software design program to implement model network training. After running the parameters multiple times, the model’s learning test results are shown in Table 3. The data shows that the root mean square error of all values R M S E is < 0.04, and the correlation coefficient R is > 0.95. This model can be used to predict each subsystem and the total system’s early warning value from 2019 to 2021.

4.1. Early Warning Analysis of Island City Comprehensive and Tourism Carrying Capacity of Each Subsystem

From 2012 to 2018, the early warning status of China’s island city’s tourism carrying capacity showed an upward trend. The early warning value was from 0.1220 in 2012 to 0.2010 in 2018, and the warning interval decreased from severe warning to moderate warning (see Table 4). In recent years, Chinese island cities have continued to increase their investment in transportation infrastructure and tourism infrastructure, and the island’s tourism environment and ecological space have continued to improve. From the prediction results of the BP model, it can be seen that the tourism carrying capacity of China’s island cities has shown an upward trend from 2019 to 2021, which will be 0.2011, 0.1886, and 0.2155 in three years respectively, which are basically kept at the level of the moderate warning and are relatively stable. However, there is still a gap from the level of no warning.
Early warning analysis of natural carrying capacity. From 2012 to 2018, the early warning situation of the nature system of China’s island cities has deteriorated, and the warning degree has risen from the moderate warning interval to the severe warning interval and then has declined. The early warning value has changed from 0.1895 in 2012 to 0.1688 in 2018. There are two reasons for this result: on the one hand, because of the vigorous development of industrial economy in China’s coastal cities, the sea water quality has deteriorated and air pollution has worsened; on the other hand, with the increase of the number of island tourists, the utilization rate of marine resources is increasing, and the tourism environment of islands is increasing. To forecast and analyze the early warning situation from 2019 to 2021, the warning range of this system is from the severe warning interval to the moderate warning interval.
Early warning analysis of economic carrying capacity. The system’s early warning situation is on the rise, and the warning degree changed from the super warning interval to the severe warning interval to the moderate warning interval. From 2012 to 2018, China’s coastal cities have developed rapidly. The tourism economy has shown a “spout-type” development and the urban facilities have continued to improve. The bridges connecting the mainland have been constructed continuously. The highway mileage number on the island has increase continuously. The promotion of water diversion projects on the mainland has increased the water resources of island cities; island tourism development continues to accelerate, and the tourism infrastructure continues to improve. From 2019 to 2021, the system’s early warning value will continue to rise, and the warning degree will be above the level of the moderate warning.
Early warning analysis of social carrying capacity. From 2012 to 2018, the system’s early warning value maintained a growing trend, and the warning degree changed from the super warning interval to the severe warning interval to the moderate warning interval, which indicates that the social environment of Chinese island cities has gradually improved, especially the scenic spot attraction degree has shown rapid growth. The psychological carrying capacity of Chinese residents’ “island tours” has been increasing year by year. The level of urban tourism service has been greatly improved, which is drastically reflected in the increasing number of tourism service personnel and the improvement of medical and health service capabilities. The early warning values predicted by the system from 2019 to 2021 also maintain an upward trend, and the warning degree will be above the level of the moderate warning.
Table 4. Warning status of tourism carrying capacity of Chinese island cities.
YearTourism Carrying CapacityNatural Carrying CapacityEconomic Carrying CapacitySocial Carrying Capacity
2012SevereModerateSuperSuper
2013SevereModerateSevereSuper
2014SevereModerateSevereSevere
2015SevereModerateSevereSevere
2016ModerateModerateSevereSevere
2017ModerateModerateModerateModerate
2018ModerateSevereModerateModerate
2019ModerateSevereModerateModerate
2020ModerateSevereModerateModerate
2021ModerateModerateModerateModerate

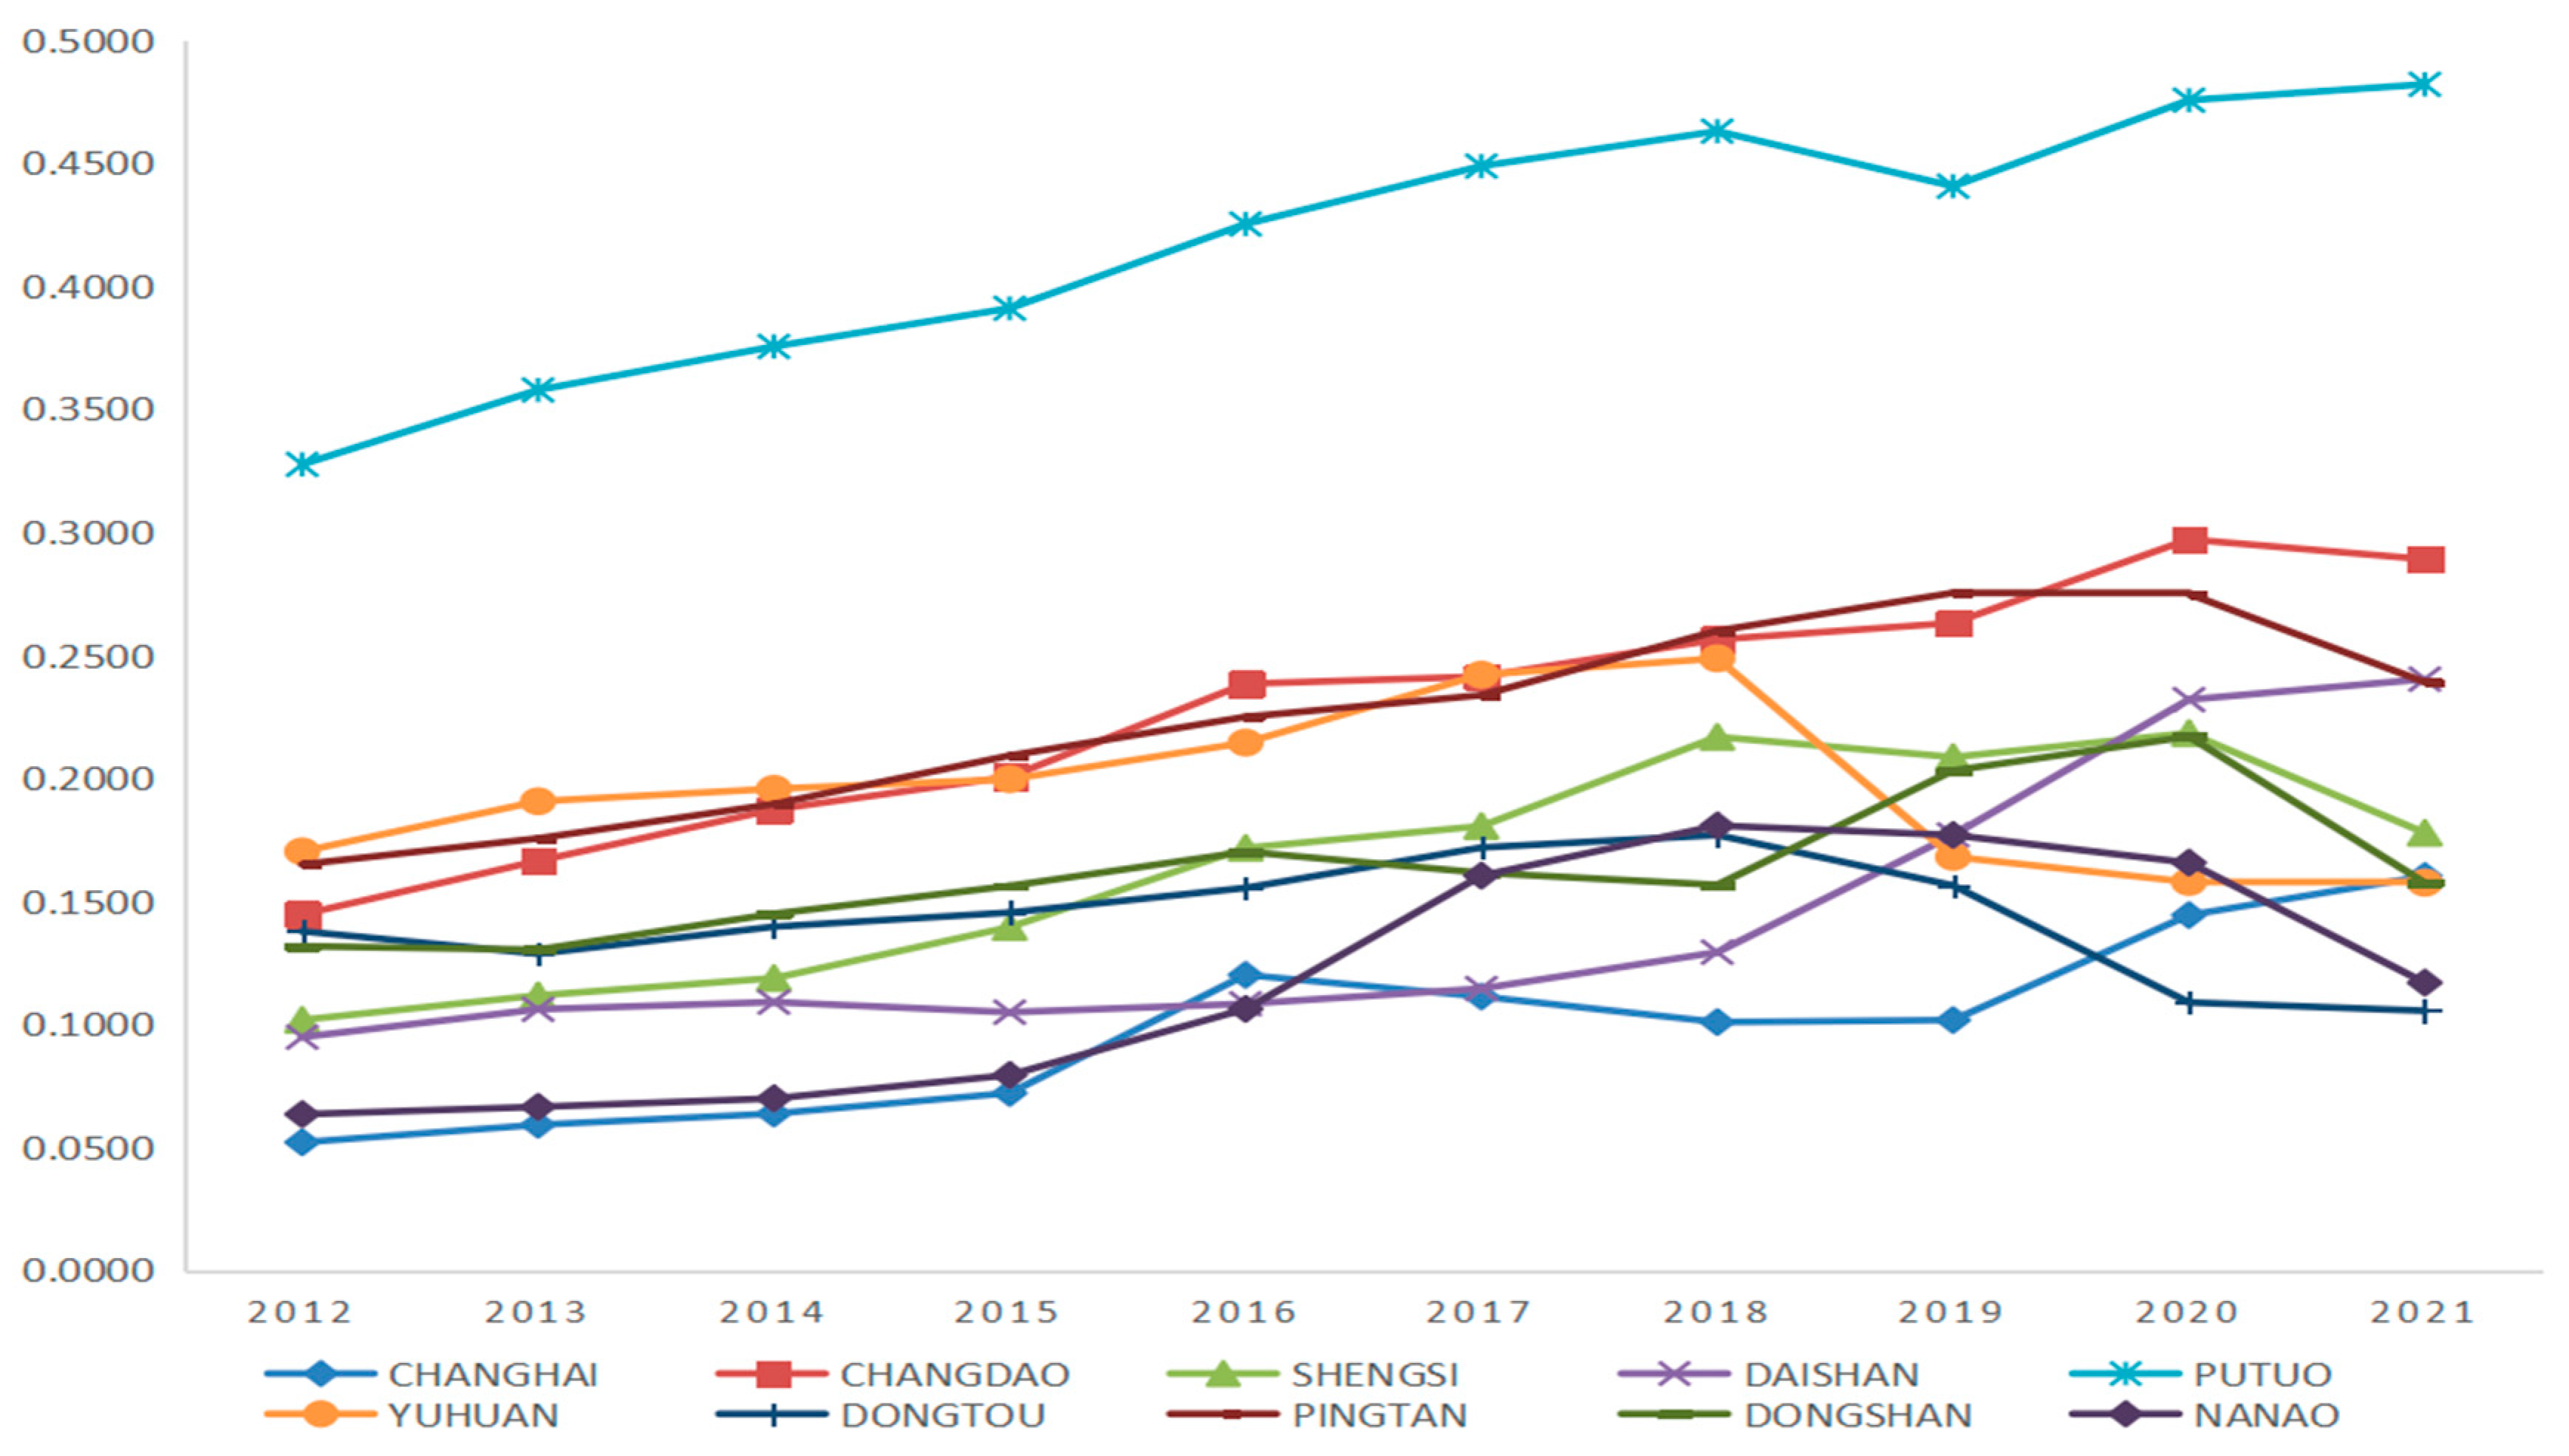
4.2. Early Warning Analysis of Tourism Carrying Capacity of Each Island City

From Figure 4 and Figure 5, it can be seen that the average early warning scores of tourism carrying capacity of 10 island counties in China are ranked from highest to lowest: Putuo, Yuhuan, Pingtan, Changdao, Dongtou, Dongshan, Shengsi, Daishan, Nan’ao, and Changhai. From 2012 to 2018, Putuo County’s tourism carrying capacity has always been in the first place, with an average early warning value of 0.3984 and an early warning interval value of 0.3276–0.4630. The warning degree is mild, and it is basically in the first echelon. It is expected to maintain the status of mild warning from 2019 to 2021 (see Table 5).
Yuhuan County, Pingtan County, and Changdao County are basically in the second echelon. The average early warning interval from 2012 to 2018 is [0.20–0.30], and the average early warning values are 0.2088, 0.2083, and 0.2051 respectively. The tourism carrying capacity of Yuhuan County from 2012 to 2018 has always maintained a steady growth, and the warning degree is in the state of moderate warning. From 2019 to 2021, it went from the mild warning to the moderate warning interval, which declined slightly. The tourism carrying capacity in Pingtan County has also maintained a steady growth, and the warning degree is in the moderate warning degree. The warning value for the forecast year went from rising to falling, but it was basically in the moderate warning interval. The score of the early warning value of tourism carrying capacity of Changdao County also maintained a steady increase, and the warning degree changed from the severe warning interval to the moderate warning interval. The early warning value for the forecast year also gradually increased, and the warning interval is in moderate warning condition.
Dongtou County, Dongshan County, Shengsi County, Daishan County, and Nan’ao County are in the third echelon. The average warnings value was between [0.1 and 0.2] from the year of 2012 to 2018, which were 0.1509, 0.1503, 0.1487, 0.1093, and 0.1038, respectively. Except for Dongshan County, the other four island counties have basically maintained steady growth. Dongshan County fluctuated from rising to falling and then rising. From the perspective of warning degree, Dongtou County was from the severe warning interval to the moderate warning interval, Dongshan County was from the severe warning interval to the moderate warning interval, Shengsi County was from the severe warning interval to the moderate warning interval, and Daishan County was from the super warning interval to the severe warning interval, Nan’ao County was from the super warning interval to the severe warning interval and then to the moderate warning interval. Among these five cities, the tourism carrying capacity in Daishan County was relatively poor. Judging from the change trend, Dongtou County is in the state of the severe warning interval, and Nan’ao County is from the moderate warning interval to the severe warning interval. The forecast and warning values of the other three cities are above the level of the moderate warning interval level.
Changhai County was the city with the worst tourism carrying capacity among the 10 samples. It was in the fourth echelon with an average early warning value of 0.0828, which was lower than 0.1. The early warning value increased from 2012 to 2018, and the early warning value increased from 2012 to 2016. Among them, it was the highest in 2016, reaching 0.1201, and it was in a downward trend from 2017 to 2018. The warning degree ranged from the super warning interval to the severe warning interval. On the basis of the forecast of the base year data evolution trend, the early warning value of the county’s tourism carrying capacity from 2019 to 2021 was on the rise, the warning degree changed from the severe warning interval to the moderate warning interval.
Table 5. Warning status of tourism carrying capacity of each island city.
YearChanghaiChangdaoShengsiDaishanPutuoYuhuanDongtouPingtanDongshanNan’ao
2012SuperSevereSevereSuperMildModerateSevereModerateSevereSuper
2013SuperModerateSevereSevereMildModerateSevereModerateSevereSuper
2014SuperModerateSevereSevereMildModerateSevereModerateSevereSuper
2015SuperModerateSevereSevereMildModerateSevereModerateSevereSuper
2016SevereModerateModerateSevereMildModerateSevereModerateModerateSevere
2017SevereModerateModerateSevereMildModerateModerateModerateModerateModerate
2018SevereModerateModerateSevereMildModerateModerateModerateModerateModerate
2019SevereModerateModerateModerateMildModerateSevereModerateModerateModerate
2020SevereModerateModerateModerateMildModerateSevereModerateModerateModerate
2021ModerateModerateModerateModerateMildModerateSevereModerateModerateSevere
Figure 4. Early warning status and evolution trend of tourism carrying capacity of each island city.
Sustainability 12 01328 g004

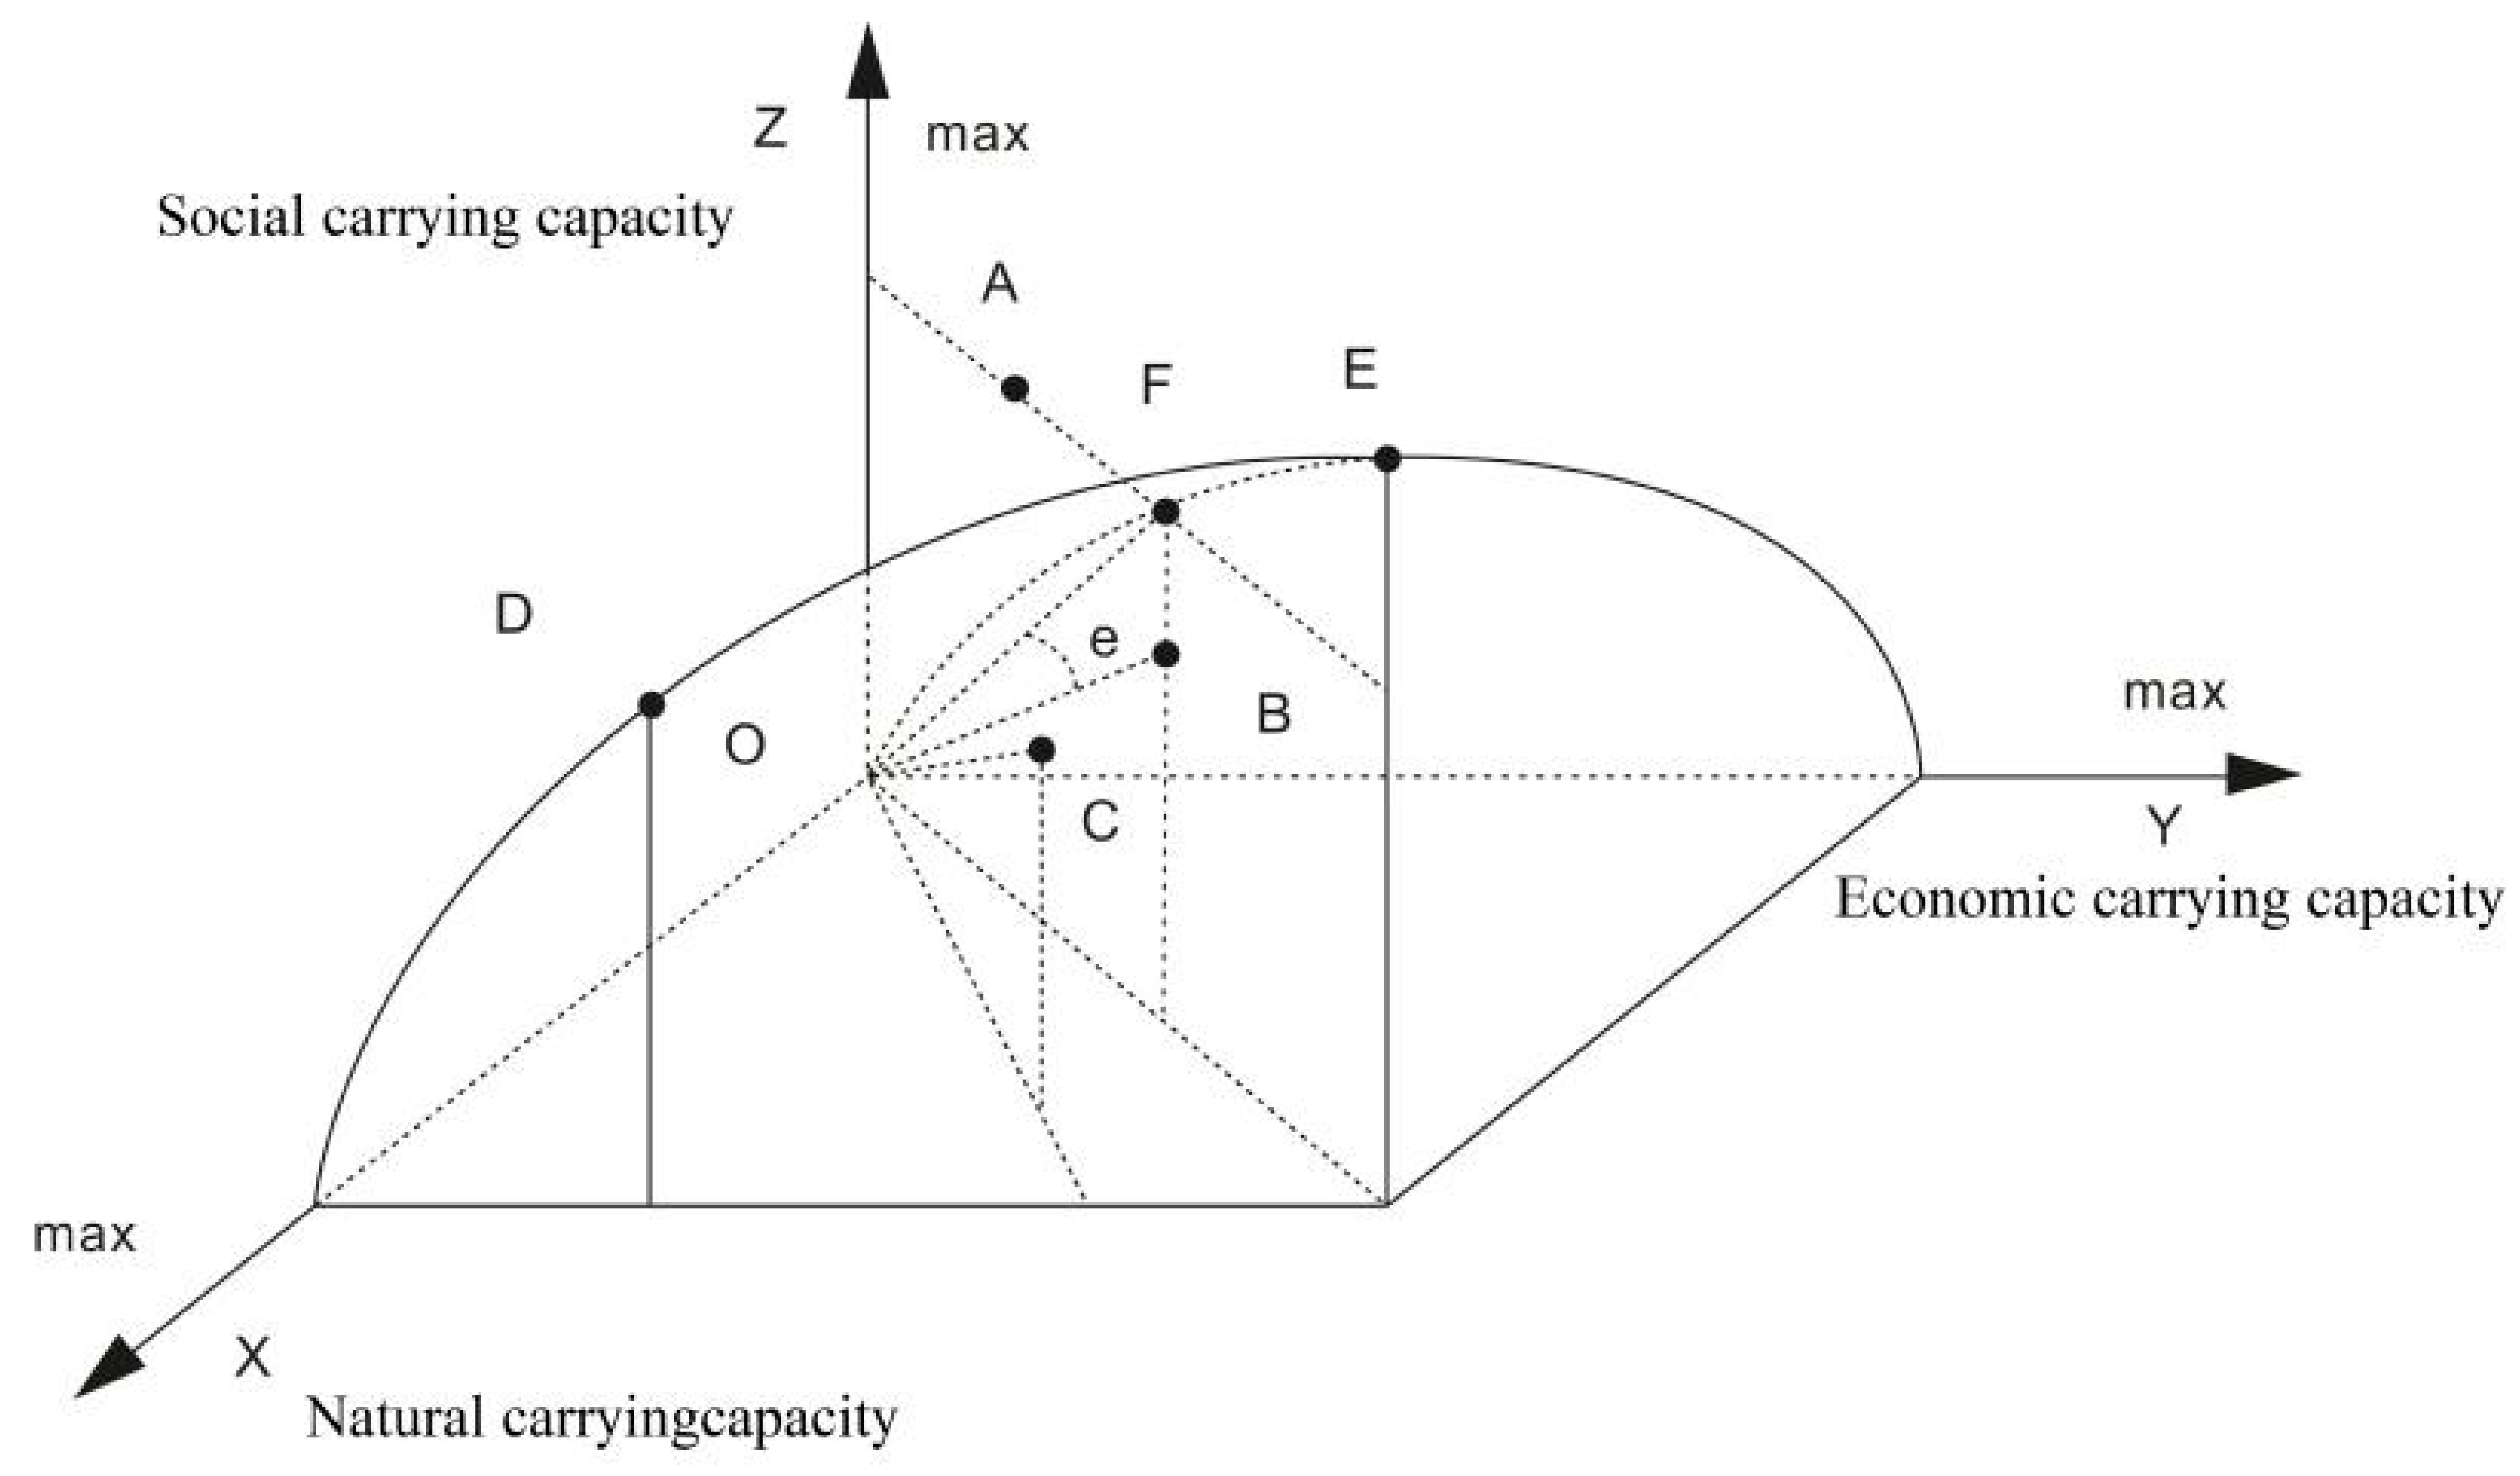
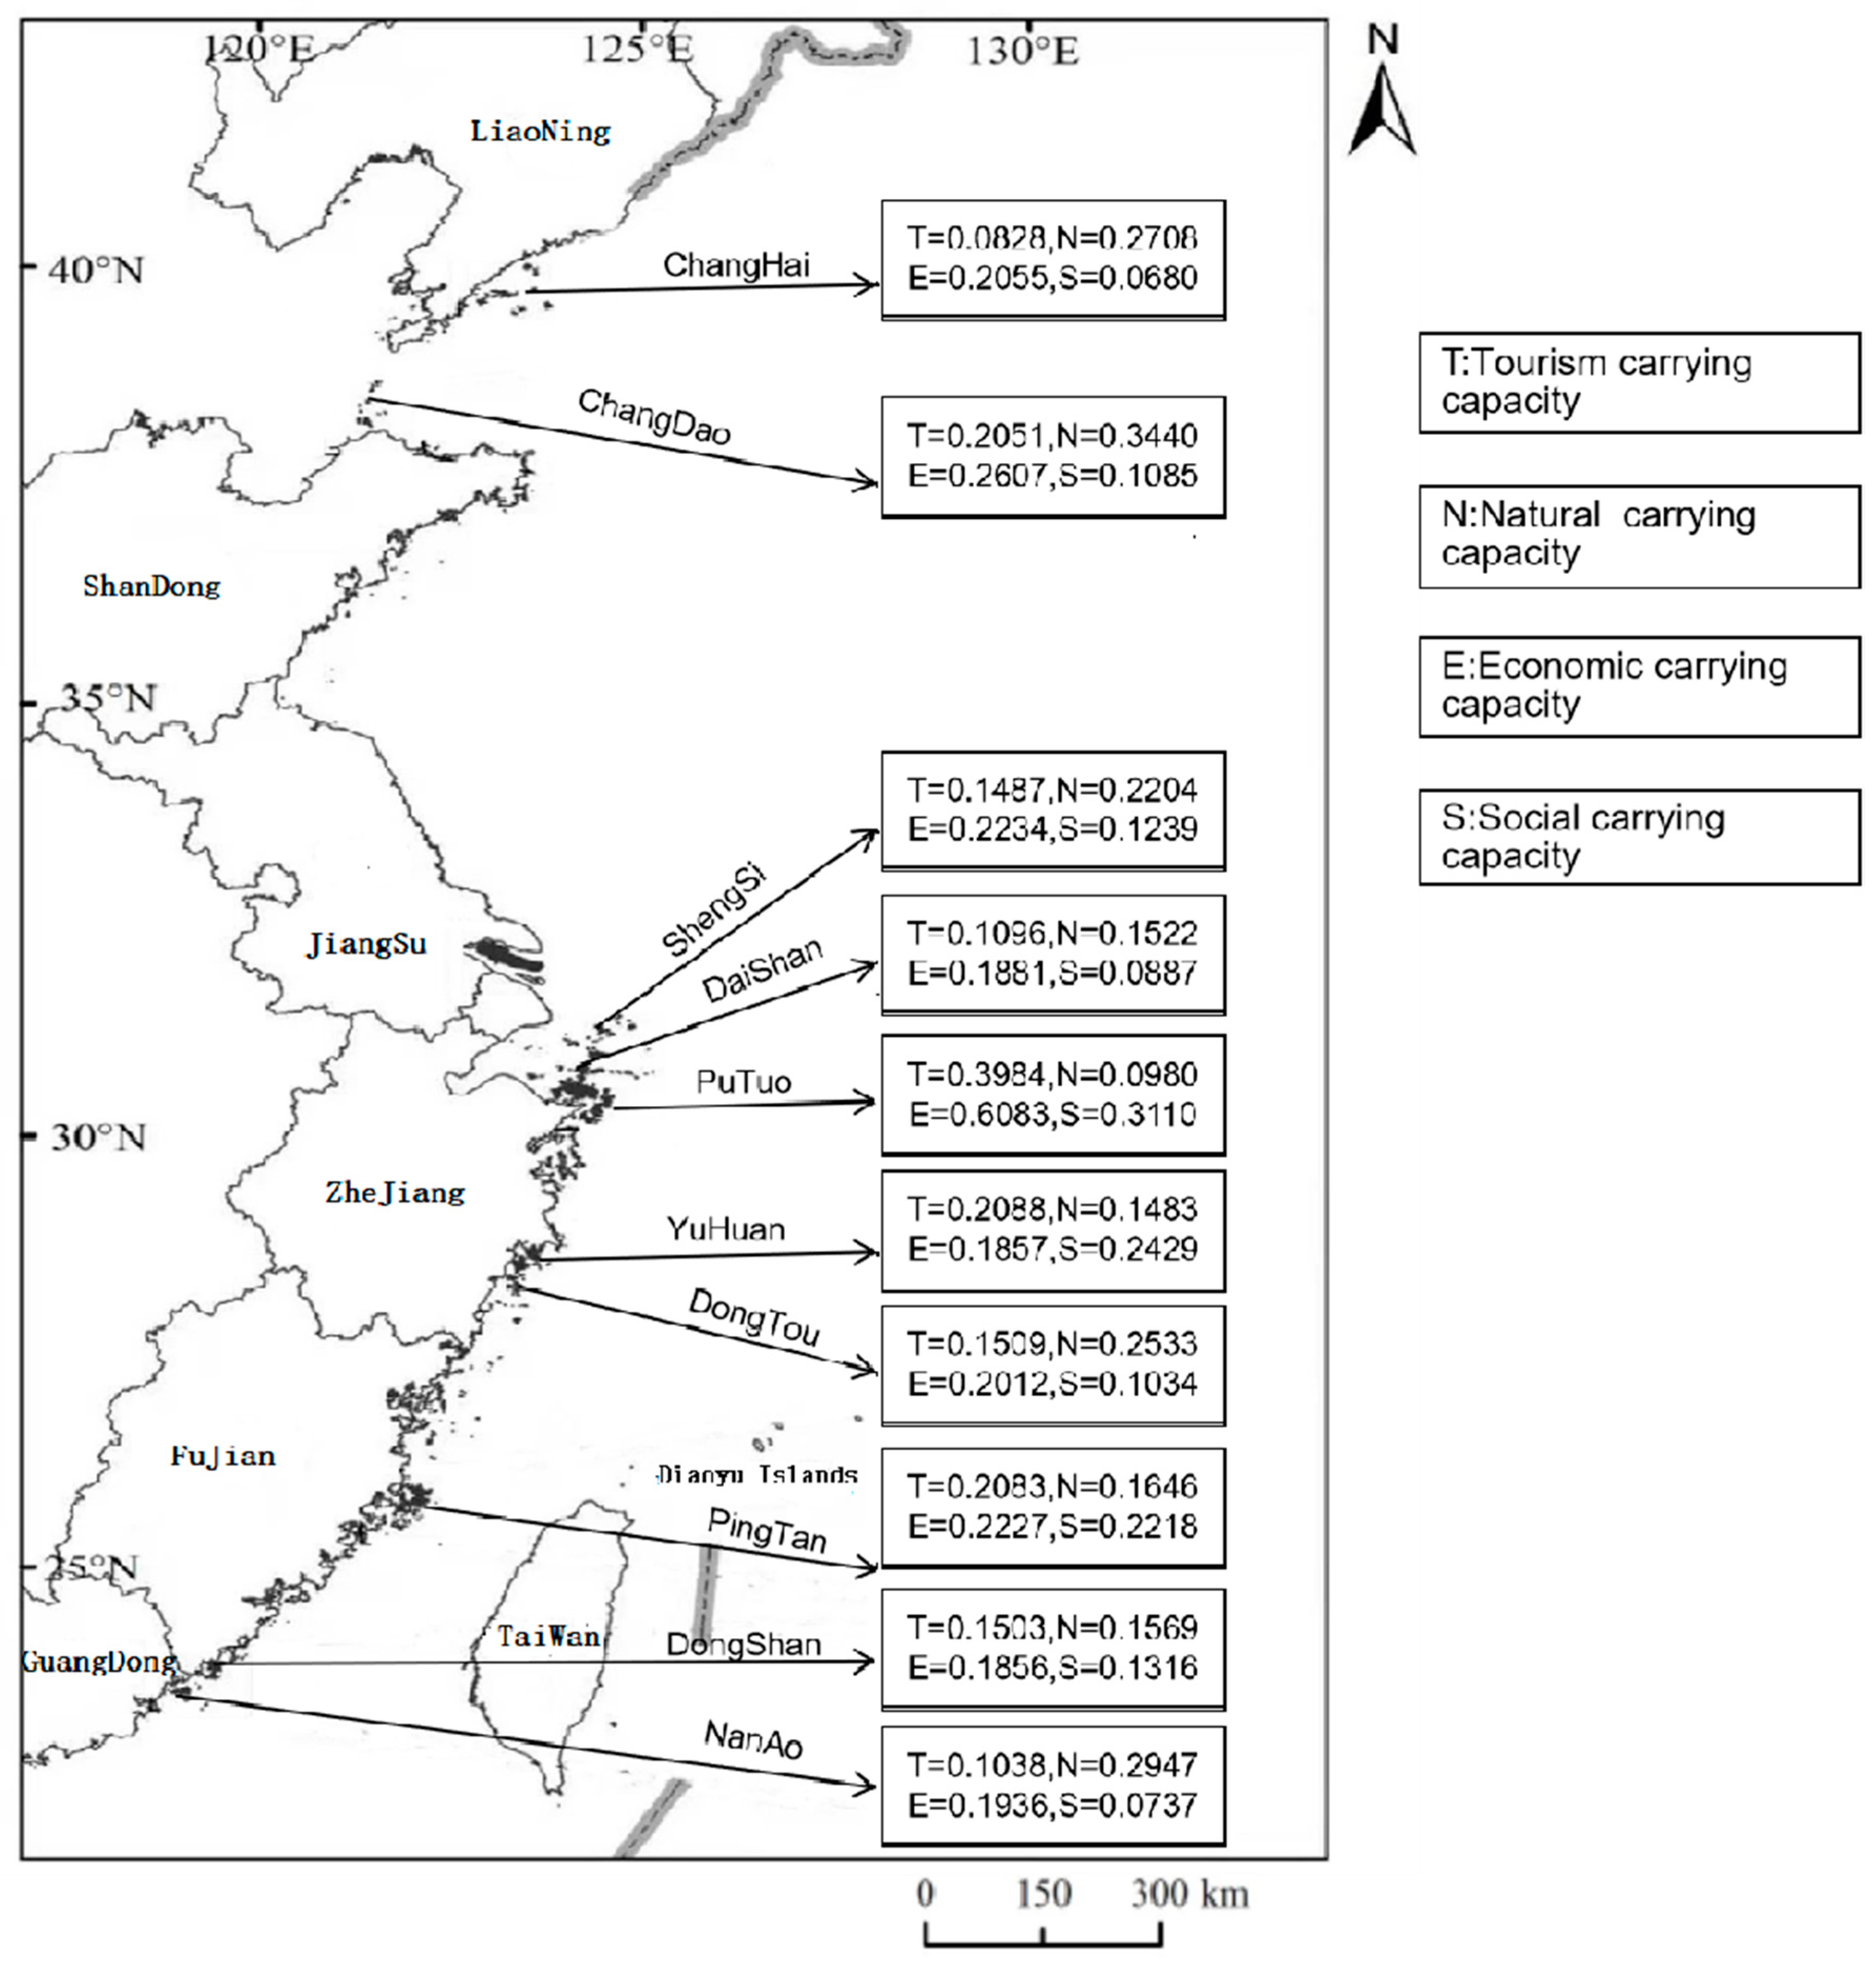
4.3. Analysis of the Contribution Status of Each Subsystem to the Total System

Due to the large differences in the geographical location, policy environment, economic foundation, resource conditions, and development methods of each island city, the early warning value of its tourism carrying capacity will also change dramatically. It plays a very important role for cities in formulating the control measures for the tourism carrying capacity.
According to the early warning average scores of the island city’s tourism carrying capacity system and the three subsystems from 2012 to 2018 (see Figure 5), the scores of each subsystem in China’s island cities are shown as regional differences in the northern, central, and southern regions. The contribution of the overall system varies. The southern island cities, Pingtan, Dongshan, and Nan’ao, were not significantly different in the three subsystems of nature, economy, and society, and the overall tourism carrying capacity was also poor. The three island cities of Shengsi, Putuo, and Daishan in the central part of the coast have shown spatial professions. The three cities’ nature subsystems performed poorly, which were basically in the state of super warning degree and severe warning degree. This is mainly because of the low average temperature in the region and the poor seawater quality result from the special location of the Yangtze River Estuary. However, it performed well in the economy system and the society system. It was in a good state among 10 island counties (except Daishan) and had the largest contribution to the total system. The northern island cities, Changhai and Changdao performed well in the nature system, which were in the state of moderate degree and mild warning degree, but performed poorly in economy system and the society system, which were in the super warning state or severe warning state. The reasons lay in the long coastline of the northern cities, the abundant marine resources, the good sea water quality, and air quality, however, these island cities had weak reception capacity with poor urban infrastructure.
What is the behavior direction of island cities to enhance the tourism carrying capacity? This needs to pay attention to the contribution status and influencing factors of the subsystems of each island city to the industrial system. Among the 10 island cities, Putuo and Nan’ao island counties showed two types of contribution states: pressure cities and pressure-carrying cities.
Pressure cities reflect the positive or negative pressure on the environment from human economic and social activities. Putuo was the city with the worst natural environment subsystem among the 10 island cities. The average warning value was 0.098, and the warning degree was between the super warning degree. This was mainly because of the poor seawater quality and low average annual temperature, which reduced the natural environment adaptability of beach tourism. However, Putuo had the best performance in terms of economic and social carrying capacity. Among them, the early warning value of the economic carrying capacity in 2012–2018 was above 0.5, which was much higher than that of other island cities. The average early warning value was 0.6083, and the warning degree was in the mild warning state. The forecast warning degree in 2019–2021 will be in no warning state. The average early warning value of social carrying capacity will be 0.3110, and the warning degree as in the state of mild warning. The forecast degree of 2019–2021 will also be in the state of mild warning. Thus, for such cities, the government shall devote greater efforts to improve the marine environment, improve seawater quality, and enhance the beach tourism environment.
A pressure-carrying city is a city in which human behaviors exert pressure on natural resources or the natural environment. From 2012 to 2018, the nature subsystem, Changdao County has been unique, with average warning value of 0.3440. This is mainly because of the seawater’s quality is good, the forest coverage is high, the weather and air quality are good, which are convenient for beach tourism. However, the performance on the system of economic carrying capacity and the social carrying capacity was not outstanding in the years. Among them, the average early warning value of the economic carrying capacity from 2012 to 2018 was 0.2607. The warning degree has changed from severe warning to moderate warning and the forecast warning degree has always been in the mild warning state, indicating that the development level of tourism economy in Changdao County has been increasing year by year and that the tourism infrastructure has been continuously improved. From 2012 to 2018, the average warning value of the social carrying capacity was 0.1085, ranging from super warning degree to severe warning degrees. It can be known that while such cities shall continue to develop the tourism economy, they must continue to strengthen the construction of the social environment, enhance the attraction of the landscape, and improve urban social construction.
Figure 5. Spatial and temporal distribution of the early warning means of the total system and subsystem of tourism carrying capacity in China’s island cities.
Sustainability 12 01328 g005

5. Conclusions and Discussion

5.1. Conclusions

On the basis of the analysis of the early warning results of China’s island cities as a whole and the island cities, the following conclusions are obtained:
(1)
From 2012 to 2018, the early warning status of tourism carrying capacity of Chinese island cities showed an upward trend. However, the early warning situation of the nature system of island cities continued to deteriorate, and the warning degree increased from the moderate warning interval to the severe warning interval; the early warning situation of the economic carrying capacity showed an upward trend, and the warning degree was from the severe warning interval to the moderate warning interval; the social carrying capacity the early warning value kept increasing, and the warning degree changes from the super warning interval to the severe warning interval and then to the moderate warning interval. From 2019 to 2021, it is predicted that the overall tourism carrying capacity early warning index will show an upward trend, which is at the level of moderate warning, but there is still a gap from the level of no warning; the government’s marine environment governance policy has shown initial results; early warning value of economy system’s carrying capacity kept increasing, and the warning degree is above the level of the moderate warning; the early warning value of the society system has also maintained an upward trend, and the warning degree has changed from the moderate warning interval to the mild warning interval, indicating that the investment effect of the tourism economy of the Chinese island and county governments has gradually emerged.
(2)
The early warning status of the tourism carrying capacity of the 10 island counties in China has significant differences. From 2012 to 2018, the early warning value of Putuo’s tourism carrying capacity has always ranked first, and the average early warning value exceeded 0.3, which was in the state of mild warning; Pingtan County, Yuhuan County, Changdao County were basically in the second echelon with an average early warning score of 0.2–0.3, which was in a state of severe warning; Dongshan County, Shengsi County, Dongtou County, Daishan County, and Nan’ao County were in the third echelon with an early warning average of 0.1–0.2 Changdao County had the worst performance which was in the fourth echelon, and the average early warning value was lower than 0.1. From the forecast early warning value of 2019–2021, all cities will be increased, Putuo, Changdao, and Nan’ao will gradually move to the mild warning interval; other cities will be basically in the moderate warning interval, while Changhai County will perform poorly and will be still in a severe warning interval.
(3)
The scores of the various subsystems of Chinese island cities show the regional differences between northern, central, and southern areas, and their contribution to the total system is different. The differences among the three systems of nature, economy, and society, in southern cities were not obvious; the central cities performed poorly in the nature subsystem, but performed well in the economy and society subsystems; the northern cities showed better nature systems, while economy and society systems performed relatively poorly. Based on this, the pressure cities and pressure-carrying cities could be delineated. The governments could adopt different policy measures on the basis of the environmental characteristics of human activities.
In general, from the perspectives of the early warning values of the year from 2012 to 2018 and the predicted early warning values of the year from 2019 to 2021, the overall carrying capacity of China’s island cities is better, but there is also a high level of warning, which is associated with the poor seawater quality of island cities, low scenic spot attraction degree, tourist reception capacity, and other factors are directly related. Next, in order to develop sustainable tourism, island cities need to strengthen the management of the marine environment and improve the quality of sea water and air; continue to invest funds to improve tourism reception capacity and the island transportation network, and improve the level of tourism reception services; further enhance the uniqueness and regionality of regional island tourism and enhance the attraction degree of the island scenic area.

5.2. Discussion

This paper covers the relevant conclusions based on a certain data model analysis, and the research conclusions are reliable. Through the combination of state space model and BP neural network model, this study obtains the early warning results of 2012–2018 and forecasting and early warning results of 2019–2021 so as to show the early warning trend of China’s island city’s tourism carrying capacity and regional heterogeneity, and its manifestation is relatively clear. On the basis of this, combined with the characteristics of islands, it puts forward a general significance to promote the sustainable tourism of the island. However, there are still some deficiencies in this paper. First, in the selection of early warning indicators, due to the lack of data, we did not include some indicators related to the early warning of tourism carrying capacity, such as the designation of marine nature reserves, the impact of human activities on marine species and resources, and the report of tourism crimes in tourist destinations. Second, due to the complexity of island areas and tourism resources, this paper does not measure the early-warning result of tourism carrying capacity through a specific research area, but only controls the difference of early-warning index of regional island tourism carrying capacity as a whole. However, as far as the current research is concerned, a few scholars have calculated the island tourism carrying capacity of specific research areas (such as beach and Ocean Park) by simple models. Therefore, in the future research, the top priority is how to select the appropriate research area (such as the comparison of whole islands) based on the island regional differences to quantitatively measure the carrying capacity of island tourism resources.

Author Contributions

The original draft of the manuscript was written by F.Y.; Writing-review and editing, J.P.; Data surveys and article reviews, F.W.; Data surveys, X.H. All authors have read and agreed to the published version of the manuscript.

Funding

This research was funded by Zhejiang university humanities and social sciences project, grant number:2018QN045.

Conflicts of Interest

The author declares no conflict of interest.

References

  1. Zhang, H.; Chen, J.; Zhou, P. A Modified Ecological Footprint Model to Evaluate the Land Carrying Capacity of Island Cities: Take Zhoushan City as Example. Econ. Geogr. 2016, 36, 155–160. [Google Scholar]
  2. Qin, W.S.; Sun, J.F.; Zhang, Y.F. Research on vulnerability and spatial differentiation on island economies on county level of China. Resour. Sci. 2017, 39, 1692–1701. [Google Scholar]
  3. Sun, Y.; Li, J.; Li, W.; Ma, R. Carbon Emission Measurements of Island Cities and Analysis of Influencing Factors—Take ZheJiang Zhoushan City as Example. Geogr. Res. 2018, 5, 1023–1033. [Google Scholar]
  4. Liu, W. Research on the carrying capacity of island tourism environment, China population. Resour. Environ. 2010, S2, 75–79. [Google Scholar]
  5. Qin, W.; Zhang, Y. Research progress on island economy at home and abroad. Prog. Geogr. Sci. 2013, 32, 1401–1412. [Google Scholar]
  6. Gao, S.; Cao, G.X.; Hong, T.; Zhao, L.; Xu, M. Dynamic Evaluation and Driving Force Analysis of Ecological Security in Urbanization of Islands—Taking Pingtan Island as an Example. Acta Ecol. Sin. 2018, 38, 2503–2511. [Google Scholar]
  7. Wang, H.; Lin, J.; Zhou, J. Establishment and Analysis of Economic Model of Urban Tourism Environmental Carrying Capacity. J. Dalian Marit. Univ. 2006, 32, 18–25. [Google Scholar]
  8. Peng, W.; Li, J.; Zhang, Z. Evaluation of Beijing’s tourism environmental carrying capacity and analysis of regional differences. Resour. Dev. Mark. 2007, 23, 598–602. [Google Scholar]
  9. Pearce, D.G.; Kir, R.M. Carrying capacities for coastal tourism. Ind. Environ. 1986, 9, 3–7. [Google Scholar]
  10. Zhang, G.; Liu, J. Research on the Relative tourism carrying capacity in the Coastal Regions of China. Econ. Geogr. 2009, 29, 1222–1227. [Google Scholar]
  11. Garay, L.; Cànoves, G. Life cycles, stages and tourism history: The Catalonia (Spain) experience. Ann. Tour. Res. 2011, 38, 651–671. [Google Scholar] [CrossRef]
  12. Liu, J.; Yu, S.; Wang, J. Evaluation and Quantitative Measurement of Coastal Tourism Environmental Carrying Capacity: A Case Study of the Shandong Peninsula Blue Economic Zone, China Population. Resour. Environ. 2012, 9, 163–170. [Google Scholar]
  13. Yang, X.; Weng, G.; Li, J.; Hou, Y. Optimization of Tourism Environmental Carrying Capacity in Coastal Cities: A Case Study of Qinhuangdao City. Geogr. Inf. Sci. 2019, 4, 134–140. [Google Scholar]
  14. Tao, X. Evaluation of the carrying capacity of coastal tourism destinations. Stat. Decis.-Mak. 2008, 2, 59–61. [Google Scholar]
  15. Su, Z.; Yuan, G.; Hao, Q.; Jia, L. Research on the Coupling Development of Ecological Environmental Carrying Capacity and Coastal Tourism Economy in the Coastal Waters of Guangxi. Soc. Sci. Guangxi 2018, 4, 37–43. [Google Scholar]
  16. Wei, N.; Zhang, J.; Lin, Y.; Sun, X. Application of Tourism Carrying Capacity Evaluation in Beach Tourism Management. Econ. Geogr. 2019, 3, 210–217. [Google Scholar]
  17. Corbau, C.; Benedetto, G.; PaoloCongiatu, P.; Simeoni, U.; Carboni, D. Tourism analysis at Asinara Island (Italy): Carrying capacity and web evaluations in two pocket beaches. Ocean Coast. Manag. 2019, 169, 27–36. [Google Scholar] [CrossRef]
  18. Coccossis, H. Sustainable development of the Greek islands. In Interdependency between Agriculture and Urbanization: Conflicts on Sustainable Use of Soil and Water; CIHEAM: Zaragoza, Spain, 2001; pp. 391–394. [Google Scholar]
  19. Zhang, X.; Weng, G.; Liu, Y.Z.; Zhu, Y. Research on Tourism Environmental Carrying Capacity Evaluation and Early Warning—Take Nandaihe Ocean Park Scenic Area as an example. J. Yanshan Univ. 2008, 9, 113–116. [Google Scholar]
  20. Wang, H.; Lin, J. Calculation of tourism environmental carrying capacity on tourist ecological footprint model. J. Dalian Marit. Univ. 2005, 31, 57–61. [Google Scholar]
  21. Zhang, X.; Lin, M.; Lin, S. The Method of Tourism Environmental Carrying Capacity. Ecosyst. Assess. Fuzzy Syst. Manag. 2014, 26, 87–92. [Google Scholar]
  22. Stevenrl Roberte, W. Proactive monitoring and adaptive management of social carrying capacity in Arches national park: An application of computer simulation modeling. Environ. Manag. 2013, 68, 305–313. [Google Scholar]
  23. Mah, C.; Sarniento Nvr, D. Beach carrying capacity assessment through image processing tools for coastal managemcnt. Ocean Coast. Manag. 2016, 130, 138–147. [Google Scholar]
  24. Navarro, J.; Caetaao, V.; Emanuela, C. Multiple carrying capacities from a management- oriented perspective to operationalize sustainable tourism in protected areas. J. Environ. Manag. 2013, 128, 116–125. [Google Scholar]
  25. Fang, D.; Ding, L. Research on Early Warning of Island Tourism Environmental Carrying Capacity Based on Fuzzy Comprehensive Evaluation. J. Liaocheng Univ. 2012, 25, 71–74. [Google Scholar]
  26. Brown, K.; Turner, R.K. Environmental carrying capacity and tourism development in the Maldives and Nepal. Environ. Conserv. 1997, 24, 316–325. [Google Scholar] [CrossRef]
  27. Lin, X.; Chen, Q.; Xiu, X.; Lin, E. Study on Early Warning Evaluation of Tourism Environmental Carrying Capacity of Wetland Parks—Taking Yunxiao Mangrove Wetland Park as an Example. For. Econ. Issues 2017, 37, 44–48. [Google Scholar]
  28. Lu, Z.; Hao, W.; Yang, X. Analysis of Carbon Carrying Capacity and Time and Space Differences in Central China. J. Stat. Decis. 2017, 2, 89–92. [Google Scholar]
  29. Yang, M.; Gan, Q.; Ye, H.; Li, G.; Ouyang, Z.; Huang, Q. The Construction of Sichuan Province Resource Environment Carrying Capacity Early Warning Model. J. Sichuan Environ. 2017, 36, 144–151. [Google Scholar]
  30. Han, L.; Zhou, W.; Pickett, S.T.A.; Li, W.; Qian, Y. Multicontaminant air pollution in Chinese cities. Bull. World Health Organ. 2018, 96, 233–242. [Google Scholar] [CrossRef]
  31. Xu, D.; Li, Y. Assessment of Marine ecological environment carrying capacity based on state space method. J. Stat. Decis. 2013, 18, 58–60. [Google Scholar]
  32. Li, S.; Wang, T.; Gao, N. A Study ofthe evolution characteristicson of tourism development quality in coastal cities in China. J. China’s Popul. Resour. Environ. 2019, 3, 147–160. [Google Scholar]
  33. Huang, Z.; Yuan, L.; Ge, J. Assessment of environmental carrying capacity of coastal tourist sites—A case study of coastal wetland eco-tourist sites in jiangsu province. J. Geogr. Sci. 2008, 28, 578–584. [Google Scholar]
  34. Wang, S.; Haimiti, I. Evaluation of the carrying capacity of tourism environment in urumqi and analysis of differences among districts and counties. J. Resour. Environ. Arid Reg. 2010, 24, 134–139. [Google Scholar]
  35. Sun, H.; Xiao, Y.; Wang, Y. Evaluation of Ecological Carrying Capacity of Petrochemical Enterprises based on 3D State Space Model. J. China Univ. Pet. 2016, 32, 7–10. [Google Scholar]
  36. Xu, Y.; Han, Y. The Comparative Analysis of Environmental Carrying Capacity of the Cities in Fujian Provinces Based on State-Space Method. East China Econ. Manag. 2009, 23, 7–11. [Google Scholar]
  37. Wen, X.; Zhang, X.; Zhu, Y.; Li, X. Intelligent Fault Diagnosis Technology: MATLAB Application; Beijing University of Aeronautics and Astronautics Press: Beijing, China, 2015; Volume 6. [Google Scholar]
  38. Wang, J.; Huang, X.; Zhang, G.; Wang, X. The Spatial and Temporal Differences of Tourism Economic Early Warning Evaluation in Coastal Areas in China. J. Bus. Econ. 2015, 3, 64–74. [Google Scholar]
Figure 3. Early warning index and development trend of tourism carrying capacity of Chinese island cities.
Sustainability 12 01328 g003
Table 1. Early warning indicator system of tourism carrying capacity of island cities.
Warning DegreeCase of WarningWarning ForetasteWarning FactorIndicator and DirectionVariable NameWeights
Early warning of tourism carrying capacity in island citiesNatural carrying capacityThe carrying capacity of natural resourcesCoastline length per capita (km/10,000)+X10.0512
Beach area per capita (km/10,000)+X20.0410
The carrying capacity of tourism environmentProportion of national first-class and second-class seawater quality (%)+X30.0457
Air pollution indexX40.0161
Forest cover rate (%)+X50.0492
Economic carrying capacityThe carrying capacity of infrastructureCentralized sewage treatment rate (%)+X60.0104
Water resource supply (10,000 tons)+X70.0803
Highway density (km/10,000)+X80.0652
The carrying capacity of tourism facilityNumber of bus ownership+X90.0383
Number of taxi ownership+X100.0869
Number of beds in star hotels+X110.0553
Number of travel agencies+X120.0638
Number of star hotels+X130.0587
The carrying capacity of economic scaleTourism reception (10,000 people)+X140.0787
Proportion of tourism revenue to GDP (%)+X150.0399
GDP per capita (10,000 yuan)+X160.0267
Social carrying capacityTourism psychological capacityAttraction of landscape resources (%)+X170.0334
Travel-to-residential ratio (%)X180.0439
The carrying capacity of urban serviceNumber of employees in service industry (person)+X190.0454
Number of beds in medical institutions+X200.0700
Note: “+” means the indicator orientation is positive; “-” means the indicator orientation is negative.
Table 2. Warning degree of tourism carrying capacity of island cities.
Warning IntervalSuper Warning IntervalSevere Warning IntervalModerate Warning IntervalMild Warning IntervalNo Warning Interval
Natural carrying capacity0–0.13860.1386–0.16670.1667–0.31650.3165–0.42180.4218–1
Economic carrying capacity0–0.16800.1680–0.23080.2380–0.41130.4113–0.71190.7119–1
Social carrying capacity0–0.10010.1001–0.14910.1491–0.25560.2556–0.49990.4999–1
Tourism carrying capacity0–0.10000.1000–0.15740.1574–0.32280.3228–0.48210.4821–1
Table 3. Simulation results of the total system and subsystems.
Test EffectNatural Carrying CapacityEconomic Carrying CapacitySocial Carrying CapacityTourism Carrying Capacity
R M S E 0.00880.00410.01170.0086
R 0.99410.99950.98970.9953

