Article

Innovative Multidisciplinary Methodology for the Analysis of Traditional Marginal Architecture

1
Department of Civil Engineering and Architecture, University of Catania, via S. Sofia 64, 95125 Catania, Italy
2
Department of Electrical Electronic and Computer Engineering, University of Catania, via S. Sofia 64, 95125 Catania, Italy
*
Author to whom correspondence should be addressed.
Sustainability 2020, 12(4), 1285; https://doi.org/10.3390/su12041285
Submission received: 16 December 2019 / Revised: 17 January 2020 / Accepted: 19 January 2020 / Published: 11 February 2020
(This article belongs to the Special Issue The Exploration of Sustainability in Traditional Rural Buildings)

Abstract

:
In rural and marginal landscapes, the architectural heritage carries an inestimable value. It distinguishes these places from the standardization of contemporary society and it makes them authentic and rooted in the territory. Investigating the real potential of building heritage and understanding what actions should be taken to raise it to the needs of contemporary society is one way to preserve this authenticity. The article presents an innovative multidisciplinary tool, based on GIS methodology, for rapid evaluation of the features of traditional rural architecture. With it, it is possible to carry out a complex analysis, by considering architectural, energy and structural items. It can also guide the design activities in order to optimize the revitalization actions, emphasizing the holistic approach. The potentiality of this procedure will be shown for a test site, namely, the Isle of Filicudi (Aeolian Islands, Sicily, Italy).

1. Introduction

The depopulation of rural areas, with the consequent abandonment of physical and intangible assets present there, is a significant contemporary phenomenon. According to the latest United Nations report (2018) [1], by 2050, 68% of the world’s population will have abandoned rural settlements and moved to urban areas. The peripheries and marginal areas will increase their size, with a consequent worsening of their already poor quality of life. These huge flows of depopulation are fed by the low attractiveness of rural areas, which are perceived as geographical marginality compared to the nodal centers of economic and cultural development, the cities. Therefore, rural areas suffer from a condition of physical “isolation.” This is also reflected in a feeling of exclusion from the most modern and advanced trends, sometimes unjustified. In fact, traditional settlement and architectural models are often replaced by other more international and standardized models. The latter respond to an idea of progress and modernization that is more attractive to the population because of the erroneous conviction that they are potentially capable of increasing the performance and comfort of the buildings [2]. When this replacement happens, traditional buildings are relegated to the role of witnessing the past. They maintain the value of heritage but are not considered capable of fulfilling the functions of contemporary life. The risk is that of museification, or worse, the loss of the authenticity of the values that these architectures preserve. Their characters are transfigured and they are trivialized in order to increase mass tourism flows.
A better knowledge of the intrinsic characteristics of rural settlements is the first step to understand that today these settlements can meet some precise high standards of quality of living. To get to this, it is possible to recover technological, constructive, distributive and spatial elements, revisiting them in a contemporary context [3]. That would ensure the possibility of a “countertrend” to the current trend of unsustainable growth of the urban population.
Thus, what are the elements and characters of rural settlements that can still be attractive today?
Traditional rural settlements do not necessarily have the comforts of contemporary living and do not guarantee inclusion and fairness of access to infrastructure and social services. On the other hand, they favor the rediscovery of authentic contact with the natural dimension of living and with human measures. Therefore, looking at them from another perspective—in which progress is not necessarily linked to technological innovation understood in a canonical way—rural settlements can become new, widespread centers for areas of degrowth [4]. Technological innovation can be at the service of the search for new ways of living on the planet.
The interest in marginal areas as places to be re-evaluated can be seen in Italy by the national policies on the revitalization of internal regions, carried out in the National Strategy for Internal Areas [5]. These policies are aimed at the development of these places, encouraging cooperation for the production of essential services and for the protection and enhancement of numerous environmental or cultural resources. In the same vein is the curatorial project of the Italian Pavilion at the Venice Architecture Biennale in 2018, called “Arcipelago Italia” [6]. Here, the attention of architecture is diverted from the cities to “that physical space of our country, where, even in the most remote times, communities have historically expressed a different relationship between urban dimension and territory. They are territories that are spatially and temporally distant from large urban areas, but possess an invaluable cultural heritage, with peculiarities that place Italy in a discontinuity with respect to European urban armour. This allows Italy to be identified as an ‘urban space in the Mediterranean’, to use the words of Fernand Braudel” [7].
From this point of view, the idea of “margin” can be understood in a positive sense, as an operational category for the project, capable of mobilizing new reflections on places whose becoming can produce unexpected results, which are outside the dominant logic of urban development.
The analysis and deep knowledge of these marginal territories are therefore the preliminary operations to any type of revitalization and repopulation intervention. To reach a high level of knowledge of the built environment, it is necessary to implement an advanced, dynamic and multidisciplinary reading of the territory. The identity characteristics of marginal places can be returned, recomposing the fragmentary nature of these contexts and helping to overcome the physical distances both in the phase of construction of the cognitive framework and in the phase of updating and management.
An innovative tool has been developed in the Geographic Information System (GIS) environment, based on the Rapid Evaluation Methods (REM) of analyzing the characteristics of the built environment. The tool is specifically structured to study the characteristics of traditional architecture, namely, that architecture created with procedures and material objects that are accepted as standard in a society, and whose elements are handed down from generation to generation [8]. The main aspects to be analyzed, gathered under the categories “Buildings,” “Energy” and “Structure,” try to break down the quality of architecture into measurable elements, which give a score useful to establish, later, recovery projects.

2. State of the Art

2.1. Marginal Architecture and Sustainability

The study of marginal architectures tends to investigate how marginality appears in architecture, trying to imagine paths to be taken for the future. Oftentimes, a negative meaning is attributed to the concept of margin or marginality: it is a space of secondary importance, not essential for the functioning of the system, without a precise role, a place of poor quality, a residual space in a state of partial abandonment, like a waste [9]. This negative approach to the notion of margin can change if we consider that the idea of marginal space is connected to that of limit of the space. Marginal could be a space from which it is possible to observe reality in a different way or a space in which to inhabit the world in a different way. It is also a vision of a secondary space where the marginal—physical and perceptive—conditions express the characterizing part of the territory.
The production of these spaces is often the consequence of geographical and geomorphological conditions, which have always foreshadowed the possibilities and ways of living on Earth. However, for at least a century now, things have been changing. The “liquid” development of the contemporary settlement is trying to standardize the world without seeking any relation to the above conditions, by simply imposing its own rules and hierarchies [10]. However, the most geographically and geomorphologically hostile places, colonized with difficulty throughout history, are less interested by this process and become inconsistent territories. Thus, it could be interesting to trace paths or to draw trajectories that allow these places to satisfy the needs of our current society; not necessarily conforming to the standards of the dominant models of modernity, but handing down the unique characteristics that distinguish them. Marginal areas can be places of choice for meeting the growing social demand for landscape, which has already been talked about since the European Landscape Convention (ELC) signed in Florence in 2000 [11]. The landscape is like a piece of territory in which a community recognizes itself, a space that returns identity. The signs of the territory, over time, have merged with the geography of places up to a process of total identification. In marginal areas landscapes, it is possible to perceive this harmonic union, without the anthropic dimension being predominantly overwhelming on the natural one, erasing the signs of the place [12].
With regard to Italy, starting from the 1950s, the industrialization process has begun in all regions with a marked state investment; it was linked to a rather widespread territorial distribution, considering the number of urban systems involved. However, although the poles invested in this growth process were numerous and scattered, not all the country was involved in this process in a homogeneous way. The economic growth of a part of the Italian territory is matched; secularly, the de-growth, or the lack of growth, of other parts of it, almost always of small dimensions in demographic terms. In these places there has been a strong reduction of the population, with consequent aging of the resident party, and a progressive reduction in the territorial capital used. A common feature of the inland areas is to present a landscape and an environmental mosaic that is still largely intact. The presence of cultural heritage and typical productions could often represent a valid starting point for the launch of a development program, with the aim of both increasing the residents’ well-being level and resolving any environmental criticalities [13].
This is the context of the Aeolian Islands, chosen as a case study to verify the rightness of the proposed methodology. The microinsular environment is characterized by considerable physical homogeneity and, until a few decades ago, by internal cohesion in the residual aspects of the traditional socio-economic structures. Despite the changes undergone over time, the archipelago has not lost its individuality today because this is linked to exceptional physical peculiarities [14]. The architecture of a territory as varied as the Aeolian Islands is naturally made up of many types, different from each other, by location, purpose and time of realization. It is common practice, however, when talking about Aeolian architecture, to refer to rural buildings that, aggregated in small villages or isolated in the countryside, were mainly used for the housing of peasants and equipped for the direct management of the many small agricultural plots [15].

2.2. Aeolian Landscape and Local Traditional Architecture

The Aeolian archipelago is a group of volcanic islands located in the Tyrrhenian Sea, 12 miles off the Sicilian northern coast (Figure 1). These isles evoke the mythological charm, since their name refers to Eolo, the Greek God of winds, who is the protagonist of one of the most famous passage from the Odyssey. The islands have been inhabited since the prehistoric age.
The Aeolian islands present a few numbers of residential settlements, which are scattered nearly uniformly in the territory and are closely interrelated to the dense network of mule tracks. This conformation creates a marvelous combination of architecture and nature, which makes the local landscape very picturesque and exclusive. From a climatic point of view, the islands have the conditions common to the coastal strip of the Mediterranean region; here, however, more intense climatic phenomena occur both in winter and in summer. Furthermore, the islands fall into an area of high seismicity, which is due both to the sliding of the African Fault and to the volcanic nature of the land [16].
All these peculiarities of the Aeolian Islands have a repercussion on the local traditional architecture. [15]. In fact, it is possible to say that it is a perfect synthesis of landscape features, energy sustainability and seismic resistance. For instance, the seismicity of this area made regular the shape of the buildings and drove to the use of stone masonry; the frequency of windy days suggested to control the global construction; the scarcity of rain focused on the use of roof terrace to collect the rainwater and to address it in a cistern, which is present in each house [17].
Therefore, the following analysis will be focused on three topics:
  • — relationship between natural/anthropic elements of landscape;
  • — precautions to ensure adequate comfort conditions;
  • — seismic resistance.
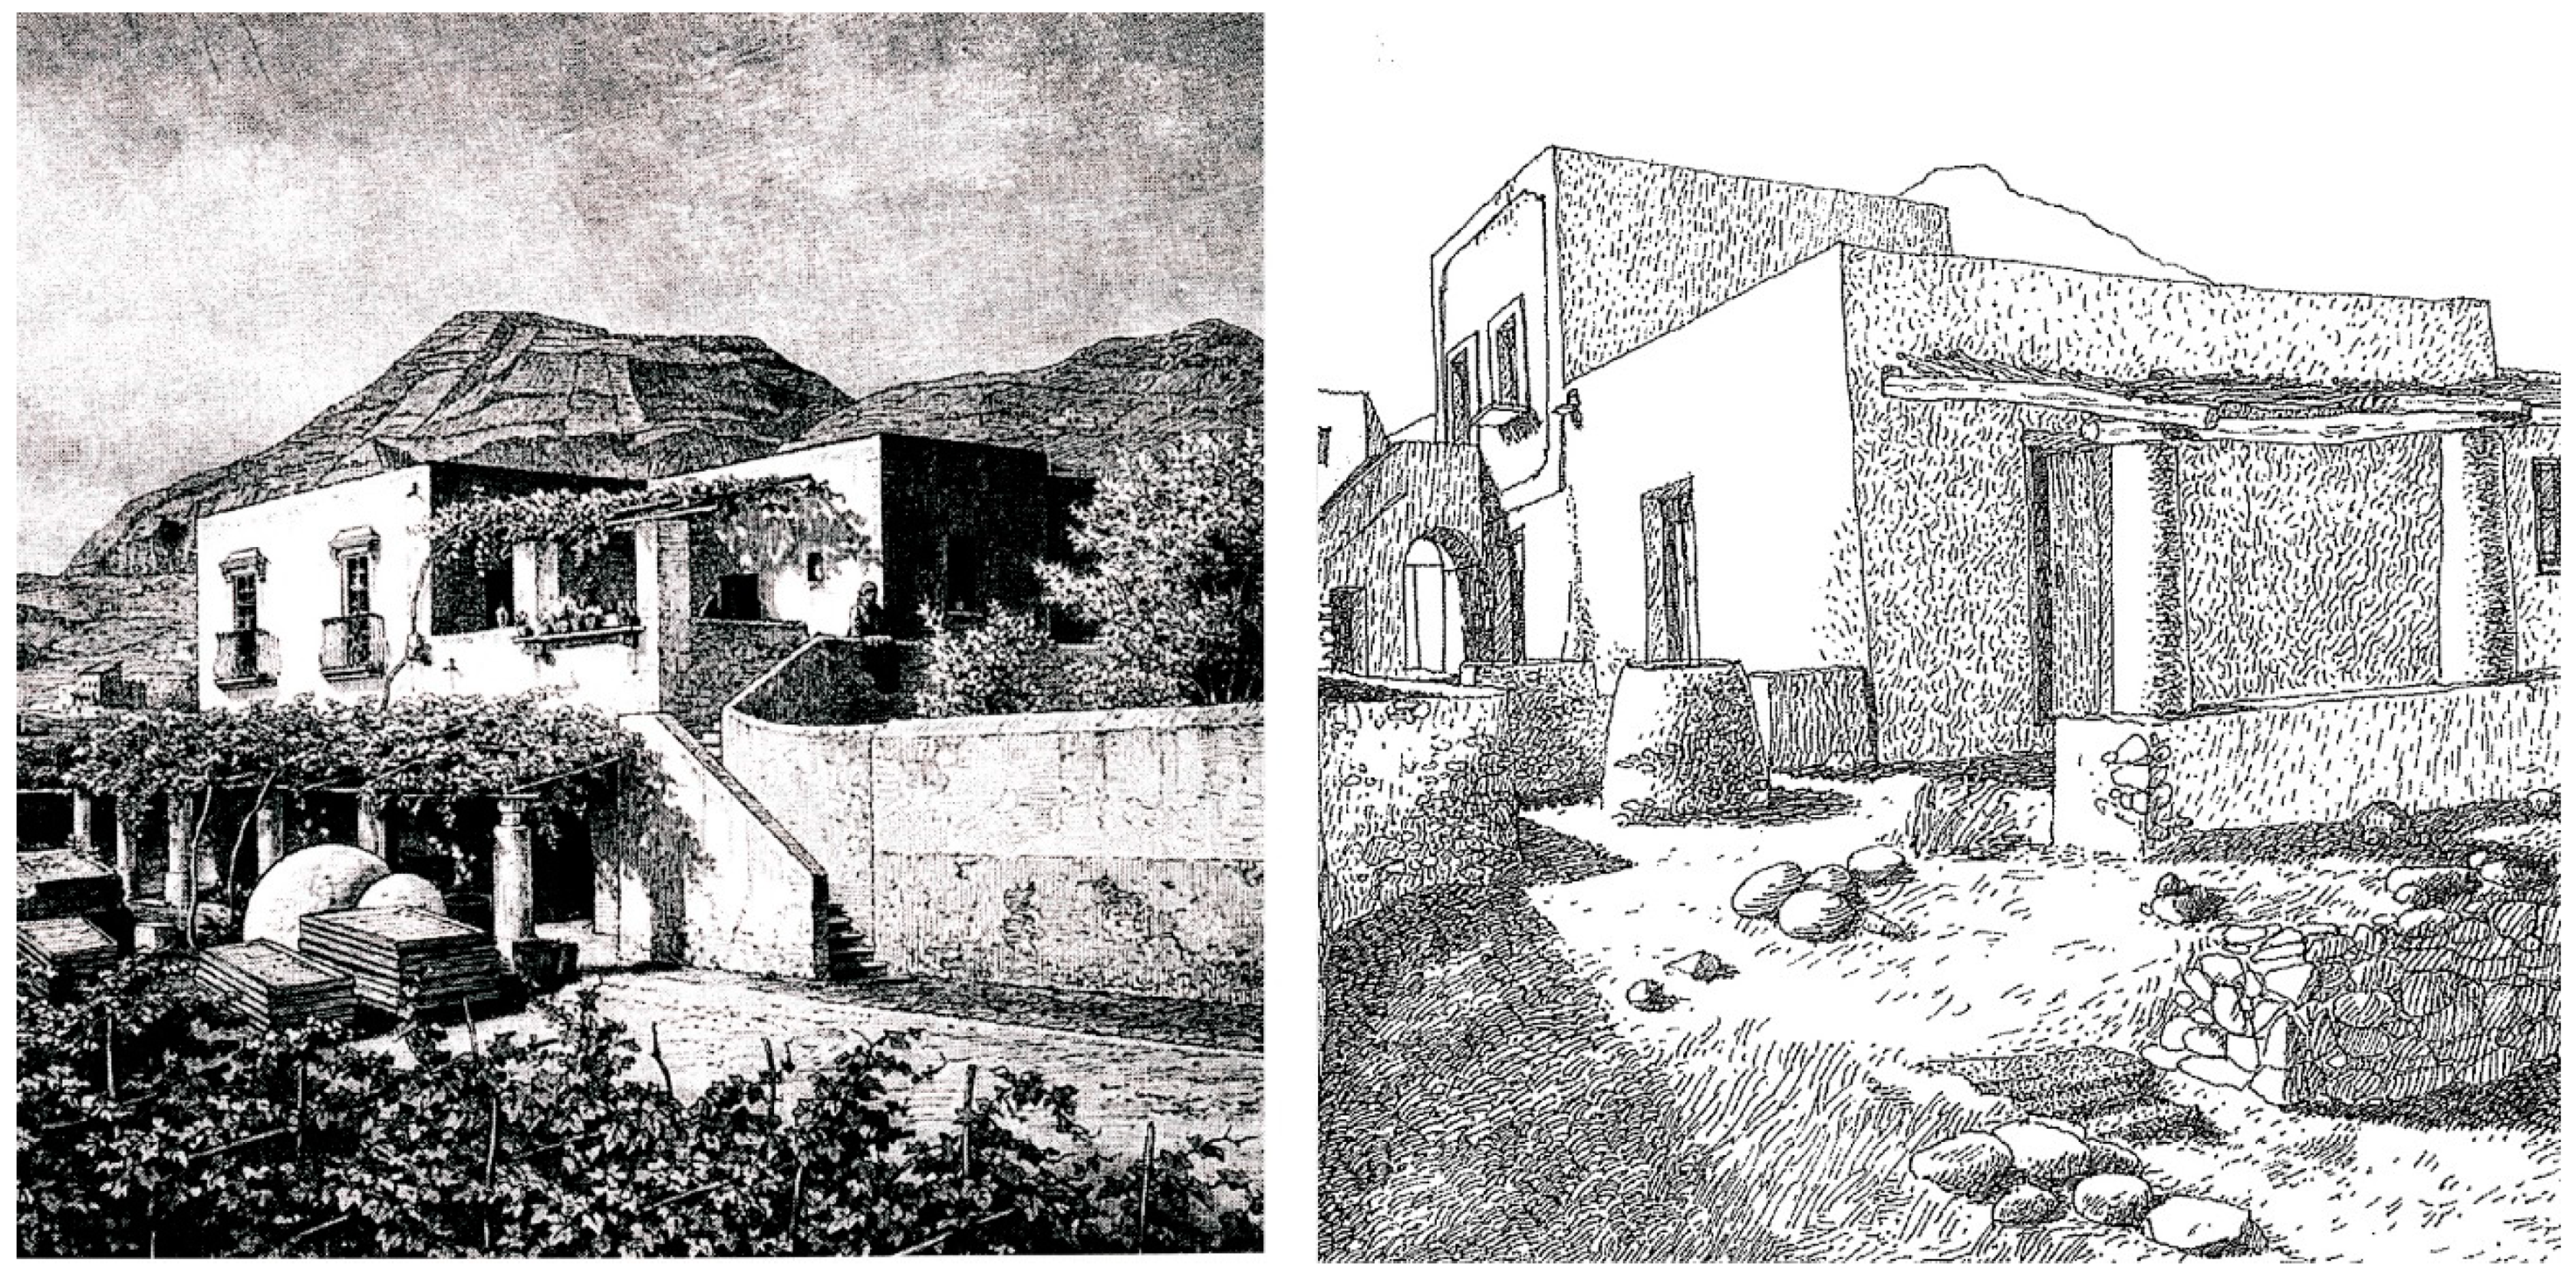
The typical Aeolian house (Figure 2) is organized on two levels, in general for two independent homes; the staircase is outdoors. The rooms are very large, squared and directly connected, without a corridor; they are situated along two parallel lines, thus, the building has a quite regular volume, with two fronts; generally, the orientation is North-South [18].
A large terrace (called in local dialect bagghio [19], from the Arabic world bahah for court) is set up in the front of the house, while at the back there is a little yard. In the past the front terrace was also used to process agricultural products. Generally, the bagghio is covered by a cane roofing. It is supported by strong wooden beams, which in turn are supported at either ends from steel wall hooks on one side and big masonry pillars on the other. These last elements are embodied in the parapet of the terrace and are called puleri [20]. Sometimes, especially for the two-level houses, the bagghio is covered by a portico; its roof forms a terrace for the upper level.
The houses are founded directly on bedrock, through an enlargement of the transversal section of the walls. The masonry is composed of rough, basaltic stones. The edges of the building are built with squared stones, bigger and denser, to have a firmer construction. The walls are 60 cm thick, on the ground floor, and 50 cm on the upper one [21].
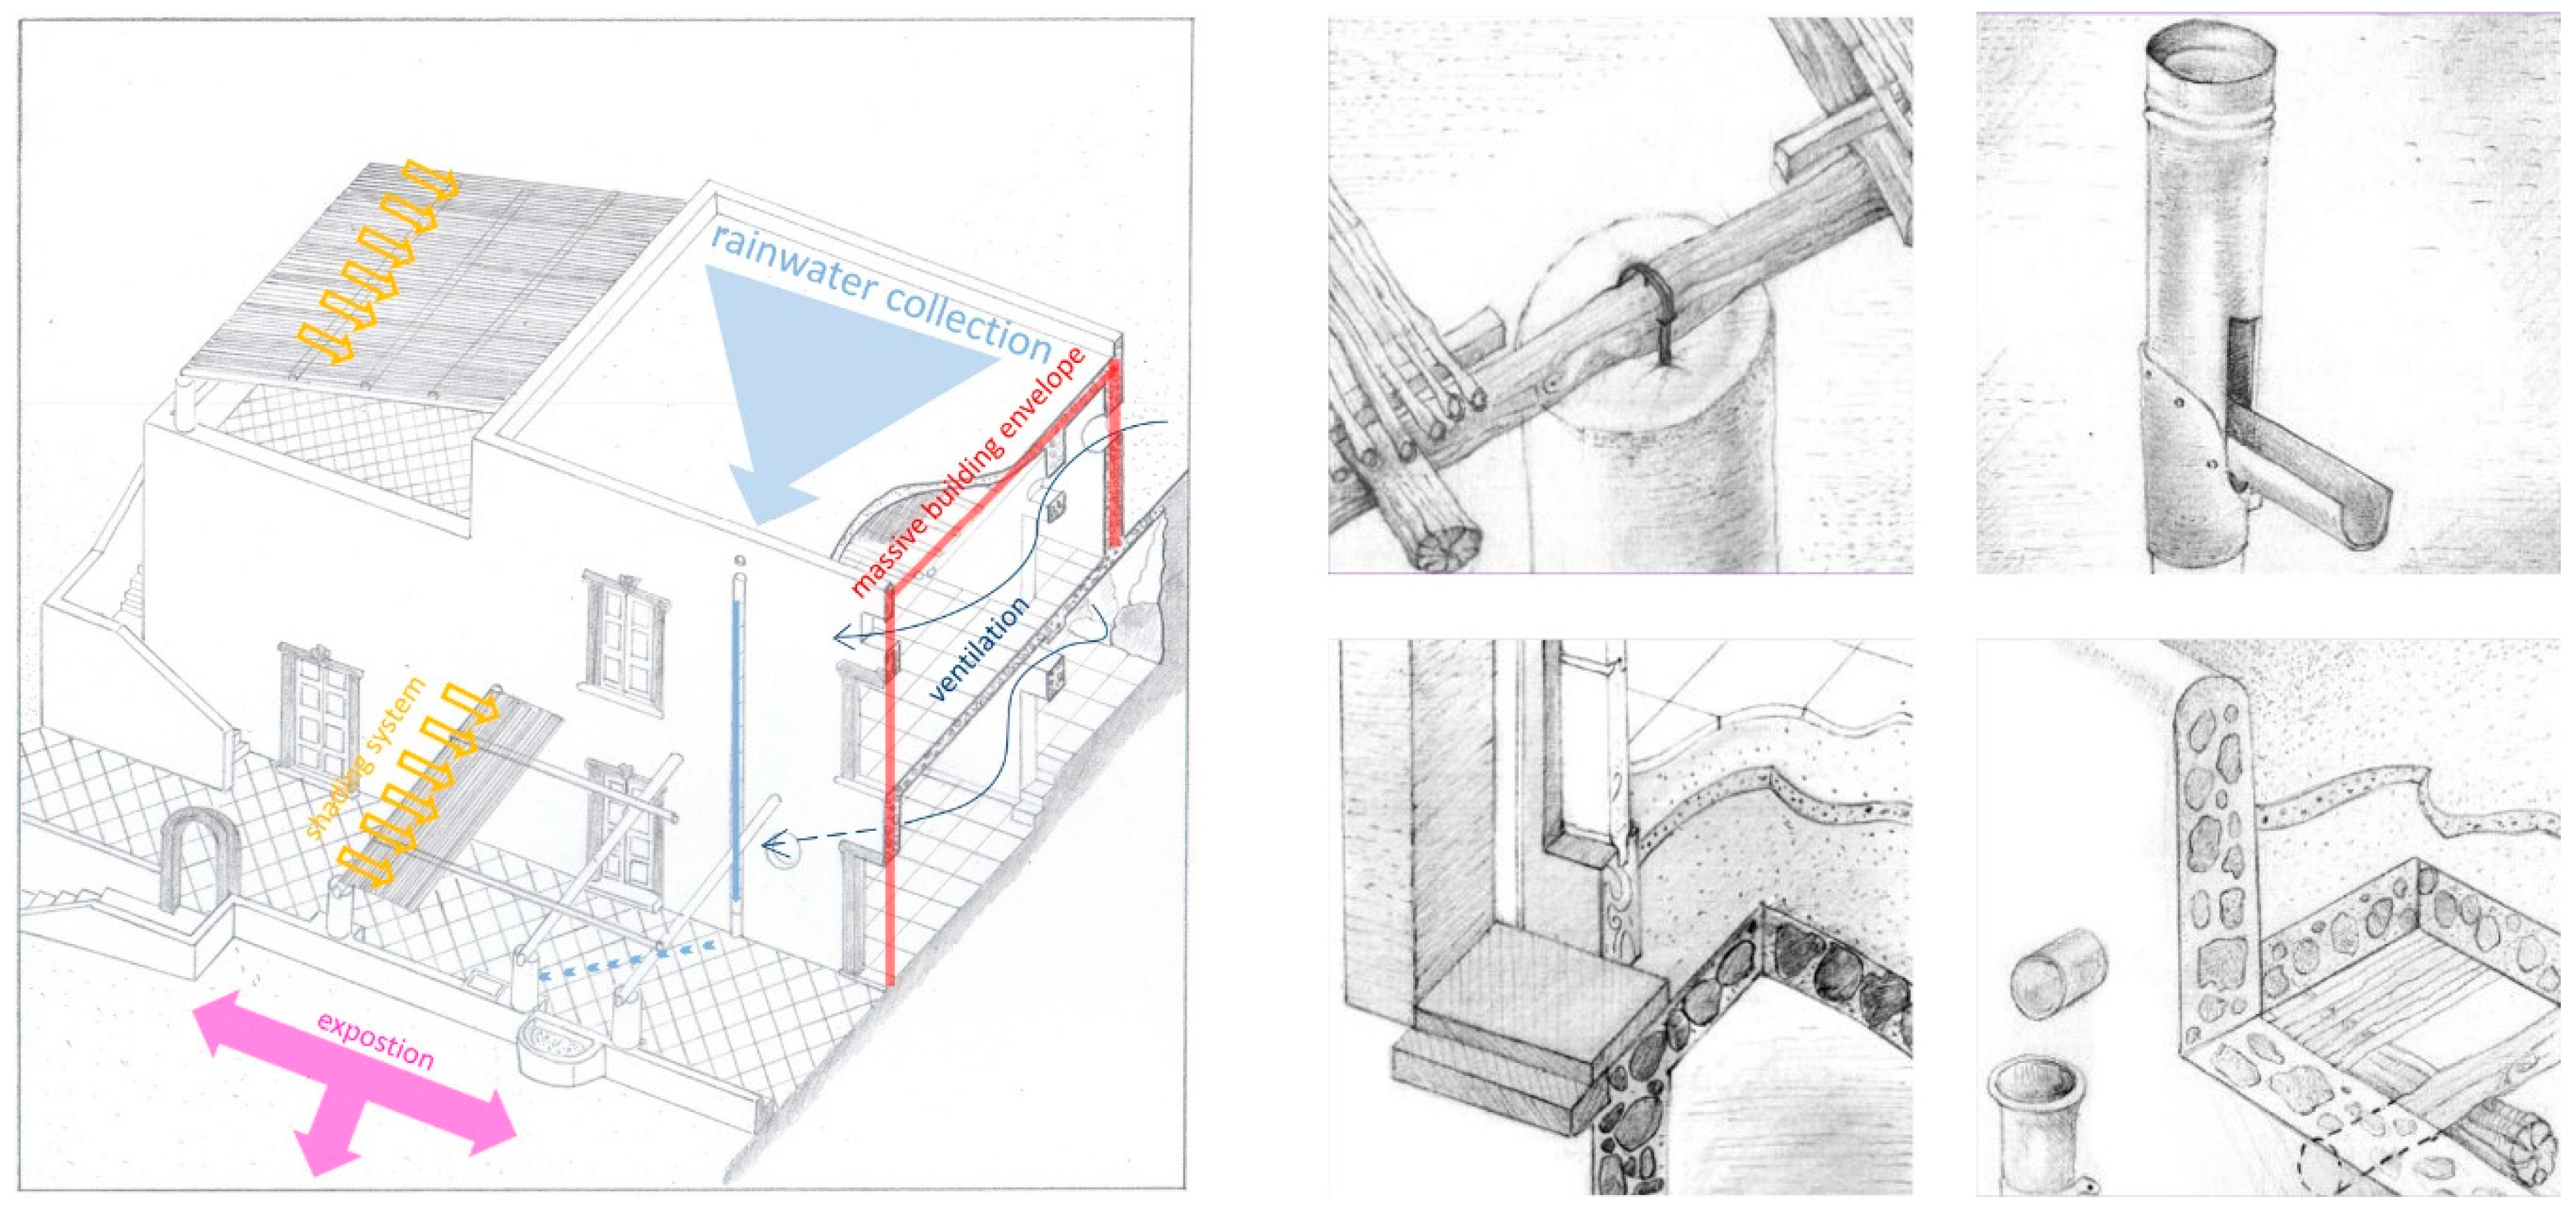
The roofs are framed by a series of wooden beams, diameter 15 cm and spaced by 50 cm, which are inserted in the wall for two thirds of their thickness, after pitching their ends to be waterproofed. A stronger beam (diameter 25 cm) is set up orthogonally to them, as a cross-piece. The beams are walnut-tree trunks, roughly decorticated, thus, their section is considerable tapered. On the upper side, there is a cane roofing, framed by the wooden beams. The extrados is formed by a casting of lime putty and volcanic pumice, 15 cm thick; during the process of making it, the mixture was beaten in order to water-proof it [22] (Figure 3). Oftentimes, the rooms on the ground floor are covered by a masonry vault, built with lava stones and lime.
The rainwater is collected and preserved in an underground cistern. Usually, it is under the terrace and its roof is part of the pavement. The parapet access-point is embodied in the boundary wall.
The finishing of the wall is plaster of lime and volcanic sand, painted with lime milk, thus, the prevalent color is white. The only different notes are the windows and their lintels, shaped with the plaster, painted with a vivid tone (the predominant colors are blue, cyan-sea, red-clay and green). In addition to the ordinary windows, normally set up in the façade, with usual shapes and dimensions, there are some openings exclusively assigned for the ventilation of the rooms.
Most of the Aeolian buildings have a very good level of conservation, from the static point of view (plumb line, absence of cracks, preservation of secondary elements, etc.); all this shows that the ancient Aeolian builders reached a very high capacity of construction. This expertise was based on three key points: vertical elements are firm and strong, horizontal elements are light and flexible; overall buildings are regular. This conformation, which is often found in the Southern part of Italy [22], can assure high performance, from a mechanical point of view, as shown in the literature [23]. Shape and mutual connection of the blocks form the most important protection during the earthquake stress.
The Aeolian house offers good protection from the harsh climate conditions in the summer. In fact, the builders of the past were able to determine the essential aim on which to focus their attention: the correct orientation, for the defense from daytime warming and shading; now, these are the aims of the sustainable design [21]. This very high performance is not a surprise, because this value is strictly influenced by the main characteristics of the Aeolian house and, in particular, by the following aspects (Figure 4):
  • — the orientation of windows;
  • — the type of the building envelope;
  • — the existence of shading systems;
  • — the possibility of natural ventilation.

2.3. Rapid Evaluation Method (REM)

Refurbishment and conservation of buildings has taken on increasing importance in the last decades, both in the field of scientific research and in the professional practice. In particular, refurbishment of larger urban structures, composed of small buildings, requires the use of effective tools to adequately control the use of resources [24].
For these reasons, today rapid assessment systems are used, often referred to the acronym REM (Rapid Evaluation Methods). They have the goal of a rapid assessment of buildings, thanks to a system of scores assigned on the basis of criteria that identify the existing conditions and guide any future interventions. Each criterion has a different weight and this allows, from time to time, to give greater importance to one aspect than to others. In short, they are proving to be an excellent tool for determining and classifying the building quality.
The first step of the analysis is the identification of the criteria. Various ways and types of them have been proposed, with a focus on the energy items. According with the literature, the approach proposed by Haapio and Viitaniemi, about a comparison between existing tools, has become prevalent [25] to understand aims and benefits.
In Canada, under the patronage of the Canadian Inventory of Historic Building (CIHB), an evaluation system has been set up. In it, the fields and categories are defined according to specific needs. In particular, there are five basic criteria (architecture, history, environment, usability and integrity); for each one of them, there are 20 detailed fields to evaluate with a vote: excellent, very good, good, fair. Other evaluations consist of a scoring system, with the use of numbers that give greater accuracy and flexibility to the evaluation; the evaluation of the building in this case is derived from the sum of the scores for each criterion. The final score assigned to the building will form the basis for future decisions in a hypothetical area management plan [26].
Under the framework of a research project carried out by the EU and the Swiss Federal Office for Education and Sciences, a multi-criteria evaluation system called Office Rating MEthodology (ORME) was developed. It includes two methods that make possible the building evaluation according to more than one criterion. With the first method, buildings could be evaluated on their energy consumption and comfort conditions, or by using a more complete set of parameters that also involve environmental factors. The second method requires the definition of weights, which allows the user to provide his personal scale. This makes sense, since a choice is never objective and always reflects a scale of values. Once this scale is assigned, the classification is objectively obtained and the classification method is objectively subjective [27].
In the last decade, rapid assessment systems have become necessary, especially during calamitous events (earthquakes, floods, etc.), when the need for rapid classification of buildings, based on damage and available mechanical resources, is still stronger. An experience in this sense was carried out in India through Rapid Visual Screening (RVS), a very fast tool to classify the vulnerability of existing buildings. The evaluation in the first level does not need any analysis but it is a question of simply detecting the structural characteristics of the buildings, which affect the seismic resistance, such as the building typology, the seismicity of the area, the soil conditions and the irregularities of the structure. Only afterwards there is the detailed analysis of the data acquired on site, through graphs and diagrams [28].
In accordance with this policy, the Italian Civil Protection have defined a procedure to evaluate the post-earthquake practicability of the houses, which is called Accessibility and Damages in a post-Earthquake emergency System (AeDES) [29]. The procedure has been defined in 2009, after the seismic event of L’Aquila. Since then, all the inspectors have to take an intensive training course that must be 30 hours long. During the Umbria and Marche earthquake, according with the high number of injured buildings, a simplified procedure called Synthetic Building Schedule for the post-Earthquake Agibility (FAST) has been defined [30].
The REM methodology is often subject to a certification process. In fact, the scientific dissemination of the results encourages the interested parties (owners, planners and local administrations) to design and to build buildings with ever-increasing environmental performance, estimated by quality certification systems. The most recent are the Leadership in Energy and Environmental Design (LEED) [31], more widespread and applied internationally, Building Research Establishment Environmental Assessment Method (BREEAM) [32], used in the United Kingdom, and German Sustainable Building Council (DGNB) [33], applied mainly in Germany. In Italy, despite the evaluation protocols for sustainable construction show the affirmation of LEED in the private market, the most widely used system is the Institute for Innovation and Transparency of Contracts and Environmental Compatibility (ITACA) Protocol, as it is applied in the public/regional level [34]. These protocols follow a recurring pattern that provides for:
  • — the evaluation of the sustainability of the site;
  • — the efficient management of resources;
  • — the optimization of energy and environmental performance;
  • — the comfort of interior spaces;
  • — the adoption of sustainable materials;
  • — the implementation of appropriate models of management [35].
These aspects are assessed by scoring on the basis of compliance with the established criteria. The sum of the points indicates the value of the analyzed work. Thanks to the evaluation, it is possible to pursue different needs and objectives, and the analysis can be used for various building types.
The lack of a unified regulatory framework and unequivocal political choices [36] has meant that the certification systems are difficult to compare, due to the wide variability. Despite this, these tools provide greater control over the design processes. This leads to an increase in the quality of projects compared to those carried out a few decades ago [37].
Having understood the importance of these tools, the International Organization for Standardization (ISO) has worked towards harmonization in order to arrive at shared and comparable assessment tools to facilitate better use of resources in the construction sector [37].

2.4. Geographic Information System (GIS)

As is well-known, GIS is a set of information technologies, data and procedures that can be used to collect, store, process, analyze and produce maps and other types of representations that can provide descriptive information on existing elements or geo-referenced events. The GIS technology integrates the ability to perform operations on the databases, such as queries and statistical analysis, with the extraordinary benefits offered by the visualization and the geographical analysis, characteristic of the maps.
The possibilities of applying GIS to the various sectors of planning, programming and management of territories and environments make it a global tool. The GIS applies the principles of geography (understood as the study and unification of various sciences capable of leading to a general understanding of the nature of the anthropized environment) to the organization and use of information, using space as a field of action for the resolution of practical problems [38].
An effective tool of this system is the QGIS (Quantum GIS) project, whose releases followed one another with remarkable speed, increasing stability and potential. Up until 2009, there were about 26 releases of QGIS. In 2009, however, QGIS reached maturity with the release 1.0.0, which developed a stable API (Application Programming Interface) that can be used by expert users to develop their own tools with languages such as Python and C++ [39].
It is clear that an instrument of this magnitude, since it was born up until now, offers a whole series of opportunities in the management of spatial data. Some experiences in the world of traditional architecture propose a five-dimensional GIS “virtual heritage”, developing a digital data system based on GIS software with all the information on the building heritage, both spatial and non-spatial information.
The database includes information for each historic building: geographical location, date of construction, number of floors, materials with which it is made, current use destination and status. GIS technology provides the basis for monitoring the status of historic buildings and information useful for leading to the recovery of existing buildings [40].
The applications of such an advanced system are varied. Among the most interesting is a recent study on the growth dynamics of urban peripheries and scenarios of impact on historical cities, applied to the city of Herat in Afghanistan [41].
The GIS platform has been used also for evaluating the potentiality of the installation of renewable energy, Photo Voltaic (PV) plant and small wind turbine, into the city area [42,43,44], as well as a support tool for developing sustainable Energy Action Plans.
Other researchers are evaluating the use of the large amount of data generated with the cities today, the so-called big data [45]. Currently, popular platforms that handle big data do not have the ability to perform spatial analysis, spatial computation or spatial data extraction. The critical problem is the storage of data, and for this reason they are starting to think of an integrated GIS platform [46].
Still about managing large data, moving to the scale of the building, the possible interoperability between Building Information Modelling (BIM) and Geographic Information System (GIS) has proved to be interesting. BIM can be used to create, manage and share vertical infrastructure data such as buildings, while GIS can be used to store, manage and analyze data describing the urban environment, which is horizontally distributed. The integration of these two instruments cannot be used only for new construction interventions, but also for restoration interventions of historic buildings [47].
Bianco et al. [48] have used architectural information from cultural heritage BIM models together with historical semantic information from GIS databases in a single platform to document and analyze cultural heritage sites for preservation and protection purposes. Similar works have been done by Baik et al. [49] and He et al. [50], which saved storage space, improved geospatial analysis capability and supported visualization at different scales then using BIM tools alone. Careggi Hospital in Florence [51] constitutes an exemplary study case based on interoperability between Revit software and open source QGIS, the same GIS platform used in our research.
Thus, the GIS platform is able to provide an extraordinary opportunity for spatial information technologies. With this in mind, the beginning of a new chapter for GIS systems is clear. On the one hand, it increases space-time analyses and visualization in various information systems; on the other hand, it provides a powerful geospatial data system to support different fields: available resources, environment, energy and city development are just some of the relevant topics.

3. Methodology

The methodological approach of this study aims to provide synthetic indications on the architectural qualities of traditional buildings by systematizing data on the most significant parameters relating to its performance and to urban agglomeration (e.g., neighborhood, district, etc.).
To this goal, evaluation sheets, typical of REM, have been developed. These sheets contain the different parameters identified for characterizing, as fully as possible, the buildings and their agglomeration. Then, a weight is assigned to such parameters, in order to classify the buildings with respect to a grid of “values”.
The operating procedure involves a field survey phase and the subsequent implementation of the information processed within a GIS platform. The use of the platform allows both a rapid and multi-faceted possibility of querying the database that contains the cognitive parameters of each building and the possibility of its continuous updating.
The proposed evaluation sheet model is divided into six macro-frameworks, each of which provides specific useful information for the characterization of the sample buildings. Table 1 lists the six frameworks and the kind of information contained within them.
In the Geometry framework, it is possible to find the photographic survey, sketches of the building and any notes. The data deriving from the calculation of energy performance or structural stability can be seen in the Supplementary Data category.
The categories Building, Structure and Energy are the categories for which the functional and cognitive parameters are defined, which allow characterizing the quality of the building with reference to each macro-area.
The number of functional parameters that can be chosen is one of the elements that characterize the detailed degree of the evaluation system. In the case study that will be illustrated in the following sections, 18 functional parameters have been identified for each of the three macro-areas, of which eight are classified as basic features and 10 as advanced features.
The distinction between basic and advanced features lies in the fact that the “basic” characteristics refer to aspects of the building that are difficult to modify with an ordinary refurbishment works. On the contrary, the “advanced” characteristics refer to building features that can be modified taking into account the current technological developments.
The evaluation system was developed by assigning a weight/score (yi) to each functional/cognitive parameter chosen to describe the performance in the j−ma macro-area: Building (j = 1), Structure (j = 2) and Energy (j = 3).
The scores must be assigned to the basic categories range, from a minimum to a maximum of value. For some of them there is the possibility to assign an intermediate score (e.g., max =2; min = 0; intermediate = 1). In general, coherently with the REM philosophy, the attribution of the maximum or minimum scores requires to verify if some specific condition is fulfilled (i.e., coherence or incoherence with the traditional constructive technologies, availability or not of arrangements; exceed or not of a threshold value and so on).
The distribution of the scores into the different categories is a function of their relevance in defining the quality level of the buildings. In compliance with the teaching of Vitruvio [52] who considers architecture as an inseparable whole of different aspects, the frameworks Building, Structure and Energy are considered equivalent for defining the quality of the chosen building. Therefore, the sum of the scores of the 18 functional parameters was set equal for all the categories. The maximum achievable score for each category was set at 30. As a result, the maximum score that a building can potentially reach is 90:
max ,   i = 1 n y i , j = 30
max ,   j = 1 m i = 1 n y i , j = 90
The grid of the scores assigned to each functional parameter has fundamental importance and requires high attention by the designers. To check the robustness of the assumed grid of values it is necessary to carry on a preliminary sensitivity analysis.
Subsequently to the attribution of the scores, it is possible to perform simple statistical analyses by determining the average value μ and the standard deviation σ that the sample buildings have reached in each of the j−ma macro-area defined above:
μ j = i = 1 n y i , j N
σ j = ( i = 1 n y i , j ) 2 N
N = total number of the sample of buildings being evaluated.
The average values and the standard deviations can be used as a reference to highlight within the GIS platform which are the buildings with scores below/above the average or those that are beyond the thresholds of the standard deviation.
For each building a set of information will be available regarding its geometry and also the complete data on thermophysical features of the envelope as well as the kind of heating/cooling system. Thanks to these data it is possible to determine the energy classification of the building object of the survey. In this context a very useful tools that allow to determine the energy class, using a reduced set of input data, is the DOCET software, which implement the algorithms of the UNI TS 11300. DOCET may be used for the energy certification of residential buildings with a net area lower than 200 m2, so it is compatible with the chosen test-site.
Thermal energy needs for heating and cooling are determined by applying a monthly steady-state balance between energy losses (by transmission and by ventilation) and (solar and internal) gains corrected with the gain or loss utilization factors. The energy class is not included among the indicators used for describing the quality of the building in the Energy macro-area because the energy certification requires a post-elaboration of the data coming from the survey and cannot be included in a REM analysis. However, it is evident that the energy certification could be determined and the main results could provide many further information on the current state of the building into the investigated area.

Structure of the Database on the GIS Platform

The study carried out requires the possibility of archiving, elaborating and updating all the information deriving from the analysis and surveys carried out on the sample of the investigated buildings. The platform that can be used for this purpose is a GIS software that, compared to other types of databases, allows georeferencing all the information contained in it.
Georeferencing is obtained by defining a reference system. After this, it is possible to import the reference cartography, generally consisting of an orthophoto in tiff format, in the GIS environment.
Once the project reference system has been set, all the raster and vector data that are created must be imported, using such a coordinate reference system.
To build a database in GIS environment requires the creation of a vector called “shapefile,” for which the polygon type must be specified and the reference system set. Then, the properties of the vector are defined in the entry “fields”.
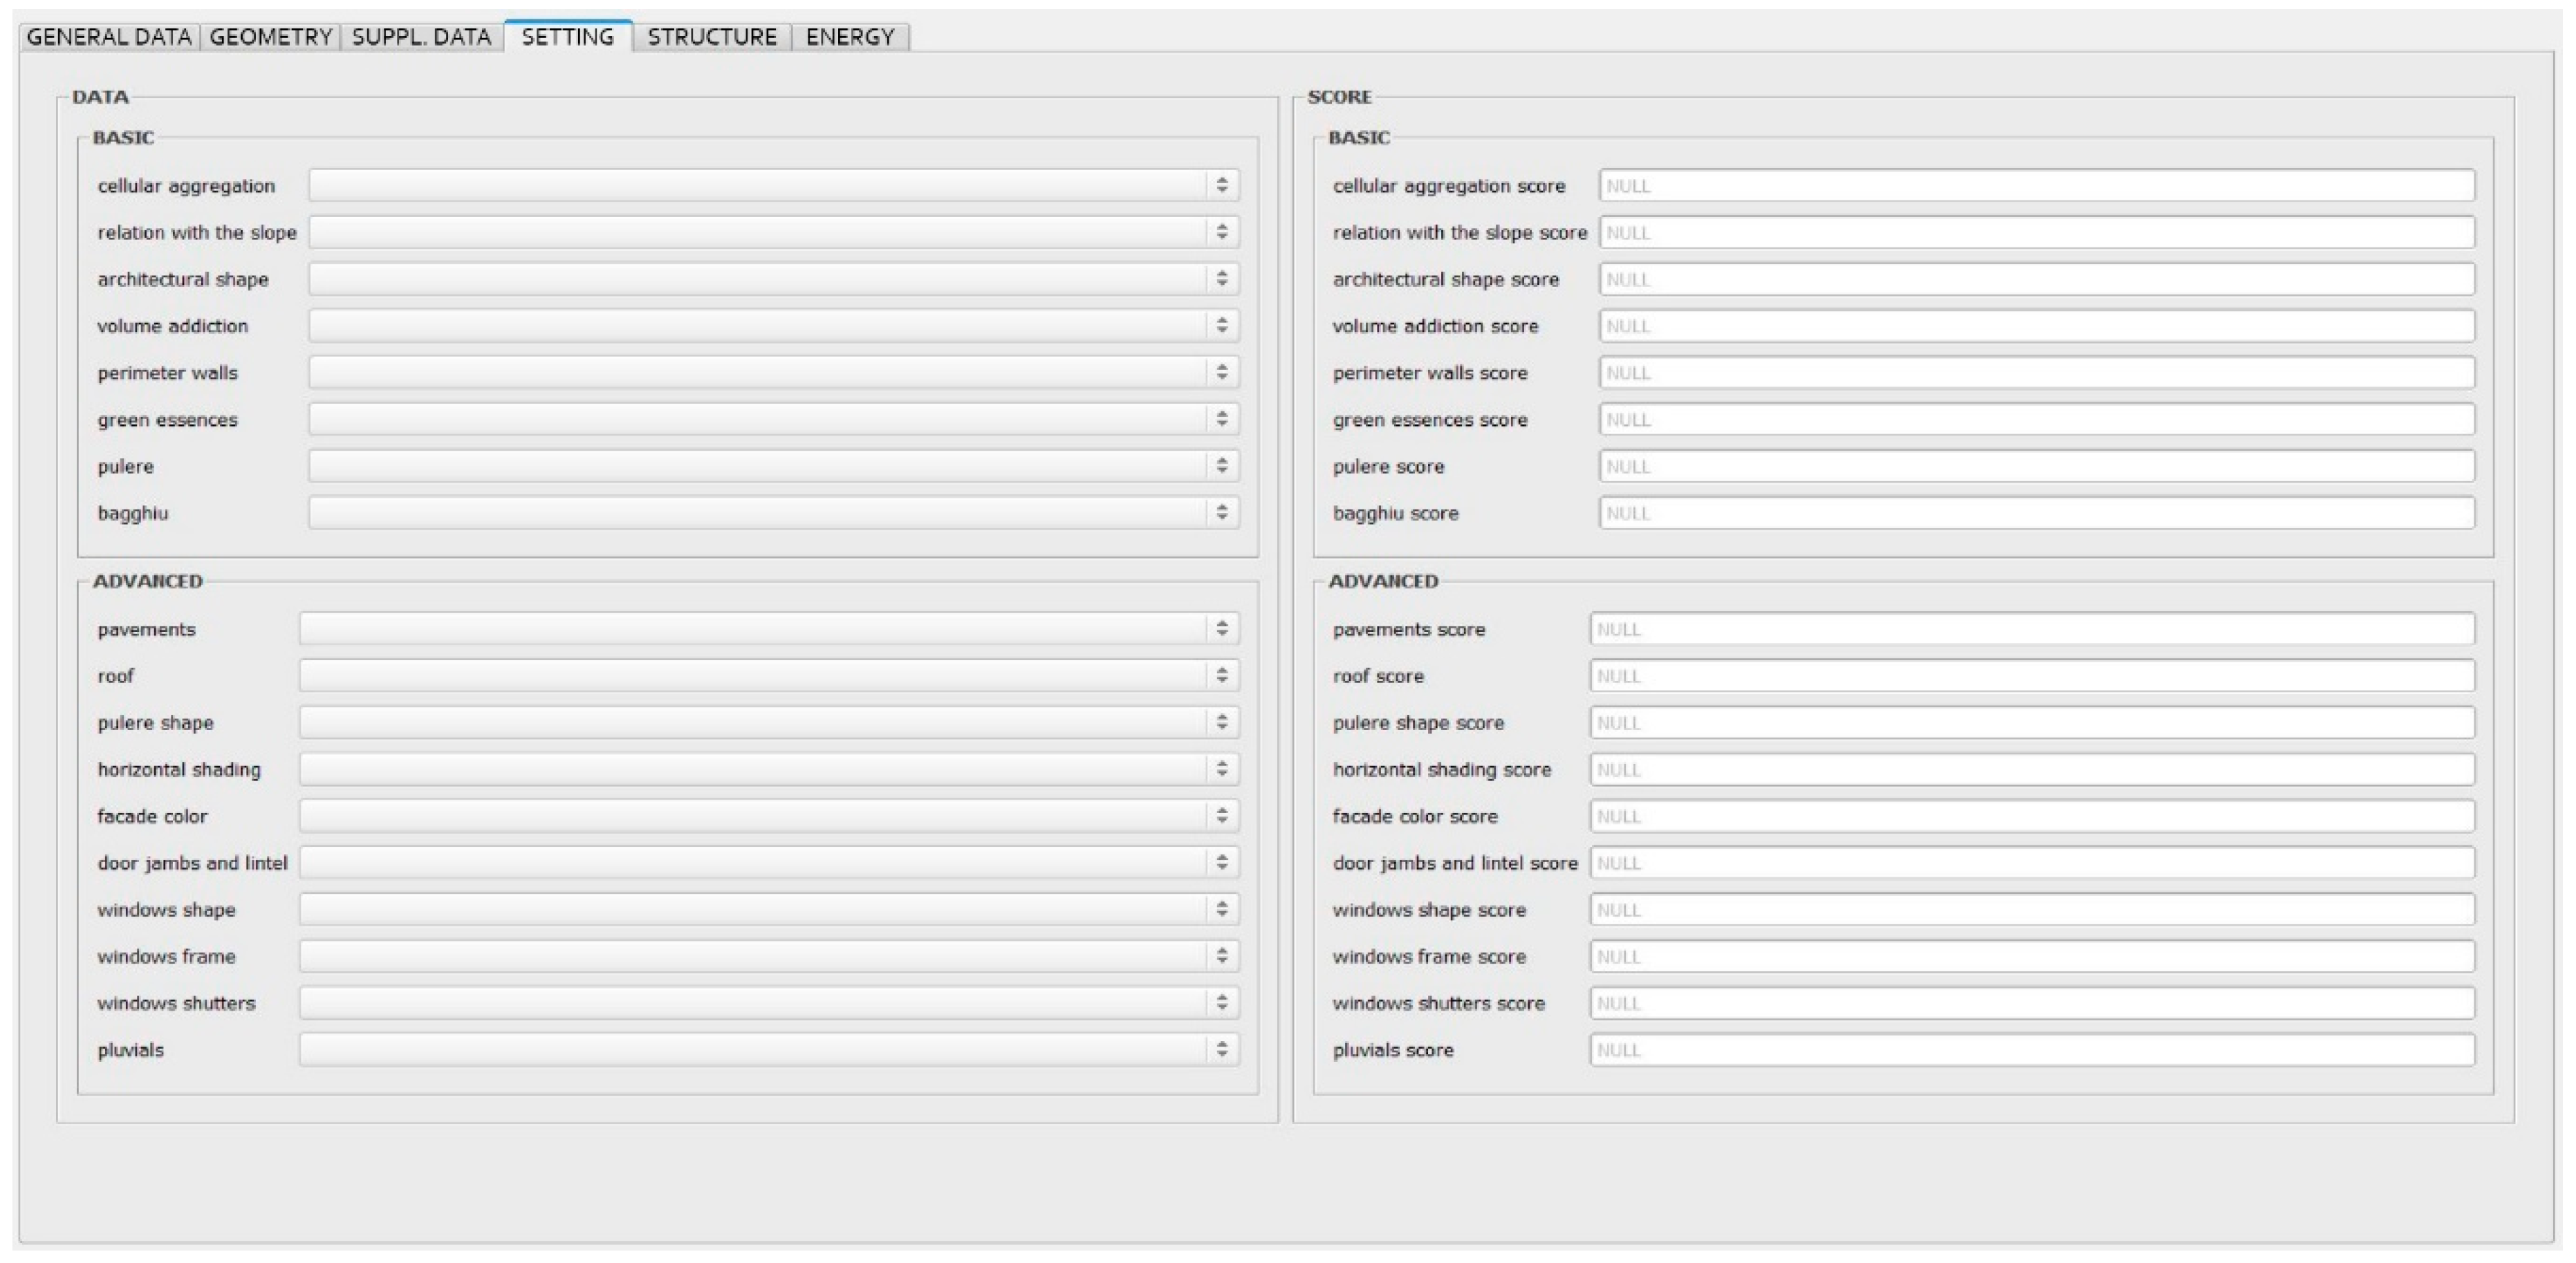
Through the editor, using the function “creates a reference mask”, the table of attributes is created (Figure 5). This table has to contain all the descriptive parameters, which were defined for the five macro-areas (i.e., General Data, Geometry, Extra Data, Building, Structure, Energy) defined in the survey phase for describing and evaluating the current state of the buildings.
For each category, as many “fields” are created as there are the cognitive and functional parameters selected for each macro-area (10 basic and eight advanced).
The following figure shows an example of one table of attribute. In particular, such a table is referred to the framework Building. It contains eight basic parameters and 10 advanced parameters as specified in the previous section.
For the three macro-area, Building, Structure and Energy, for which the assignment of a score is foreseen to each descriptive/cognitive parameter, the “values map” widget is further defined.
In this way, all the parameters that constitute the evaluation sheet can be transferred to the GIS environment, as a vector file, and displayed in the table of attributes. Thus, it will be possible to fill it with the data coming from the survey analysis.
In order to associate the relative score with each characteristic of the buildings, it is necessary to introduce a “virtual field.” This “virtual field” has to contain the same data present in the corresponding “field” (i.e., name, type, length and precision), as well as the function for calculating the score of the field, if requested.
The result of the function inserted in the virtual field is automatically updated whenever one of the parameters used in the expression changes, without having to perform the calculation again [53].
In expressions, it is possible to use different mathematical operators, including the sum, subtraction and inequalities, as well as the functions to perform conditional checks (e.g., CASE WHEN … THEN … ELSE … END). These functions return a different result depending on whether a condition is true or false, with the possibility of testing multiple conditions.
In each “virtual fields” Building, Structure and Energy Score, it is possible to calculate the sum of the scores obtained in each macro-area. The Total Score field provides the overall scores obtained by the building, taking the sum of the partial scores.
Table 2 shows an example of the application of the evaluation procedure for a single building.

4. Application on the Test-Site

4.1. Filicudi Island Choosing

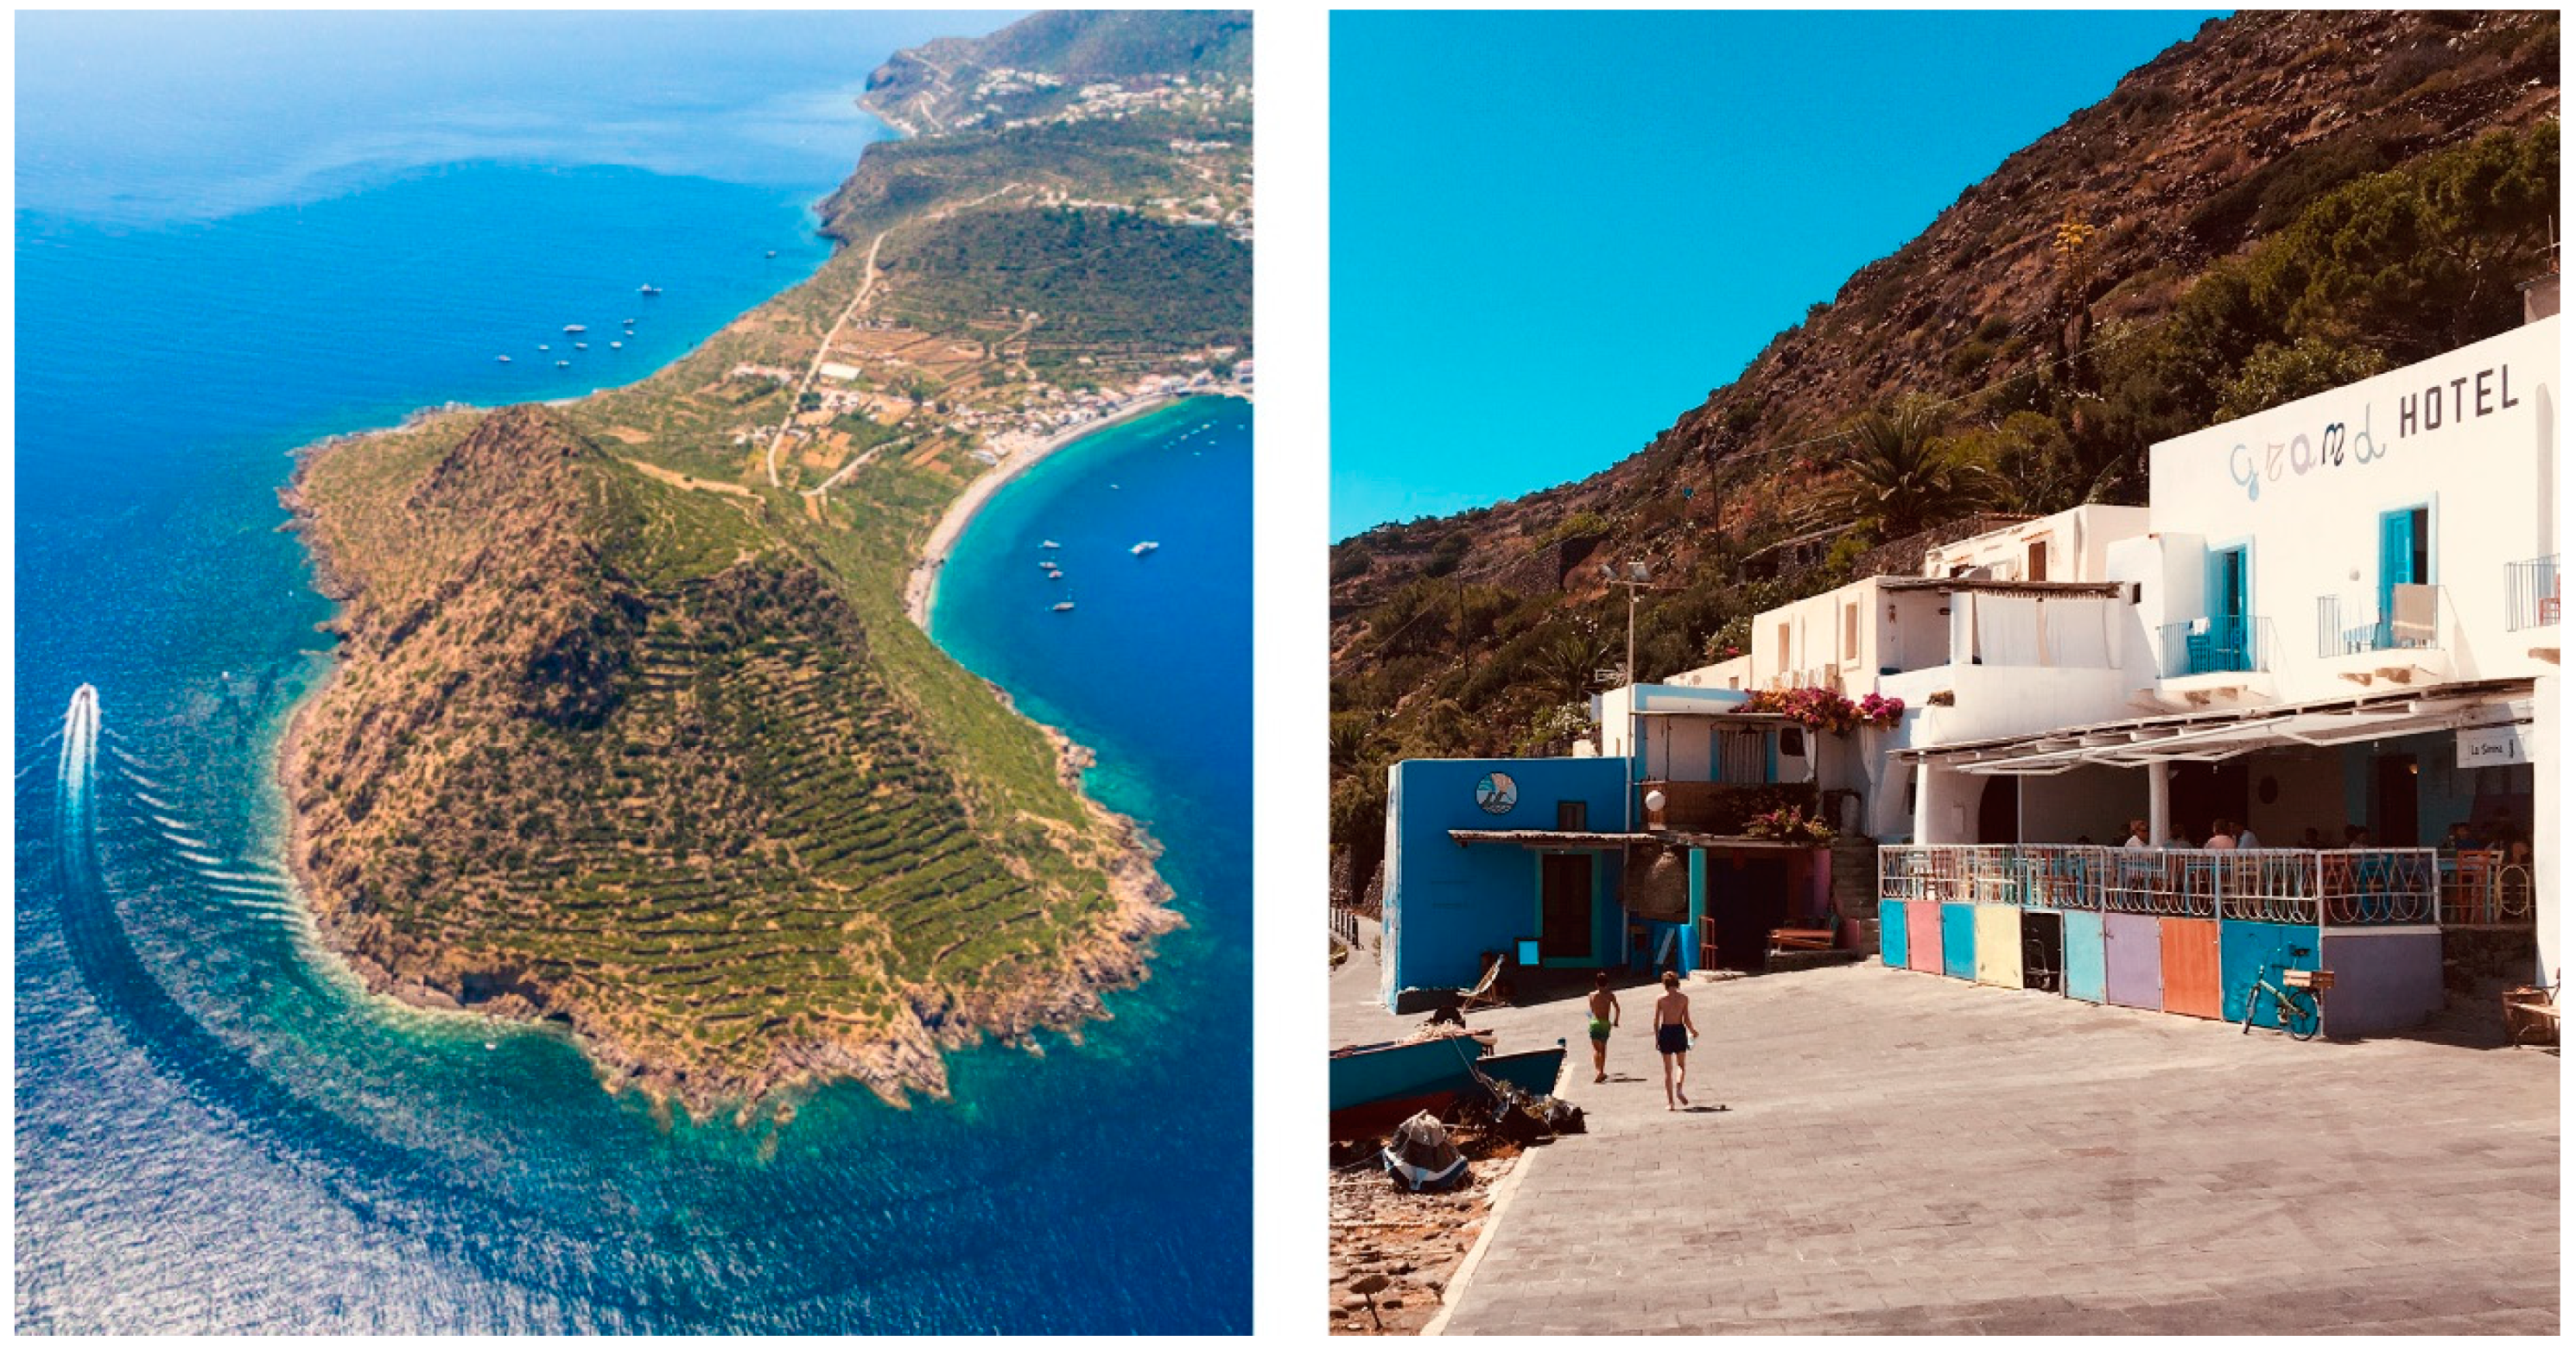
In the context of the Aeolian Islands, Filicudi (Figure 6) is the island that, together with Alicudi, has suffered less deterioration. The new buildings are very few and the renovations have been carried out respecting the original conformation, even if Di Maggio has highlighted some inconsistencies [14]. Thus, Filicudi is a representative place for the entire archipelago and, for this reason, it was chosen as a field of experimentation.
Filicudi is the outcrops part of a large volcanic system which is one thousand meters high, under the water level. Others parts of this volcano are La Canna, a rock near the isle and the Filicudi’s bank, located 47 meters under the sea level, on the north-west side [54].
The ancient name is Phoenicusa. Probably, this is due by the ferns (in Greek Phoenic) that covered its ground. The firsts human settlements started from the Neolithic age (3000 B.C.) in Filobraccio, the land that links the main part of Filicudi with the hill called Capo Graziano. Here, there is a more important prehistoric village, from the second millennium B.C. [55].
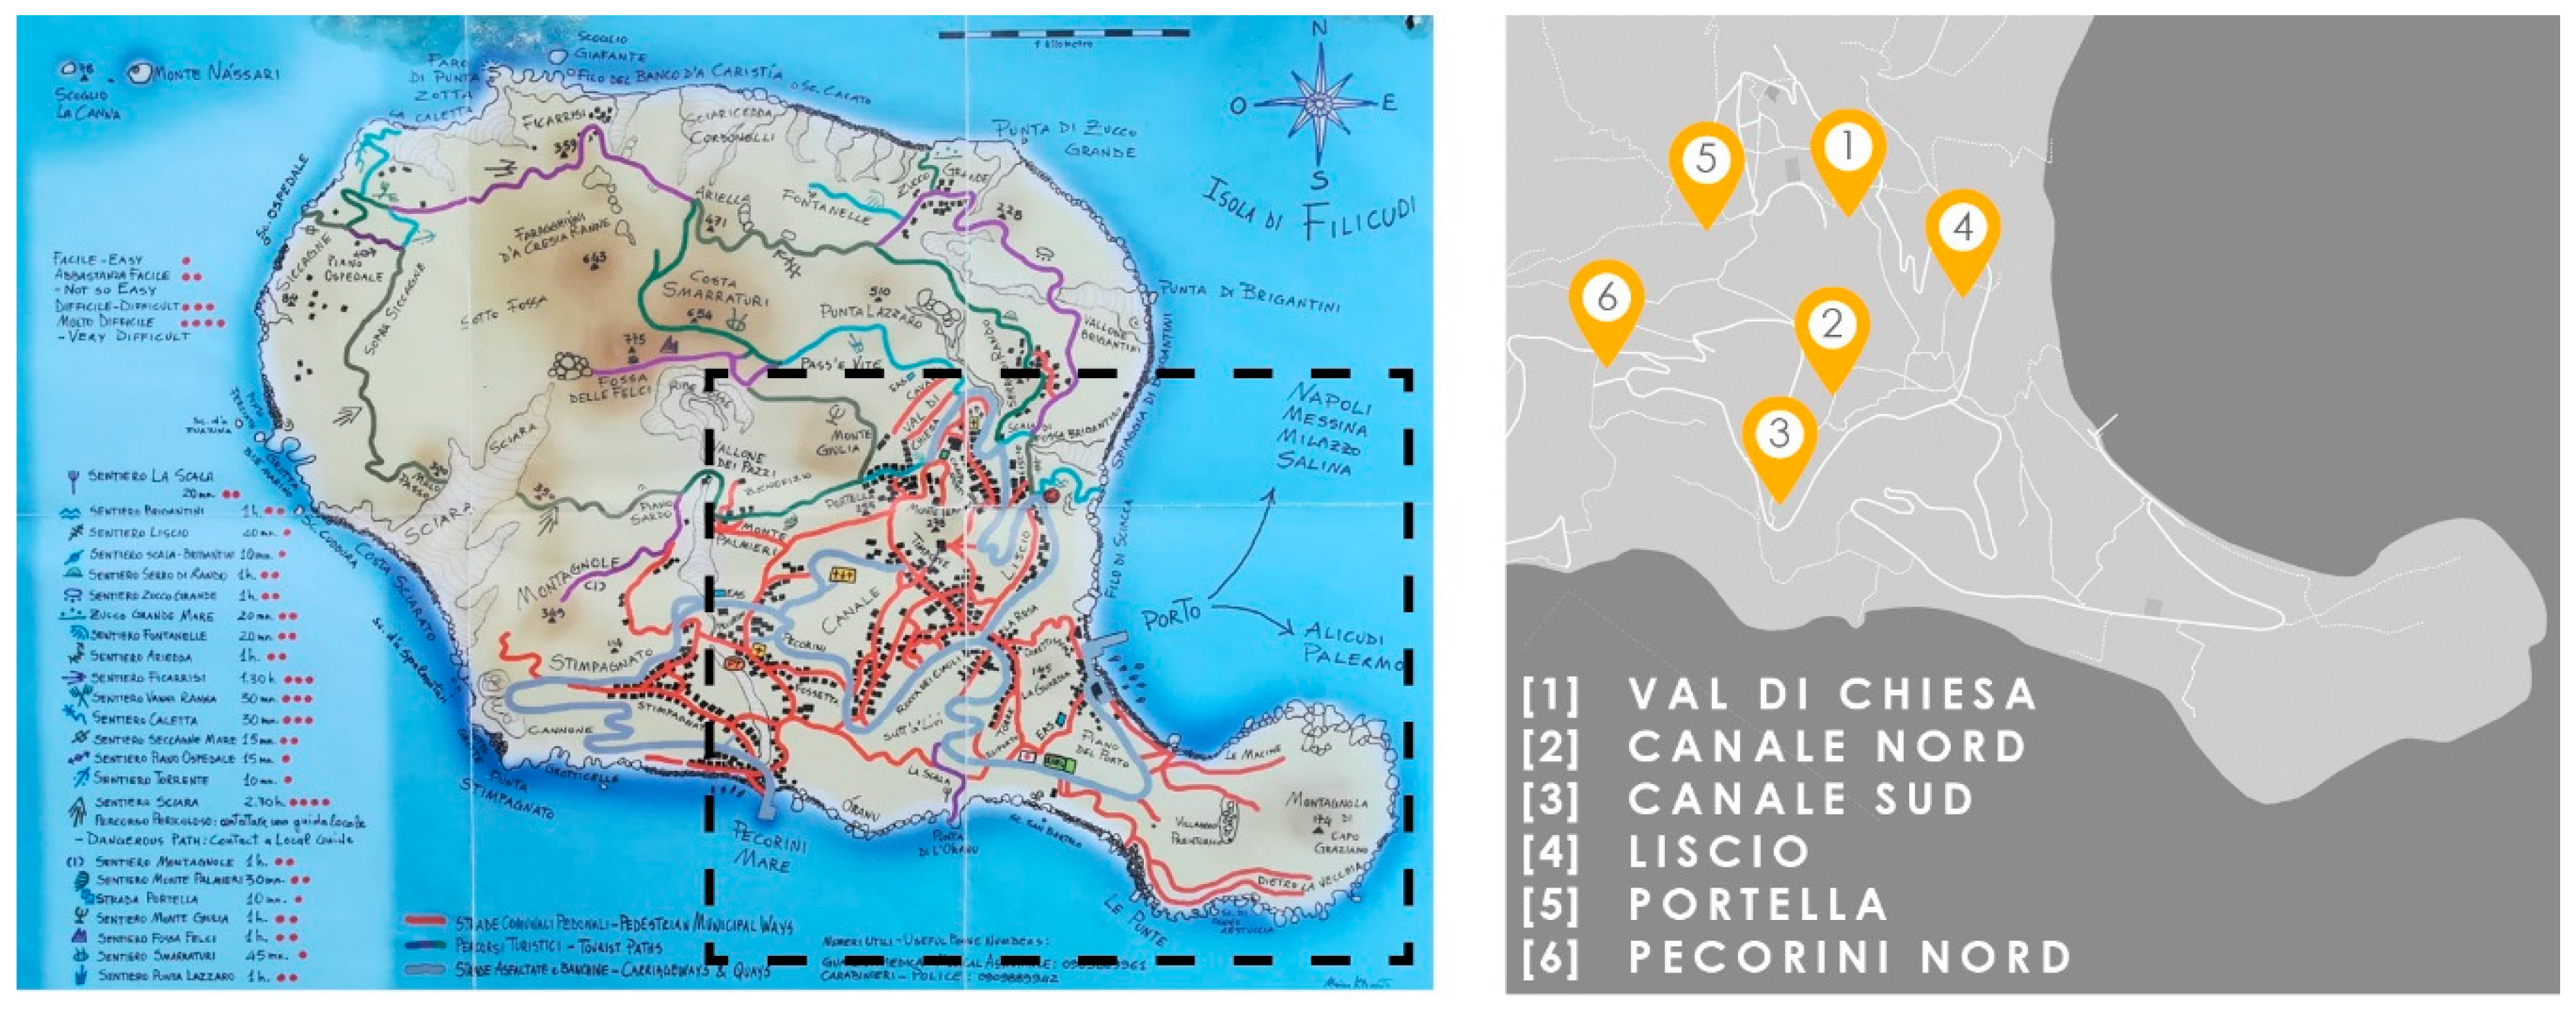
Mostly of the residential areas are linked between a modern road; however, a grid of mule tracks still survives (Figure 7). The paths have a typical paving in lava stone pieces [54]. The mule tracks and the terracing landscape, built in the ancient ages for agricultural reasons form a wonderful example of sustainable anthropization [55]. In Filicudi, there is no public light system, to maintain the integrity of the night landscape, even if there is a power station to satisfy the internal requests [56].
The inhabited areas of Filicudi are located between the coast and the lower parts of the internal hill. According with the accessibility and the environment conditions, in some part of the island the house density increases; each one of these places is called “Contrada” (an Italian idiomatic expression). The Contrada are 10 [55]; the largest ones are located on the south-east side.
The study has been addressed to the following contrada: Valdichiesa, Canale Nord, Canale Sud, Liscio, Portella and Pecorini Nord. It has been excluded only the contrada located on the eastern side (two ones) and the Contrada on the coastal areas (two ones). The first ones have a problem of accessibility, because they cannot be reached by the driveway. The second ones are less interesting, because the architecture has been influenced from the outside, transforming its characteristics.

4.2. Sample Selection

The data was collected on a representative sample of buildings in each of the selected Contrada. The number of building units on the island of Filicudi between 450 and 550 are revealed from the tables of the town plan. Based on a statistical method, a sample of about 180 units was extracted from this population of building units, corresponding to more than 30%, on which to carry out the survey. The buildings were exactly identified within the six selected districts. All buildings with a specialized use have been excluded, such as churches, in order to make the evaluation result as uniform as possible. In total, the survey phases were calibrated to record an average of 30 buildings for each district.

4.3. Features Detection and Weighing

The evaluation system was developed by assigning a weight/score (yi) to each parameter used to define the quality of the buildings with reference to the three macro-areas Building, Structure and Energy. In particular, for each of the three macro-areas (j = 1, 2, 3), 18 parameters were defined, of which eight were defined as basic (basic), and 10 as advanced (advanced). Table 3 lists, for the three macro-area used to define the classification system, the eight basic parameters and the relative scores.
The choice of the basic parameters has followed two criteria: on the one hand they should be of rather simple detection; on the other hand, they have to give as much as possible a picture on the current state of the building that is subject to the survey.
Thus, regarding the Building macro-area, the indicators chosen substantially describe the integration of the building in the specific context of the Aeolian architecture.
The parameters in the Structure macro-area give information on the geometrical and structural features that contribute to reduce the risk of structural collapse under a seismic action.
Regarding the Energy macro area, the parameters chosen should highlight the building features that allow to guarantee acceptable thermal comfort conditions reducing the energy consumption as much as possible for the building conditioning as well as the building lighting.
In this context, all the elements that contribute to reduce the energy needs, especially during the summer period, have been emphasized (e.g., shading system, overhangs, natural ventilation and so on).
The scores attributed to the basic parameters requires the assessment of the existence of specific features (totally or partially), which are typically of the Aeolian architecture (e.g., landscape context, shape of the building, orientation, number of floors and so on).
Within the basic parameters, a further subdivision was made identifying two “plus” features for each macro-area (e.g., Building, Structure and Energy) to which a greater importance is attributed for identifying the building qualities. Specifically, the “basic plus” features are Pulere and Bagghiu, for the Building category; Plan and Height regularity for the structure category, Daylighting and Natural ventilation for the Energy category. The scores that can be assigned to the basic categories range from a minimum of zero to a maximum of 2, with the possibility, for some of it, to assign an intermediate score (e.g., 1). In general, coherently with the REM philosophy the attribution of the maximum or minimum scores requires to verify if some specific condition is fulfilled (i.e., coherence or incoherence with the traditional constructive technologies, availability or not of arrangements; exceed or not of a threshold value and so on).
In the case of the “basic plus” parameters, the scores that can be assigned vary from a minimum of zero to a maximum of 4, with the possibility of attributing an intermediate score of 2.
The basic features, to guarantee an adequate score to the basic parameters, may achieve a maximum score of 20 points. Thus, the summation of the scores for the three categories can reach 60 points at most, which represent the 2/3 of the maximum available scores for each building.
Unlike the basic ones, the advanced part is set in view of possible minimal interventions that can bring the building to a higher quality level. For each macro-area, 10 advanced features have been identified. For them, it is possible to choose between two options that assign score +1 or −1; thus, the maximum score obtainable is +10. In this case it is possible to obtain even negative scores, at most—10. Table 4 shows the advanced parameters and the relative assigned scores.
It is possible to highlight that in the macro-area Energy a positive or negative score is attributed to the existence of a cooling/heating system, recognizing their importance on the global quality of a building. However, the contribution in terms of weight is almost limited in comparison with the other features that allow to exploit the passive capacity of the building to contrast the weather forcing.
The threshold values defined for the thermal transmittances do not meet the current limit defined by national regulations for the climate zone B, in which Filicudi is included. They were chosen in accordance with the actually constructive technologies used and having in mind to maintain as much as possible the typical characteristic of the building without distorting their current thermal performance, or even worse, to design execute invasive intervention of renovation.

4.4. GIS Platform Processing

The database within which the architectural, structural and energy characteristics of a sample of buildings in the Filicudi area will be inserted, has been developed using the free and open source software Quantum GIS (QGIS).
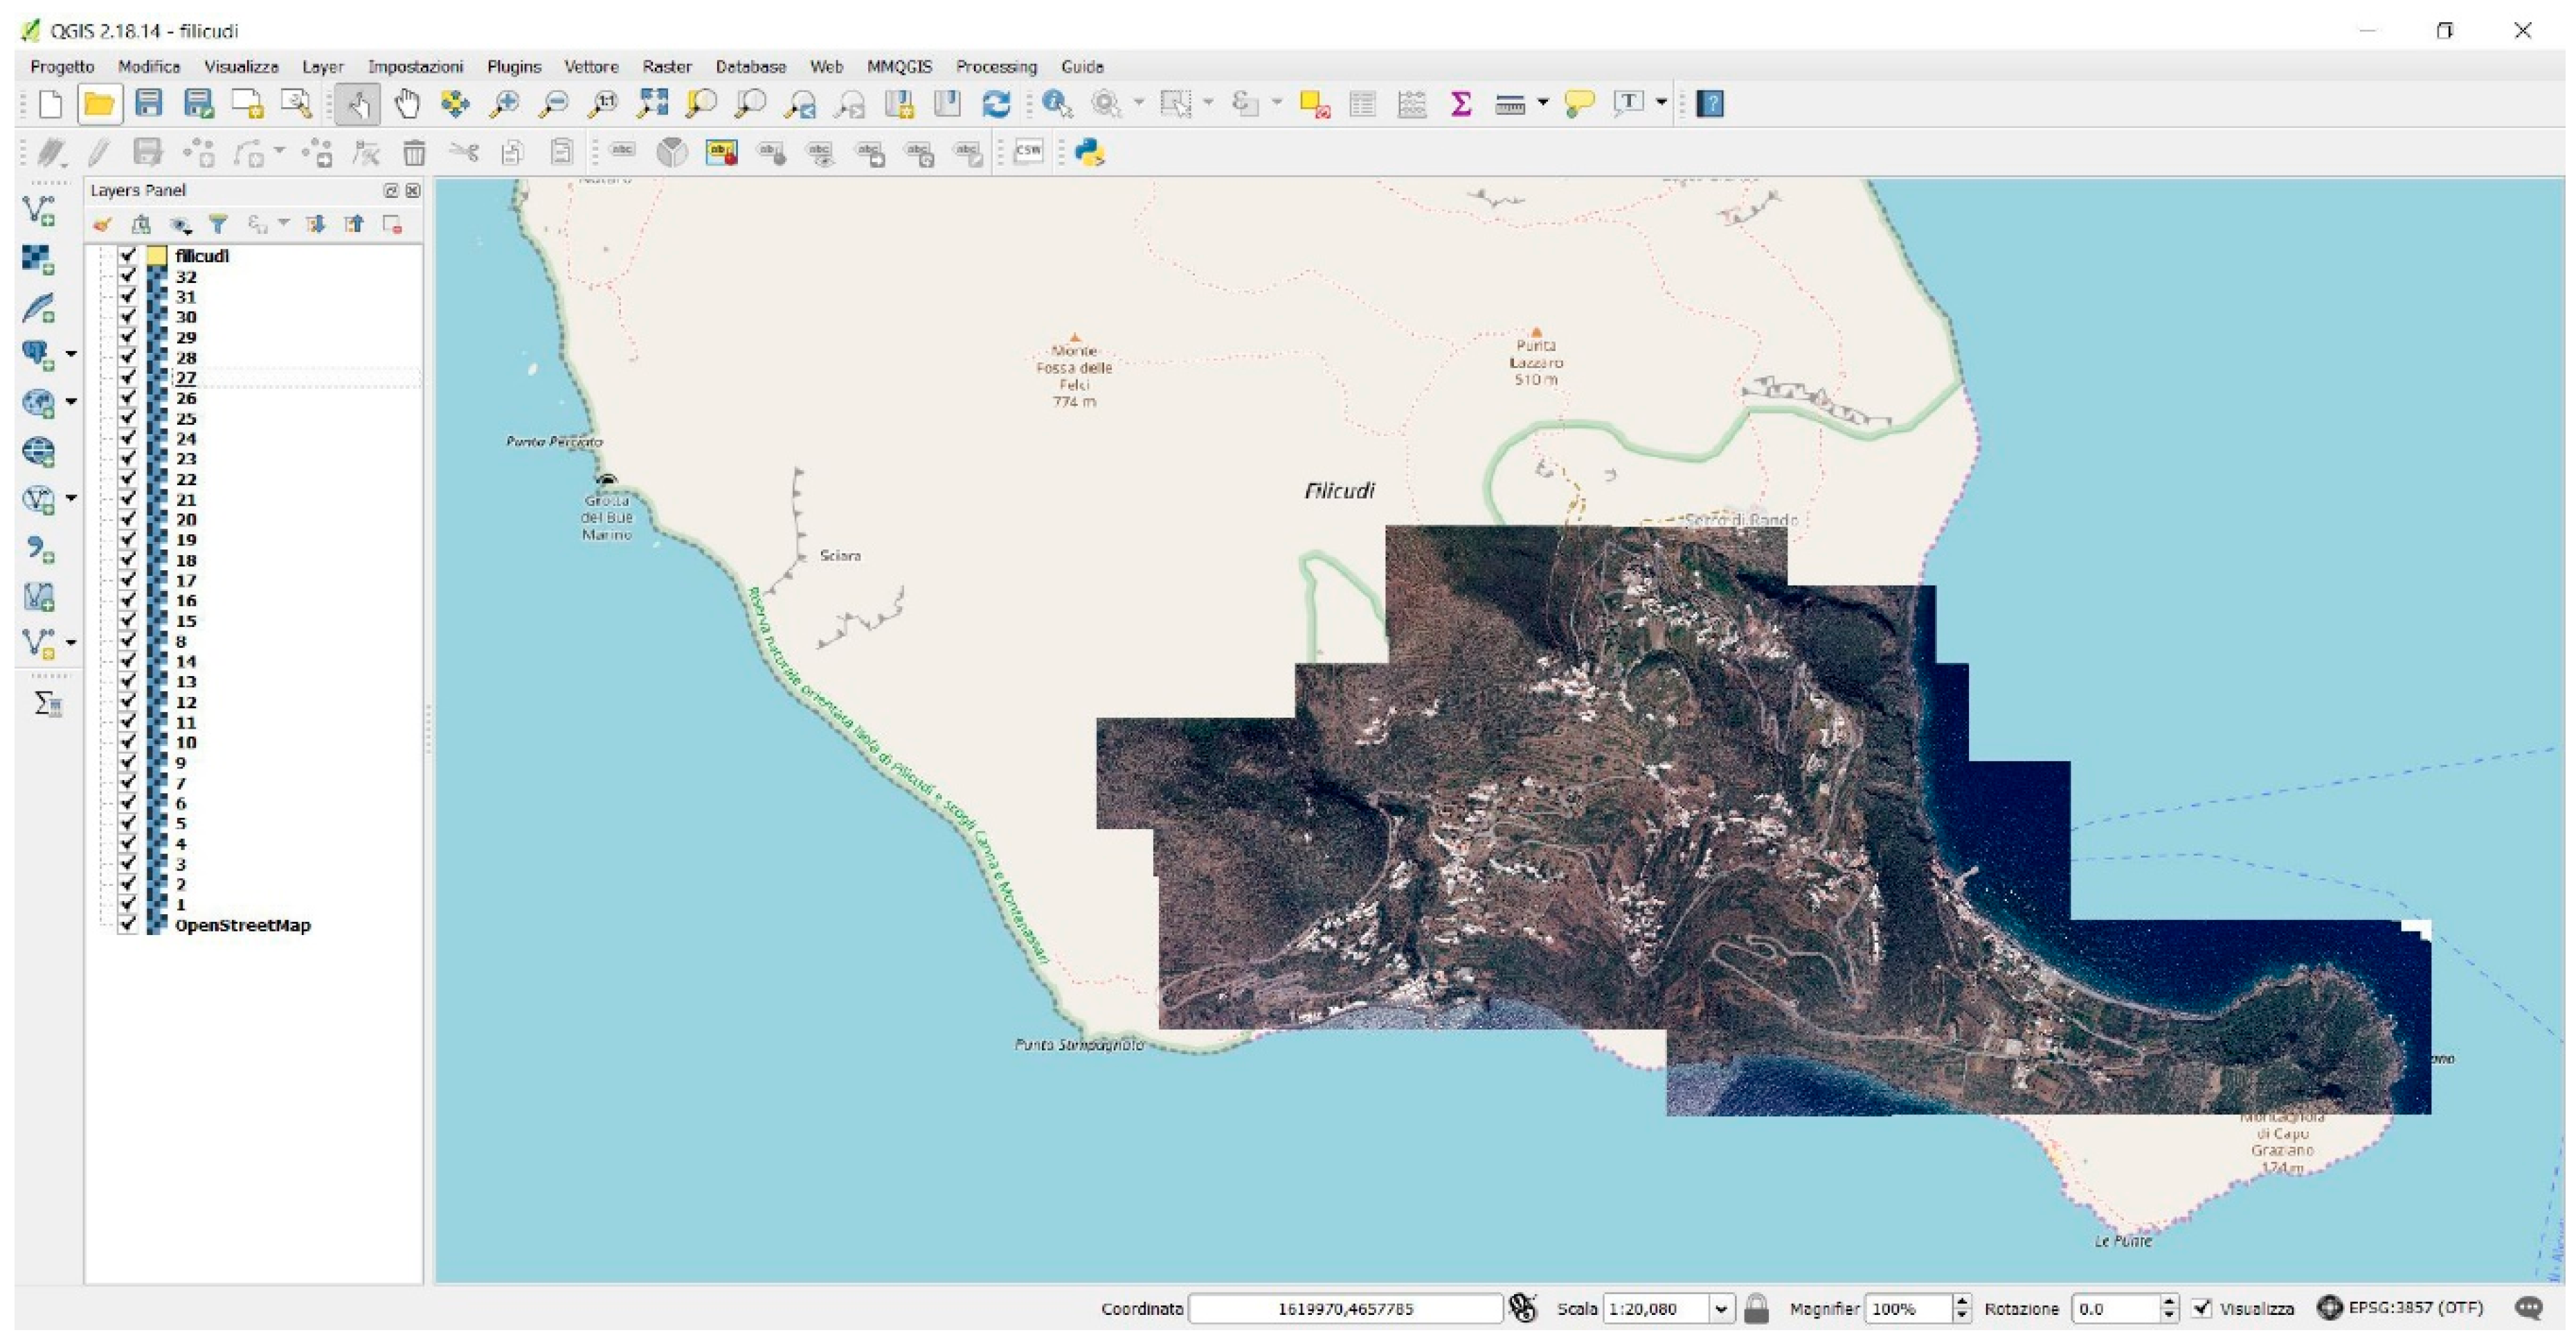
For the database on the island of Filicudi the reference system WGS 84/Pseudo Mercator [57] and ID of the authority EPSG: 3857 was chosen [58]. Subsequently, the orthophotos of the island were imported in georeferenced tiff format which constitutes the cartographic base to refer to.
Figure 8 depicts an orthophoto of an area of Filicudi introduced in the GIS platform.
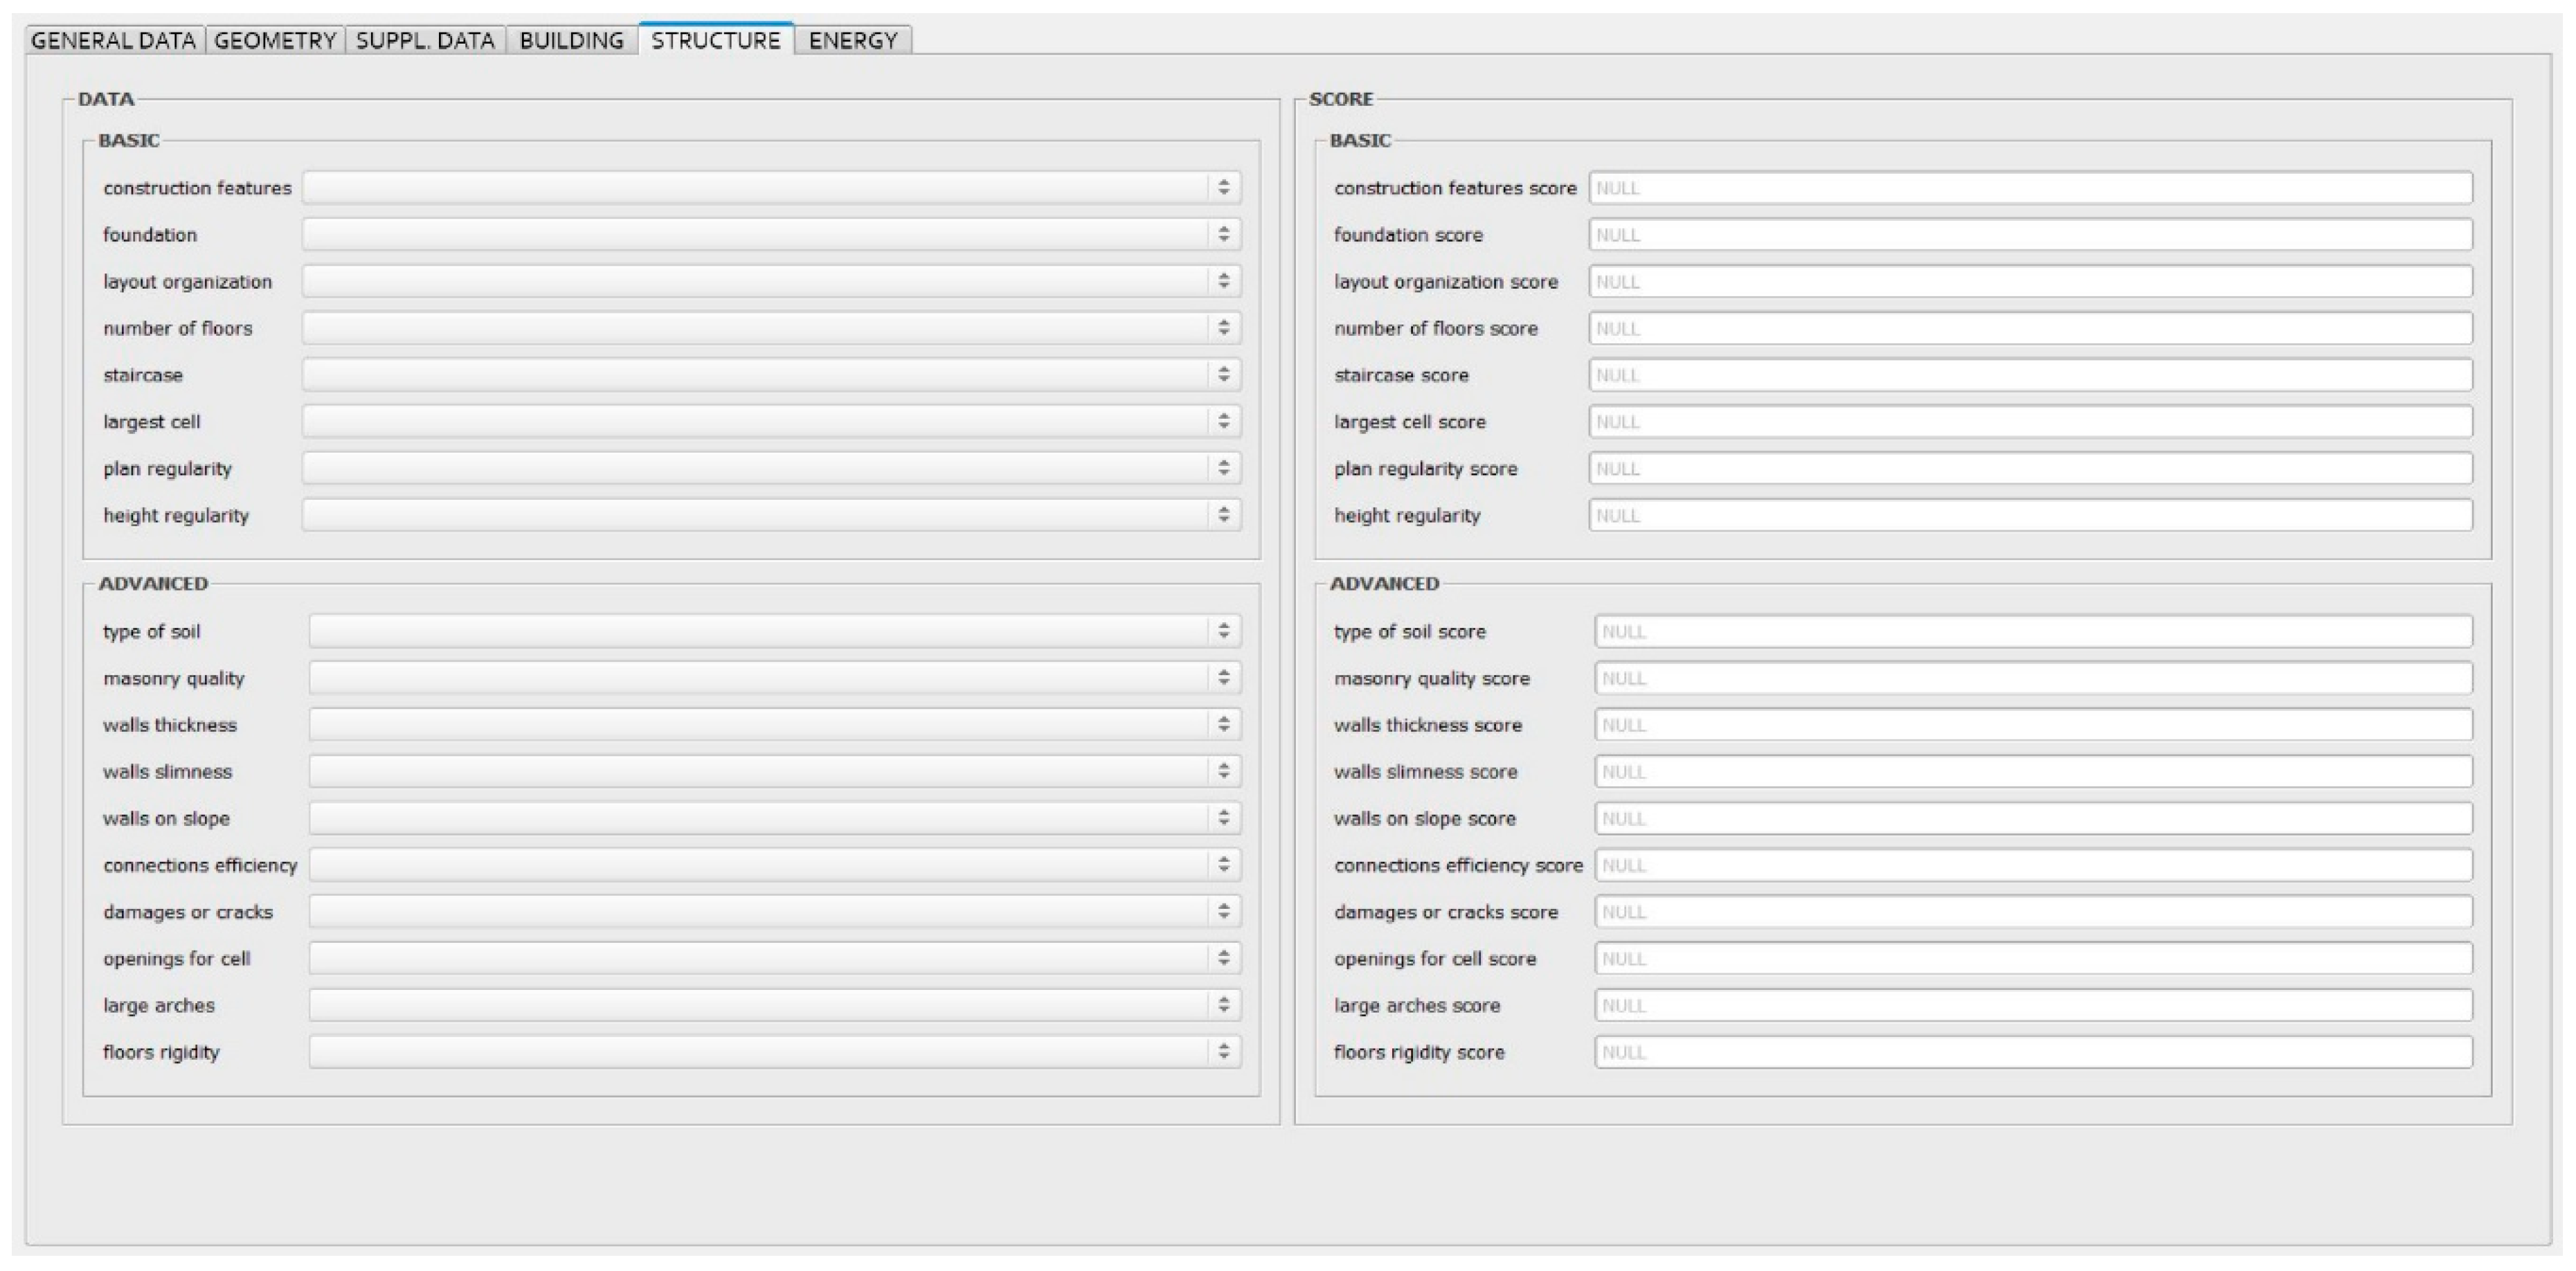
The structure of the database is inserted in GIS as a “shapefile.” The setting of the attributes table has been made more readable and divided into the same categories designed for the evaluation system: General Data, Geometry, Supplementary Data, Building, Structure and Energy. Once the six categories have been organized, the fields related to each of them have been created, defining an id, the name, the widget for editing, the alias, the type, the type name, the length, the precision, a comment and the Web Map Service (WMS) and Web Feature Service (WFS) boxes.
Only the parameters defined into the three macro-areas Building, Structure and Energy, will have attributed a score.
Figure 9 shows the evaluation sheet defined for the macro-area Structure.
The set of expressions defined in the virtual fields allows summing the values obtained for each macro-area. Finally, the Total Score field is the sum of the values obtained in the Building, Structure and Energy score fields.

4.5. Preliminary Survey

The implementation of the GIS database was carried out through the activities of an innovative didactic module that involved students and professors of Architecture and Engineering from different European countries [21,59].
The participants, divided into groups, carried out a preliminary level survey, through targeted surveys, using precompiled forms. In this way the work groups have acquired the information necessary to conduct the analysis on the Filicudi island’s construction. The collected data were then inserted into the GIS platform in order to visualize the first possible criticalities of the platform.

4.6. Tuning

After this phase, the system was fine-tuned thanks to the criticalities detected during the first survey. Since these are expeditious evaluation systems, one aspect that has had a significant impact on relevant work concerns the sensitivity of the person performing it [26], an aspect that risks compromising the objectivity and the rationality of the evaluation work. To overcome the problem, after this first data collection phase, it was necessary to clarify for each parameter the possible options to choose. It is important, in fact, that the definition and explanation of the categories of the evaluation system be treated in the same way as a manual to be taken along during the relevant phases.
As some parameters cannot be determined through expeditious evaluation (e.g., the attribution of the energy class of the building), it was necessary to integrate the survey analysis to carry out these supplementary data. In particular, the software DOCET was used for determining the building energy classification [60].

4.7. Detailed Survey

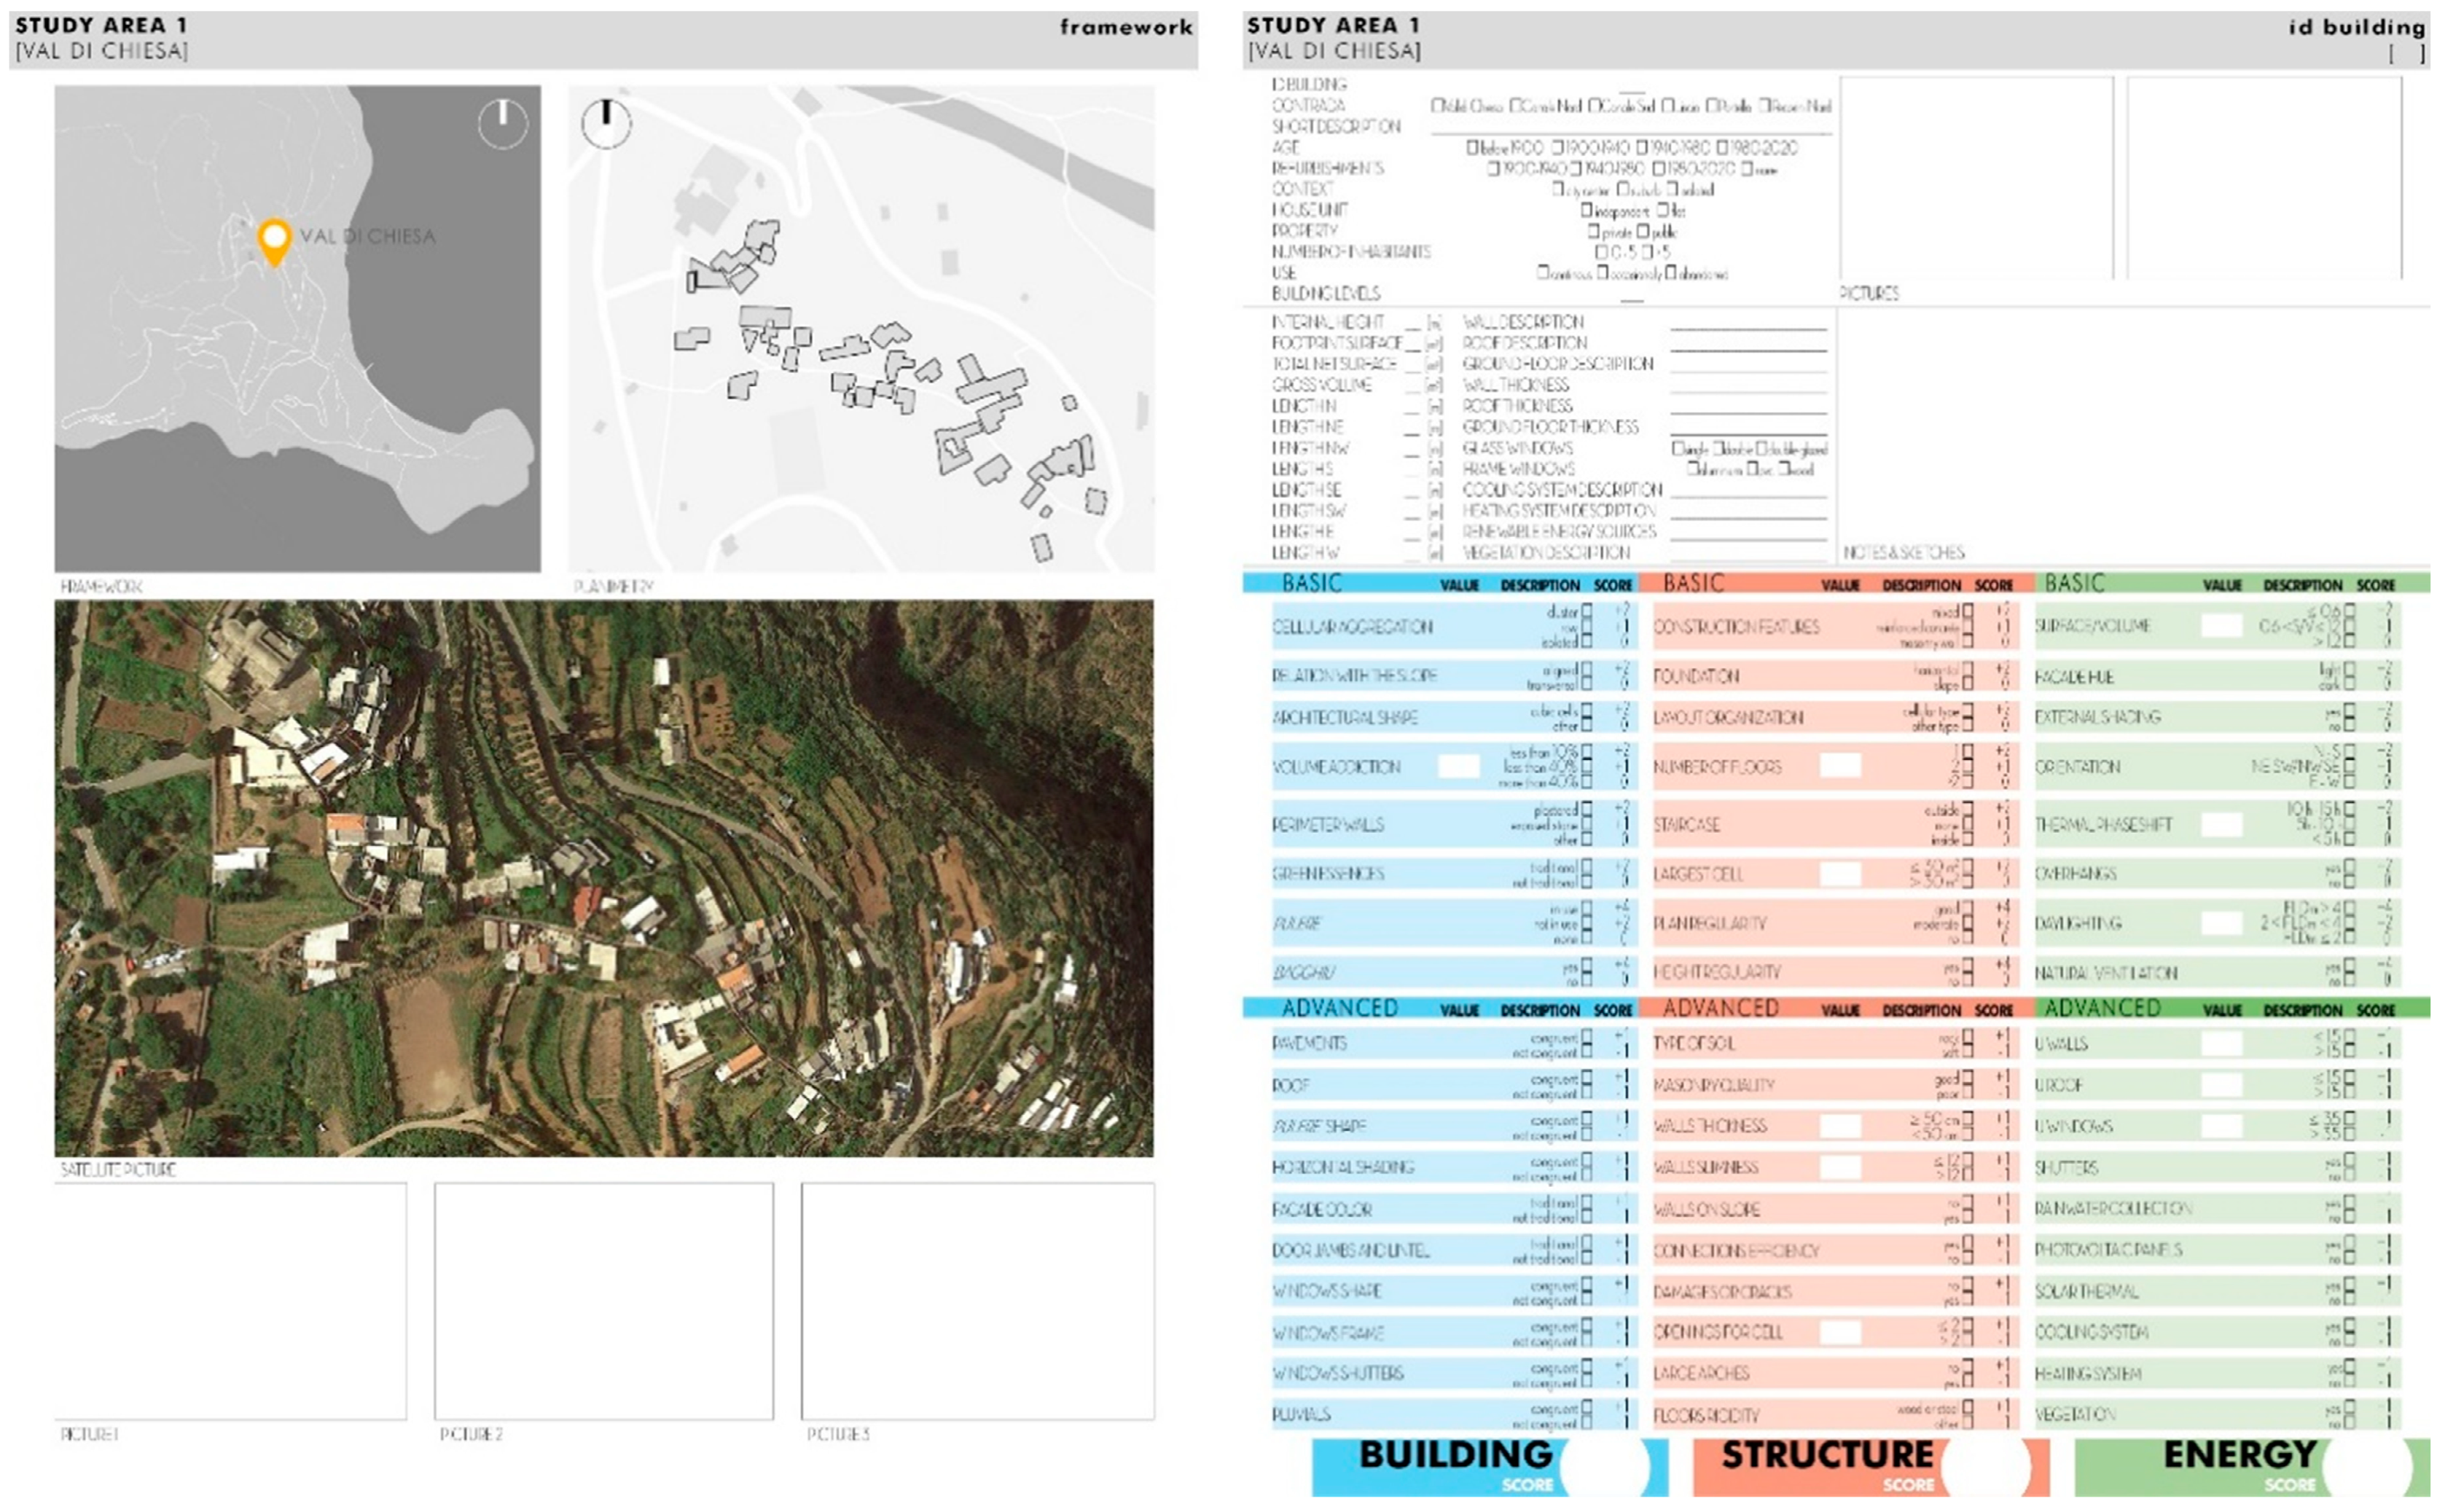
A second detailed level survey was conducted to validate and complete the data already collected. To facilitate the operations of surveying and cataloguing the data on site, a framework was drawn up for each Contrada, containing the location in the territory of the island of Filicudi useful for identifying building units on site. A box with the satellite image of the Contrada was considered indispensable for evaluating any discrepancies between the plan and the reality. Moreover, a panoramic photo that illustrates each Contrada is included.
After having organized all the useful informative material necessary for a correct collection of the building data, it was possible to proceed with the survey. In particular, for each building, the procedure followed foresees the acquisition of photographs and the compilation of the evaluation sheet, as well as the measurement of geometric data.
Figure 10 shows the informative material used as reference during the survey phase.
For each district an average working time of 5 h was estimated, thus, 30 h of individual work in total, for the evaluation of approximately 180 buildings.

4.8. Discussion Case Selection

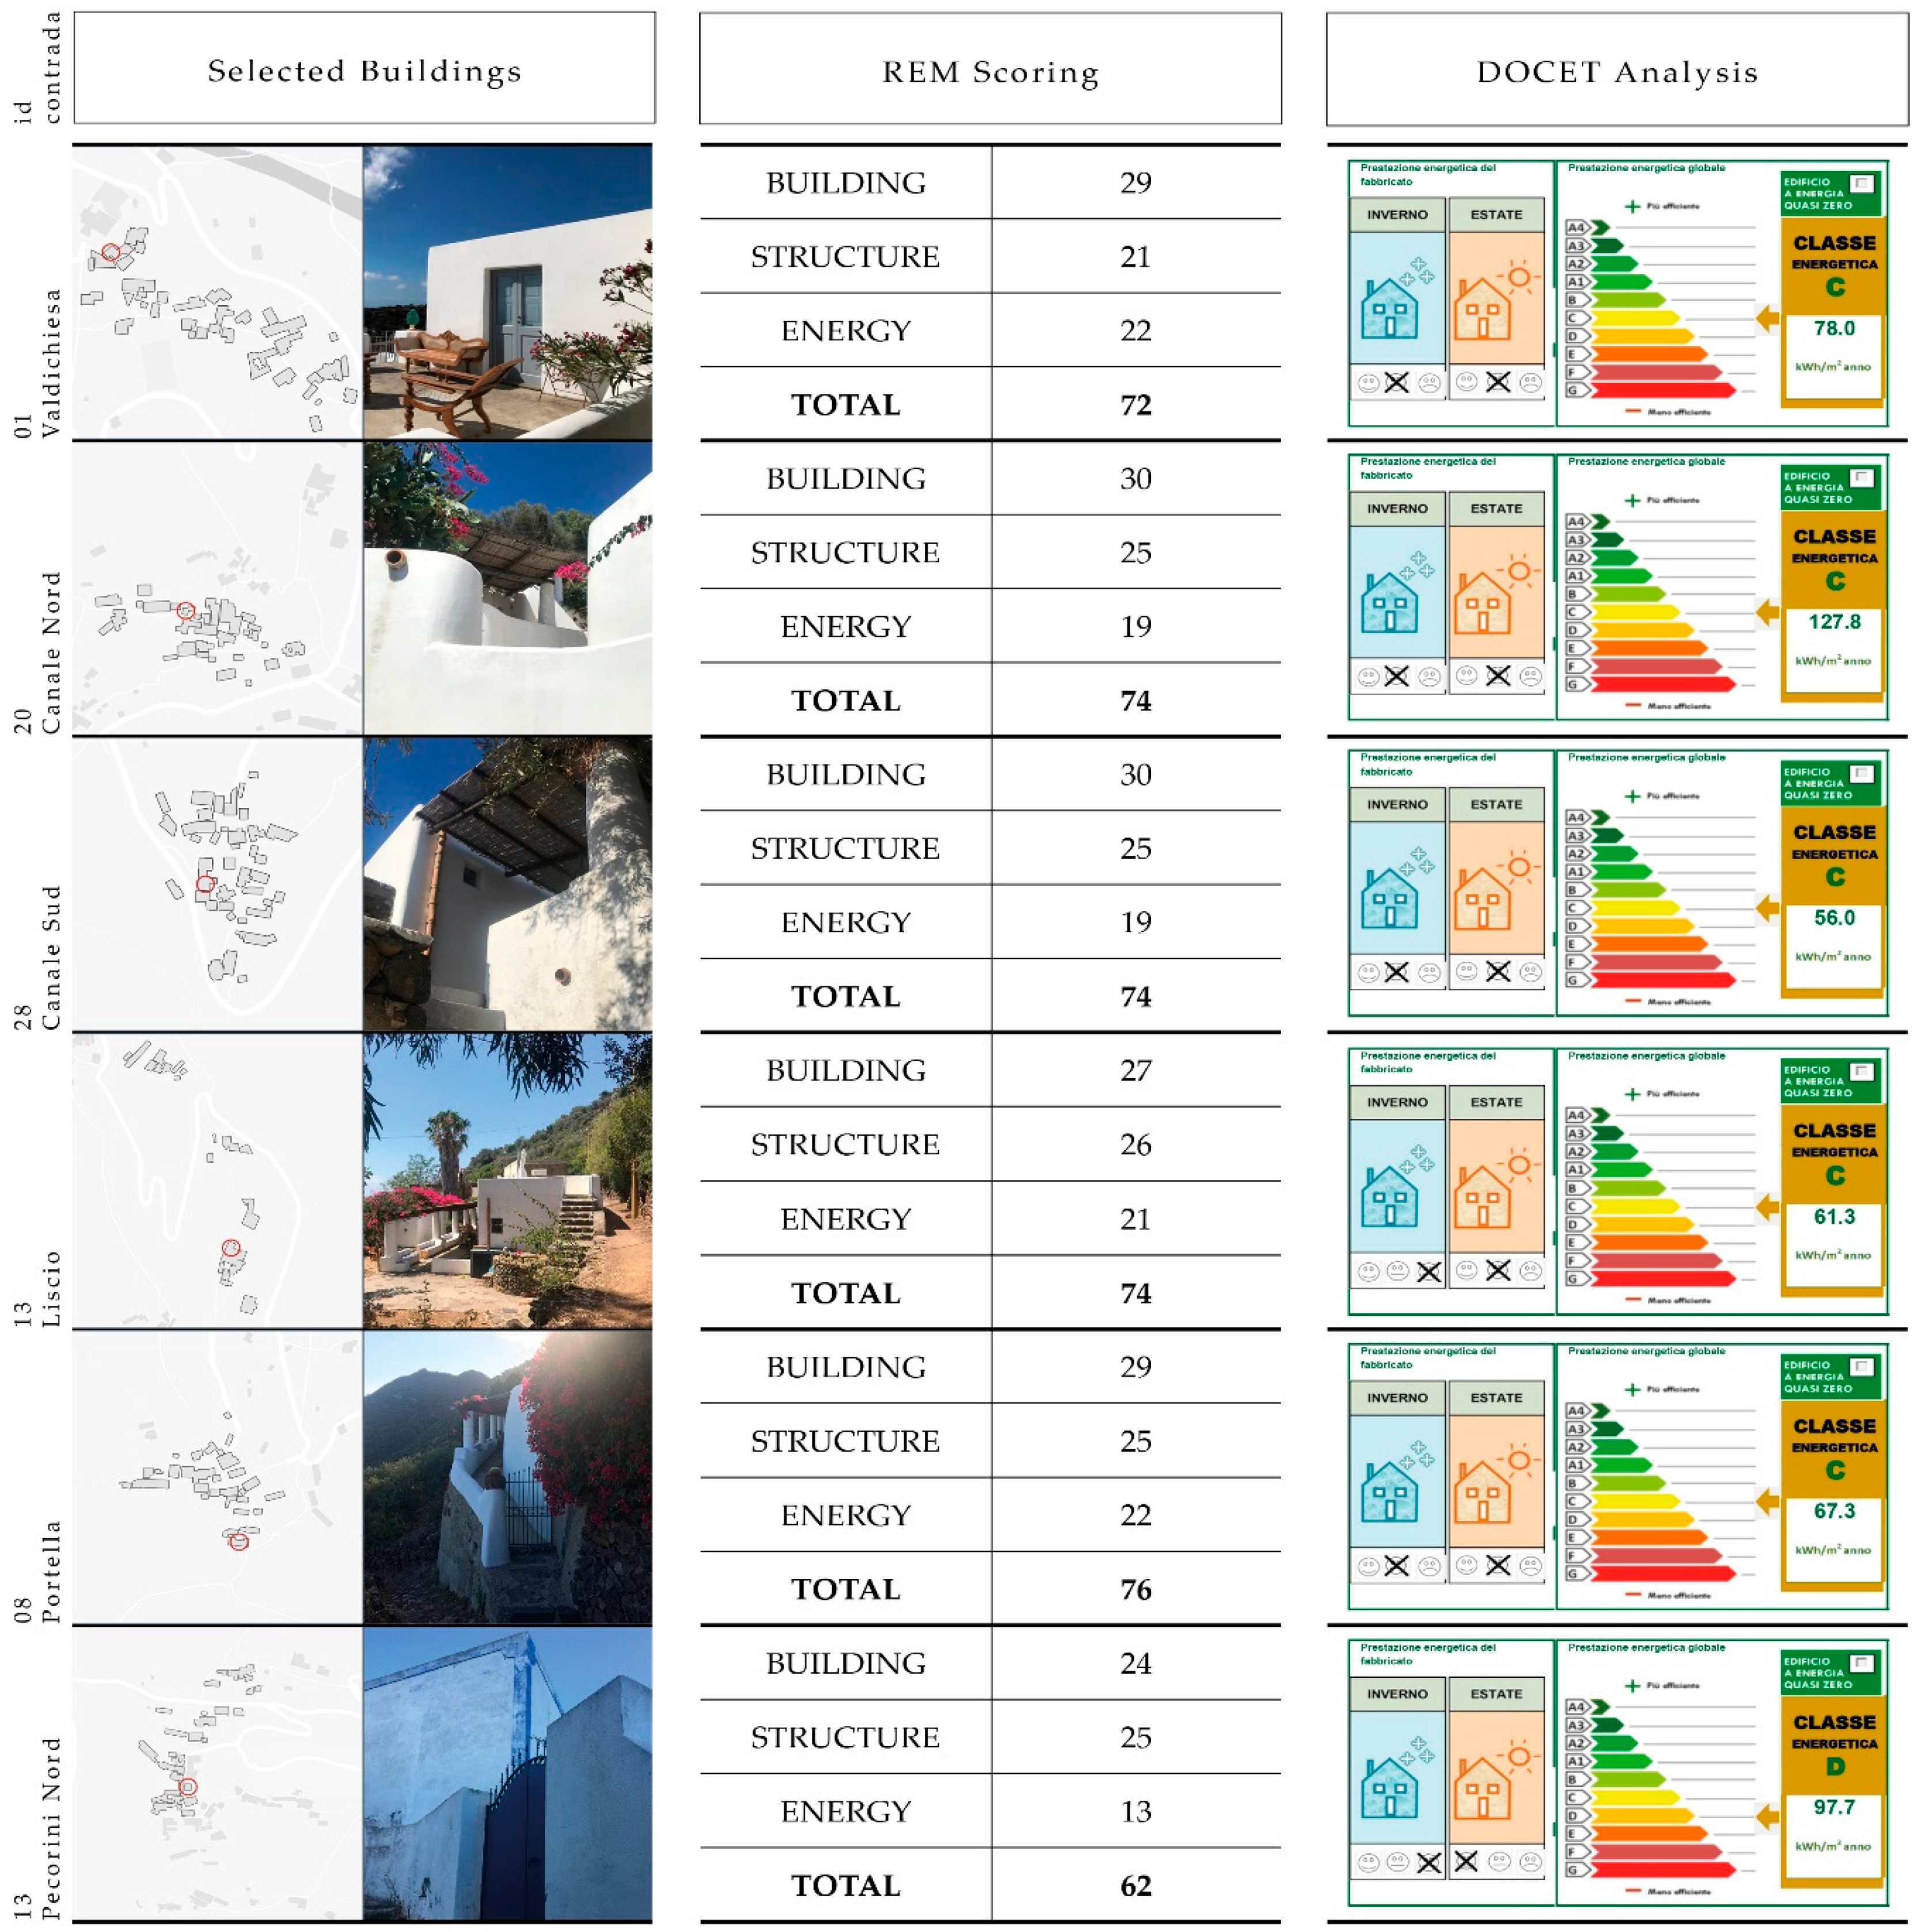
Downstream of the acquisition, some exemplary cases were chosen, on which to carry out a further study. These are the buildings that have achieved the best and worst score in each district. The evaluation sheet compiled with the data relating to the buildings allow to visualize how the score is reached, which are the fields that allow the buildings to reach a level of quality higher than the average and which are the most penalizing.
The Building macro-area is the one that usually guarantees the highest scores, while in Structure and Energy, lower scores are usually reached, but in any case, higher than 20 per category. The worst cases are particularly disrespectful of the characteristics of traditional architecture, while the scores in Structure and Energy are not very unfavorable. In fact, in the Structure category such buildings reach values greater than 10.
The largest differences between the best and worst cases occurs in the Building macro-area, while it is much more contained in Structure and Energetic macro-area. The buildings with the highest score, already characterized by excellent performances, could be improved with few interventions related to the energy aspects, while the worst ones would have greater need to dialogue with the characters of the traditional Aeolian architecture.
Finally, for the buildings that achieve the highest score in each Contrada were determined the specific primary energy consumption as well as the energy class using the DOCET software. Such extra information could be useful for describing which is the rate of energy necessary for guarantying the heating and cooling of the most performing buildings in Filicudi.
Figure 11 shows the output come out through the DOCET analysis.

5. Discussion

5.1. Findings

Traditional buildings are bearers of the values already mentioned in the Introduction, thus, the need to refurbish them cannot be separated from an approach that increases the level of their sustainability. However, this term must be considered in the broadest sense and cannot be associated only with energy saving, as often happens. Therefore, in this research the most peculiar features of the traditional buildings (relationship with the landscape, indoor comfort, structural behavior, etc.) were chosen as the focus of the analysis.
Through the application of the methodology on the Filicudi it was possible to identify the overall quality of the island’s construction. The survey tool developed allowed easy analysis of the results obtained in each category.
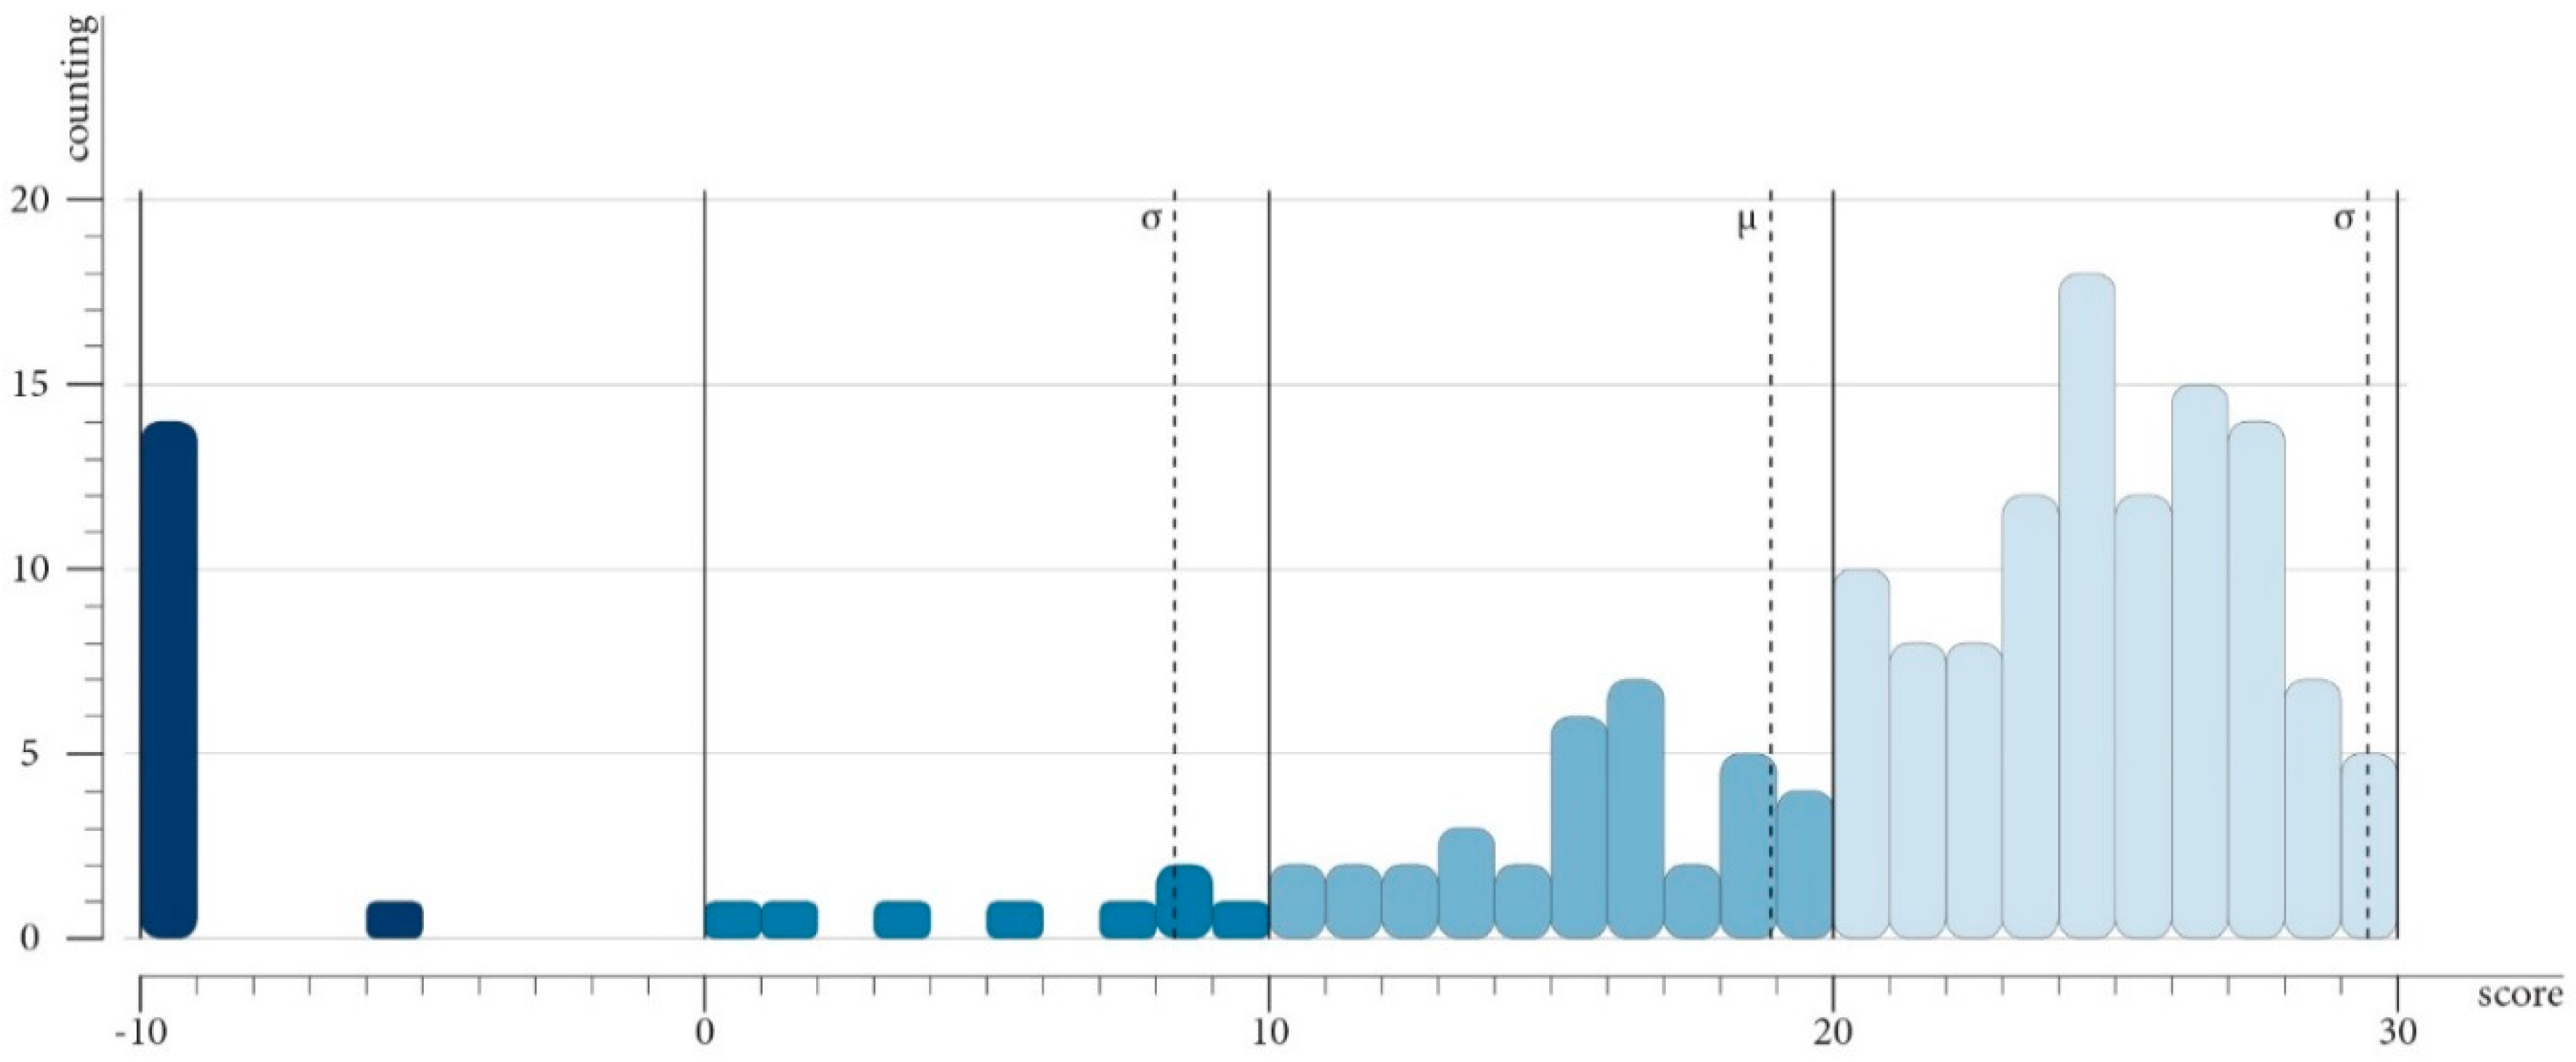
For the macro-area Building (Figure 12), the score totalized by each residential unit is satisfactory. The average value μ is equal to just under 19 out of 20, and therefore, well above the median value. In addition to the data that can be displayed on the diagrams and on the table, it is interesting to note how the scores are distributed in each district. In particular, the Contrada of Valdichiesa, Liscio, Canale Nord and Canale Sud shows a greater number of buildings with values between 20 and 30. While lower scores between 10 and 20 are present on the Contrada of Portella and Northern Pecorini. Lower scores from −10 to 10, are uniformly distributed on all the Contrada with a total of 23 buildings out of the 173 surveyed. In particular, 15 buildings have a score lower than 0; since 14 of these are in a state of ruin, which has been assigned a value of −30 by default, the building with a negative score is actually only one.
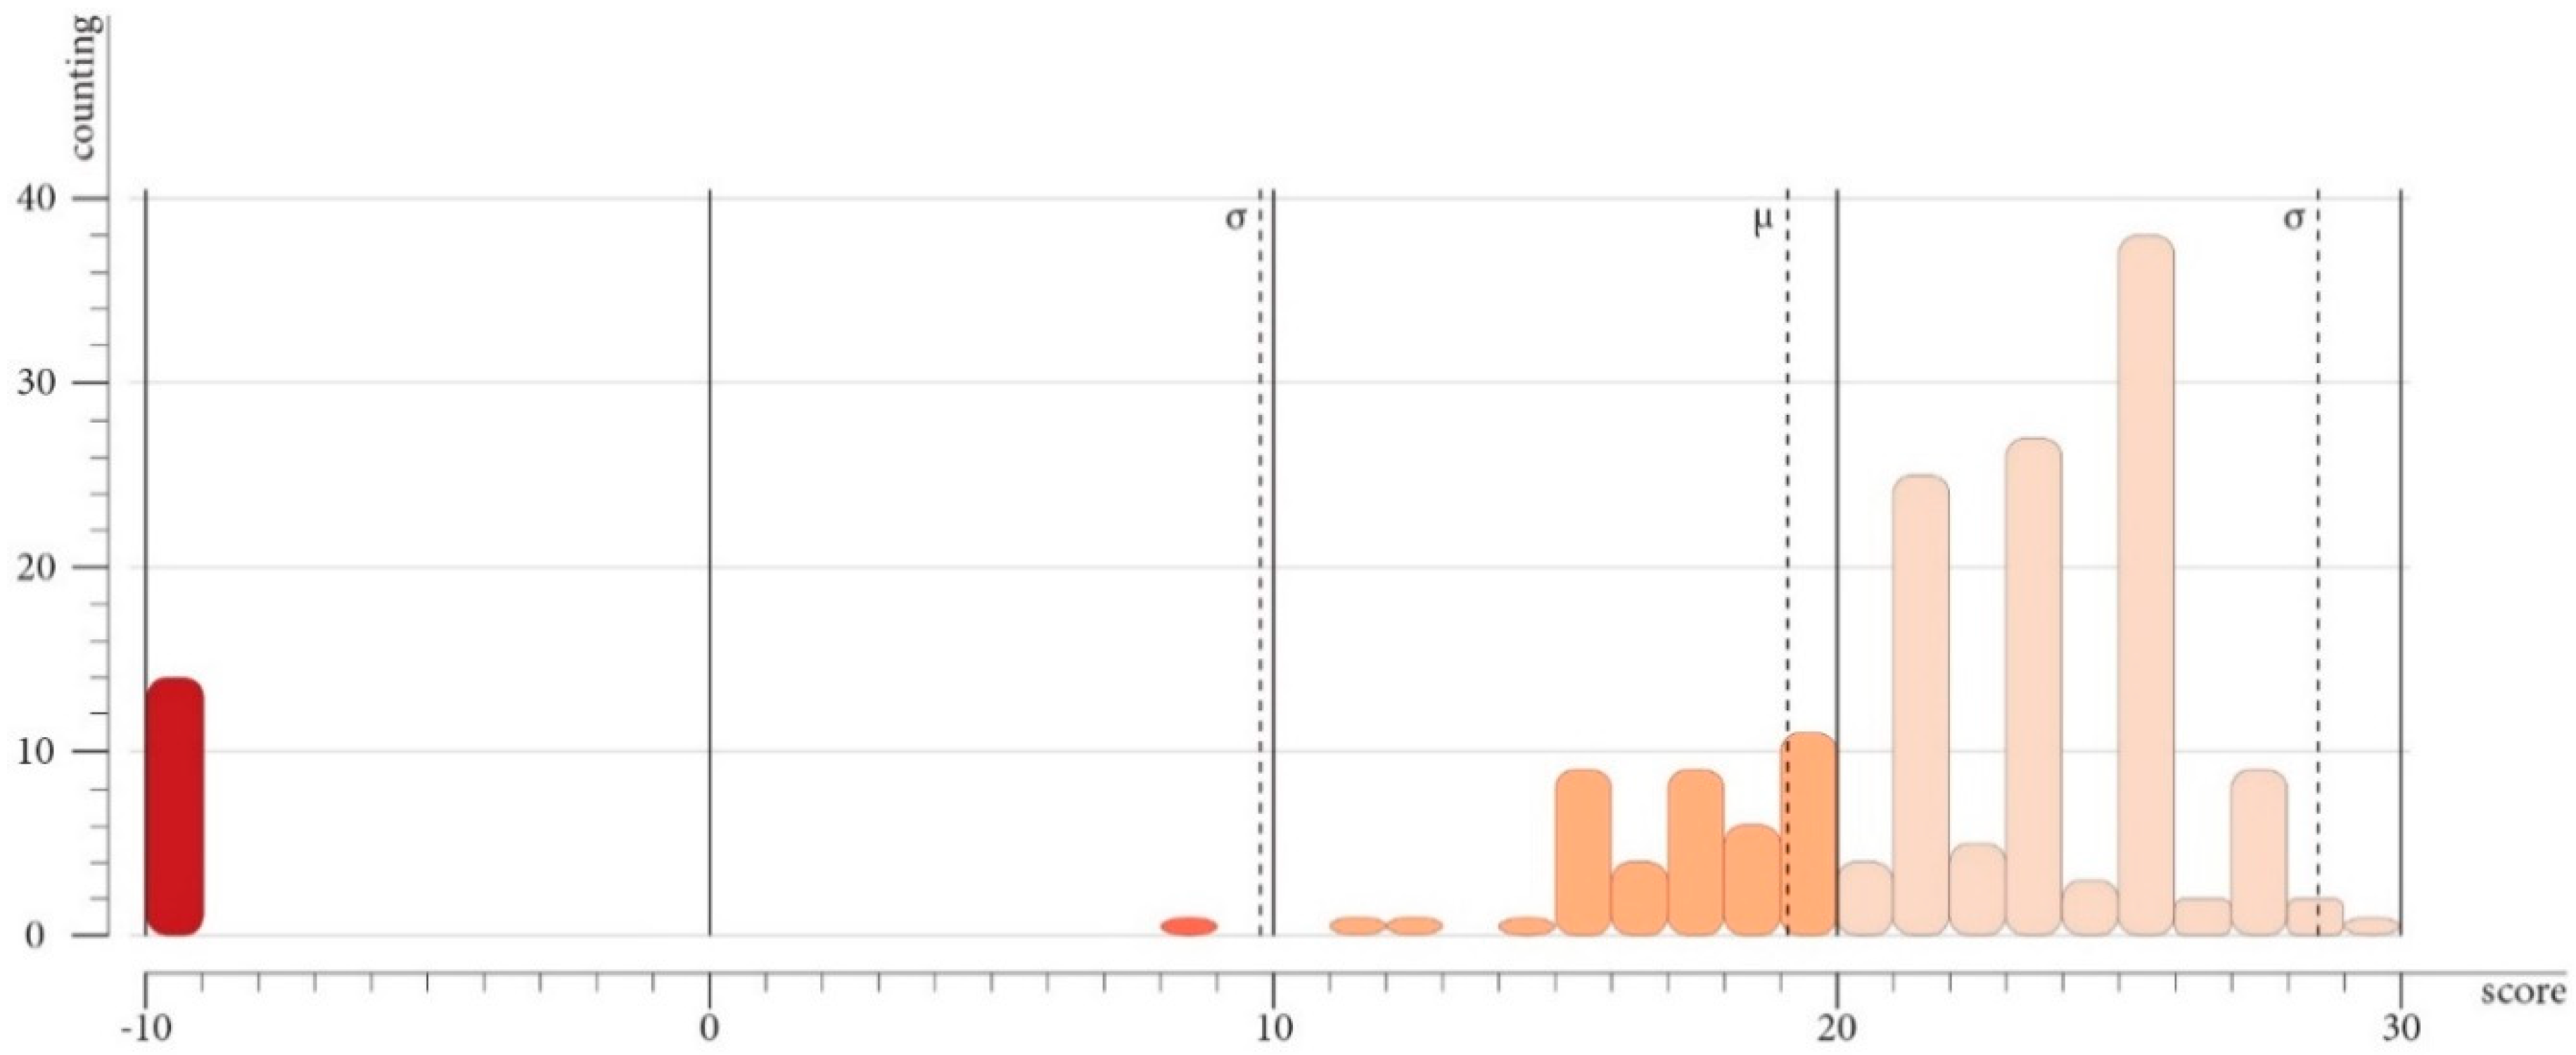
In the macro-area Structure (Figure 13), the results show an average value slightly higher than 19. However, observing the distribution within the Contrada, it is noted that mostly of the buildings of Pecorini North and Canale Sud present values between 20 and 30. This result reflects the fact that Pecorini Nord is a Contrada with a high number of residents, thus, it has undergone substantial renovation of the buildings, including on structural aspects, preserving the characteristics of traditional architecture. On the other hand, in Valdichiesa and Portella the buildings gather on the side of a slope; thus, they add up to lower values. Finally, more than 50% of the buildings in Liscio have a value greater than 20.
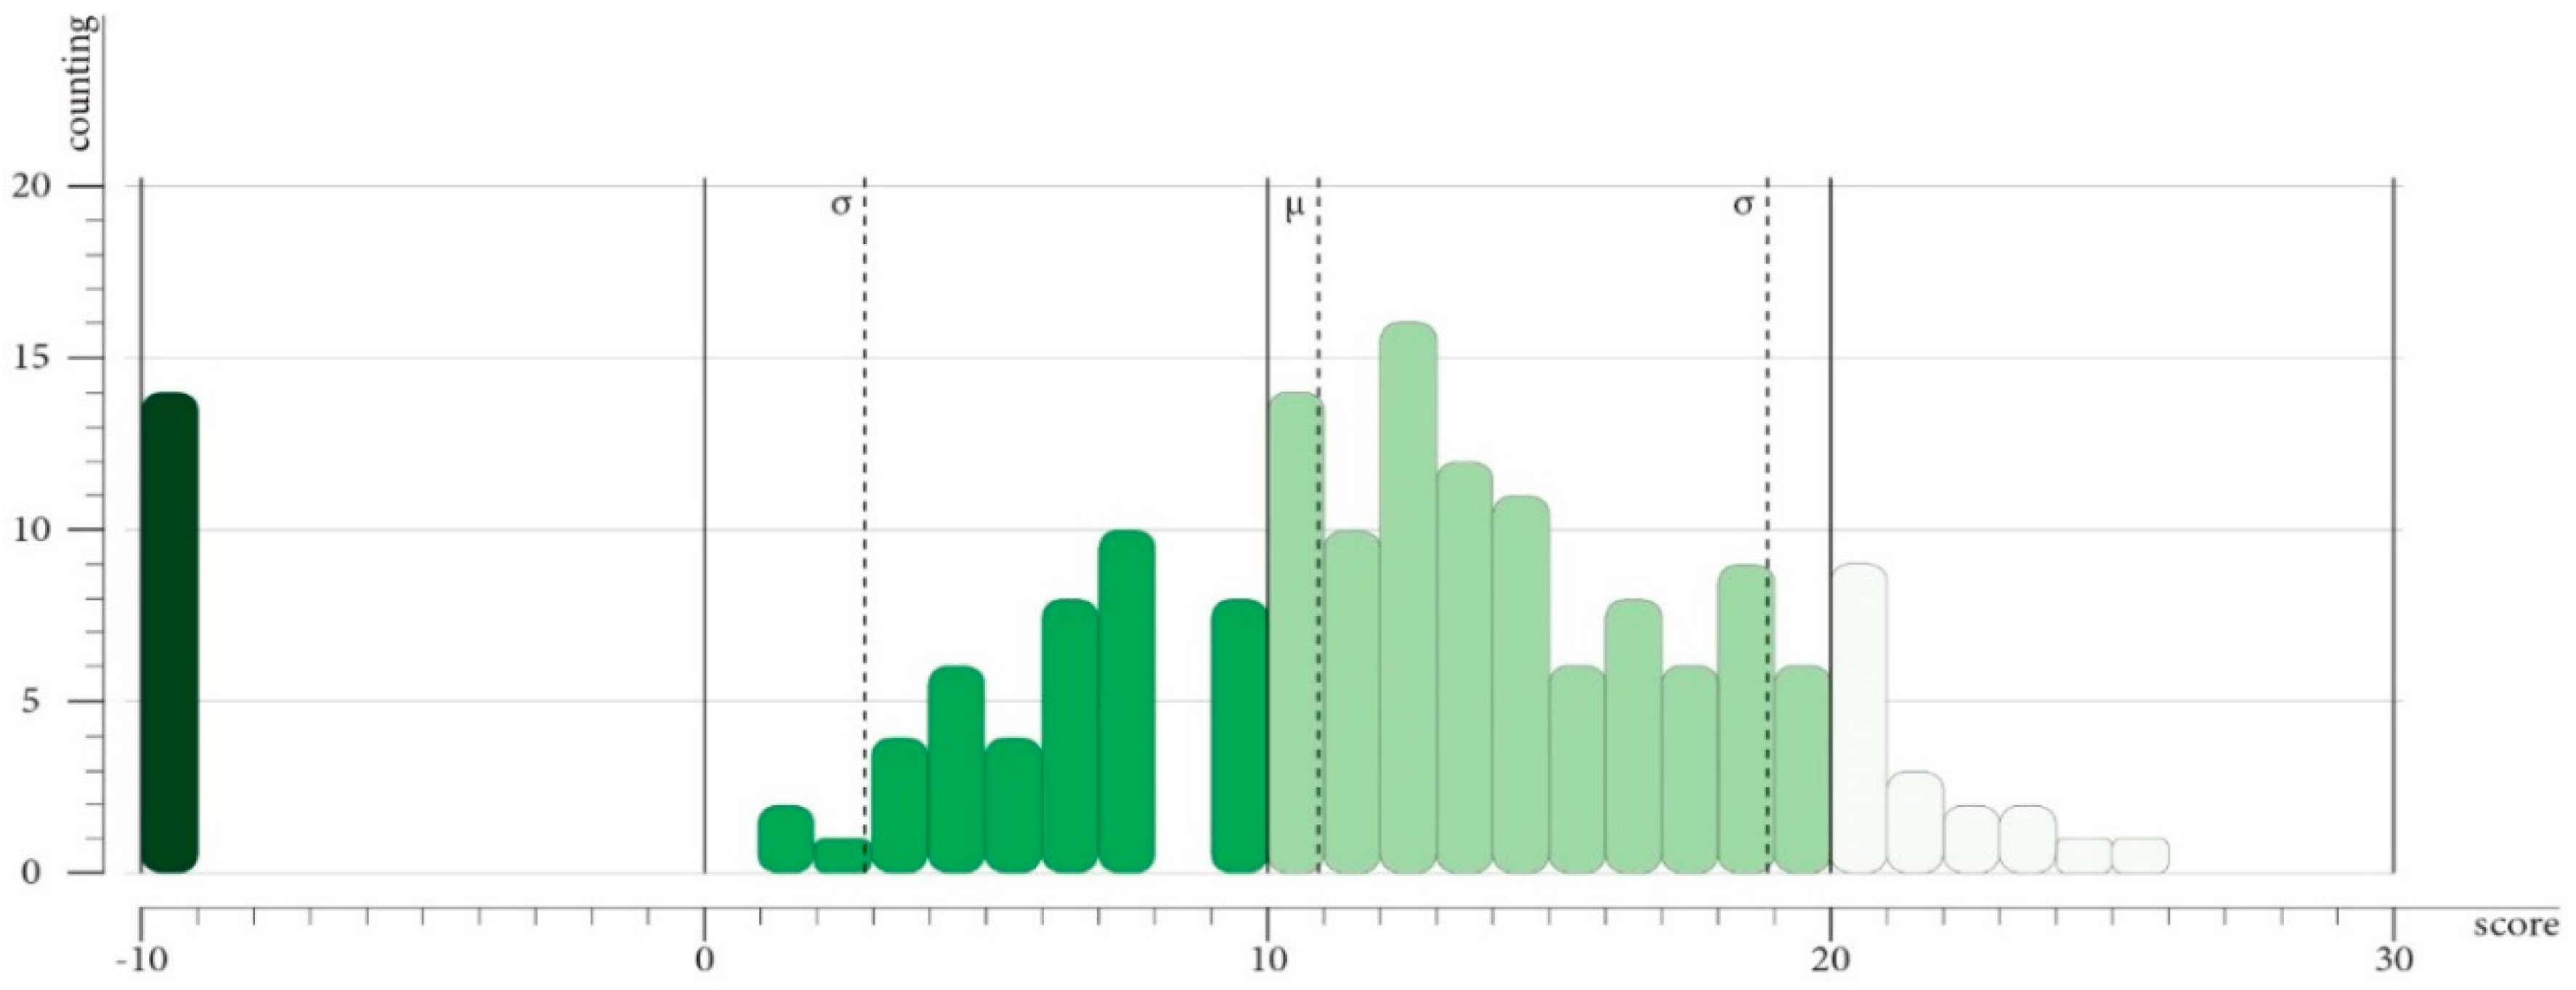
The macro-area Energy has lower values than the other two (Figure 14). No building can reach the maximum score of 30 and the best of cases reaches a value of 26. The average value is slightly lower than 11 and most of the buildings are in values between 10 and 20.
In this macro-area, the various Contrada have rather uniform scores; only Liscio one has a higher quality linked to restructuring interventions involving renewable energies.
The lower scores obtained in this category, compared to the others, depend substantially on two factors: the seasonal use of most of the houses and the sporadic appeal of RES (Renewable Energy Sources).
As regards the first aspect, it must be considered that Filicudi between summer and winter increases the number of inhabitants by about 10 times due to the arrival of tourists and the return of emigrants. Thus, the energy consumption of most buildings is in itself reduced, given the lack of use during the winter months. For this reason, the payback time on energy improvement measures would be fairly long. This makes this kind of refurbishment unattractive to the individual user.
For the second question, the use of RES is almost completely absent despite it playing a very important role in achieving a good score in the Energy category. The sporadic use of photovoltaic systems, solar thermal systems and the complete absence of micro-wind power is linked to the high cost of installation and maintenance, due to the difficulty of accessibility of the isle. This happens despite Filicudi having high annual global solar radiation values of 1622 kWh/m2 [61] and average annual wind speed of 11 km/h [62].
Nevertheless, with a standard deviation less than 8, the score remains above 0.
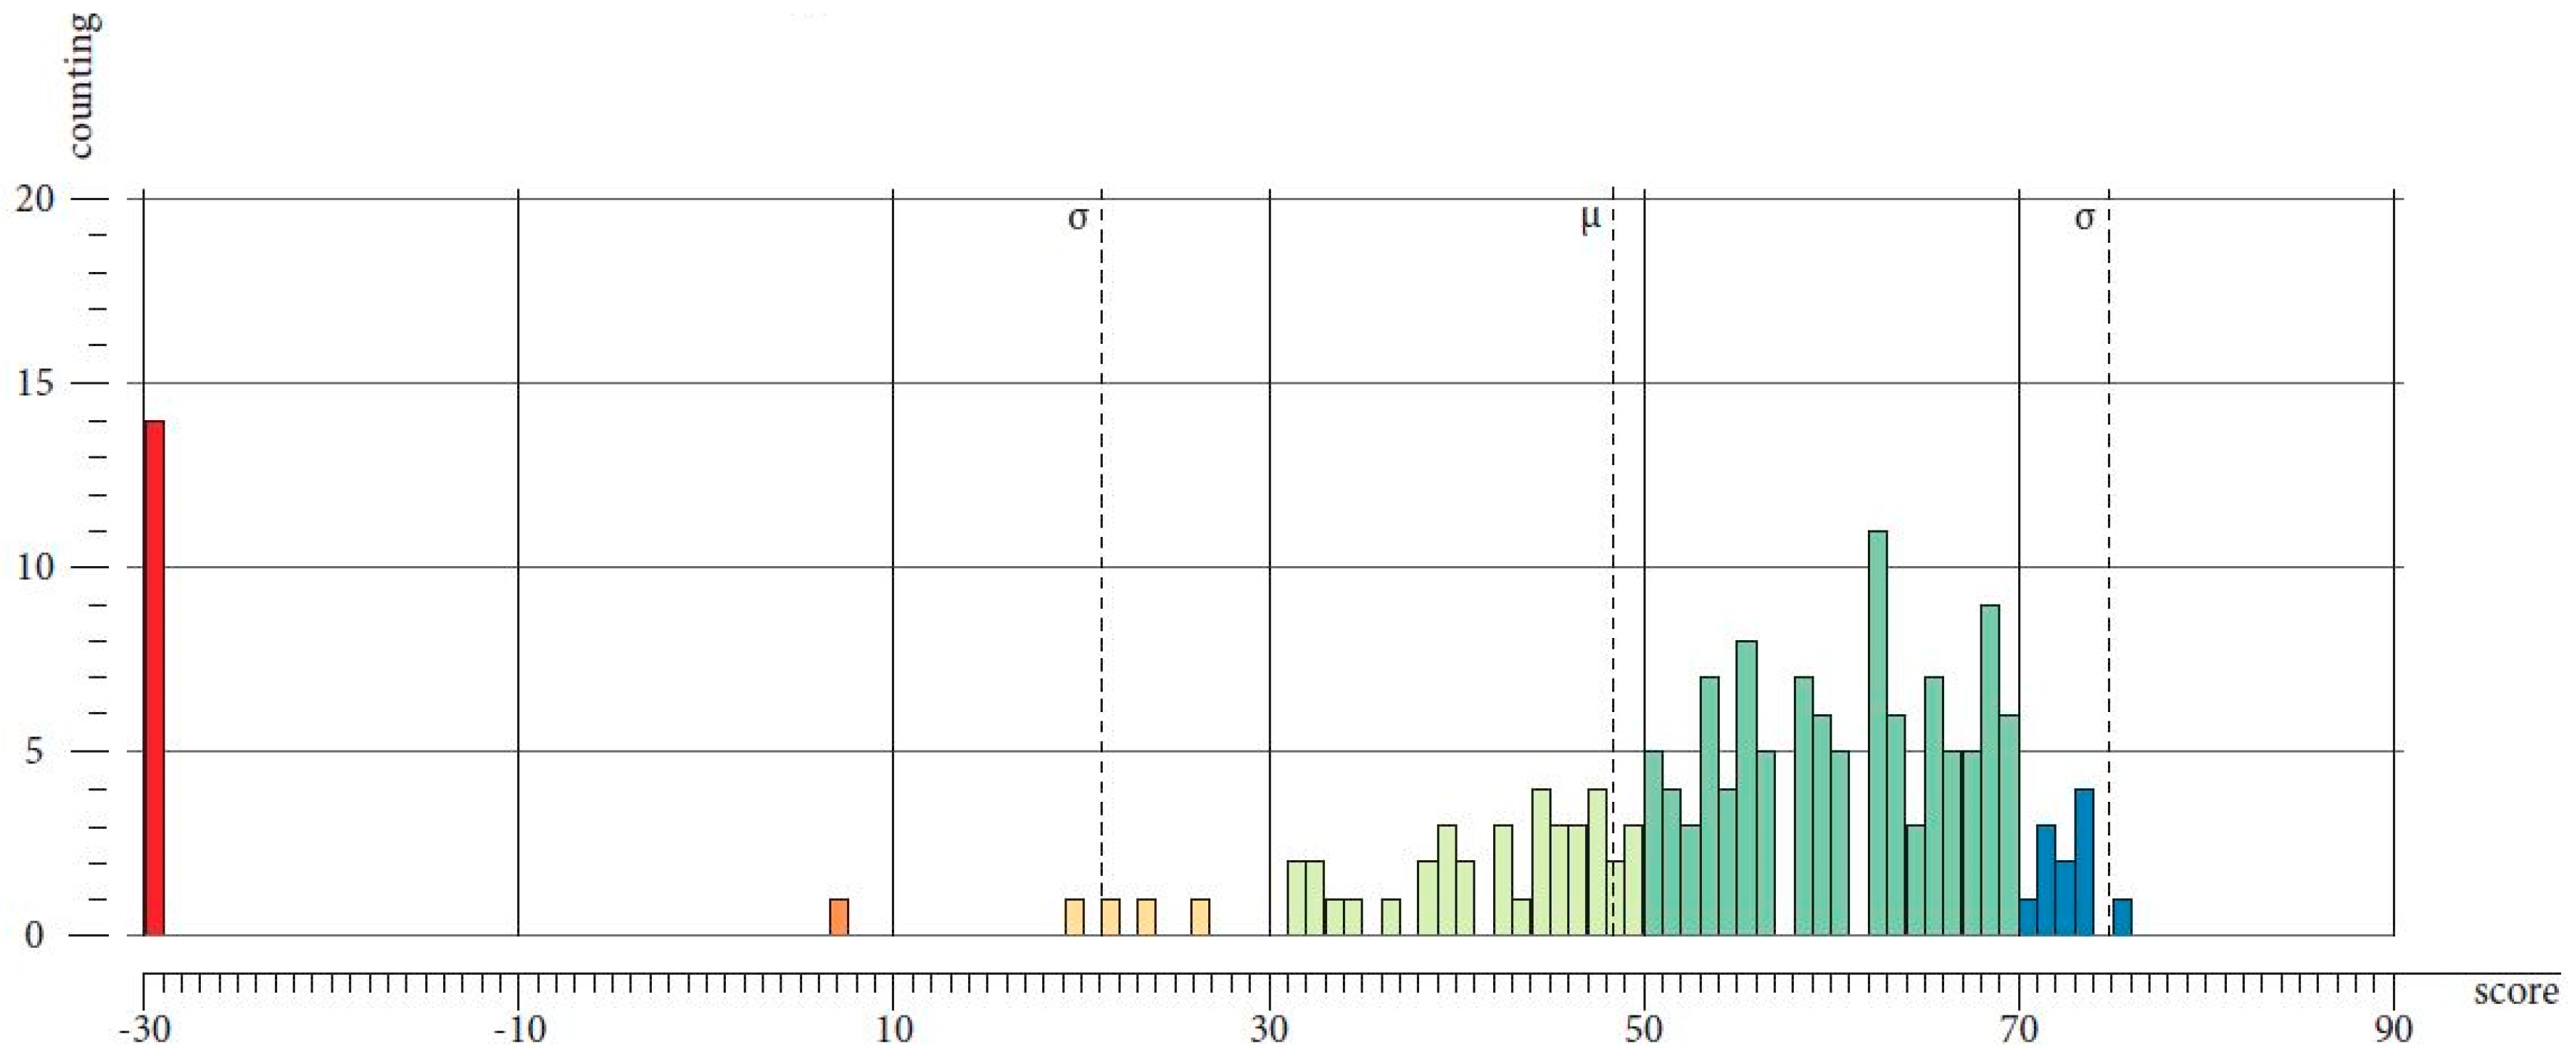
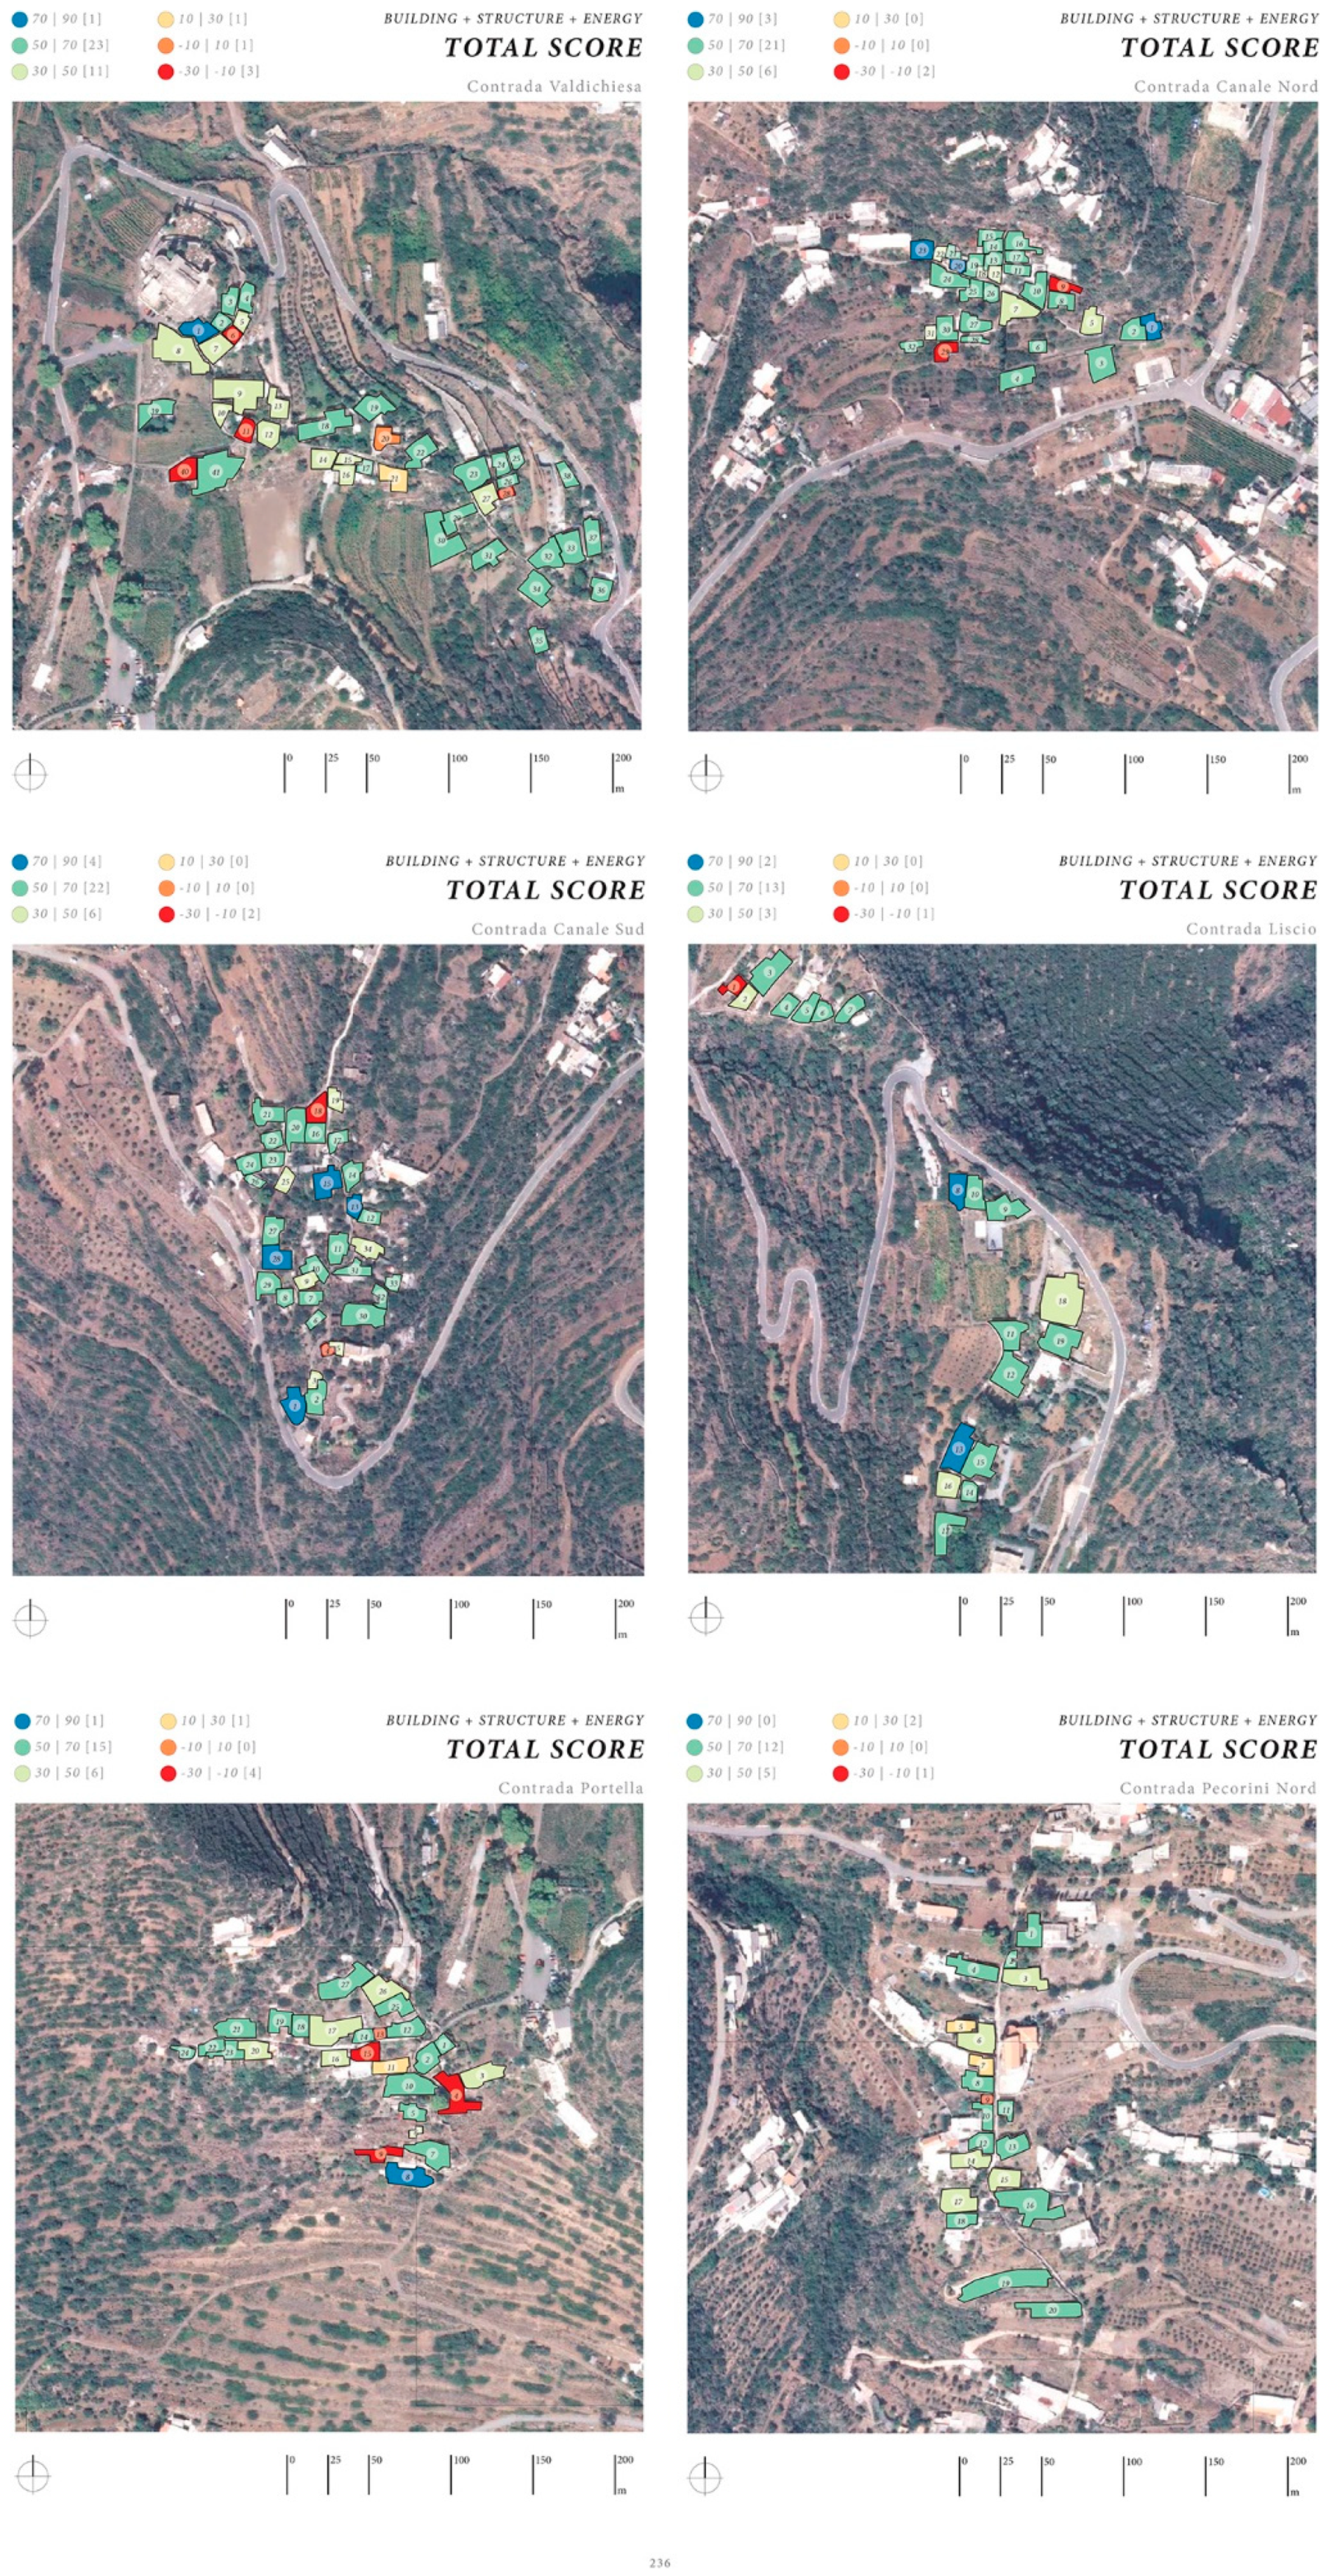
In addition to the analysis for each of the individual categories, the tool allows for a complete analysis of the global data (Figure 15 and Figure 16), and therefore of the overall quality of the building. The thematic on the global datum (total score) makes it possible to identify immediately the buildings that are in a critical situation (set for the two score ranges between −30 and 10) and buildings that have a high quality (established for score the two ranges between 50 and 90). Analyzing the data, it can be seen that more than half of the buildings surveyed reach scores above 50, with a maximum value of 76, not very far from the maximum score achievable by the evaluation system equal to 90. The district with better quality of buildings it is Canale Sud, consisting of buildings mainly owned by non-native people, today, however, residents on the island, and restructured in an exemplary way. On the other hand, the districts inhabited by the indigenous population of the island, such as Pecorini Nord, have a much lower level of general quality. This paradoxically shows a lower sensitivity of residents towards traditional architecture, often combined with a lower economic availability for recovery interventions.
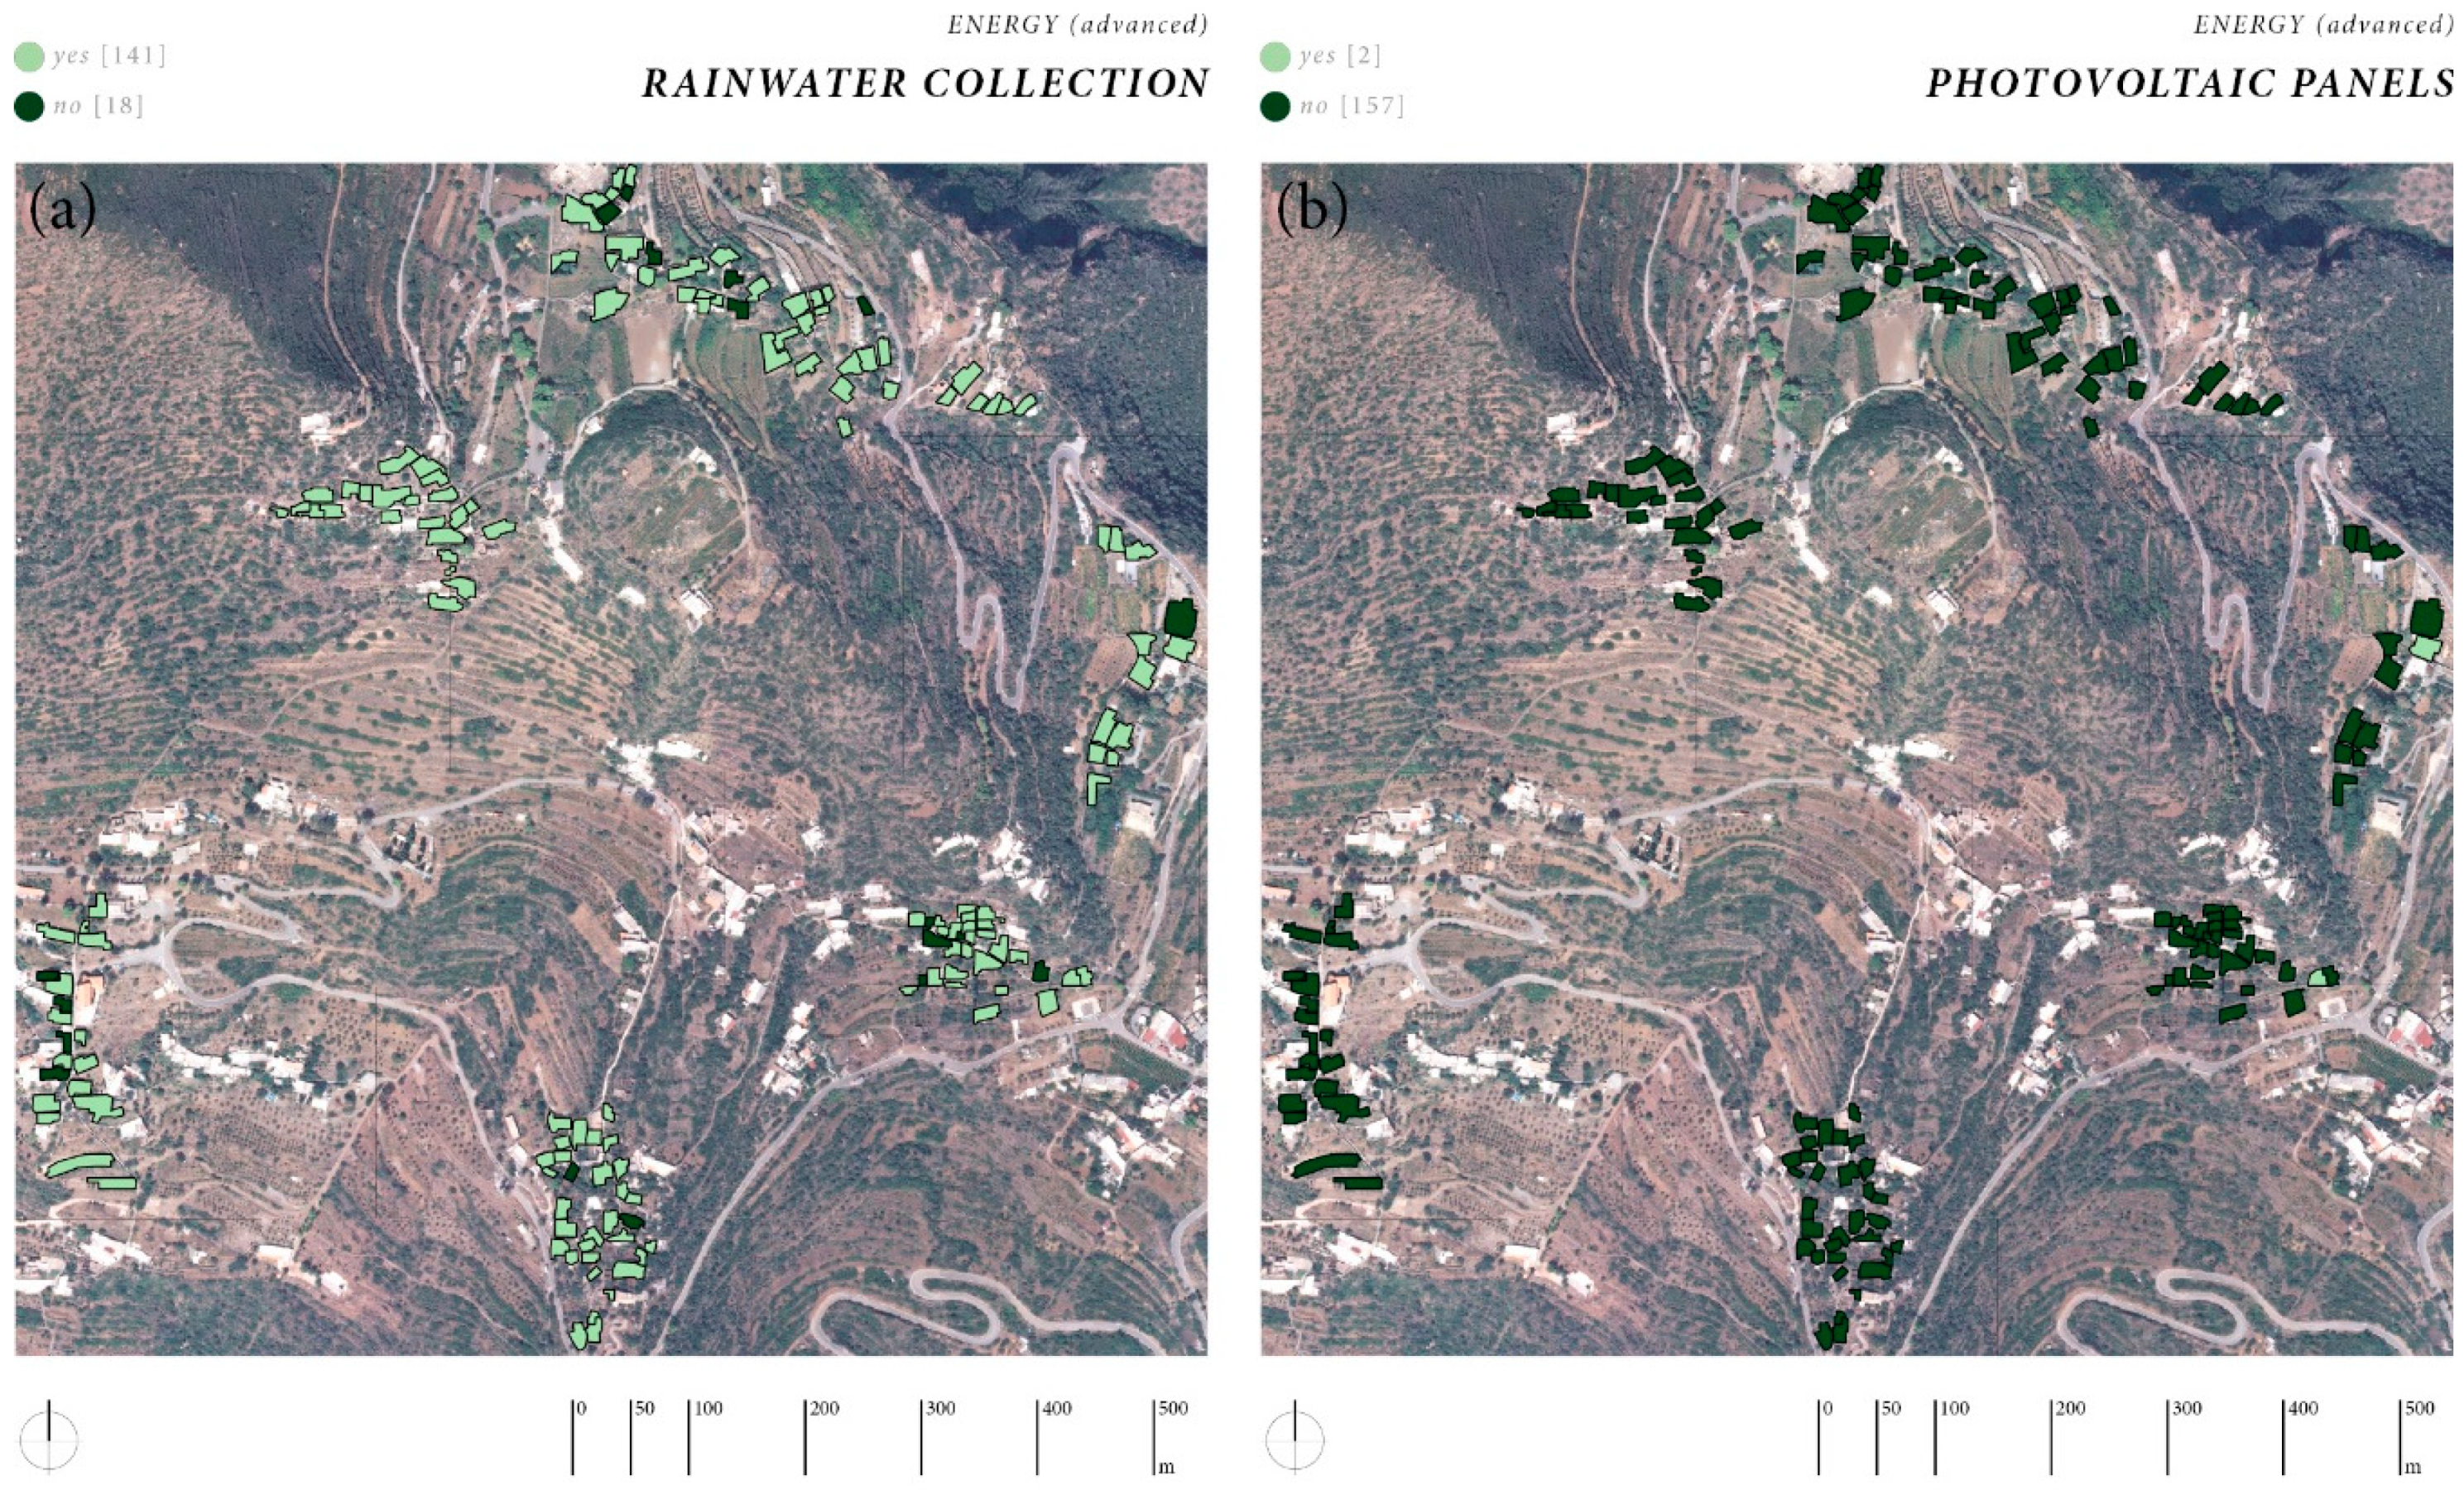
The tool also allows the creation of specific queries, identifying the distribution of a specific data. For example, by analyzing two themes in the macro-area Energy, namely, rainwater collection and photovoltaic panel (Figure 17), it can be seen that the first relates to almost all of the buildings, while the second is rare. This possibility of analysis makes this tool suitable to plan the refurbishment purpose. In fact, you can image different scenarios and compare the effect of them in the improvement of the building’s quality. The survey tool allows to direct interventions on the entire territory in order to raise the total score and hence the overall quality of the building. This is the main goal, more than the redevelopment at the level of the project of the single building, for which a detailed survey certainly provides a more specific tool. Thus, this tool can be particularly useful for directing the capitals that at the community or national level are often allocated for the revitalization of marginal areas.
During the study, the application of consolidated tools for reading and addressing strategies for the recovery of existing buildings, namely, the REM and the GIS, was tested. Their interrelation has allowed the creation of a flexible and innovative reading tool. The adoption of a REM methodology has made it possible to contain the execution times of the study, while maintaining a large amount of data collected.
Having implemented the analyses conducted with the REM tools on a GIS platform made it possible to systematize the results obtained. The GIS tool leads to a double level of reading. It is in fact a tool for those involved in safeguarding and enhancing (administrators, technicians, builders, etc.), and for those who do not have specific knowledge in the matter (property owners, local associations, etc.).
The first one constitutes a useful pool of knowledge to draw on when dealing with the project of recovery or re-functionalization of the architecture of the place, providing data on the state of the places with respect to their original configuration and conformation. The results of the final analysis provided a sufficient level of detail to identify the critical factors as well as the potential (e.g., too high energy consumption, low use of renewable sources, sufficient seismic safety conditions, loss of traditional characters and integration in the environmental context).
For those without specific knowledge, it is an index of the state of health of local real estate. The instrument is in fact able to provide an intuitive index of the quality level of the property, as well as a rough indication of what the priorities for intervention are to improve it. Compared to the current evaluation methods (energy certification, seismic classification, etc.) the method proposed has the advantage of being multidisciplinary and flexible. In fact, the subdivision of the data collected into separate categories facilitates reading and allows the identification of critical issues more easily.
The DOCET analysis served as validation tool. Figure 11 shows that the average low level of energy performance results both from REM and from DOCET. The specific energy consumptions range from a minimum of 56.0 kWh/m2 to a maximum of 127.0 kWh/m2, while the energy classes are between the C and the D. While the score for the macro-area Energy goes from 13, which correspond the building with the worst energy class (i.e., D), to 22. Thus, the substantial correspondence between the energy score and the energy classification carried out by DOCET, as a draft, permitted to assert that the methodology adopted to provide more than acceptable results. With regards to the energy consumptions, it can be observed that the building selected for the Contrada Canale Nord is not very well representative of the Aeolian Architecture, as also shown by its very high S/V ratio (higher than 1.0). Thus, excluding this value, the average energy consumption is 67 kWh/m2, which could be assumed as reference values for the buildings to achieve an energy score of about 20. Finally, considering that the highest achievable score is 30, it will be possible to foresee refurbishment work specifically designed for each building, since it is known which its specific points of weaknesses are.
The medium-high level of seismic safety condition that result from REM were validated by visual analysis of masonry cracks. Even if seismic events affect the Aeolian archipelago periodically, the crack of the Filicudi building walls is slight.

5.2. Criticism and Future Development

A limitation shown by the research consists in the fact that a thorough knowledge and preliminary studies on the buildings and environment to be investigated are necessary to better understand which risks are prevalent (seismic, hydraulic, geological risk, etc.) and to identify the correct degree of study of the themes. In any case, it was opportune to limit the themes addressed, to avoid obtaining results that are not usable or contradictory.
Future work will be directed towards the realization of some typical interventions to be carried out on buildings to raise the level of general quality. Such standard interventions will serve as guidelines for recovery intervention designers.
Another target is to realize a georeferenced virtual environment addressed to different kind of users: non-expert people and expert people. The first ones will be enabled only to fill a form to obtain a rapid evaluation about their home; the expert users will be able to build a parametric tridimensional informational model, by defining the suitable Level of Development. This combination of GIS, REM and BIM will make this informatics tool very powerful and useful. It could utilize the standard IFC (Industry Foundation Class) [63,64] that is already in use in some GIS platform which work on shapefile.

6. Conclusions

The abandonment of rural areas is a significant contemporary phenomenon, which makes them marginal, as is occurring on the Aeolian Islands. A better knowledge of these kinds of settlements is the first step to understand how to revitalize them and make them useful, according to the contemporary needs of the users. The analysis is the preliminary operation to any type of intervention on the area; to reach this aim, this article has shown an advanced, dynamic, multidisciplinary tool.
The tool is based on the REM approach, in GIS environment. This synergy leads to a double level of reading; in fact, it may be used both by expert people (administrators, technicians, builders, etc.) and non-expert people (property owners, local associations, etc.). The first group may have a deep analysis of the data, with a series of specific quarries. The second group may have an intuitive idea of the quality of the buildings, consulting a global index, that is, the total score.
It is also possible to use it to have indication about the priorities to improve it, by simulating different scenarios. The output is multidisciplinary and flexible, because it can have a different focus and it can be easily improved and updated.
It was applied on the study case of Filicudi isle, one of the most interesting of the Aeolian archipelago, by focusing on three topics: relationship between natural landscape/anthropic landscape; precautions to ensure adequate comfort conditions; seismic resistance.
The application of the methodology on the Filicudi test-site has shown that this approach is powerful. The analysis has also shown the overall quality of the island’s construction, namely, that it is very high. In fact, more than half of the buildings surveyed reported a median score higher than the medium value (that is 50, in a range of −30 to 90); moreover, the mean value was quite high (49 points).
The future development of this research is the realization of a to realize a georeferenced virtual environment to combination GIS, REM and also BIM, in order to obtain a very powerful and useful predictive informatics tool.

Author Contributions

S.C., 1. Introduction, 4.1. Filicudi island choosing; A.G., 2. Methodology, 4.3. Features detection and weighing; S.G., 2. State of the art (except 2.2), 4. Application on the test-site (except 4.1, 4.3, 4.7, 4.8); G.R., 5. Discussion, 4.8. Discussion case selection; V.S., Supervision of the work, 2.2. Aeolian landscape and local traditional architecture, 4.7. Detailed survey, 6. Conclusion. All authors have read and agreed to the published version of the manuscript.

Funding

This research was funded by “Piano della Ricerca Dipartimentale 2016–2020” by University of Catania through the Department of Civil Engineering and Architecture.

Conflicts of Interest

The authors declare no conflict of interest.

References

  1. United Nations, Department of Economic and Social Affairs, Population Division. World Urbanization Prospects: The 2018 Revision, Methodology, Working Paper No. ESA/P/WP.252; United Nations: New York, NY, USA, 2018. [Google Scholar]
  2. Foruzanmehr, A.; Vellinga, M. Vernacular architecture: Questions of comfort and practicability. Build. Res. Inf. 2011, 39, 274–285. [Google Scholar] [CrossRef]
  3. Di Pasquale, L.; Mecca, I. L’architettura vernacolare come modello codificato per il progetto contemporaneo sostenibile. Techne 2016, 12, 190–198. [Google Scholar]
  4. Latouche, S. Breve Trattato Sulla Decrescita Serena; Bollati Boringhieri: Torino, Italy, 2009. [Google Scholar]
  5. Italian Operative Programs. Available online: http://community-pon.dps.gov.it/areeinterne/progetto-aree-interne/la-strategia-nazionale-per-le-aree-interne/ (accessed on 2 December 2019).
  6. Padiglione Italia Alla Biennale Architettura 2018. Available online: http://www.arcipelagoitalia.it/home (accessed on 2 December 2019).
  7. Cucinella, M. Arcipelago Italia. Progetti Per Il Futuro Dei Territori Interni Del Paese. Padiglione Italia Alla Biennale Architettura 2018; Quodlibet: Macerata, Italy, 2018. [Google Scholar]
  8. Noble, A.G. Traditional Buildings: A Global Survey of Structural Forms and Cultural Functions; I.B. Tauris & Co. Ltd.: London, UK; New York, NY, USA, 2007. [Google Scholar]
  9. Marini, S. Nuove Terre. Architetture e Paesaggi Dello Scarto; Quodlibet Studio: Macerata, Italy, 2018. [Google Scholar]
  10. Bauman, Z. Modernità Liquida; Editori Laterza: Roma, Italy, 2011. [Google Scholar]
  11. European Landscape Convention, Florence 2000. Available online: https://www.coe.int/en/web/landscape/the-european-landscape-convention (accessed on 2 January 2020).
  12. VVITA. Rural Forward Platform. Available online: https://sites.google.com/view/vvita/ (accessed on 2 December 2019).
  13. Ciaschi, A.; De Iulio, R. Aree Marginali e Modelli Geografici di Sviluppo. Teorie e Esperienze a Confronto; Sette Città: Viterbo, Italy, 2014. [Google Scholar]
  14. Di Maggio Alleruzzo, M.T. Modificazioni ed usure dello spazio vissuto nell’arcipelago eoliano. In Atlante dei Beni Etno-Antropologici Eoliani; Todesco, S., Ed.; E.D.A.S. Edizioni Dr. Antonino Sfameni: Messina, Italy, 1995. [Google Scholar]
  15. Lo Cascio, G. Architetture Eoliane; Litografia Lombardo Milazzo: Lipari, Italy, 1998. [Google Scholar]
  16. Maramai, A.; Graziani, L.; Tinti, S. Tsunamis in the Aeolian Islands (southern Italy): A review. Mar. Geol. 2005, 215, 11–21. [Google Scholar] [CrossRef]
  17. Oliva, A.; Perricone, M. Tecniche costruttive storiche del patrimonio edilizio eoliano. In Archivio Storico Messinese; University of Toronto Libraries: Toronto, ON, Canada, 1995; p. 69. [Google Scholar]
  18. Lo Curzio, M. Il patrimonio architettonico delle Isole Eolie. Notazioni su caratteri, tutela ed interventi conservativi. In Atlante dei Beni Etno-Antropologici Eoliani; Todesco, S., Ed.; E.D.A.S. Edizioni: Messina, Italy, 1995. [Google Scholar]
  19. Sapienza, V. The Aeolian houses of Filicudi: An example of spontaneous sustainable architecture. Il Progetto Sostenibile. RICERCA e Tecnologie per L’ambiente Costruito 2014, 34, 68–77. [Google Scholar]
  20. Anastasio, G. L’architettura tradizionale delle Isole Eolie. In Atlante dei Beni Etno-Antropologici Eoliani; Todesco, S., Ed.; E.D.A.S. Edizioni Dr. Antonino Sfameni: Messina, Italy, 1995. [Google Scholar]
  21. Sapienza, V. Aeolian Houses—Design of an Innovative Teaching Module; Edicom Edizioni: Gorizia, Italy, 2018; pp. 1–108. [Google Scholar]
  22. Sapienza, V. Spontaneous Architecture and Energetic Sustainability: The Aeolian Homes of Filicudi Isle. In Proceedings of the ZEMCH-12, Glasgow, UK, 20–22 August 2012; pp. 340–350. [Google Scholar]
  23. Giuffrè, A. Sicurezza e Conservazione dei Centri Storici—Il Caso Ortigia; La Terza: Bari, Italy, 1993. [Google Scholar]
  24. Grecchi, M.; Malighetti, L.E. Ripensare il Costruito. Il Progetto di Recupero e Rifunzionalizzazione Degli Edifici; Maggioli Editore: Rimini, Italy, 2008. [Google Scholar]
  25. Haapio, A.; Viitaniemi, P. A critical review of building environmental assessment tools. Environ. Impact Assess. Rev. 2008, 28, 469–482. [Google Scholar] [CrossRef]
  26. Kalman, H. The Evaluation of Historic Buildings; Published under authority of the Minister of the Environment: Ottawa, ON, Canada, 1980. [Google Scholar]
  27. Roulet, C.A.; Flourentzou, F.; Labben, H.H.; Sanamouris, M.; Koronaki, I.; Dascalaki, E.; Richalet, V. ORME: A multicriteria rating methodology for buildings. Build. Environ. 2002, 37, 579–586. [Google Scholar] [CrossRef]
  28. Srikanth, T.; Kumar, R.P.; Singth, A.P.; Rastogi, B.K.; Kumar, S. Earthquake Vulnerability Assessment of Existing Buildings in Gandhidham and Adipur Cities Kachchh, Gujarat (India). Eur. J. Sci. Res. 2010, 41, 336–353. [Google Scholar]
  29. Baggio, C.; Bernardini, A.; Colozza, R.; Corazza, L.; Della Bella, M.; Di Pasquale, G.; Dolce, M.; Goretti, A.; Martinelli, A.; Orsini, G.; et al. Field Manual for post-earthquake damage and safety assessment and short term countermeasures (AeDES). 2007. Available online: https://www.eeri.org/wp-content/uploads/Italy/EUR%2022868%20(2007)%20Field%20Manual%20for%20post-earthquake%20damage%20assessment.pdf (accessed on 2 December 2019).
  30. Italian Civil Protection. Available online: http://www.protezionecivile.gov.it/risk-activities/seismic-risk/activities (accessed on 2 December 2019).
  31. GBCB. Green Building Council. Available online: https://new.usgbc.org/ (accessed on 2 December 2019).
  32. BREEAM. BREEAM Official Web Page. Available online: https://www.breeam.com/ (accessed on 2 December 2019).
  33. DGNB. DNGB International Application. Available online: https://www.dgnb.de/de/ (accessed on 2 December 2019).
  34. Arbizzani, E. Tecnica e Tecnologia dei Sistemi Edilizi; Maggioli Editore: Milano, Italy, 2015. [Google Scholar]
  35. Bernardi, E.; Carlucci, S.; Cornaro, C.; Bohne, R.A. An Analysis of the Most Adopted Rating Systems for Assessing the Environmental Impact of Buildings. Sustainability 2017, 9, 1226. [Google Scholar] [CrossRef] [Green Version]
  36. Abdalla, G.; Maas, G.; Huyghe, J.; Oostra, M. Criticism on Environmental Assessment Tools. In Proceedings of the 2nd International Conference on Environmental Science and Technology, Belgrade, Serbia, 28 September–2 October 2016. [Google Scholar]
  37. Berardi, U. Sustainability Assessment in the Construction Sector: Rating Systems and Rated Buildings. Sustain. Dev. 2011, 20, 411–424. [Google Scholar] [CrossRef]
  38. Poletti, A. GIS. Metodi e Strumenti Per un Nuovo Governo Della Città e Del Territorio; Maggioli Editore: Milano, Italy, 2001. [Google Scholar]
  39. Casagrande, L.; Cavallini, P.; Frigeri, A.; Furieri, A.; Marchesini, I.; Neteler, M. GIS Open Source. Grass GIS, Quantum GIS e SpatialLite. Elementi di Software Libero Applicato al Territorio; Dario Flaccovio Editore: Palermo, Italy, 2014. [Google Scholar]
  40. Li, R.Y.M. 5D GIS virtual heritage. Procedia Comput. Sci. 2017, 111, 294–300. [Google Scholar] [CrossRef]
  41. Kristy, G. The impact of urban sprawl on cultural heritage in Herat, Afghanistan: A GIS analysis. Digit. Appl. Archaeol. Cult. Herit. 2018, 10, 1–8. [Google Scholar]
  42. Gagliano, A.; Patania, F.; Capizzi, A.; Nocera, F.; Galesi, A. A proposed methodology for estimating the performance of small wind turbines in urban areas. Sustain. Energy Build. 2012, 12, 539–548. [Google Scholar]
  43. Gagliano, A.; Patania, F.; Nocera, F.; Capizzi, A.; Galesi, A. GIS-based decision support for solar photovoltaic planning in urban environment. Sustain. Energy Build. 2013, 22, 865–874. [Google Scholar]
  44. Gagliano, A.; Nocera, F.; D’Amico, A.; Spataru, C. Geographical information system as a support tool for sustainable Energy Action Plan. Energy Procedia 2015, 83, 310–319. [Google Scholar] [CrossRef] [Green Version]
  45. De Mauro, A.; Greco, M.; Grimaldi, M. A Formal definition of Big Data based on its essential features. Libr. Rev. 2016, 65, 122–135. [Google Scholar] [CrossRef]
  46. Wang, S.; Zhong, Y.; Wang, E. An integrated GIS platform architecture for spatiotemporal big data. Future Gener. Comput. Syst. 2019, 94, 160–172. [Google Scholar] [CrossRef]
  47. Ma, Z.; Ren, Y. Integrated application of BIM and GIS: An overview. Procedia Eng. 2017, 196, 1072–1079. [Google Scholar] [CrossRef]
  48. Bianco, I.; Del Giudic, M.; Zerbinatti, M. A database for the architectural heritage recovery between Italy and Switzerland. ISPRS Int. Arch. Photogramm. Remote Sens. Spat. Inf. Sci. 2013, 40, 103–108. [Google Scholar] [CrossRef] [Green Version]
  49. Baik, A.; Yaagoubi, R.; Boehm, J. Integration of Jeddah historical BIM and 3D GIS for documentation and restoration of historical monument. In Proceedings of the 25th International CIPA Symposium 2015 (XL-5/W7), Taipei, Taiwan, 31 August 2015–4 September 2015; pp. 29–34. [Google Scholar]
  50. He, J.; Liu, J.; Xu, S.; Wu, C.; Zhang, J. A GIS-based cultural heritage study framework on continuous scales: A case study on 19th century military industrial heritage. ISPRS Int. Arch. Photogramm. Remote Sens. Spat. Inf. Sci. 2015, XL-5/W7, 215–222. [Google Scholar] [CrossRef] [Green Version]
  51. Iadanza, E.; Turillazzi, B.; Terzaghi, F.; Marzi, L.; Giuntini, A.; Sebastian, R. The Streamer European Project. Case study: Careggi Hospital in Florence. In 6th European Conference of the International Federation for Medical and Biological Engineering; Springer: Berlin, Germany, 2015; pp. 649–652. [Google Scholar]
  52. Roman Empire. Available online: https://www.romanoimpero.com/2010/12/marco-vitruvio-pollione-80-23-ac.html (accessed on 29 November 2019).
  53. QGIS User Guide, Release 2.8. Available online: https://docs.qgis.org/2.8/pdf/en/QGIS-2.8-UserGuide-en.pdf (accessed on 29 December 2019).
  54. Filicudi Island. Available online: https://www.filicudi.info/isolafilicudi/isola-filicudi (accessed on 2 December 2019).
  55. Piano di gestione UNESCO Isole Eolie, Regione Siciliana. 2014. Available online: http://www.regione.sicilia.it/beniculturali/dirbenicult/pianogestioneeolie.html (accessed on 10 February 2020).
  56. Smart Filicudi. Available online: http://www.smartisland.eu/replicabilita/eolie/filicudi.html (accessed on 2 December 2019).
  57. 3D Metric Web Site. Available online: https://3dmetrica.it/sistemi-di-riferimento/ (accessed on 29 November 2019).
  58. Geo Repository Web Site. Available online: http://georepository.com/crs_3857/WGS-84-Pseudo-Mercator.html (accessed on 29 November 2019).
  59. Bertolin, C.; Caliò, I.; Finocchiaro, L.; Gagliano, A.; Hărmănescu, M.; Mandrescu, E.C.; Margani, G.; Mihăilă, M.; Panait, A.; Sapienza, V.; et al. VVITA Project—Sustainable and inclusive development of strategies to vitalize villages through innovative architecture technologies. In Proceedings of the 4th Biennal of Architectural and Urban Restoration (BRAU4); Cicop Italia: Florence, Italy, 2018. [Google Scholar]
  60. DOCET, Evaluation Software. Available online: http://www.docet.itc.cnr.it/ (accessed on 2 December 2019).
  61. Solarity Web Site. Available online: http://www.solaritaly.enea.it/ (accessed on 2 December 2019).
  62. Wind Finder Web Site. Available online: http://www.windfinder.com (accessed on 2 December 2019).
  63. Eastman, C.; Teicholz, P.; Sacks, R.; Liston, K. BIM Handbook. A guide to Building Information Modeling for Owners, Managers, Designers, Engineers and Contractors; Di Giuda, G.M., Villa, V., Eds.; Hoepli: Milano, Italy, 2016. [Google Scholar]
  64. Ferrara, A.; Feligioni, E. Come Redigere il Capitolato Informativo Secondo la Metodologia BIM; Dario Flaccovio Editore: Palermo, Italy, 2018. [Google Scholar]
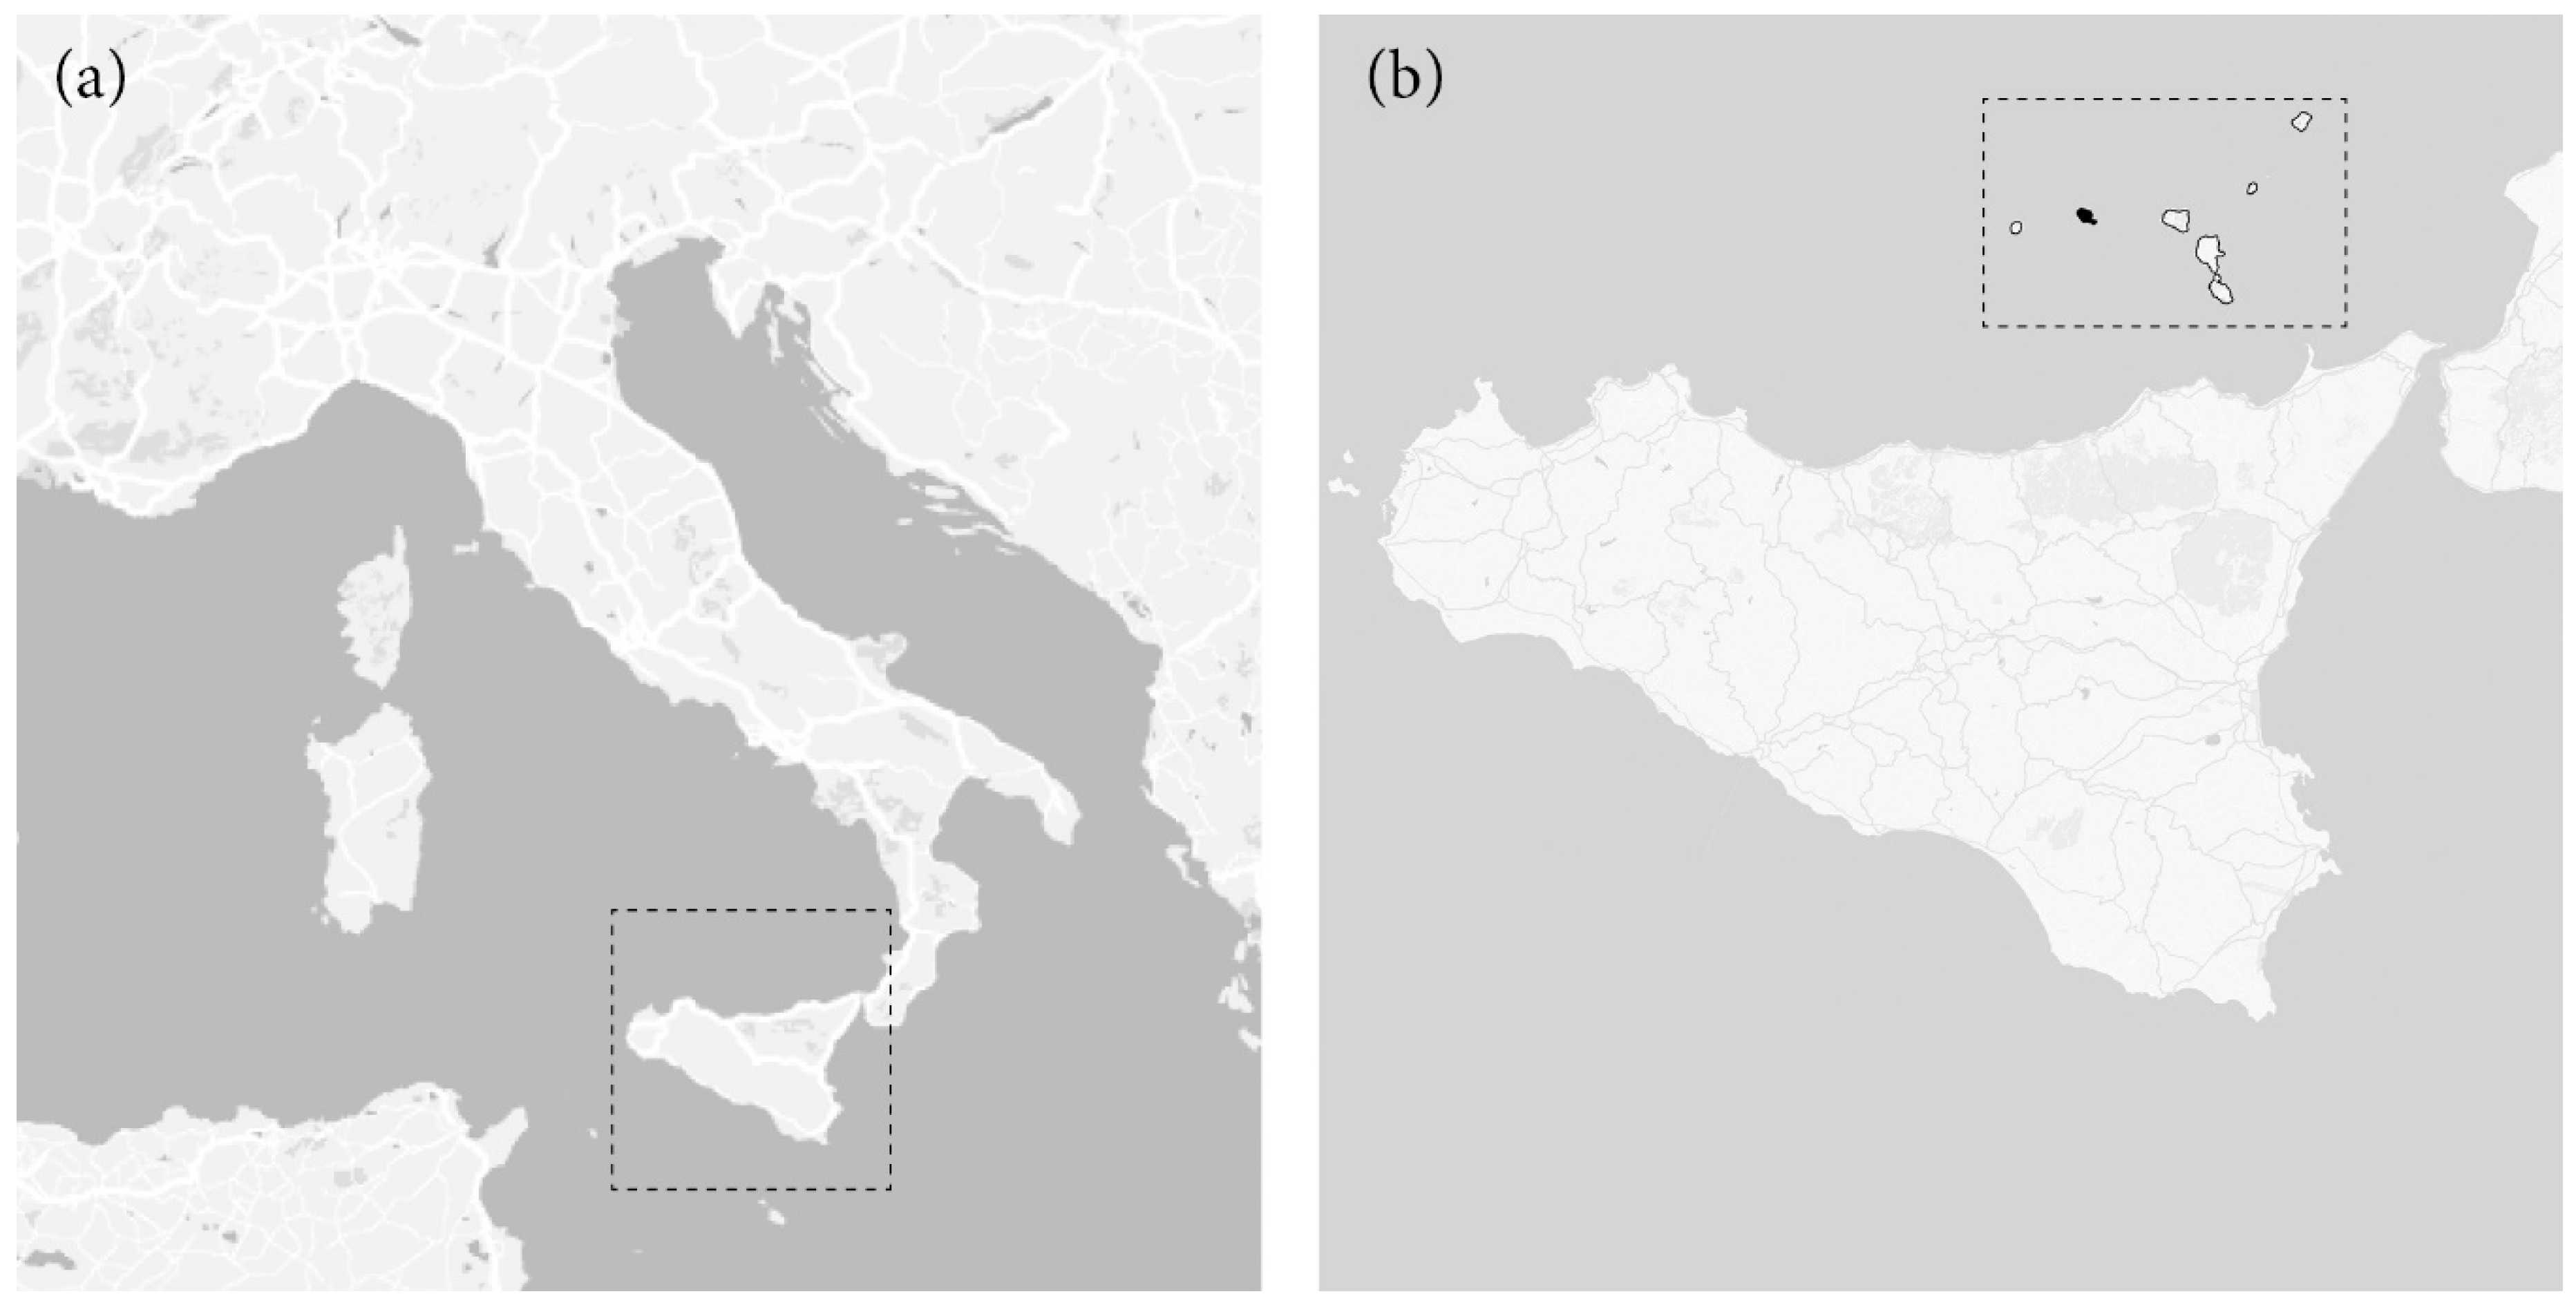
Figure 1. Maps of the place: (a) Sicily, (b) Aeolian Islands.
Sustainability 12 01285 g001
Figure 2. Typical Aeolian houses [14].
Sustainability 12 01285 g002
Figure 3. Working process for the covering: (a) throwing of the inert, (b) drafting of the mortar, (c) beating, (d) smoothing [14].
Sustainability 12 01285 g003
Figure 4. Sustainable design of the Aeolian house [22].
Sustainability 12 01285 g004
Figure 5. Example of a table of attributes.
Sustainability 12 01285 g005
Figure 6. View of the Isle of Filicudi.
Sustainability 12 01285 g006
Figure 7. Mule tracks of Filicudi (on the left) and Contrada of Filicudi (on the right).
Sustainability 12 01285 g007
Figure 8. Orthophotos of Filicudi.
Sustainability 12 01285 g008
Figure 9. Evaluation sheet defined for the macro-area Structure.
Sustainability 12 01285 g009
Figure 10. Form used for cataloguing the survey data.
Sustainability 12 01285 g010
Figure 11. Output of the DOCET analysis.
Sustainability 12 01285 g011
Figure 12. Graph of the scores achieved in the macro-area Buildings. The x axis shows the score reached, the y axis shows the number of buildings.
Sustainability 12 01285 g012
Figure 13. Graph of the scores achieved in the macro-area Structure. The x axis shows the score reached, the y axis shows the number of buildings.
Sustainability 12 01285 g013
Figure 14. Graph of the scores achieved in the macro-area Energy. The x axis shows the score reached, the y axis shows the number of buildings.
Sustainability 12 01285 g014
Figure 15. Graph of the total score. The x axis shows the score reached, the y axis shows the number of buildings.
Sustainability 12 01285 g015
Figure 16. The total score of the buildings of the six Contrada. The score shows the overall quality of the buildings.
Sustainability 12 01285 g016
Figure 17. Two results of specific queries: (a) rainwater collection; (b) photovoltaic panel.
Sustainability 12 01285 g017
Table 1. Macro-frameworks.
Macro frameworks
General DataGeometrySupplementary DataBuildingStructureEnergy
Toponomastic dataBuilding topology dataData carried out through post-processingArchitecture building features and integration into the natural environmentStructural and stability featuresData on environmental energy performance
Table 2. An example of the evaluation sheet with the score.
BUILDING Features (alias)FunctionsSTRUCTURE Features (alias)FunctionsENERGY Features (alias)FunctionSCORING Features (alias)Function
cellular aggregation scoreCASE WHEN "b_b_01" = ’cluster’ THEN ’2’
WHEN "b_b_01" = ’row’ THEN ’1’
ELSE ’0’
END
construction features scoreCASE WHEN "s_b_01" = ’mixed’ THEN ’2’
WHEN "s_b_01" = ’reinforced concrete’ THEN ’1’
ELSE ’0’
END
surface/volume scoreCASE WHEN "e_b_01" = ’≤ 0.6’ THEN ’2’
WHEN "e_b_01" = ’0.6 < S/V ≤ 1.2’
THEN ’1’
ELSE ’0’
END
BUILDING SCORE"b_b_s_01" + "b_b_s_02" + "b_b_s_03" + "b_b_s_04" + "b_b_s_05" + "b_b_s_06" + "b_b_s_07" + "b_b_s_08" + "b_a_s_01" + "b_a_s_02" + "b_a_s_03" + "b_a_s_04" + "b_a_s_05" + "b_a_s_06" + "b_a_s_07" + "b_a_s_08" + "b_a_s_09" + "b_a_s_10"
relation with the slope scoreCASE WHEN "b_b_02" = ’aligned’ THEN ’2’
ELSE ’0’
END
foundation scoreCASE WHEN "s_b_02" = ’horizontal’ THEN ’2’
ELSE ’0’
END
facade hue scoreCASE WHEN "e_b_02" = ’light’ THEN ’2’
ELSE ’0’
END
architectural shape scoreCASE WHEN "b_b_03" = ’cubic cells’ THEN ’2’
ELSE ’0’
END
layout organization scoreCASE WHEN "s_b_03" = ’cellular type’ THEN ’2’
ELSE ’0’
END
external shading scoreCASE WHEN "e_b_03" = ’yes’ THEN ’2’
ELSE ’0’
END
STRUCTURE SCORE"s_b_s_01" + "s_b_s_02" + "s_b_s_03" + "s_b_s_04" + "s_b_s_05" + "s_b_s_06" + "s_b_s_07" + "s_b_s_08" + "s_a_s_01" + "s_a_s_02" + "s_a_s_03" + "s_a_s_04" + "s_a_s_05" + "s_a_s_06" + "s_a_s_07" + "s_a_s_08" + "s_a_s_09" + "s_a_s_10"
volume addiction scoreCASE WHEN "b_b_04" = ’less than 10%’ THEN ’2’
WHEN "b_b_04" = ’less than 40%’ THEN ’1’
ELSE ’0’
END
number of floors scoreCASE WHEN "s_b_04" = ’1’ THEN ’2’
WHEN "s_b_04" = ’2’ THEN ’1’
ELSE ’0’
END
orientation scoreCASE WHEN "e_b_04" = ’N - S’ THEN ’2’
WHEN "e_b_04" = ’NE - SW/NW - SE’ THEN ’1’
ELSE ’0’
END
perimeter walls scoreCASE WHEN "b_b_05" = ’plastered’ THEN ’2’
WHEN "b_b_05" = ’exposed stone’ THEN ’1’
ELSE ’0’
END
staircase scoreCASE WHEN "s_b_05" = ’outside’ THEN ’2’
WHEN "s_b_05" = ’none’ THEN ’1’
ELSE ’0’
END
thermal phaseshift scoreCASE WHEN "e_b_05" = ’10 h - 15 h’ THEN ’2’
WHEN "e_b_05" = ’5 h - 10 h’ THEN ’1’
ELSE ’0’
END
ENERGY SCORE"e_b_s_01" + "e_b_s_02" + "e_b_s_03" + "e_b_s_04" + "e_b_s_05" + "e_b_s_06" + "e_b_s_07" + "e_b_s_08" + "e_a_s_01" + "e_a_s_02" + "e_a_s_03" + "e_a_s_04" + "e_a_s_05" + "e_a_s_06" + "e_a_s_07" + "e_a_s_08" + "e_a_s_09" + "e_a_s_10"
green essences scoreCASE WHEN "b_b_06" = ’traditional’ THEN ’2’
ELSE ’0’
END
largest cell scoreCASE WHEN "s_b_06" = ’≤ 30 mq’ THEN ’2’
ELSE ’0’
END
overhangs scoreCASE WHEN "e_b_06" = ’yes’ THEN ’2’
ELSE ’0’
END
pulere scoreCASE WHEN "b_b_07" = ’in use’ THEN ’4’
WHEN "b_b_07" = ’not in use’ THEN ’2’
ELSE ’0’
END
plan regularity scoreCASE WHEN "s_b_07" = ’good’ THEN ’4’
WHEN "s_b_07" = ’moderate’ THEN ’2’
ELSE ’0’
END
daylighting scoreCASE WHEN "e_b_07" = ’FLDm > 4’ THEN ’4’
WHEN "e_b_07" = ’2 < FLDm ≤ 4’ THEN ’2’
ELSE ’0’
END
TOTAL SCORE"b_score" + "s_score" + "e_score"
bagghiu scoreCASE WHEN "b_b_08" = ’yes’ THEN ’4’
ELSE ’0’
END
height regularity scoreCASE WHEN "s_b_08" = ’yes’ THEN ’4’
ELSE ’0’
END
natural ventilation scoreCASE WHEN "e_b_08" = ’yes’ THEN ’4’
ELSE ’0’
END
pavements scoreCASE WHEN "b_a_01" = ’congruent’ THEN ’1’
ELSE ’-1’
END
type of soil scoreCASE WHEN "s_a_01" = ’rock’ THEN ’1’
ELSE ’-1’
END
U walls scoreCASE WHEN "e_a_01" = ’≤ 1.5’ THEN ’1’
ELSE ’-1’
END
roof scoreCASE WHEN "b_a_02" = ’congruent’ THEN ’1’
ELSE ’-1’
END
masonry quality scoreCASE WHEN "s_a_02" = ’good’ THEN ’1’
ELSE ’-1’
END
U roof scoreCASE WHEN "e_a_02" = ’≤ 1.5’ THEN ’1’
ELSE ’-1’
END
pulere shape scoreCASE WHEN "b_a_03" = ’congruent’ THEN ’1’
ELSE ’-1’
END
walls thickness scoreCASE WHEN "s_a_03" = ’≥ 50 cm’ THEN ’1’
ELSE ’-1’
END
U windows scoreCASE WHEN "e_a_03" = ’≤ 3.5’
THEN ’1’
ELSE ’-1’
END
horizontal shading scoreCASE WHEN "b_a_04" = ’congruent’ THEN ’1’
ELSE ’-1’
END
walls slimness scoreCASE WHEN "s_a_04" = ’≤ 12’
THEN ’1’
ELSE ’-1’
END
shutters scoreCASE WHEN "e_a_04" = ’yes’ THEN ’1’
ELSE ’-1’
END
facade color scoreCASE WHEN "b_a_05" = ’traditional’ THEN ’1’
ELSE ’-1’
END
walls on slople scoreCASE WHEN "s_a_05" = ’no’ THEN ’1’
ELSE ’-1’
END
rainwater collection scoreCASE WHEN "e_a_05" = ’yes’ THEN ’1’
ELSE ’-1’
END
door jambs and lintel scoreCASE WHEN "b_a_06" = ’traditional’ THEN ’1’
ELSE ’-1’
END
connections efficiency scoreCASE WHEN "s_a_06" = ’yes’ THEN ’1’
ELSE ’-1’
END
photovoltaic panels scoreCASE WHEN "e_a_06" = ’yes’ THEN ’1’
ELSE ’-1’
END
windows shape scoreCASE WHEN "b_a_07" = ’congruent’ THEN ’1’
ELSE ’-1’
END
damages or cracks scoreCASE WHEN "s_a_07" = ’no’ THEN ’1’
ELSE ’-1’
END
solar thermal scoreCASE WHEN "e_a_07" = ’yes’ THEN ’1’
ELSE ’-1’
END
windows frame scoreCASE WHEN "b_a_08" = ’congruent’ THEN ’1’
ELSE ’-1’
END
openings for cell scoreCASE WHEN "s_a_08" = ’≤ 2’ THEN ’1’
ELSE ’-1’
END
cooling system scoreCASE WHEN "e_a_08" = ’yes’ THEN ’1’
ELSE ’-1’
END
windows shutters scoreCASE WHEN "b_a_09" = ’congruent’ THEN ’1’
ELSE ’-1’
END
large arches scoreCASE WHEN "s_a_09" = ’no’ THEN ’1’
ELSE ’-1’
END
heating system scoreCASE WHEN "e_a_09" = ’yes’ THEN ’1’
ELSE ’-1’
END
pluvials scoreCASE WHEN "b_a_10" = ’congruent’ THEN ’1’
ELSE ’-1’
END
floors rigidity scoreCASE WHEN "s_a_10" = ’wood or steel’ THEN ’1’
ELSE ’-1’
END
vegetation scoreCASE WHEN "e_a_10" = ’yes’ THEN ’1’
ELSE ’-1’
END
Table 3. Declaration of the basic parameters and their relative score.
BUILDINGSTRUCTUREENERGY
Cellular aggregationcluster
row
isolated
+2
+1
0
Construction featuresmixed
reinforced concrete
isolated
+2
+1
0
Surface/Volume≤0.6
0.6 < S/V ≤ 1.2
>1.2
+2
+1
0
Relation with the slopealigned transversal+2
0
Foundationhorizontal
slope
+2
0
Facade hueLight
dark
+2
0
Architectural shapecubic cells
other
+2
0
Layout organizationcellular type
other type
+2
0
Horizontal shadingyes
no
+2
0
Volume addictionless than 10%
less than 40%
more than 40%
+2
+1
0
Number of floors1
2
>2
+2
+1
0
OrientationN – S
NE - SW/NW – SE
E - W
+2
+1
0
Perimeter wallsplastered
exposed stone
other
+2
+1
0
Staircaseoutside
none
inside
+2
+1
0
Thermal phaseshift10 h–15 h
5 h–10 h
<5 h
+2
+1
0
Green essencestraditional
not traditional
+2
0
Largest cell≤30 m2
>30 m2
+2
0
Overhangsyes
no
+2
0
Pulerein use
not in use
none
+ 4
+2
0
Plan regularitygood
moderate
no
+4
+2
0
DaylightingFLDm > 4
2 < FLDm ≤ 4
FLDm ≤ 2
+4
+2
0
Bagghiuyes
no
+4
0
Height regularityyes
no
+4
0
Natural ventilationyes
no
+4
0
Table 4. Declaration of the advanced parameters and their relative score.
BUILDINGSTRUCTUREENERGY
Pavementscongruent
not congruent
+1
−1
Type of soilrock
soft
+1
−1
U walls≤1.5
>1.5
+1
−1
Roofcongruent
not congruent
+1
−1
Masonry qualitygood
poor
+1
−1
U roof≤1.5
>1.5
+1
−1
Pulere shapecongruent
not congruent
+1
−1
Walls thickness≥50 cm
<50 cm
+1
−1
U windows≤3.5
>3.5
+1
−1
Horizontal shadingcongruent
not congruent
+1
−1
Walls slimness≥12
<12
+1
−1
Shuttersyes
no
+1
−1
Facade colortraditional
not traditional
+1
−1
Walls on slopeno
yes
+1
−1
Rainwater collectionyes
no
+1
−1
Door jambs and linteltraditional
not traditional
+1
−1
Connections efficiencyno
yes
+1
−1
Photovoltaic panelsyes
no
+1
−1
Windows shapecongruent
not congruent
+1
−1
Damages or cracksno
yes
+1
−1
Solar thermalyes
no
+1
−1
Windows framecongruent
not congruent
+1
−1
Openings for cell≤ 2
> 2
+1
−1
Cooling systemyes
no
+1
−1
Shutterscongruent
not congruent
+1
−1
Large archesno
yes
+1
−1
Heating systemyes
no
+1
−1
Pluvialscongruent
not congruent
+1
−1
Floors rigiditywood or steel
other
+1
−1
Vegetationyes
no
+1
−1