1. Introduction
There are several cases of river basins being shared by two or more countries. Some of these nations have had troubles, like India and Pakistan over the Indus River; Sudan, Egypt, and Ethiopia over the Nile; and Israel, Palestine, and Syria over the Jordan River [
1]. Therefore, the “Right to Watercourse” [
2] has been an issue of discontent among neighboring countries. Examples of points of contention include: Which country shall use what percentage of the water? Does the country of origin of the river have the complete right to the upstream water? Should the downstream country have an uninterrupted flow of water? There has never been an easy or rule-of-thumb solution for these kinds of issues and arguments because every river basin is unique. The United Nations (UN)’s International Court of Justice (previously called the Permanent Court for International Justice) passed resolutions to mitigate this problem. In 1997, the UN introduced the Convention on the Law of the Non-Navigational Uses of International Watercourses [
3].
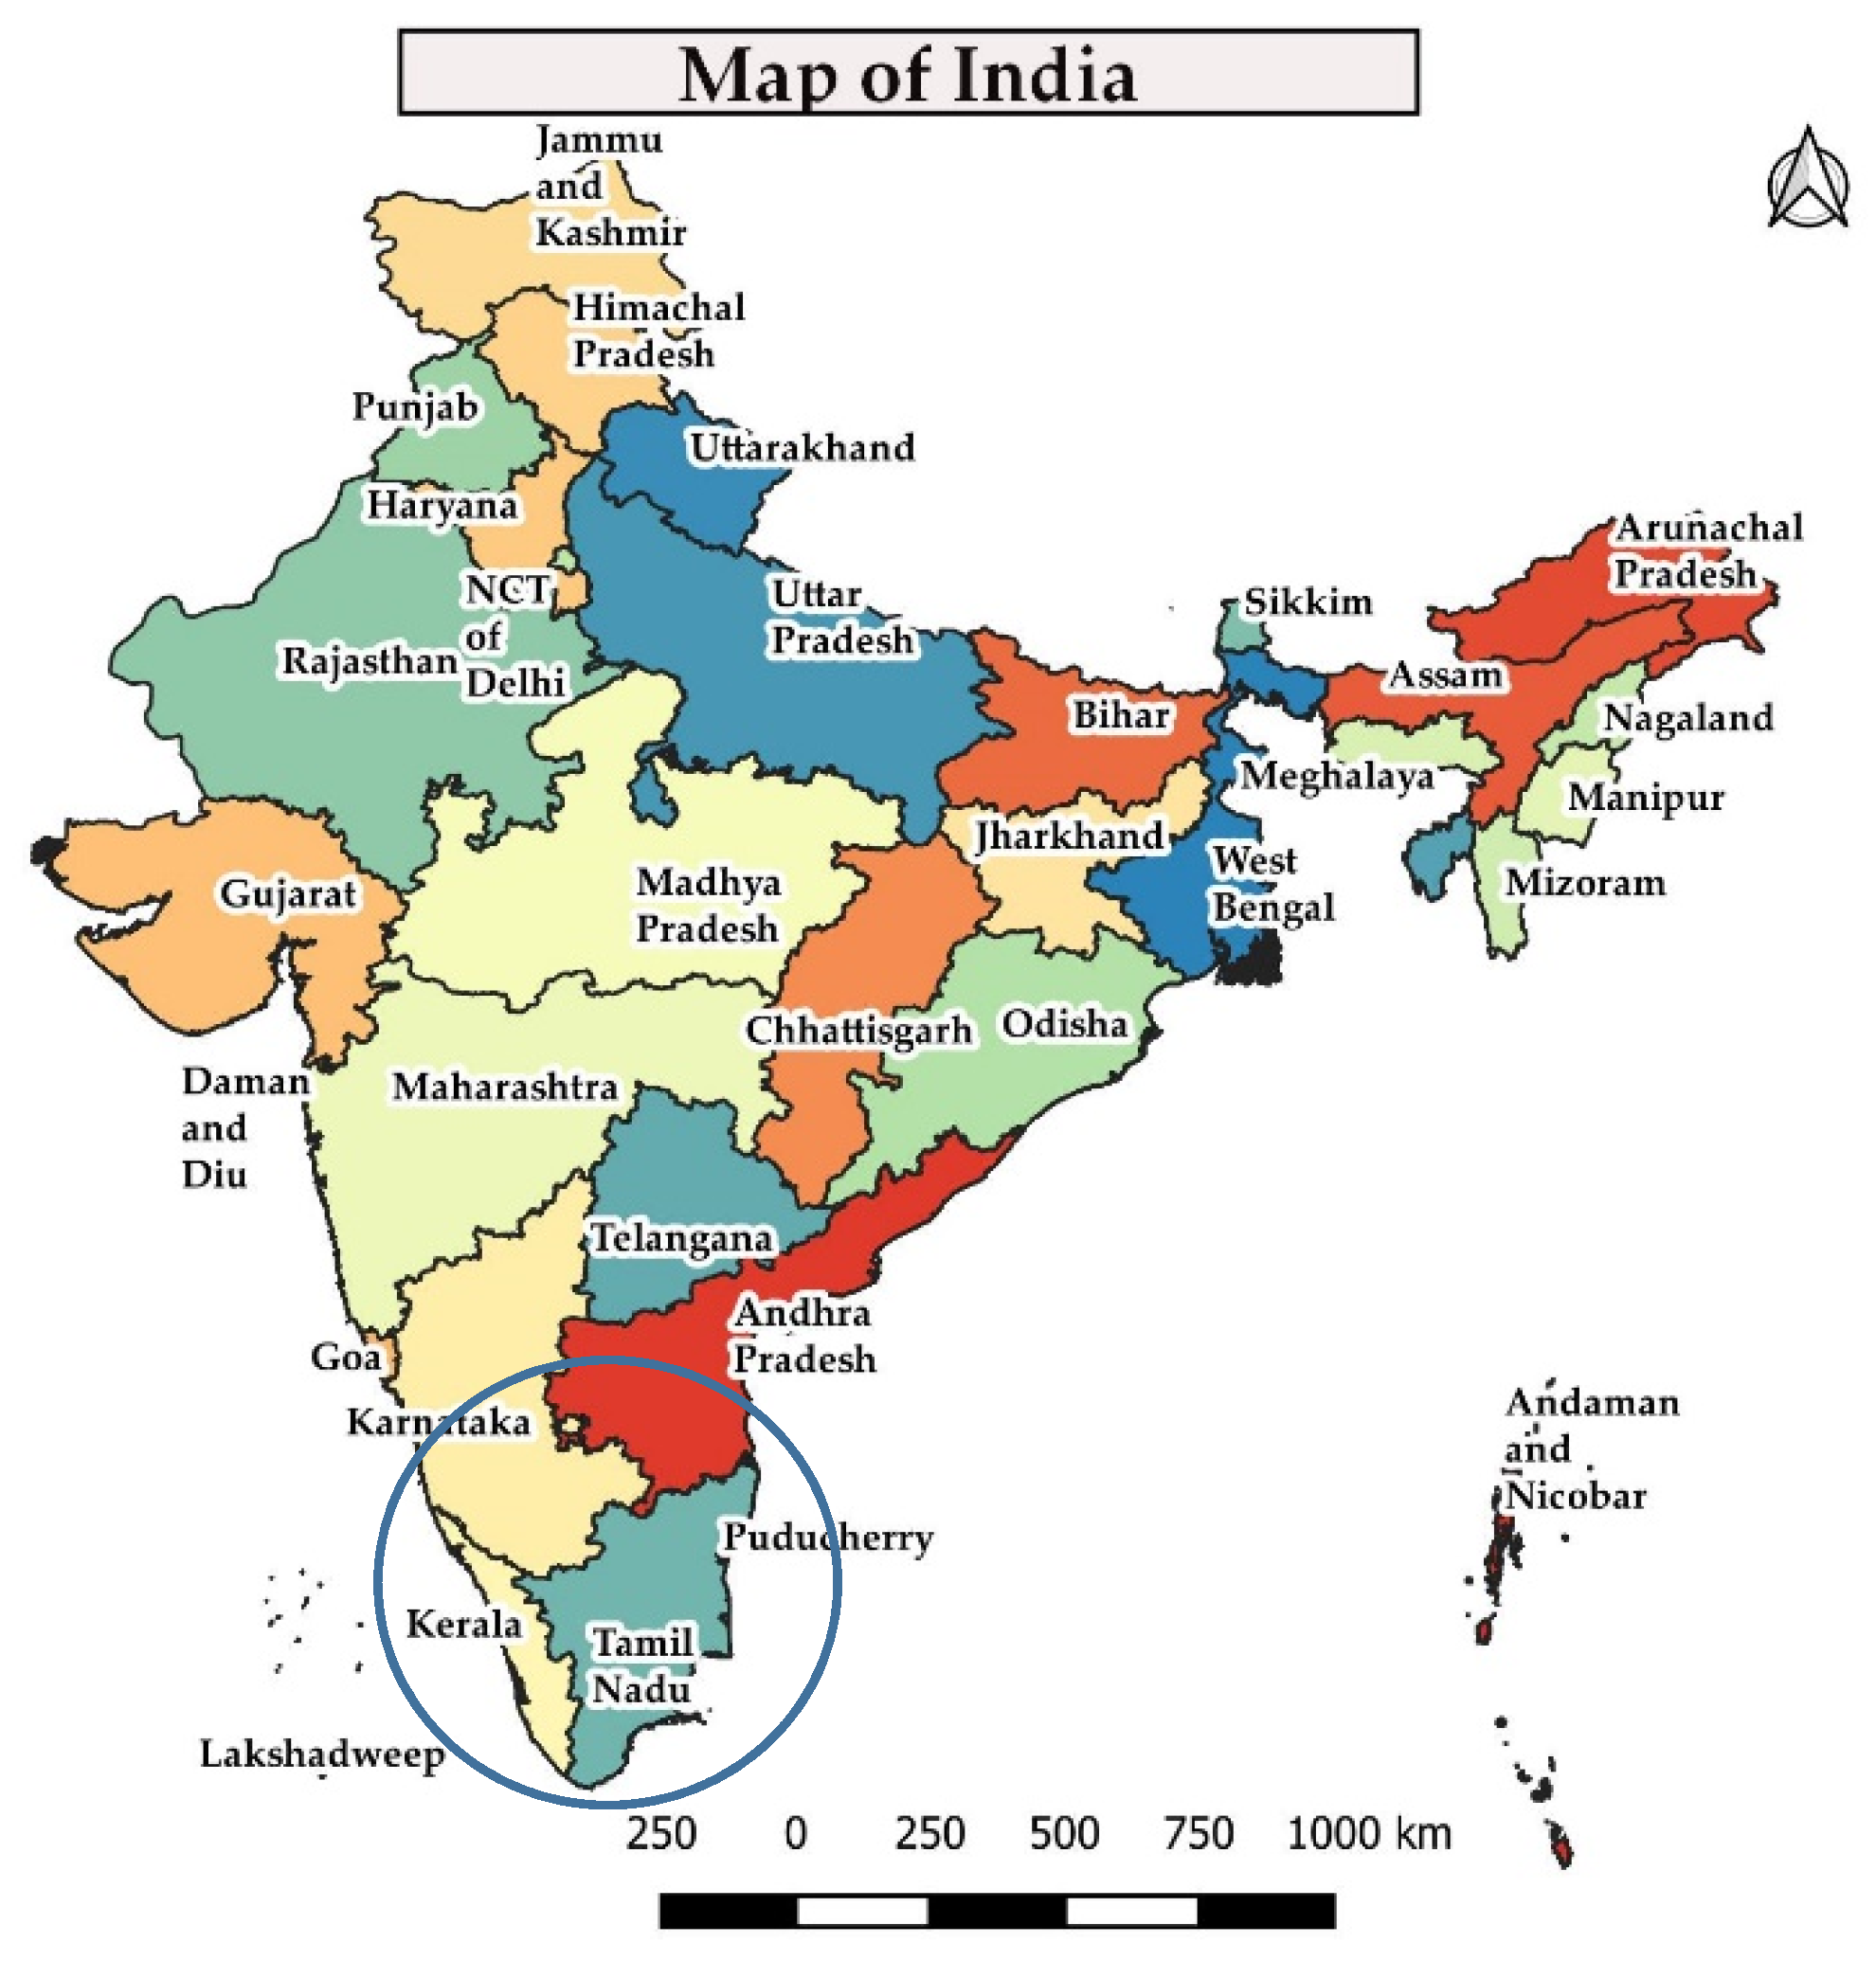
In the southern part of India, the Cauvery River has been in the midst of one such kind of dispute for more than a hundred years. Although this conflict is between two states within a country, the fundamental difference between the two governments is similar to the above. Cauvery is the fourth largest river in southern India, with a length of 802 km (kilometers). It originates in the Indian state of Karnataka and discharges into the Bay of Bengal, while flowing east through the state of Tamil Nadu, providing hydropower to significant regions of both states. The Cauvery River basin’s location is circled in the map of India shown in
Figure 1.
The Cauvery conflict is not limited to water sharing, but rather re-sharing of a very heavily utilized river [
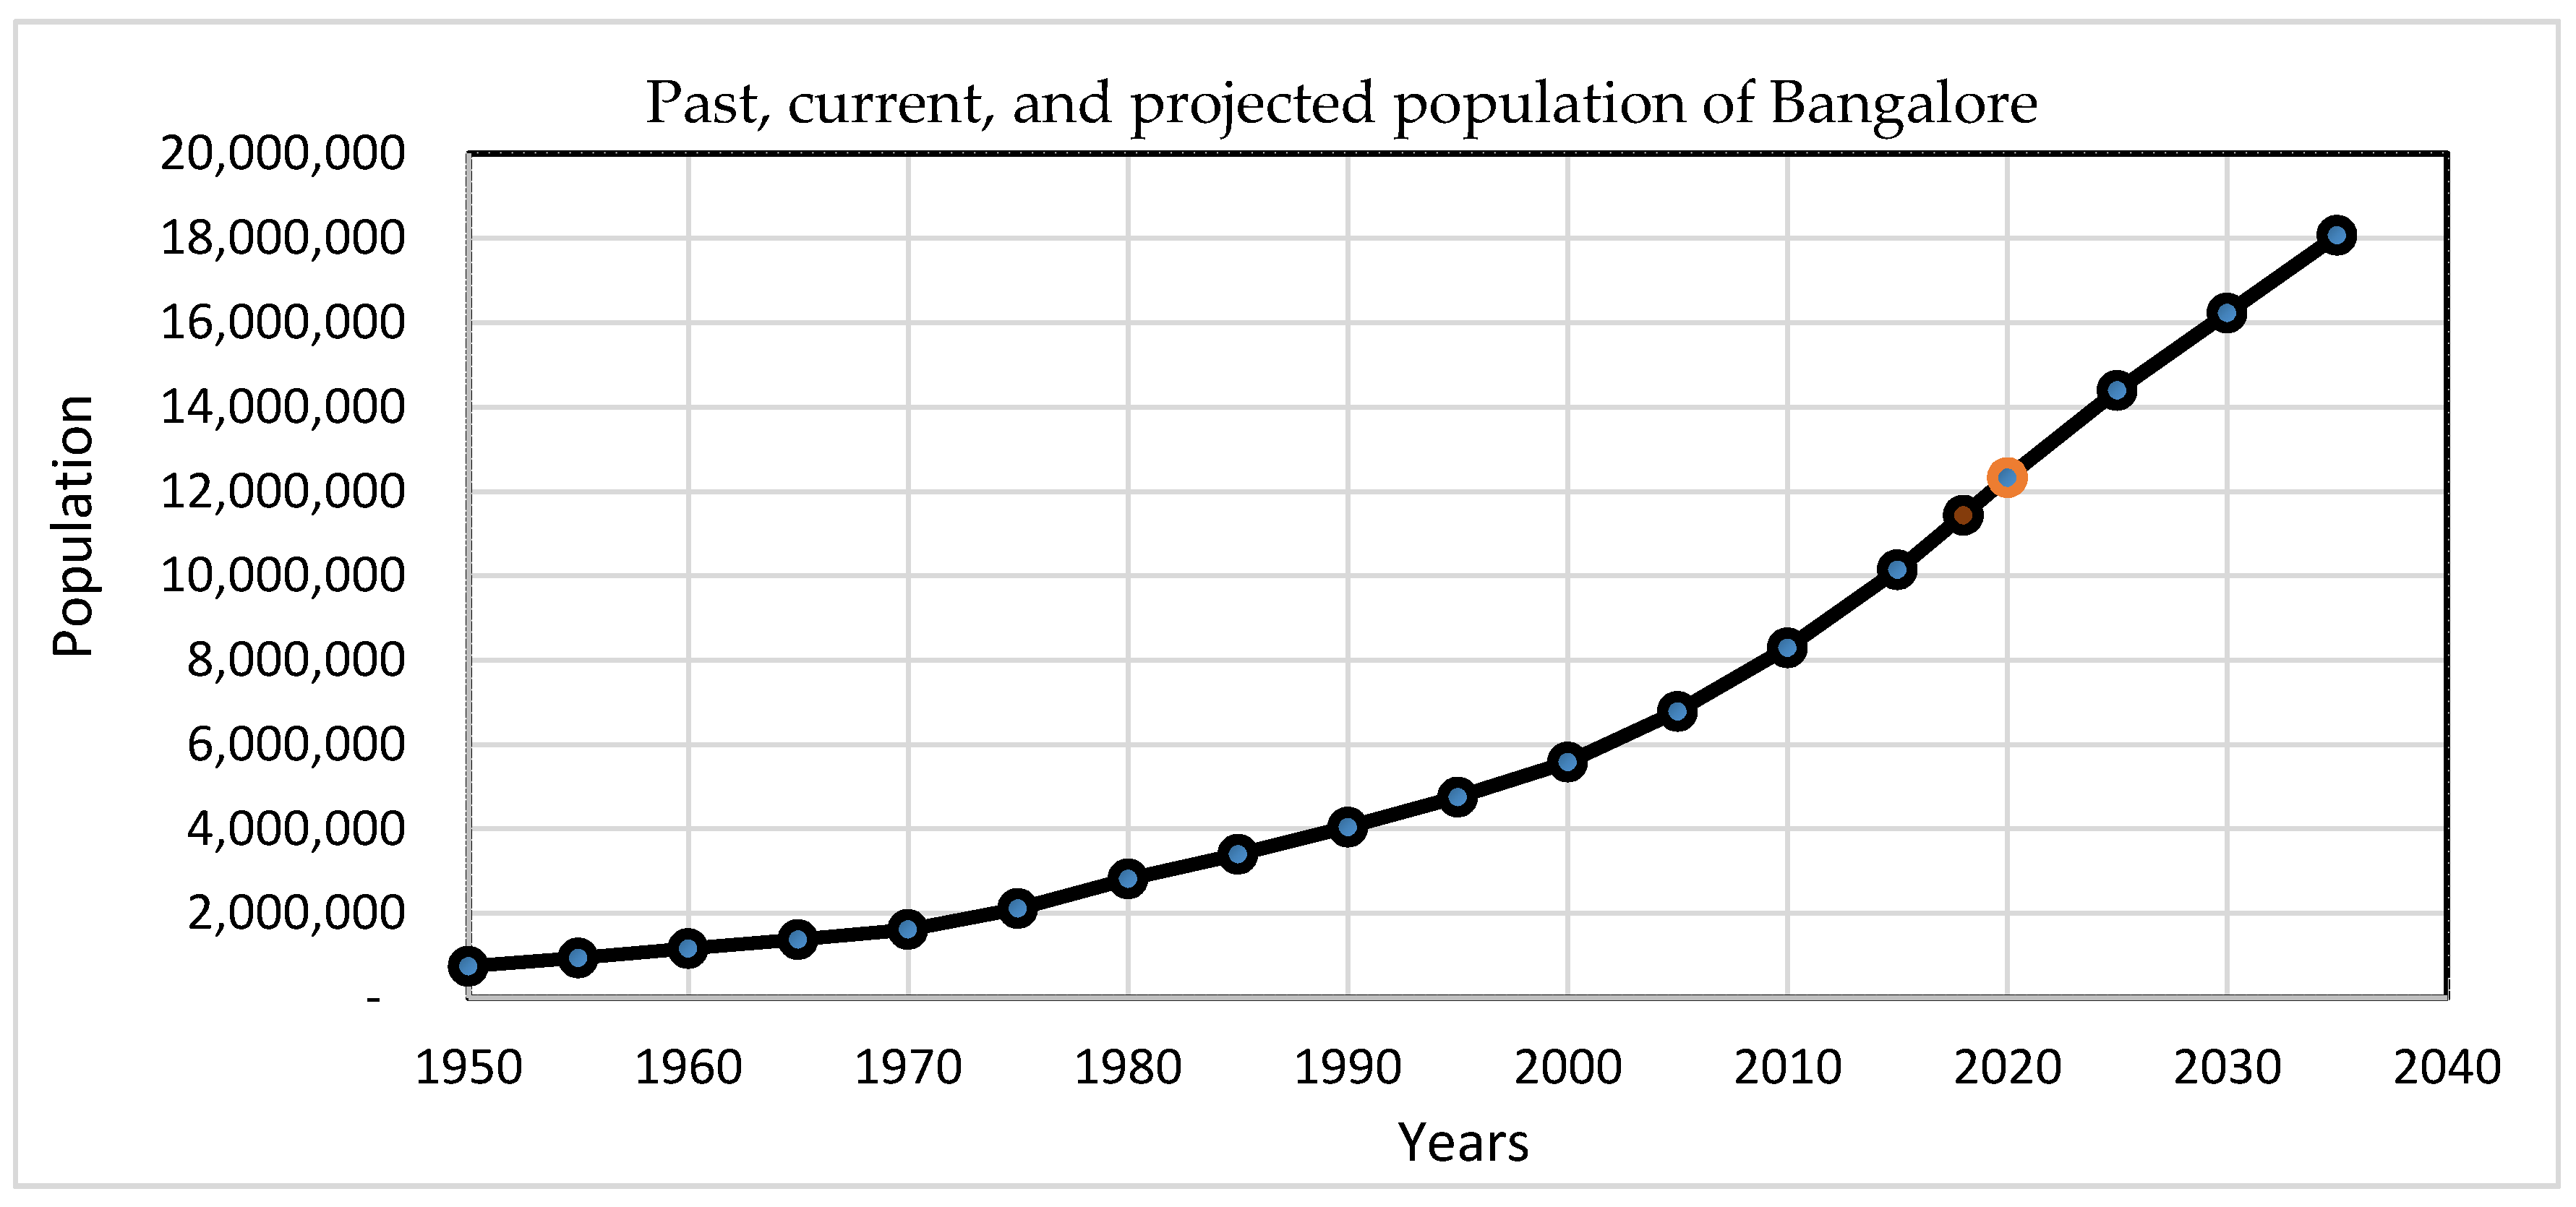
4]. The dispute exacerbated over the last twenty years as the population of the city of Bangalore (also called Bengaluru) in the state of Karnataka exploded [
5]. The water from the Cauvery River is used by Bangalore excessively, and the increasing population has greatly expanded the load on the natural resource—the population grew from 150,000 in 1950 to 11.5 million in 2018 (
Figure 2). On the other hand, major quantities of water flowing towards the state of Tamil Nadu has been historically used for irrigation [
6].
Paddy (rice) has been grown in the region for a very long time and is, therefore, the principal crop in the basin. Paddy is grown in the basin in three seasons: winter, monsoon, and summer, which explains the huge demand for water. Generally, paddy requires 2500 liters of water per kg of grain produced [
8].
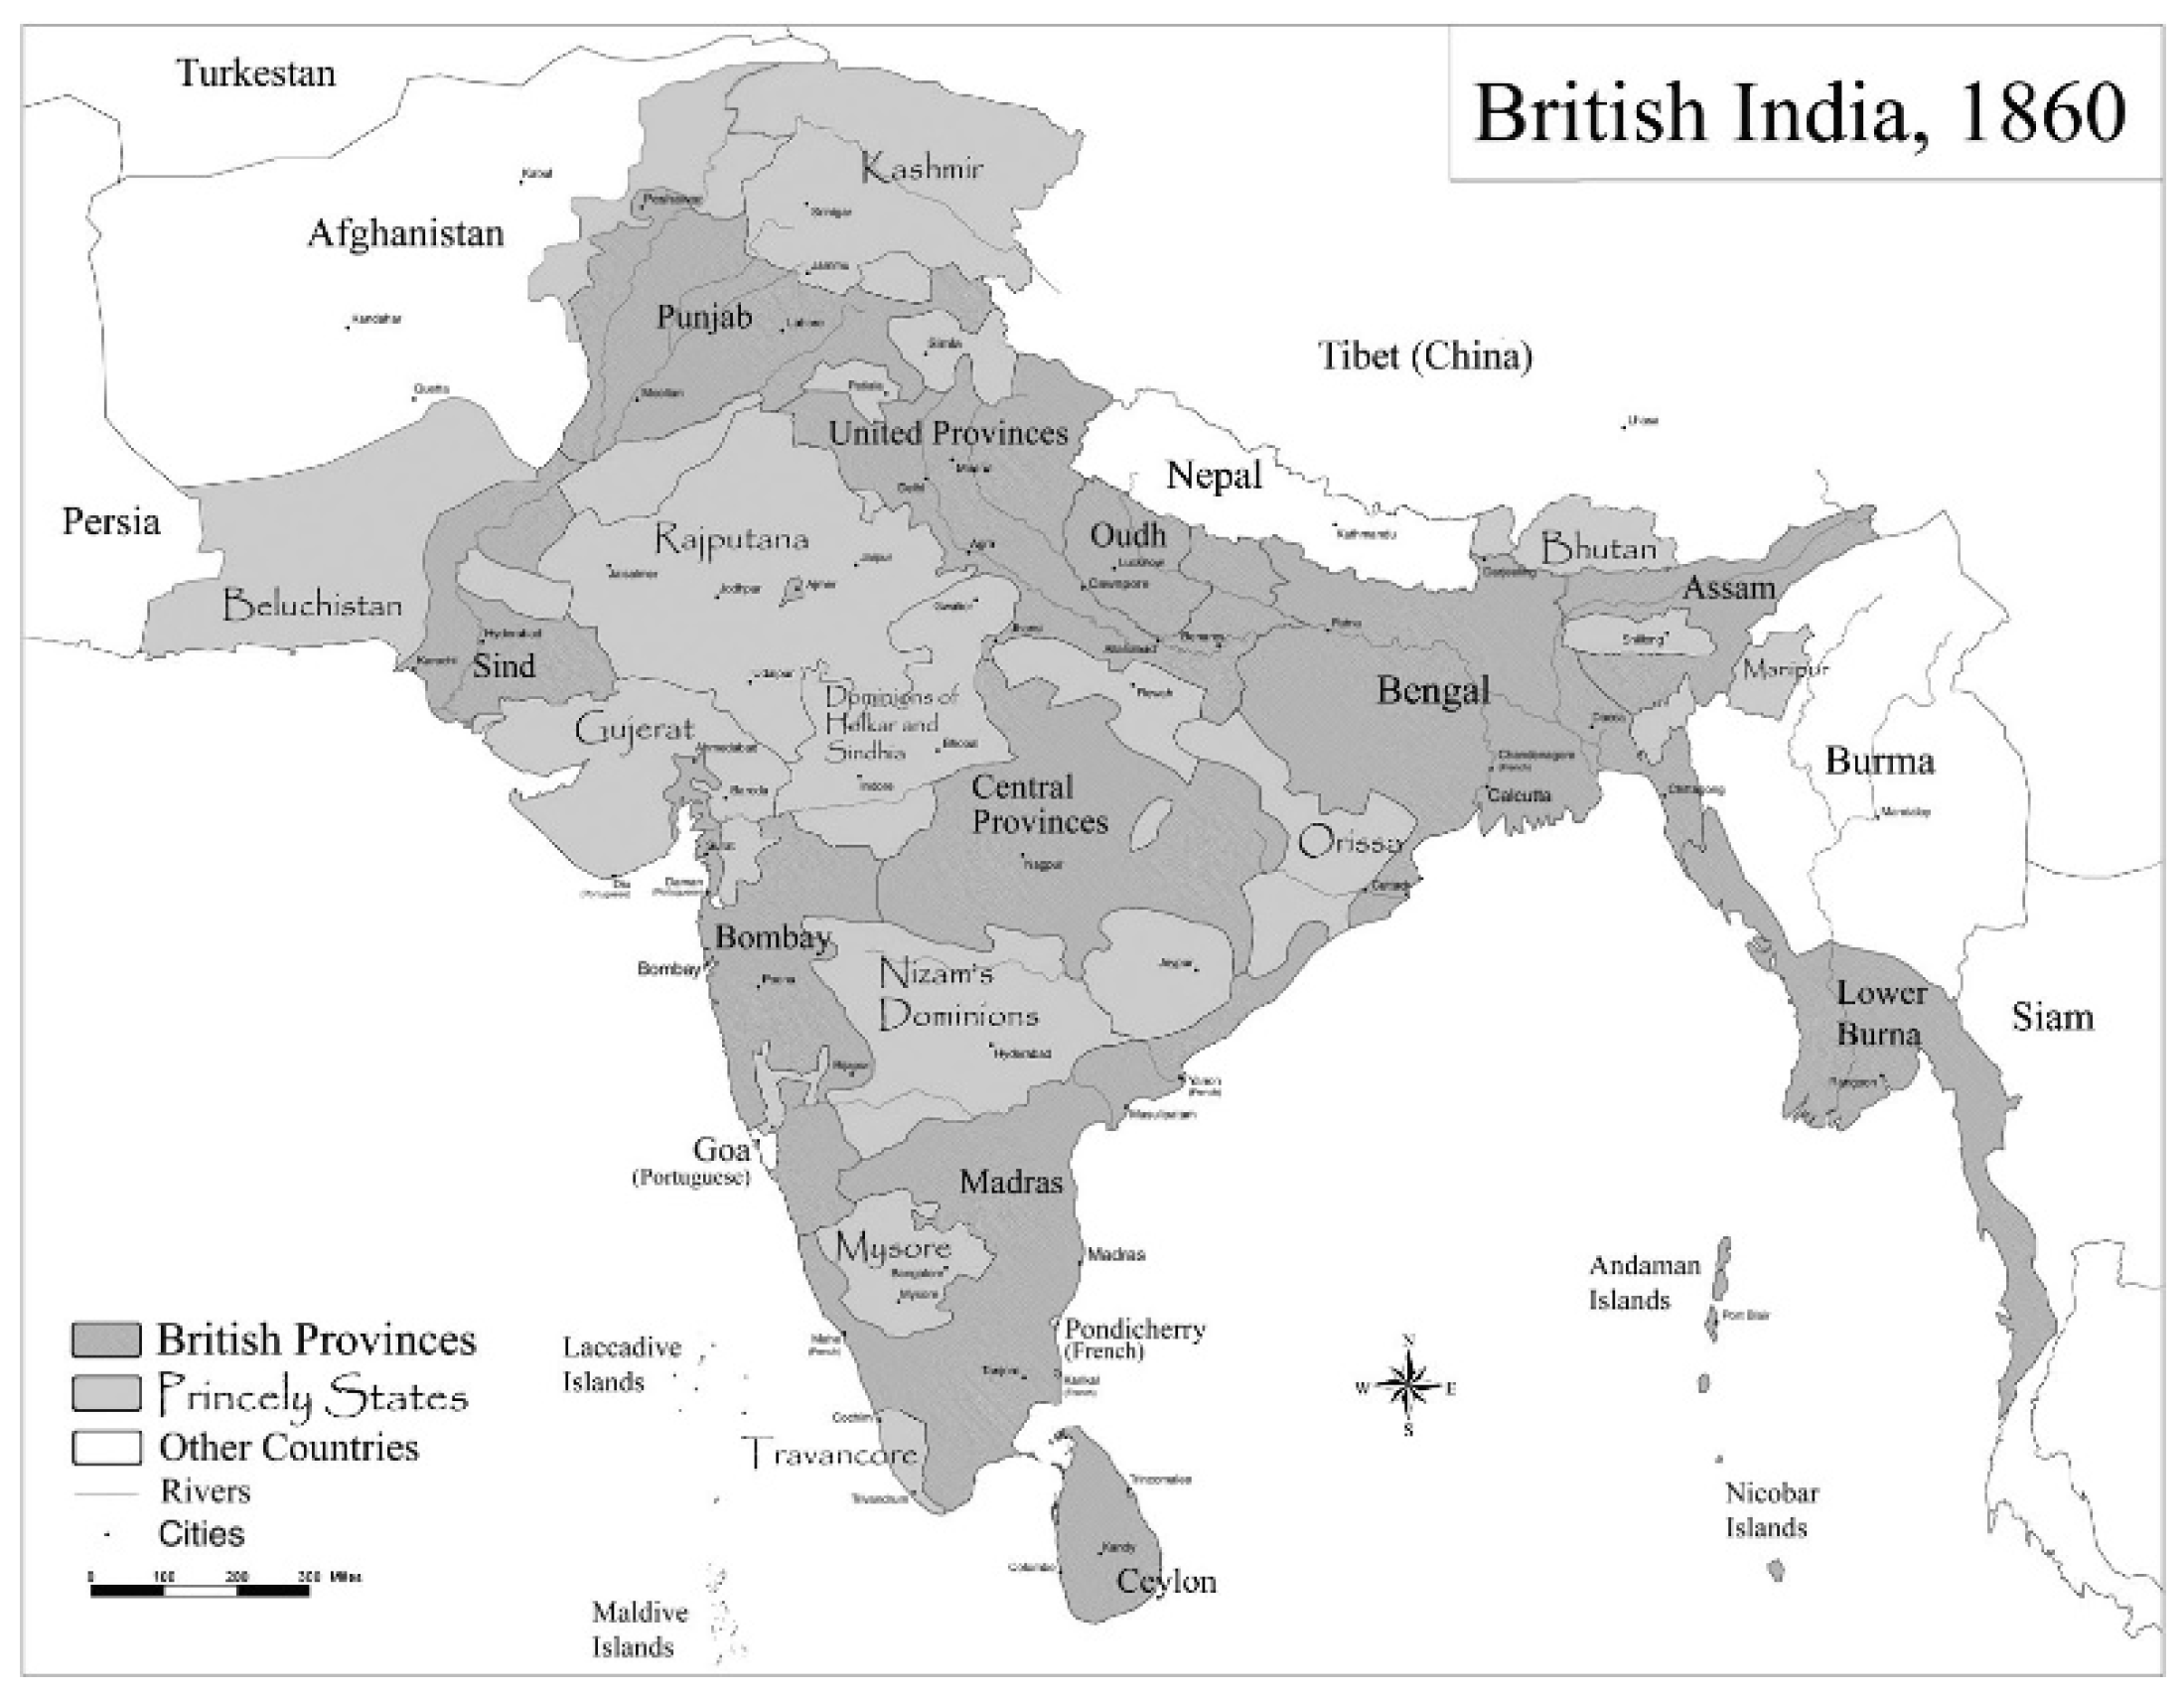
The conflict goes back to the early 19th century when the parties to the dispute were the Madras Presidency and the princely state of Mysore. Before India became independent in 1947, the British tried to resolve the issue, and after, the government of India continued as well. After independence, the state lines were re-drawn. More specifically, Madras Presidency was roughly divided into the states of Tamil Nadu, Kerala, Andhra Pradesh, and Pondicherry (which is a union territory and currently known as Puducherry). The princely state of Mysore was roughly divided into the state of Karnataka (see
Figure 1 and
Figure 3).
There have been many decisions taken to solve this issue, but as of 2019, none have been successful. The recent conflict dates back to 2013, when the water share of Tamil Nadu was reduced from a previous ruling in 2007. Tamil Nadu wants the previous ruling re-instated, as it claims that it is the riparian state and should receive more water. Karnataka’s share was increased in the latest decision, and it wants to keep it that way. A major drawback with these verdicts is that they are based on the current and historical seasons or years. Once passed, these verdicts and the share bestowed upon parties shall remain in function in perpetuity or until a new legal action is taken.
The Cauvery River conflict has been a bone of contention and a major issue in the politics of the region. This study is aimed at providing a more definitive rationale for the resolution of this dispute. It employs the Graph Model for Conflict Resolution (GMCR), an effective Decision Support System (DSS) tool used for solving conflicts. The GMCR can assess the strategic consequences of changes in the preferences of the decision-makers. It makes it easier for the analyst to perform a “what-if” analysis, which is the prime reason this methodology is being used. Also, it can act as a simulation tool for the decision-makers themselves to experiment in finding the best solution possible. The use of the GMCR is primarily in arbitration processes and negotiation. The negotiator can analyze both the parties without any bias and help reach a win-win position. On top of that, it sometimes can identify a possible outcome, which may feel highly unlikely, but is the most stable of all solutions. Hence, these DSSs are helpful to employ in real-world decision making.
In the following sections, the historical background of the conflict is presented, along with a historical timeline of the various events during the 120-year conflict. In
Section 3, details of the methodology are discussed, such as the decision-makers and the options available to them. In
Section 4, the results are discussed and explained.
Section 5 discusses the insights we obtained from the analysis.
2. Historical Background
India was a British colony for centuries, and most of its provinces were in direct control of the British. They controlled both Mysore (present-day Karnataka) and Madras (present-day Tamil Nadu) for a short period of time in the middle of the 19th century, as indicated in
Figure 3. During the British regime, numerous plans were drawn up for the utilization of the Cauvery waters by both states. However, the drought and subsequent famine in the mid-1870s put a hold on the implementation of these plans.
At the end of the 19th century, Mysore planned to revive various irrigation projects, but the Madras Presidency resisted any movement in that direction. However, the state of Mysore proposed to build a dam upstream, but the state of Madras did not agree, as it wanted to build a storage dam downstream. Mysore state approached the then British government, requesting them to intervene. As a result, a conference was held in 1890 with the objective of reaching an agreement. The potential arrangement allowed Mysore to deal with irrigation works and gave Madras practical security against any mishaps. The agreement was signed on 18 February 1892 [
10].
After the government’s intervention in 1892, it was decided that the state of Mysore would build the dam under reduced storage. However, during construction, the foundation was laid for a dam with a capacity of 41.5 TMC (thousand million cubic feet), which irked Mysore state. The issue, as per the rules of the agreement of 1892, was sent for arbitration [
11]. The arbitration started in 1913 and gave its verdict in favor of Mysore in 1914. However, Madras did not agree with the ruling and a new pact was signed in 1924 [
10]. This pact was to stay in place for 50 years. After Indian independence in 1947, the state boundaries changed, which brought Kerala and Pondicherry (Puducherry) into this dispute. Nonetheless, Tamil Nadu and Karnataka remain the biggest parties in the dispute. The timeline of the pre-independence era conflict is presented in
Table 1.
As the pact of 1924 was about to expire, a Cauvery Fact-Finding Committee (CFFC) was constituted in 1970. A series of inter-state meetings based on CFFC’s reports was held during 1973 and 1974 under the chairmanship of successive union ministers (i.e.,
Federal Ministers in India) for irrigation. At the final meetings of this sequence held on November 1974 and February 1975, a draft agreement that would act as a replacement for the 1924 agreement was discussed, but not adopted. In August 1976, however, a draft agreement prepared by the Union was accepted by all the states, and this fact was announced in the Parliament by the Minister for Agriculture. However, in the next meeting of the Chief Ministers, Tamil Nadu backed out of the agreement and Karnataka followed suit [
12].
The timeline of the post-independence era conflict is presented in
Table 2. Many inter-state meetings were called to amicably resolve the issue. However, these meetings, many being under the auspices of the Union Government, went on in vain. Farmer groups were one of the most affected strata of society. Due to non-agreement between the states, the farmers from both the states suffered heavily. Therefore, when the above issue could not be resolved, in 1986, the Farmers’ Association of Tanjavur approached the Supreme Court, seeking a direction to the Central Government to constitute a tribunal for adjudication of the disputes [
13]. The tribunal, if set up under the Interstate Water Dispute Act of 1956, would possess the powers to make decisions but would not be able to enforce them. During the pendency of this suit, negotiations were carried on for four more years fruitlessly. In the last inter-state meeting held on April 1990, the principal contestants, consisting Tamil Nadu and Karnataka, agreed to disagree.
A Cauvery tribunal was constituted based on the directives of the Supreme Court of India in order to preside over such matters and handle them swiftly and efficiently. This tribunal gave its order in 1991, favoring Tamil Nadu and enjoining upon Karnataka to release waters to the Mettur Reservoir in Tamil Nadu following a stipulated release pattern. Karnataka was also directed not to increase its area of irrigation utilizing Cauvery waters. Karnataka’s reaction to this was extremely adverse. It passed an ordinance against this order, thereby prompting the Supreme Court to intervene. The court ruled in favor of Tamil Nadu, following which there were demonstrations in both states. From 1992 to early 1995, the Cauvery Basin was blessed with good monsoon rains, and tranquility prevailed in the region. By the middle of 1995, however, the basin faced a lean monsoon, and this paved the way for a further period of tension and anxiety. In December 1995, Tamil Nadu approached the Supreme Court, seeking an order for 30 TMC (thousand million cubic feet) to be released by Karnataka from its reservoirs. The court passed it on to the Tribunal for an appropriate decision, and the latter ordered 11 TMC to be released by Karnataka. The State of Karnataka pleaded helplessness, as its reservoirs were short of enough water to cater to the needs of its own farmers. Tamil Nadu again approached the Supreme Court, informing it of the seriousness of the situation [
11]. The Supreme Court, to expedite matters, thought that the Prime Minister should intervene and bring about a compromise [
12].
Accordingly, a Conference of the Chief Ministers of all the party states and of the Union Territory of Pondicherry (Puducherry), along with other political leaders, was convened by the Prime Minister on 30 December 1995. The Prime Minister took a keen interest in the matter, and, based on his meetings with the Chief Ministers of Tamil Nadu and Karnataka, gave an Interim Order that Karnataka should make an immediate release of 6 TMC to save the standing crops in Tamil Nadu. Karnataka abided by the Prime Minister’s decision.
In 1997, the Government of India constituted the Cauvery River Authority (CRA) to implement the Interim Order. The CRA had an ambiguous amount of power, as it could take over the functioning of the dams if the Interim Order was not being honored. However, Karnataka opposed the establishment of CRA, as it felt that the Interim Order had no scientific basis and was internally flawed. The Federal Government, taking into consideration the state’s objections, made several modifications to the powers of the CRA and came up with a new arrangement. Under this new arrangement, the Government established two new bodies: the Cauvery River Authority, and the Cauvery Monitoring Committee. The Cauvery River Authority would consist of the Prime Minister and include the Chief Ministers of the four states consisting of Karnataka, Tamil Nadu, Pondicherry (Puducherry), and Kerala. The Cauvery Monitoring Committee, on the other hand, was an expert body that consisted of engineers, technocrats, and other officers who would take stock of the ‘ground realities’ and report to the government.
The period following the 2002 lean monsoon [
14] was turbulent for both the states; it was almost a recap of the 1995 situation. However, at that time, the demonstrations were severe and there was even a temporary restriction on public transport between the two states. The animosity prevailed throughout the year. In the following years, there were sufficient rains and hence no major issue was reported [
15]. After much deliberation, the CWDT delivered a verdict in 2007 over the sharing of water between the states tweaking the 1997 verdict, which was again disagreed upon by the states of Tamil Nadu and Karnataka. The matter was again placed under arbitration and the Supreme Court of India instructed the state of Karnataka to release the water, as instructed by the Supreme Court yearly thereafter. Droughts in 2012 did not help the cause of the then Prime Minister, whose request to Karnataka to release water for Tamil Nadu was rejected by the state. This prompted Tamil Nadu to act against Karnataka, i.e., take Karnataka to court because it was in contempt of the apex court’s decision. There were protests against the rulings in Tamil Nadu and Karnataka, which requested a quick verdict on the matter, which was left in limbo after the 2007 verdict.
Finally, on 20 February 2013, based on the directions of the Supreme Court, the Indian Government announced the final award/agreement of the Cauvery Water Disputes Tribunal (CWDT) [
16] on sharing the waters of the Cauvery system among the basin States of Karnataka, Tamil Nadu, Kerala, and the Union Territory of Pondicherry (Puducherry). In this award, the share for Tamil Nadu was reduced (from 419 thousand million cubic feet (TMC) to 404 TMC) from the 2007 verdict, and that of Karnataka was increased (270 TMC to 285 TMC). This verdict has probably inflicted more damage towards an already complicated conflict. In mid-015, Tamil Nadu again accused Karnataka of not releasing the required quantity of water as was established by the tribunal [
17]. Therefore, to further increase the powers of the executive branch of the tribunal, on 10 May 2013, the Supreme Court issued an interim directive to the Government of India to establish a temporary Supervisory Committee to implement the CWDT order till the constitution of the “Cauvery Management Board”. In early 2019, this Cauvery Management Board was constituted, which will be a permanent committee overseeing all the matters related to the Cauvery River dispute. The decision-makers and their options are introduced in detail in the next section.
3. Methodology
The Graph Model for Conflict Resolution (GMCR) is used to analyze a conflict at a specific point in time [
18,
19]. GMCR has been used in the past for water-related conflicts, like the Jordan river conflict [
20], and general environmental conflicts [
21]. For this project, the time right after the 2013 verdict of the Supreme Court is modeled and analyzed. In this verdict, the Supreme Court revised the 2007 CWDT ruling to increase the water retention for Karnataka and reduce the water to be released for the state of Tamil Nadu. To perform an analysis with GMCR, it is important to profile the decision-makers and their options, which is summarized below in
Section 3.1. In
Section 3.2, we discuss the preferences of the decision-makers, which is important as it helps identify options that will be feasible for mutual agreement between the disputing parties. In
Section 3.3, we examine the solutions identified by GMCR and isolate those that are stable. However, there is uncertainty around whether the preferences of the parties were summarized accurately in
Section 3.2. For this reason, we also employ GMCR with fuzzy preferences in
Section 3.4 to explore any changes to our set of stable solutions.
3.1. Decision-Makers and Options
The Cauvery water dispute has many interested parties due to the river’s multifaceted uses. The decision-makers are as follows: Karnataka state, Tamil Nadu state, Kerala state, Pondicherry (Puducherry) union territory (UT), Central government, Cauvery Water Dispute Tribunal (CWDT), Cauvery River Authority (CRA), Cauvery Monitoring Committee (CMC), Supreme Court of India, and Cauvery Management Board. The integrated development theme attracted the interests of non-governmental organizations (NGOs) and environmental protection agencies, which were not present during the establishment of the CWDT [
22]. Therefore, such agencies along with the people from urban and rural areas automatically become stakeholders, rather than actual decision-makers given that they do not have any decision-making authority. The farming community, especially the Farmers’ Association of
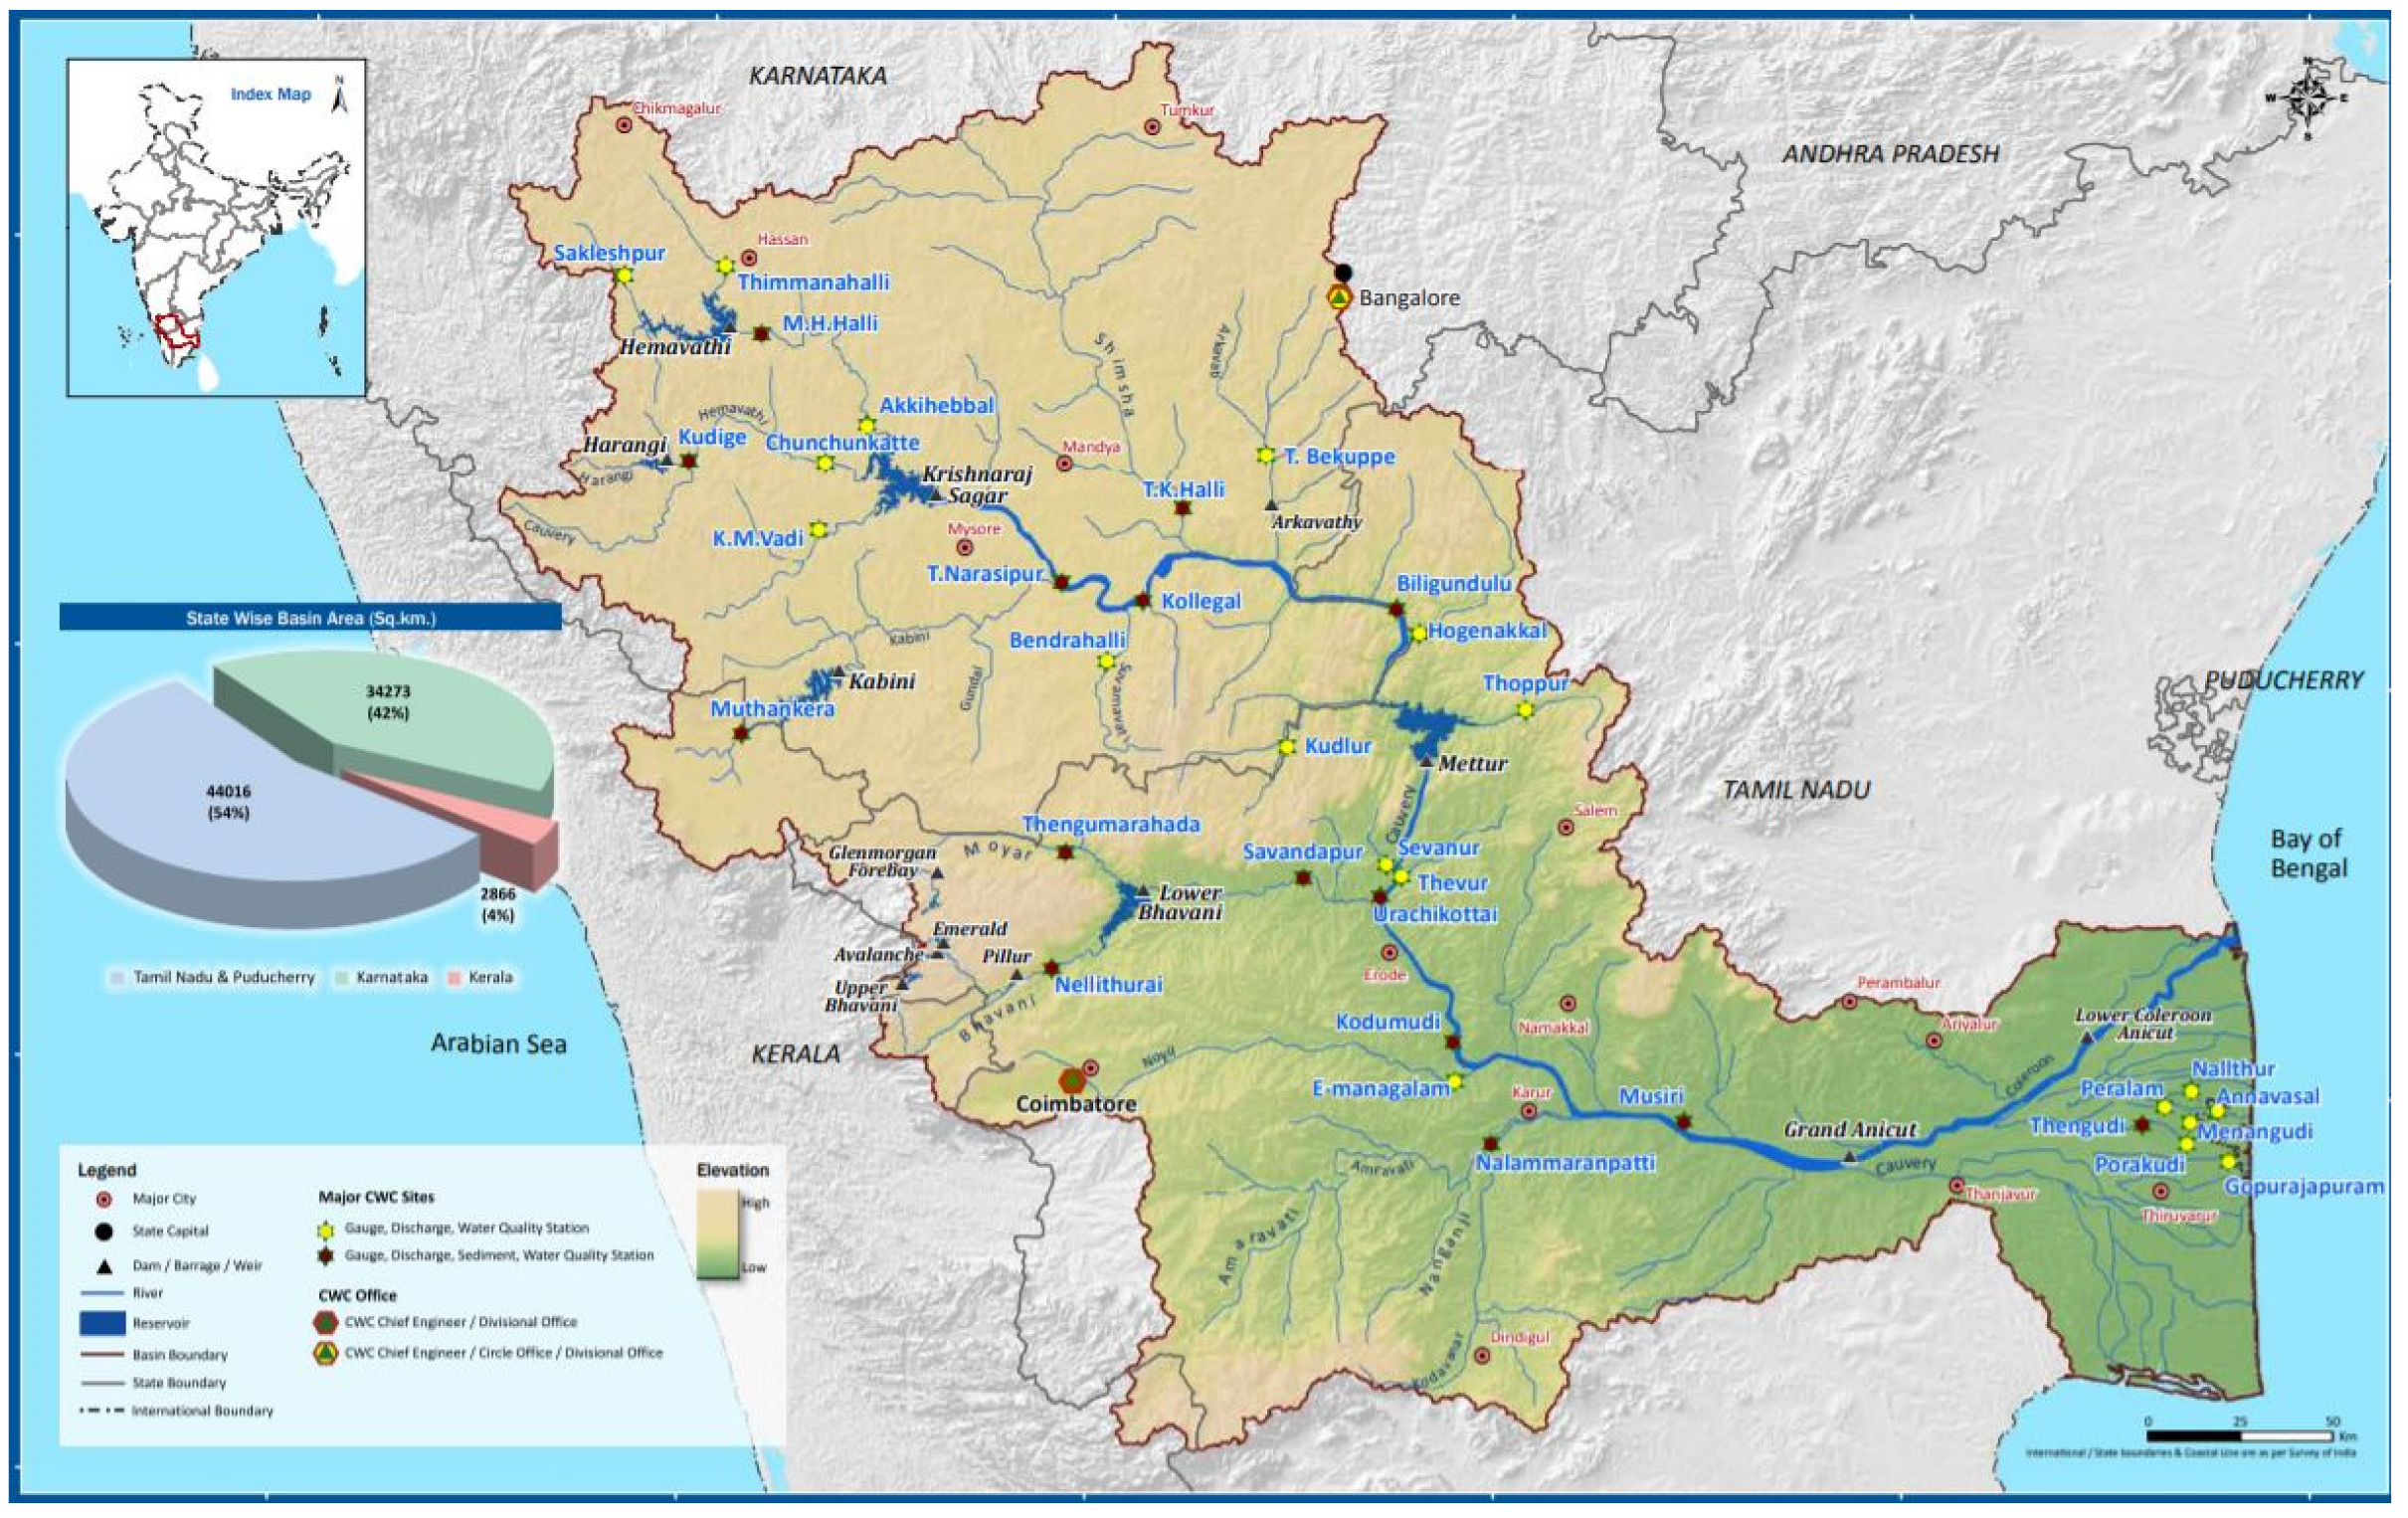
Thanjavur (Tamil Nadu) is very active, as the allocation of water affects them the most. The green eastern part of
Figure 4 is the land irrigated using the water from the Cauvery River.
As the central governing bodies are all intertwined and do not generally have conflicting interests, they will be represented by the moniker Supreme Court (SC) hereafter. The rulings from the governing bodies as of 2013 can be classified as win-lose decisions [
24]. Ideally, the SC should strive for a win-win situation and GMCR can be a viable tool in determining how to achieve that.
Table 3 summarizes the water-sharing quantities among the states in the region for both the 2007 and 2013 verdicts. These partitions are based on the annual flow/discharge of the river at the Mettur Dam, which is the point of division of water among the states of Karnataka and Tamil Nadu.
Some readers may wonder whether the partitions decided by the SC in
Table 3 account for long-term factors that might affect future water demand, like urbanization. The methodology of GMCR is to look at a conflict at a certain point in time rather than to put new options on the table. In this study, we look at the current stalemate between Karnataka and Tamil Nadu. Possible influences of future developments on water demand and water availability that are currently considered tangential to the conflict, such as urbanization and climate change, are therefore also tangential to the scope of this conflict analysis. The data used primarily comprise what the literature tells us about the positions of the parties in the conflict and the nature of their governance. The purpose of this study is to understand the present-day conflict to investigate any possible ways the governments might move toward productive resolution.
Due to the growing of paddy in three crops, water use in Tamil Nadu has been deemed wasteful [
4,
25]. Therefore, the SC has an option of crop diversification [
26] as one of the possible courses of action. In the majority of developing countries, including India, water pricing is a difficult issue to tackle. As electricity is subsidized for farmers [
27], the pumping of water using bore wells is common. Effectively, the farmers pay for the pumping costs, and not the value of the water itself [
28]. The SC has the option of including the value of water in the water pricing clause. This should help the farmers and other users of this water to comprehend the real importance of the resource. Since there are no fool-proof methods of predicting the climate and rainfall thereof, the water division should be founded on a relative (pro-rata basis), rather than an absolute one. Utilization of technologically advanced methodology in farming is also outlined by experts in the field [
29]. However, it is important that the options suggested are feasible and can be implemented in a short period of time due to political and administrative issues (the government is in power for only five years) and the increasing deficiency of water availability in the region. Therefore, the options mentioned in
Table 4 include such options, which are not considered in this study.
Since the last ruling was not in favor of Tamil Nadu (TN), as its share of water was reduced, this state would appeal to the SC to modify the ruling. TN will take any option that can make sure that it receives more water than it is currently receiving. Therefore, accepting the crop-diversification clause will cause an enforcement challenge. However, it should guarantee the supply of appropriate quantities of water for those crops. Pro-rata division of water would mean that TN will not have to appeal during every low-monsoon year. Because the pricing of water will be enforced for both the states, TN should be able to accept this option. Karnataka will push to keep the existing ruling, as it is essentially a “win” situation for it. Pricing of water clause is going to help the state generate revenue. The pro-rata division would mean that a fixed amount of water will not have to be released during lean monsoons. Also, the conflict will arise only if TN appeals to the SC to modify the existing ruling by reinstating the previous ruling, which gave TN a higher share of water.
Karnataka has always maintained that since Tamil Nadu receives two monsoons, i.e., North-east (October–December) and South-west (June–September), it should not be given as much water as it demands [
30]. However, Tamil Nadu maintains that the water is required for agriculture and repeatedly cites the original CWDT decision. Regional scholars like Iyer (2003) feel that the treaty is an important source of information, but today’s problems may not be solved by citing the old rulings. Social groups like “the Cauvery Family” are a step towards an integrated approach for solving complex issues. The Cauvery family consists of farmers from both Karnataka and Tamil Nadu. Iyer (2003), along with his colleagues, have engaged the farmers and conducted workshops on both sides of the state borders, thereby clarifying the expectations and struggles of the farmers from either side.
3.2. Discussion on Decision-Makers’ Preferences
The preferences of the state governments are straightforward: try to secure as much water as possible for their respective states. The Tamil Nadu government published an action plan for the state in 2015 [
31]. This plan was prepared in consultation with experts from Germany to assess the current water use situation and probable future requirements.
The majority fraction of demand is for the irrigation sector, i.e., 76% in 2011. As per the directives of the SC, the agricultural area in Tamil Nadu is not to be increased; hence, the demand is kept the same for the 2020 and 2045 projections [
31]. By the year 2045, the state of Tamil Nadu is assumed to achieve the highest irrigation efficiency. These are optimistic assumptions on the part of the SC, as the simple decision of not increasing the agricultural area in Tamil Nadu does not consider possible economic development or population growth in the next 25 years. The side-effects of such growth on water demand could continue to increase, even with a stable agricultural area.
The above-referenced report also mentions the issue of irrigation efficiency in the state, which stands at an abysmal 40%, compared to 75% in Israel. The government has organized several awareness programs. For instance, the farmers in the Tirupur region have increased their efficiency by using drip-irrigation methods [
32]. The Karnataka government also prepared and submitted a climate action plan in 2011, with a focus on Bangalore [
33]. Twenty percent of the state of Karnataka is covered by the Cauvery River Basin. A reduction in the rainfall by even ten percent can affect crops devastatingly. The average water yield in the basin will reduce from a simulated baseline scenario flow of 7000 cubic meters per second (cumecs) today to 6700 cumecs in 2030. This reduction is of great importance for the farmers of the state. Therefore, the preference for Karnataka should be to keep the new ruling as it is without modification.
After careful consideration of the options available to the decision-makers (
Table 4), option number 2 of “pro-rata division of water” was scrapped in a 2013 decision by the CWDT. The decision mentioned that the division of water on a percentage basis will cause another complication to the already complex conflict. Hence, the absolute division of water was kept as the basis of division. Setting aside that absolute division is unlikely to be a wise approach to water sharing for a prolonged amount of time, especially for an economically developing country and under a changing climate, it is one of the options that characterizes the present-day conflict. For these reasons, in this analysis, option number 2 was removed and the remaining options were renumbered accordingly.
With eight options across all the decision-makers, the number of possible states would be 2
8 (256). We use the formula of 2
n because each option can either be accepted or rejected. Out of these states, many of them are mutually exclusive and hence infeasible. For example, TN cannot support modification of the current ruling and get the previous sentence re-instated together. Similarly, the Karnataka government cannot support the existing ruling and accept modifications. The actual feasible number of states were calculated using the GMCR+ software [
34,
35]. Two types of states are removed from the total possible outcomes, namely mutually exhaustive and generally infeasible conditions.
Table 5 represents the modified decision-makers’ options.
The preferences of both states have been devised based on climate action reports they each developed. TN’s primary preference is to get the previous ruling re-instated so that it can receive more water than Karnataka on paper. Tamil Nadu has suffered from its insistence of pushing for growing paddy crops because the yield is abysmal; however, the profits are high.
Tamil Nadu [
31] included the pricing of domestic use of water in its policy development interventions. As mentioned above, farmers’ use of water for irrigation is highly subsidized, and the pricing of water there can also be included in the policy. In this situation, Tamil Nadu will keep receiving the water as intended, and it will part with a portion of its profit to Karnataka. Karnataka should use that money to invest in its own water infrastructure system improvement. This divisional method is based on the Coase Theorem [
36,
37], which is an economic and legal theorem that asserts that if a conflict arises over property rights, parties will tend to settle on the efficient set of inputs and outputs, given that the property can be divided, defined, and the property rights are defendable. This improvement will lead to more efficient use of water and hence reduce the water requirements of the state. A basic cost-benefit analysis carried out in the Macquarie River in New South Wales, Australia, can be used as a reference [
38]. Also, Karnataka recently received a loan of 135 million dollars from the Asian Development Bank (ADB) to improve its water resource infrastructure [
39]. Instead of taking the loan from an external institution, it is more viable to use the money available within the country. As Karnataka and Tamil Nadu will benefit from it, the option of pricing agriculture water is formed.
Ghosh et al. (2018) wrote an advisory paper advising the Supreme Court of India to make the three modifications mentioned in
Table 4. The Supreme Court, in general, will have its priorities the same for all the options as long as the two states can find a solution among themselves. However, whenever a plea against a court ruling is lodged, due process must be carried out. It took the Supreme Court nearly seven years to pass the verdict in 2007 after the CMA and CMC were established in 2000. Due to the demographic expanse of the country, the hydrological and hydraulic investigations, calculations of water demands, environmental flows, and similar exercises, a fair amount of human resources were utilized [
40]. Also, bringing together all the officials from various levels of government and the courts to reach an all-inclusive verdict is a logistical challenge. Therefore, if another plea is filed against the Supreme Court, the CMC and CMA will have to work again, and this may take another seven years to reach a potential verdict, thereby hampering the growth of the region. Hence, the Supreme Court would prefer the current ruling, but will intervene if a modification in the previous ruling is requested and they see merit in it.
3.3. Stability Analysis Using Graph Model for Conflict Resolution (GMCR)
For stability analysis, the preference matrix of all three decision-makers (DM) is analyzed, individually and then together. Every preference state value has a payoff value for the decision-maker, with the highest payoff being for the most preferred state. The conflict model will now be subjected to stability analysis. If a state is rational for the decision-maker, it would mean that there are no unilateral improvements from that state for the decision-maker. It is a stable state if moving to any of the unilateral improvement (UI) states will cause the decision-maker to be rendered worse-off. A UI is defined as a movement by a decision-maker towards a state, which is more favorable than the current state. A state is unstable if moving from the current state to a UI can improve the decision-maker’s position. The rational and stable states for all the decision-makers are then analyzed to find common states that form the solution concepts.
Each state is analyzed for stability for each DM using each solution concept: Nash stable (R), General Meta-Rational (GMR), Symmetric Meta-Rational (SMR), and Sequential stable (SEQ). An equilibrium is said to be Nash stable if moving to a different state brings no benefit to the focal decision-maker. If the focal decision-maker’s (DM) UI can be sanctioned (i.e., blocked) by the opponent decision-maker’s movement in such a way that the focal DM will be worse off, then the current state is GMR stable for the focal DM. In SMR, the focal DM can counter-respond. If the focal DM’s UI is sanctioned by the opponent DM in such a way that the focal DM is in a worse-off position in both that state and the counter-responded state, the current state is said to be SMR stable. If the focal DM’s UI can be sanctioned by the opponent DM’s UI in such a way that the focal DM will be worse off, then the current state is SEQ stable for the focal DM. These four solution concepts are used to identify the different states reached in the Cauvery river conflict.
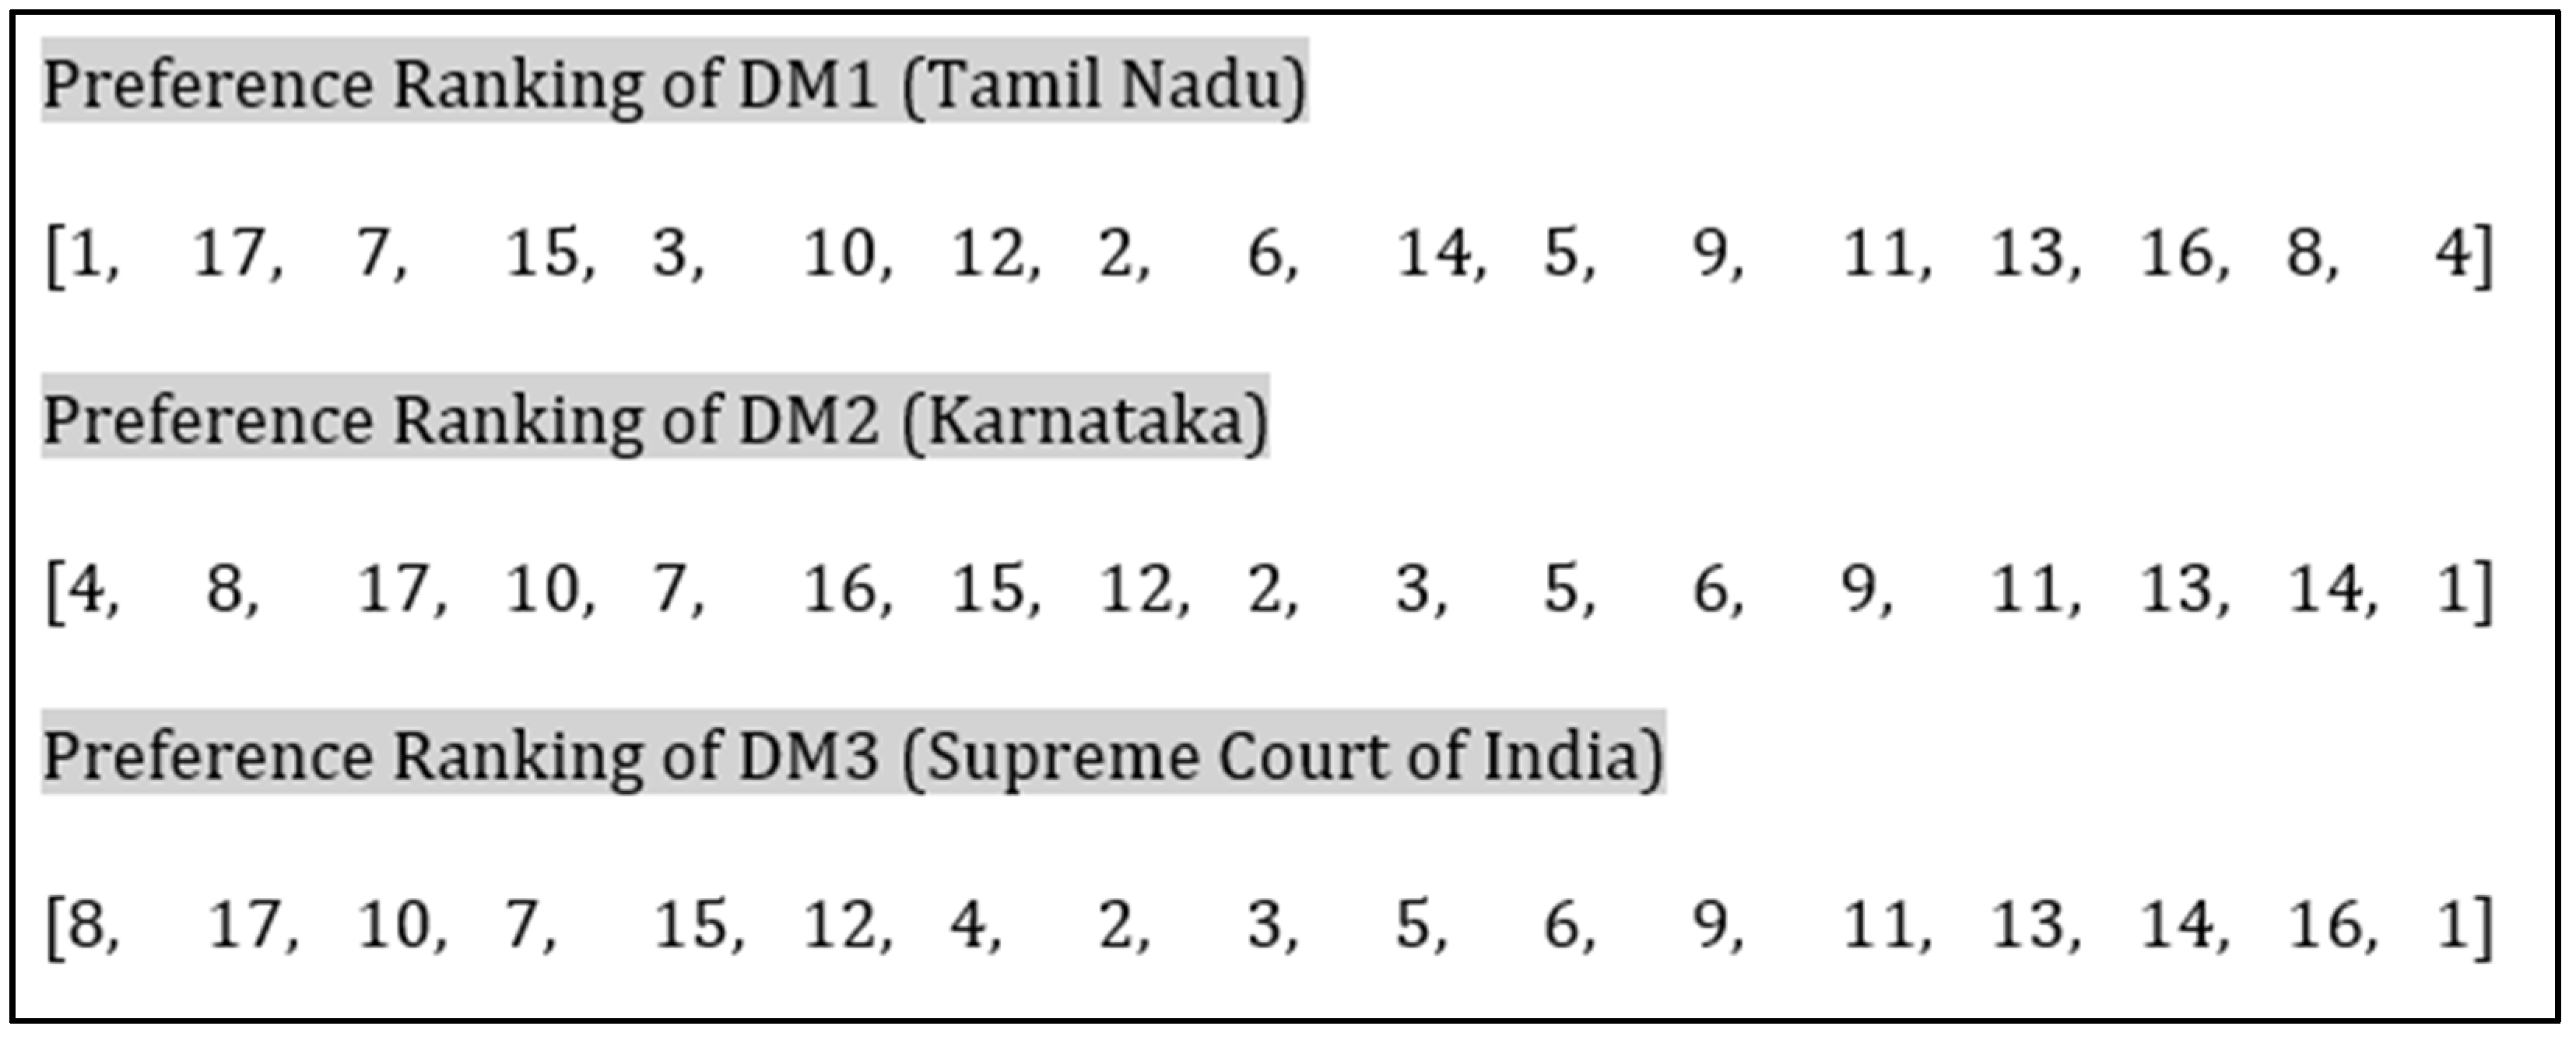
For Tamil Nadu (TN), the highest priority is that the previous ruling gets reinstated, and hence it is positioned on the extreme left. State 17, as mentioned in
Table 6, has the second-most preferred state as it reaches an agreement in which TN would get more water, and the other two DMs agree. State 7 is the next preferred state as it would cause the two states to resolve the issue without involving the Supreme Court of India (SC). State 15 is the next preferred state because even if Karnataka does not take the pricing option, SC can take the money from TN and invest it in central government schemes in Karnataka [
36,
39,
40]. State 8 and 4 are least preferred for TN as it would mean staying with the current ruling.
Karnataka wants to keep the current ruling and that is visible in its preference matrix. Both State 4 and 8 are situations where the current ruling is enforced. State 17 is the next preferred state, as it will bring in money for the state, which can be used to bolster the water resources infrastructure. State 10 is the next preferred state, as it does not cause the state of Karnataka to lose water. State 7 is next preferred due to the same reasons as it is preferred by TN. It causes the state of Karnataka and TN to resolve the matter without involving the SC, which could be highly likely as it will considerably reduce the administrative effort, unless needed. State 16 is preferred next, as it means that the state of Karnataka receives money from SC to improve its infrastructure instead of TN [
36]. Using federal budgets, the Supreme Court can help and fund the states. State 1 is the least feasible, as it causes the state of Karnataka to receive less water.
For the Supreme Court, the priority is to keep the current ruling as well, which is visible through state 8 being most preferred. State 17 is preferred next, as it is beneficial for both the states, and it sets positive precedence for any future water-related conflict in the country. State 7 is also higher up in the preference ranking, as it would not cost the SC the human resource and logistical expenses. State 4 is far behind, as the SC would not want to seem partial by preferring Karnataka’s most preferred option. State 16 is not preferred by the SC, as there will be no ecosystem-service generated revenue for the state of Karnataka. Clearly, from Karnataka’s perspective, it would be beneficial to receive payouts from water pricing (setting aside whether the SC has any funds to payout). The results are shown in
Table 7.
After sensitivity analysis of the 17 feasible options, 7 states were found to be in Nash equilibrium. The calculations are performed in the GMCR+ space using the same solution concepts defined earlier in this section. Demonstration of GMR and SMR stability is a little cumbersome; however, SEQ can be shown easily. Of the solution concepts, if a state is Nash stable, it is also GMR, SMR, and SEQ stable.
Consider state 5 for TN, which has two unilateral improvements (UIs) to state 6 and state 7. If TN moves to state 6, Karnataka (which has a UI from 6 to 2) can move to state 2. State 2 is rational for Karnataka; however, it is more preferred than state 6 for TN. Also, SC has a UI from state 6 to state 5, where state 5 is rational for SC. Hence, by definition, state 6 is SEQ unstable for TN. If SC was the only other DM other than TM, state 6 would have been SEQ stable for TN.
3.4. Exploring Fuzzy Preferences
A possibility may arise with the water pricing option, which will, ironically, only work in a strict coalition between the two states. In order to address this uncertainty, an option prioritization approach was carried out in conjunction with the fuzzy preference methodology. The following sub-sections introduce the step-by-step methodology and the various definitions concerned in carrying out Fuzzy GMCR.
3.4.1. Theoretical Description of the Graph Model for Conflict Resolution (GMCR)
A (crisp) Graph Model (GMCR) of conflict entails a set of decision-makers, a set of states, the decision-maker’s strategy, or directed path of ‘moves’ through alternative states to the desired state, and the preference relation of the decision-makers over the states. These preferences are given by binary relations, i.e., 1 (Yes) and 0 (No), and are “crisp” in nature. This is where the fuzzy Graph Model differs from the crisp Graph Model [
41]. In the fuzzy Graph Model, preferences are given by fuzzy binary relations on the set of the feasible states. The mathematical notations used to describe a conflict are as follows:
The set of decision-makers, N = {1, 2, …, n}, and
The set of feasible states, S = {s1, s2, …, sm}
The decision-makers in this conflict will be Tamil Nadu and Karnataka with 17 feasible states. The Supreme Court of India’s preferences is not considered for this analysis as it is assumed that they will accept the decision taken by the two states. For k ∈ N, Ak = Cartesian product of S with itself (S × S), represents the moves controlled by decision-maker k, so that for si, sj ∈ S, (si, sj) ∈ Ak, if and only if the decision-maker k can cause the conflict to move from si to sj in one step. Then, Dk is the directed graph of the decision-maker k, Dk = (S, Ak).
If the crisp preferences over the feasible states are recorded by a binary relation, ≳
k, then a crisp Graph Model is represented as:
On the other hand, if a decision-maker’s preferences over the feasible states are represented by a fuzzy binary relation given by a matrix
k, where
k represents the degree of preference of row states over the column states for the decision-maker k, then the fuzzy Graph Model can be represented as follows:
The
preference degree (
k) is calculated by using the fuzzy truth values and the fuzzy score intervals of each pair of states [
42].
3.4.2. Procedure for Calculating the Preference Degree
The fuzzy
truth degrees (x) are represented by numerical values from the closed interval of [0,1]. The x-values are the truth values of a preference statement at a given state in the conflict. To efficiently capture these truth degrees, two transformation functions, i.e., a lower transformation function, and an upper transformation function, are specially designed:
where, p ∈ [1,2], and x ∈ [0,1]. The value of p depends upon the certainty of the choices in x-values. If the consultant (the person doing the conflict analysis) is sure about the x values, then the value of p shall be fixed to 1; else, it will be greater than 1. If the consultant is certain about the x-values, the fuzzy interval is narrower (more precise). If the consultant is less certain, the fuzzy interval is wider (less precise). In the current conflict, the value of p was fixed at 1.5.
Let σ
t (s) denote the decision-maker’s
truth degree for preference statement at state s with t preference statements for a decision-maker (t = 1, 2, 3, …,
q). Then:
The interval
is called the decision-maker’s fuzzy
truth value interval of preference statement Ω
t at state s. The
and
values are then multiplied by a real number α, where α needs to satisfy the condition:
By keeping the value of
in this conflict equal to 0.2, it was made sure that equation 6 is satisfied. The
incremental fuzzy score interval of state s for preference statement
is defined as:
From the incremental fuzzy score interval, we calculate the decision-maker’s
fuzzy score interval for state s, which is defined as:
The summation above is carried over all the preference statements for each state for each decision-maker. Any number in the interval can be interpreted as a possible fuzzy score of state s for the decision-maker.
A
fuzzy preference is expressed using numerical values between 0 and 1, interpreted as pairwise preference degrees. It is defined as
for any
It is interpreted as the degree of likelihood that a number in
is greater than or equal to a number in
[
43]. Mathematically,
is defined as:
where,
.
In summary,
r mentioned above is an S X S matrix. In order to make the definitions and the values, they describe distinctively, the following are defined. A fuzzy preference over S is represented by
, with the membership function,
, and the preference degree of
over
satisfies
Table A1 and
Table A2 in
Appendix A represent these values for the decision-makers, Tamil Nadu and Karnataka, respectively. If the value of
is equal to 1, then it indicates that
is definitely preferred to
. However, if the value of
is greater than 0.5, it indicates that state
is likely to be preferred to state
. If
is equal to 0.5, it would mean that either of the states is equally preferred. On the other hand, if
is equal to 0, it would mean that state
is more or definitely preferred to state
. The decision-maker’s fuzzy preference over the states is a pairwise relationship. In order to reach a comparative structure to carry out the fuzzy equilibrium calculations, two sets of parameters are defined.
Fuzzy Relative Certainty of Preference (FRCP): Let
and let
denote the preference degree of state
over
for decision-maker
k. Then the
kth decision-maker’s FRCP for state
over
is denoted as
, and is defined as:
where
.
The matrix representing the is a skew matrix, i.e., for all the decision-makers , and for all the states, . Also, if it indicates that the decision-maker k definitely prefers state to , and so on and so forth.
Fuzzy Satisficing Threshold (FST): The major component of the Graph Model is to determine whether it is favorable for the decision-maker to move from one state to another or not. In fuzzy theory, the decision-maker can identify value in their FRCP matrix to determine whether a move is possible or not. This value is referred to as the FST of the decision-maker. Therefore, for all decision-makers and the states belonging to the state space, a decision-maker k shall move from a state to if and only if . The threshold determines the behavioral pattern of the decision-maker, and as per the definition above, must be positive with a maximum value of 1. In this study, the values for both the decision-makers are ascertained by a fair bit of sensitivity analysis.
3.4.3. Fuzzy Stability Definitions
For every decision-maker, there is a set of states they can move to, and that is defined as their reachability matrix. For a decision-maker k, it is denoted as for all states reachable from state s. Therefore, a state reachable from state is called a Fuzzy Unilateral Improvement (FUI) if and only if and the set of all the FUIs from a state for a decision-maker is called the Fuzzy Unilateral Improvement List (FUIL). This list is denoted by . The following definitions are for a two-decision-maker system, where one decision-maker is denoted as k, and the second decision-maker as l.
Fuzzy Nash (FR) Stability: A state s is Fuzzy Nash stable for a decision-maker k if and only if . The state s is FR stable for decision-maker k if it has no FUIs from state s.
Fuzzy General Metarationality (FGMR): A state is FGMR for decision-maker k if and only if, for every , there exists , such that .
Fuzzy Symmetric Metarationality (FSMR): A state is FSMR for decision-maker k if and only if, for every , there exists such that and for all .
Fuzzy Sequential Stability (FSEQ): A state is FSEQ for decision-maker k if and only if, for every , there exists , such that . These definitions and their calculations are explained in detail in the Results and Discussion section.
Table 6 depicts the preference statements (Ω) of these options among the DMs. These statements are mentioned in decreasing order of preferences for each decision-maker. The option prioritizing approach is a general version of the “preference tree” method [
43]. Using a priority list of preference statements, a decision-maker’s preference is modeled. These statements are generally composed of logical connectors, like “and”, “if”, “if and only if”, “if-then” and listed from most preferred to the least preferred. The option prioritization methodology relies on the absolute “yes”, and “no” of each preference, where the truthfulness or “yes” of a more preferred state is greater than its falsity or “no” in calculating the decision-maker’s preference [
42].
The option preference statements of the decision-makers in this conflict were listed in decreasing order of importance. Tamil Nadu’s first option, as mentioned in
Table 6, is to get the previous ruling of the Supreme Court reinstated, and it in no circumstances would want the current ruling to stay. The option of water pricing (Option 3) will be accepted by Tamil Nadu if and only if both Karnataka and the Supreme Court agreed to take up that option as depicted in
Table 6. Water pricing would be complicated for only the states to figure out; they would require a governing body to mediate. However, it will also require more political will than the actual conflict has seen. In the last two decades of this conflict, the political landscape in the region has seen less effective governance and more deficient politics.
Crop diversification (Option 2) would be accepted by Tamil Nadu only if the Supreme Court agrees with the conditions that come along with it. Crop diversification may or may not help the smallholder farmers (those with an agricultural area less than 2 hectares) and therefore would require assistance in terms of subsidies to counter income fluctuations.
On the other hand, Karnataka would want the current ruling to stay and would dislike going back to having a smaller proportion of the available water in the river. They would agree with the water pricing (Option 5) if and only if Tamil Nadu and the Supreme Court agrees with it. If this option is accepted, over time, the share of Karnataka would reduce as the influx of funds from Tamil Nadu improve the efficiency of its water distribution infrastructure. The Supreme Court is generally neutral in these terms; however, managing this conflict has been a huge administrative and economic burden for them. Therefore, they would want to stay with the current decision and avoid going back to the previous ruling.
4. Results and Discussion
This region suffers from indecisive governments and their inaction towards the impacts of climate change. The governments are still trying to govern using archaic methods that do not account for possible future stressors. Instead of solving this transboundary water-sharing issue, they resort to vote-bank politics. While applying crisp GMCR, multiple equilibriums were found. However, they were not useful because the states did not take up those options. This reflected that the states may be unaware of the possible solutions and which one of those would work best for them individually and be mutually agreed upon. Fuzzy preference optimization can help streamline the available solutions by introducing cardinal values, which define a certain threshold to isolate the most preferred solutions. This section discusses and presents the results from both the crisp GMCR and the Fuzzy GMCR with example calculations.
4.1. Crisp GMCR
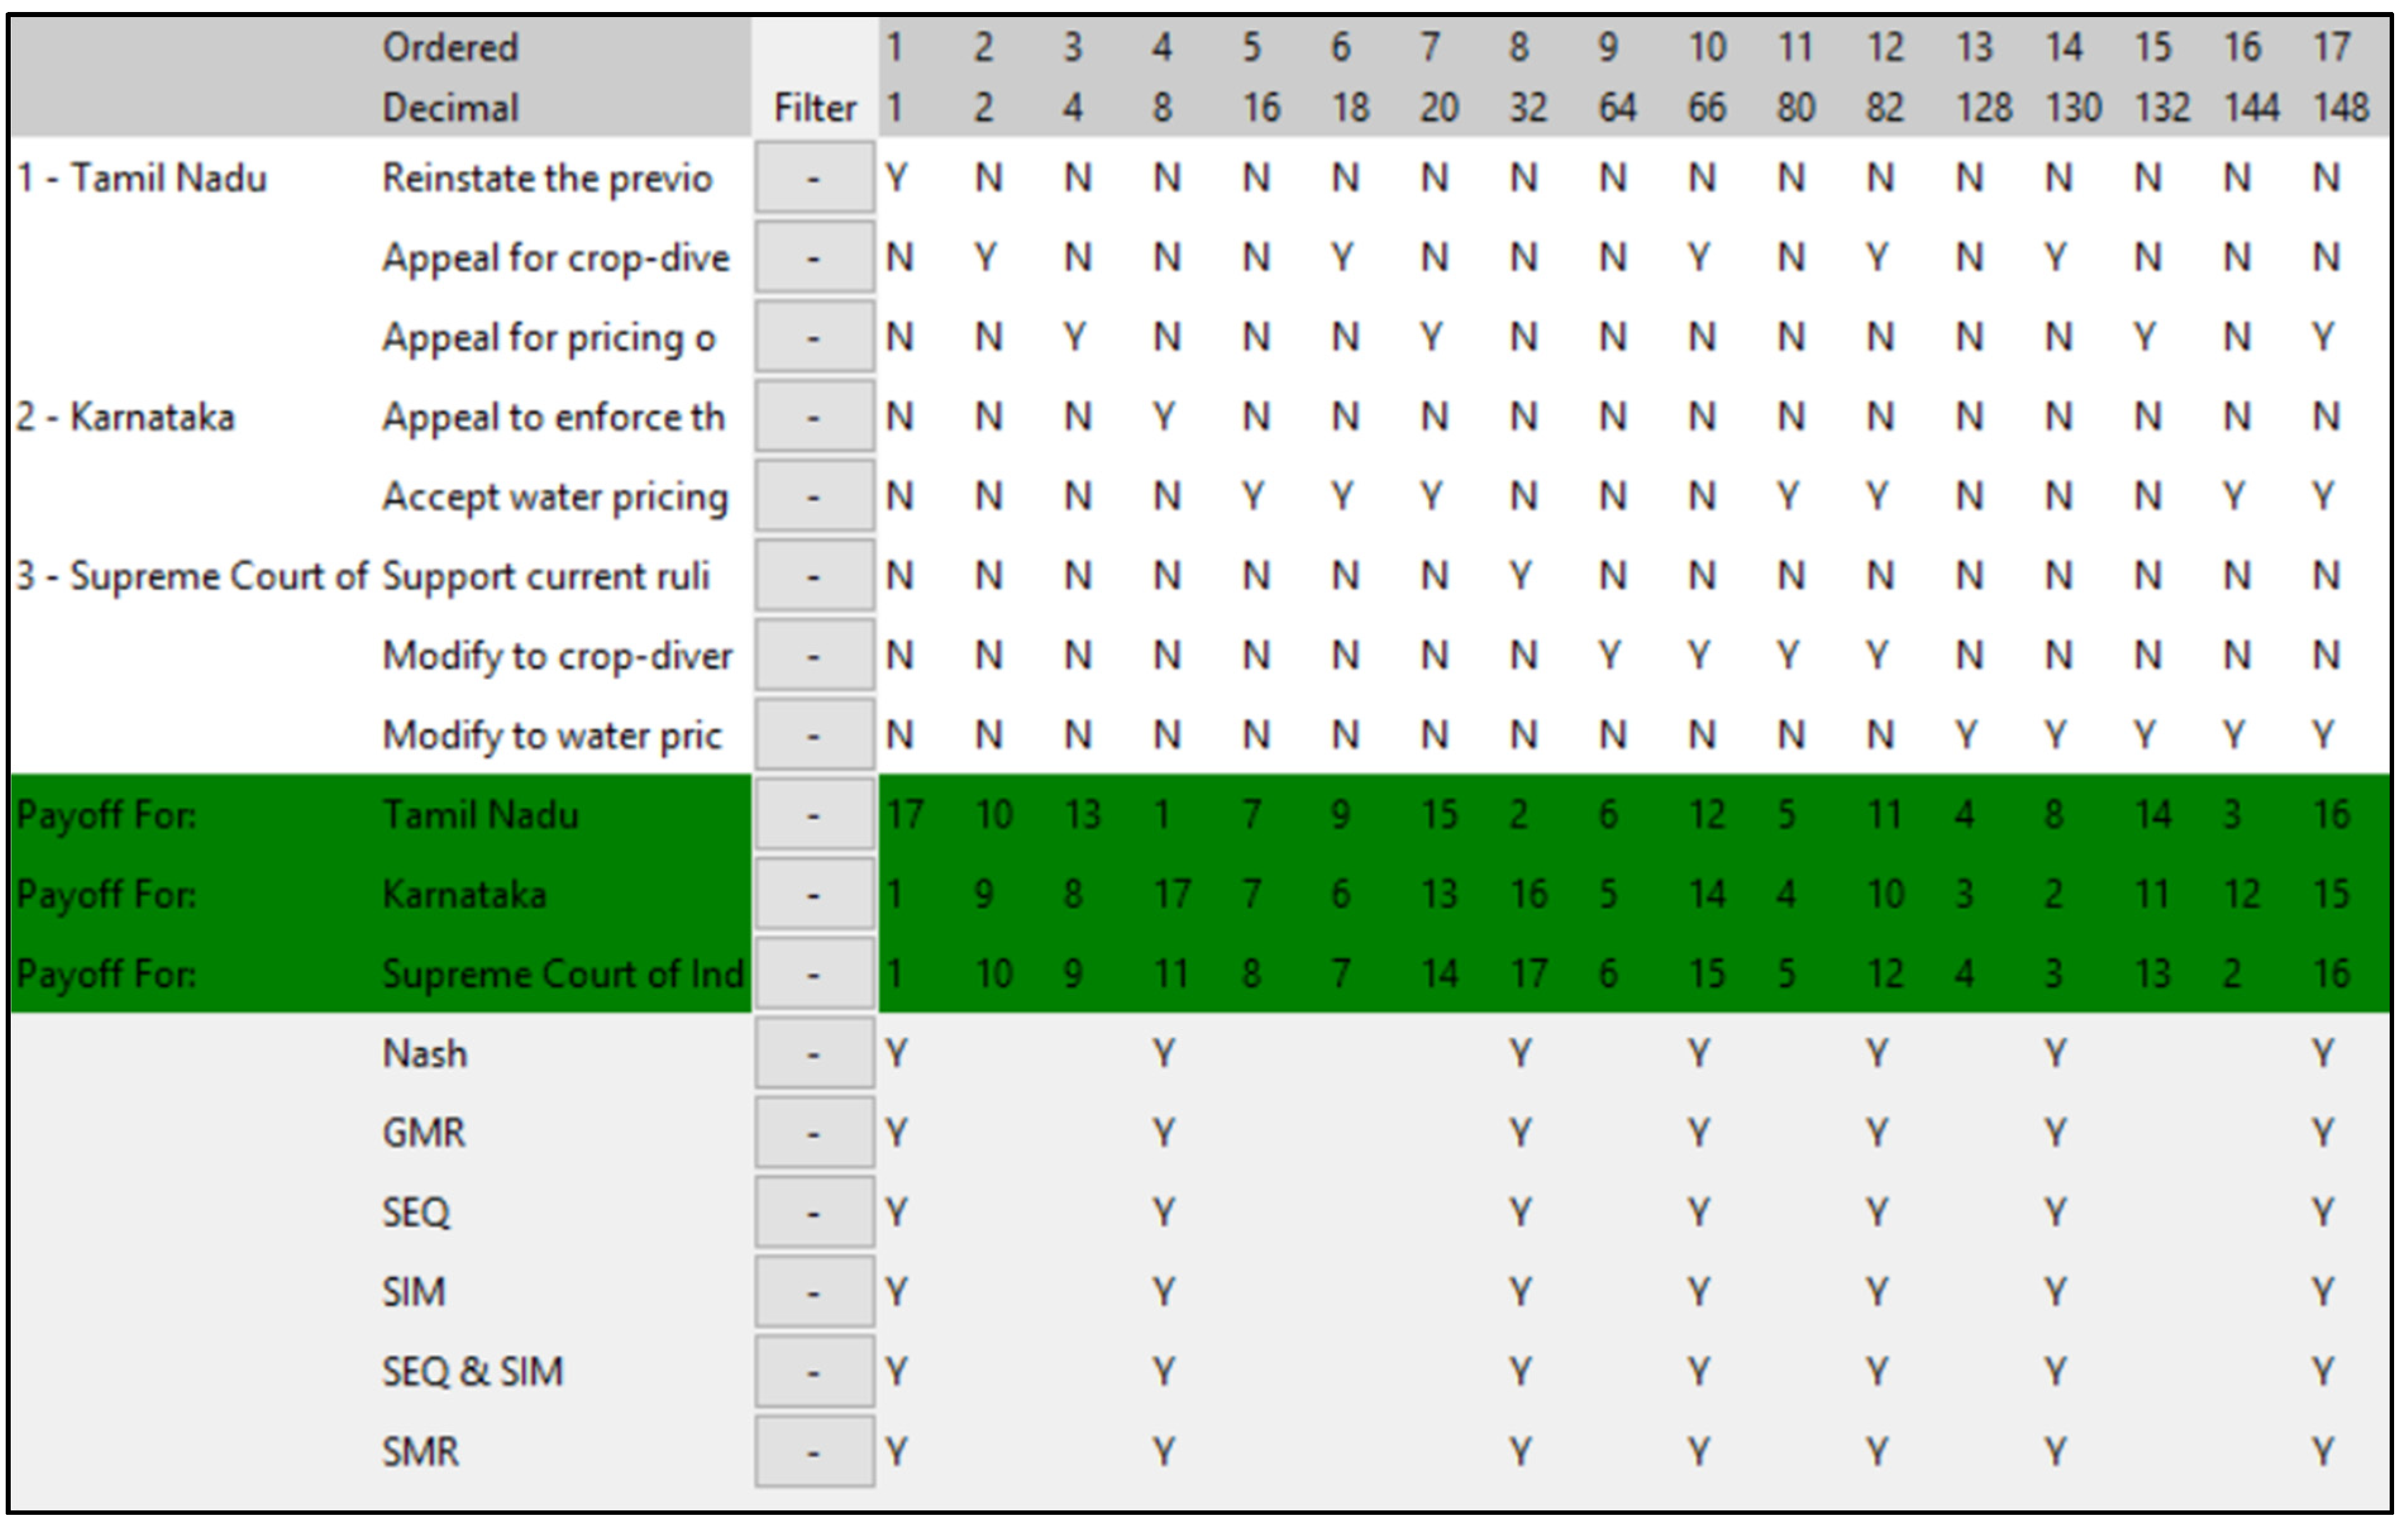
As mentioned in the previous section, for the eight-option model out of the total 256 states, 100 states were found to be feasible states. Without applying option prioritization, 39 states were found to be Nash stable in the analysis. Many of the stable states seem unstable intuitively; therefore, the infeasible strategies were changed. For the purpose of simplification of the analysis, the options are kept irreversible (i.e., once an option is taken, the decision-maker cannot go back). Also, the decision-makers’ options are mutually exhaustive within themselves. Hence, for instance, Tamil Nadu can either opt to reinstate the previous ruling or modify to crop-diversification or modify to the pricing of water. Due to a total of 3 decision-makers, 8 options, and 17 feasible states, manual calculations will become complicated. The 17 feasible states are displayed in
Table 7. The ‘Y’ means that the option is taken, and ‘N’ means that the option is not taken.
For calculating the stabilities, the preferences of all the decision-makers are written from most preferred on the left towards least preferred on the right. The preference matrix of all the three decision-makers is shown in
Figure 5 below.
From the equilibriums shown in
Figure A1 in the
Appendix A, states 1, 4, 8, and 12 are false equilibriums. State 1, 4, and 8 are individual Nash stable states for the respective DMs. They seem to reach equilibrium because the removal of infeasible states and option prioritization are set in such a way to exclude mutually exhaustive options from the analysis. Intuitively, these equilibriums do not make any sense. The states were checked by manual calculations as well to make sure that any feasible states are not accidentally deleted. State 12 is a special case in which the state of TN agrees with SC to include crop-diversification and the state of Karnataka insists that crop-pricing [
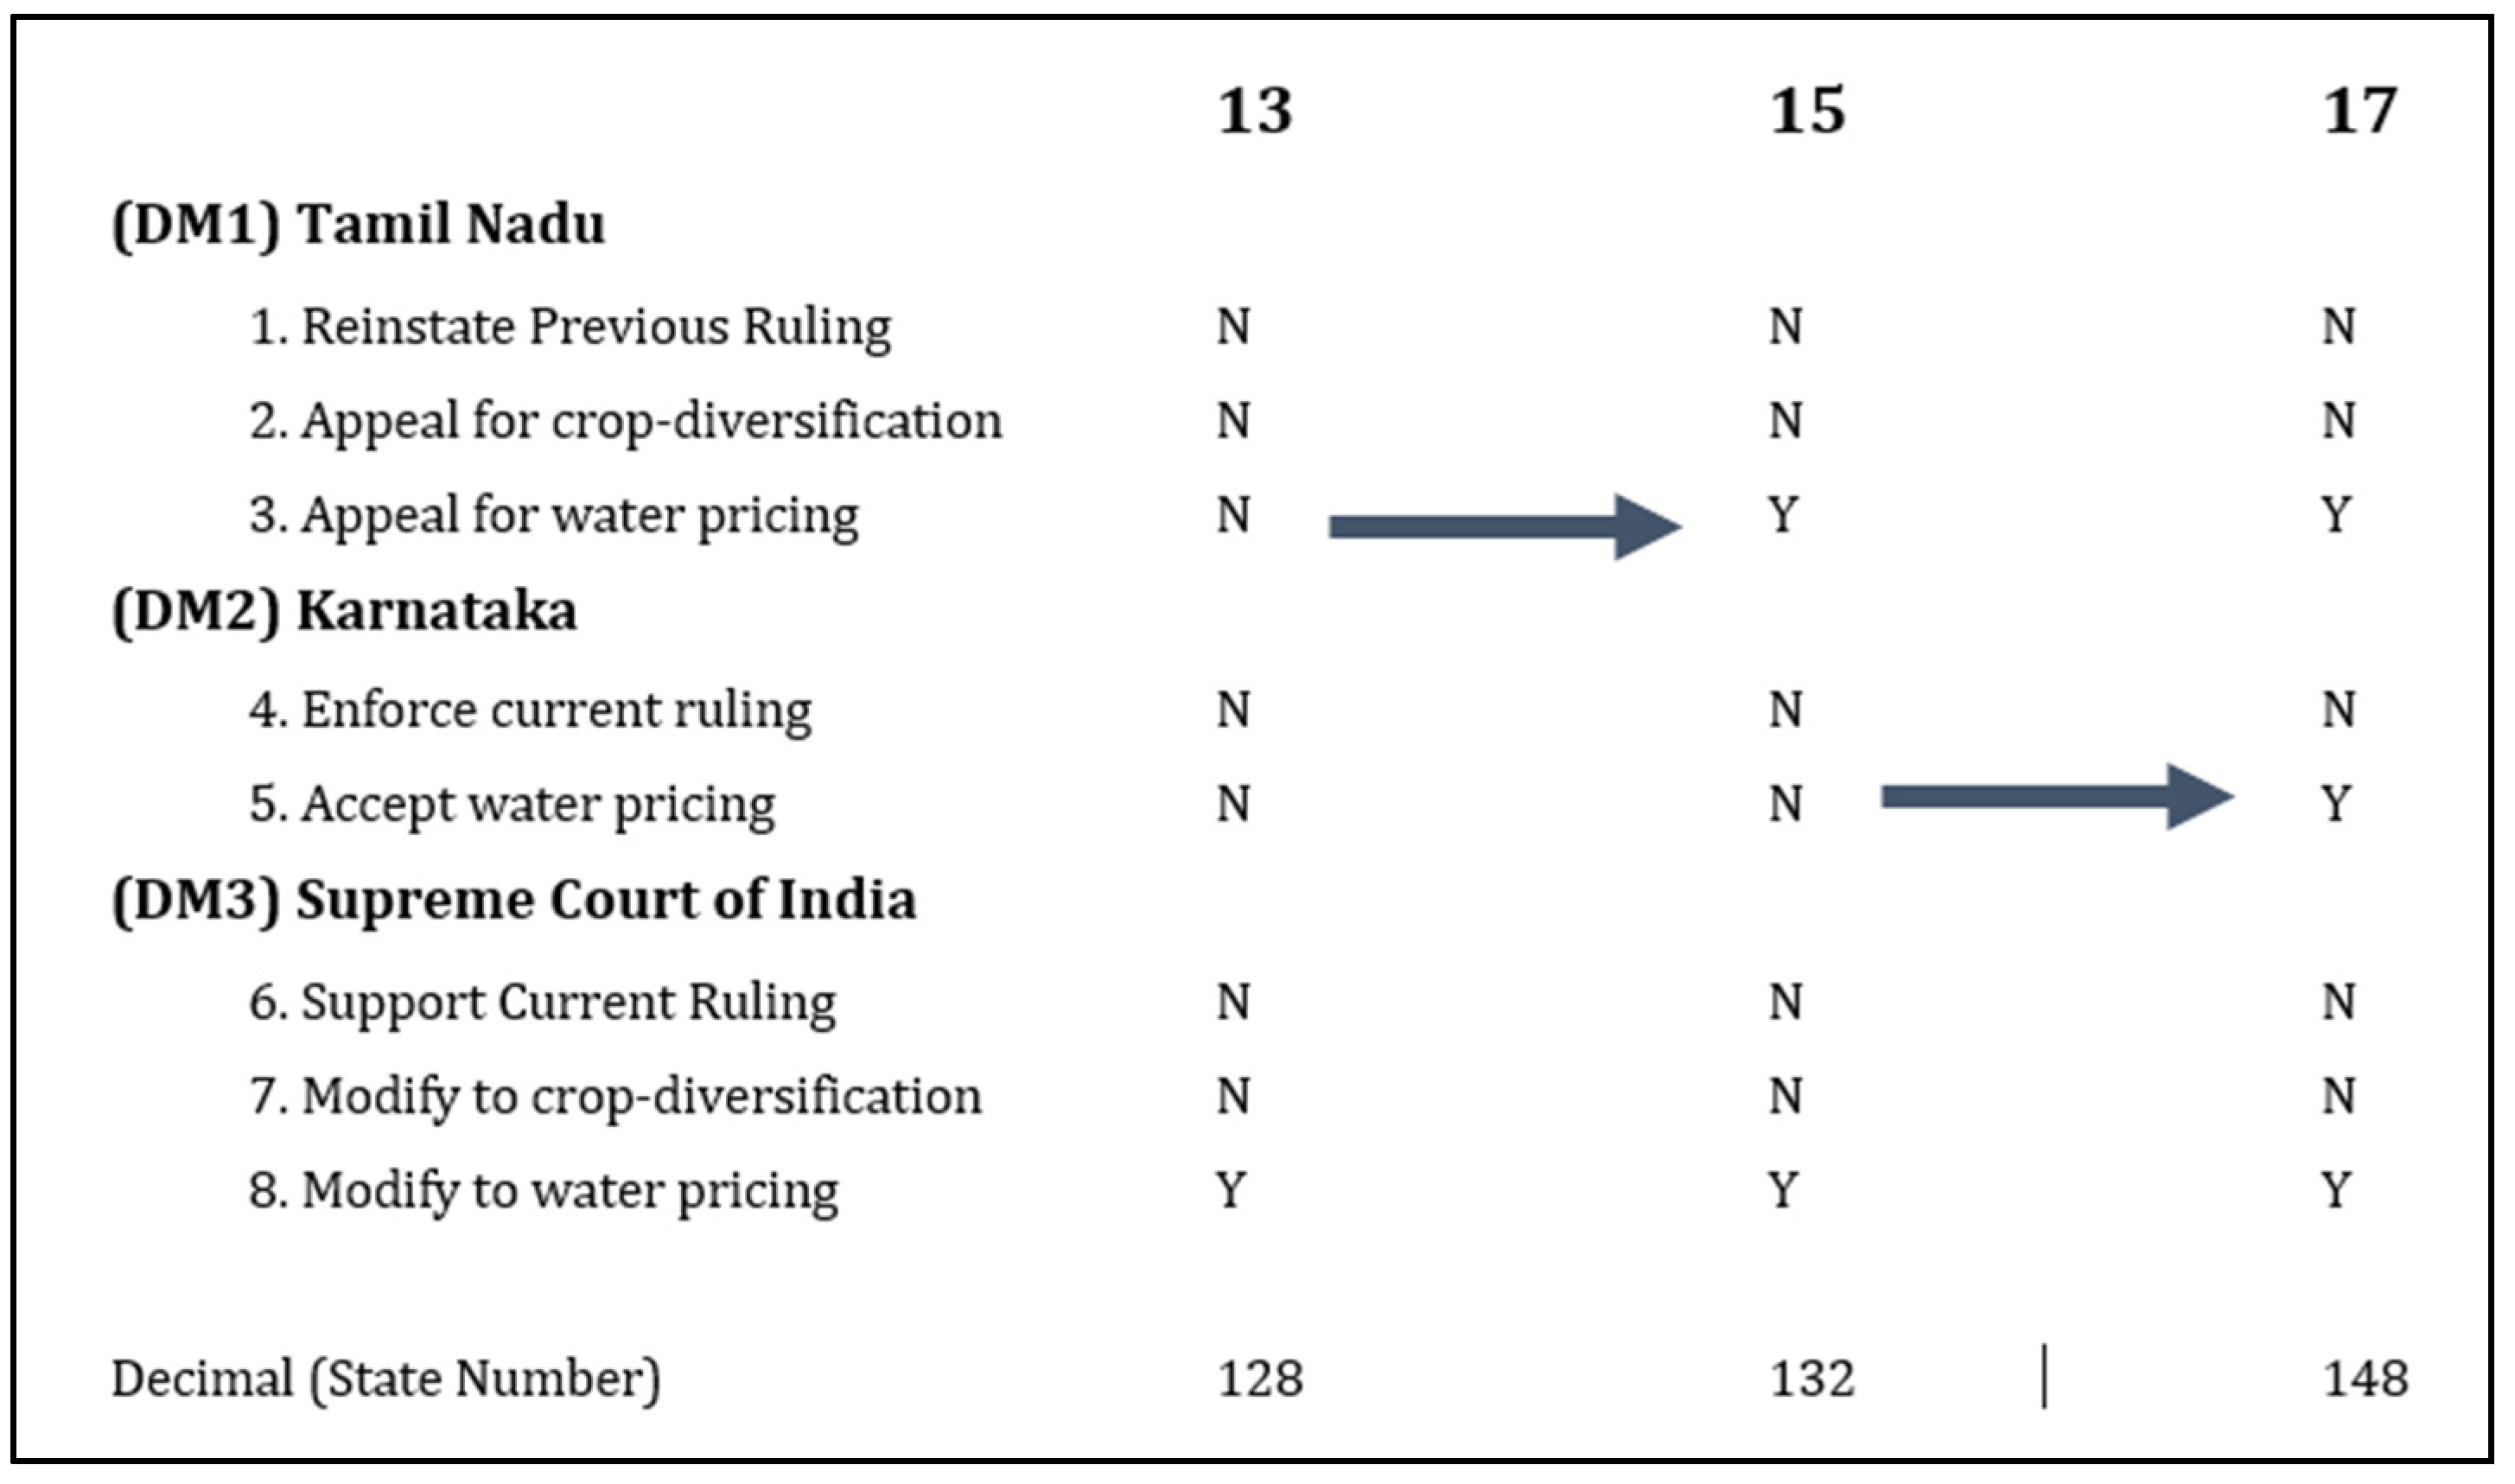
33] is included in the scheme. The profit generated from crop-diversification can be shared with Karnataka, which, in turn, it will invest in its infrastructure so that it will require less water in the future. Ideally, more water will also then become available for TN. This equilibrium seems to be possible only if the immense political will is in effect and there is faith in the scheme, which judging from the political system in India, is far-fetched. The evolution of the conflict towards state 17 would be as shown in
Figure 6.
On the other hand, for Karnataka, State 10 is the equilibrium in which it is not involved at all, and the state of TN works with SC to include crop-diversification in their state. State 14 is nearly the same case as state 12, with the exception that the state of Karnataka is not involved. Karnataka is not involved in both state 10 and 14. State 14 has the SC modify to water pricing while TN appeals for crop-diversification. These are states in transition. The SC would use the revenue generated from the crop-diversification practices and invest it in Center-funded projects in Karnataka, without involving its government. State 17 is the case in which all the three DMs are involved in the same project of utilizing the revenue generated from the water-pricing to be used in the state of Karnataka, and in turn, the state of Karnataka starts releasing more water immediately.
4.2. Sensitivity Analysis with Option Prioritization
The preference order of the states mentioned in the previous sections is highly uncertain as it pertains to governmental policies. The model calibration was carried out based on a literature review. For example, Tamil Nadu is not able to reinstate the previous ruling and does not have a clear preference for either the pricing of water or crop-diversification. It is completely dependent on the governance and environmental situation within the state. Using the GMCR methodology, the preferences were changed to check whether these details would affect the final equilibrium; however, no difference was observed. The same four states were found to be the equilibrium ones.
In global conflicts involving more than two decision-makers, two or more of them may form a coalition in order to be collectively better off at the end of the conflict. However, coalition preference is not evident in this conflict as both states have high political dividends to be reaped from this basin. For Tamil Nadu, it is the biggest river basin and for Karnataka, it powers their biggest city of Bangalore. Therefore, a coalition between them is near impossible.
4.3. Fuzzy GMCR
From equation (1) to (10) in the methodology section, the
matrices for Tamil Nadu and Karnataka are calculated. Some of the example calculations are shown below. Using equations 3 and 4 and considering an example of the decision-maker Tamil Nadu, state 7 and state 17 have been ascertained to have x values of 0.5 and 1.0 for the most preferred option (
). Then, for state 7, the value of
, and
. Using equation 7 for TN and state 7, the
, and
. For state 17, the
, and
. Using equation 8, for TN and state 7 the
= 0.245, and the
. For TN and state 17, the
= 0.551, and the
. Using equation 9, the degree of likelihoods for TN (
and
) were calculated. Using equation 10, the
values were calculated, e.g., Tamil Nadu,
, and
. More information about the x values is mentioned in
Appendix B.
For simplicity, the Supreme Court (the third decision-maker), is assumed to not have any participation in the conflict, as it would honor the decisions taken by the other two decision-makers. Also, the Supreme Court is a governing body and hence such a simplifying assumption is acceptable.
Table A1 and
Table A2 represents the fuzzy preference values for Tamil Nadu and Karnataka, respectively. The
value in the tenth row and second column above of 0.9 represents that state 10 is preferred over state 2 by a factor of 0.9. It represents Tamil Nadu’s preference of state 10 over state 2. Also, the ninth row and seventh column represent the preference of state 9 over state 7. The value of 0.3 represents that state 9 is less preferred over state 7. In row six and column fourteen, the value of 0.8 represents the preference for Karnataka for state 6 over state 14. Karnataka prefers state 6 over state 14 by a factor of 0.8, which would mean that it is definitely more preferred. State 13 is less preferred over state 8 because the preference value in the thirteenth row and eighth column is 0.2.
In order to carry out the fuzzy stability analysis of the Cauvery conflict, the
values above were checked with the
values mentioned in step 4.2 in the previous section. The fuzzy preference values are checked against the fuzzy satisficing threshold (FST). The results are presented in
Table A3,
Table A4,
Table A5 and
Table A6 (
Appendix A), where a ‘Y’ in a cell indicates that the state in the corresponding row is fuzzy stable for the indicated decision-maker or a fuzzy equilibrium (FE) under the indicated fuzzy stability definitions. To identify how the fuzzy satisficing threshold (FST) behavior works, four sets of FSTs of the decision-makers are considered.
The FSTs used in the analysis are; (1)
; (2)
; (3)
; and, (4)
. The results
Table A3,
Table A4,
Table A5 and
Table A6 are available in
Appendix A.
There were no states available to perform an FSEQ analysis for Karnataka. State 7 (water pricing is accepted by both Karnataka and Tamil Nadu) and state 17 (water pricing is accepted by all the three decision-makers) are the two states in fuzzy equilibrium in all the four combinations. State 17 is an extension of state 7, as it also includes the agreement on part of the Supreme Court for the water pricing option.
5. Conclusions
Although the Cauvery conflict is old, there has not been enough literature discussing the conflict holistically. The Cauvery River basin conflict, despite being of immense importance, is still far from resolved. This study is aimed at providing a fresh look into the Cauvery conflict by applying the methodology of GMCR along with fuzzy preferences. The approach here is to view the dispute from the perspectives of the parties and their preferences, whereas, previous studies of the region have focused on single issues such as the hydrological cycle, or the economic condition of the region.
Using the GMCR methodology, the complicated nature of different options and preferences have been condensed into workable (17) states. GMCR found four stable states that could be a possible way forward; State 10 (crop diversification clause accepted by Tamil Nadu and the Supreme Court), State 12 (Tamil Nadu wants crop diversification; however, Karnataka is pushing for water pricing, but the Supreme Court accepts Tamil Nadu’s option), State 14 (water pricing is accepted in principle by Tamil Nadu and Karnataka), and State 17 (water pricing option is accepted by all the three decision-makers. GMCR offers insights into the evolution of the conflict in terms of change in the preferences of the decision-makers as they converge towards a mutual agreement. However, there is not enough contextual information behind the four possible agreements in order to predict the most probable solution.
There has been little progress in this conflict since 2013 due to the indecisiveness of the decision-makers. This inspired the researchers to apply methodologies that can help the decision-makers focus on a solution that has a higher chance of success. Therefore, a fuzzy preference methodology was applied. The water pricing option, which demands the cooperation of both decision-makers, has emerged as the most favorable option (state 17). However, water pricing is only a solution if price has an impact on agricultural practices and if it is effectively feasible and socially accepted. In addition, high political will is also required to implement such a mutual agreement between Tamil Nadu and Karnataka. This option shall ensure that Tamil Nadu receives enough water every year, and in turn, Karnataka will receive a compensatory sum of money, which it will invest in its own infrastructure development. If Karnataka accepts the water pricing option and invests that money in improving its water supply infrastructure, they would not be required to incur a loan from a foreign entity like ADB. This option also utilizes Ostrom’s idea, where the two states can become dependent on each other and not require intervention from regulatory bodies [
44].
A study limitation is that the GMCR+ software cannot carry out fuzzy preference optimization. The results mentioned here were calculated using Microsoft Excel. In addition, the methodology for fuzzy preferences calculation requires key values on the part of the person carrying out the study (the consultant). The x-values mentioned in equations 3 and 4 are to be entered manually by the consultant and therefore may incur a human error. Other input values like
in equations 3 and 4 and
in equation 6 are all input variables in the methodology. However, these input variables have a fixed range of values that they can take to satisfy several mathematical conditions. The consultant, as a third party, makes judgments on the preferences of the decision-makers, hence possibly adding considerable bias. However, for complex calculations like those of FR, FGMR, FSMR, and FSEQ, a panel in the current GMCR+ module can be added. In future work, to further reduce consultant bias, input models can be used. One option can be PROSA (PROMETHEE for Sustainable Assessment) [
45]; as a decision tool, it may be used for sustainability-related challenges. It boasts of a lower degree of criteria compensation, which can help in categorizing sustainability problems effectively. Another option would be Cross Impact Balances [
46] as an input model for the socio-economic indicators used implicitly in the current GMCR model.
In addition, hydrological modeling is not part of the scope of this paper, as it focuses on positions that could be taken by the two states in the present-day conflict to help them move forward from their political standoff. However, the importance of climate change and its effect on water availability and water demand will affect water sharing immensely. Apart from these limitations, GMCR provides a set of tools that a consultant can explore to understand the nuances of a conflict. Although it is common knowledge that complex problems can be solved if parties work together, GMCR showcases specific opportunities for cooperation to resolve conflict. With the permanent monitoring committee being established in early 2019, this research is timely and can be used by them.


