Abstract
In recent years, big data has been widely used to understand consumers’ behavior and opinions. With this paper, we consider the use of big data and its effects in the problem of projecting the number of reverse mortgage subscribers in Korea. We analyzed web-news, blog post, and search traffic volumes associated with Korean reverse mortgages and integrated them into a Generalized Bass Model (GBM) as a part of the exogenous variables representing marketing effort. We particularly consider web-news volume as a proxy for marketer-generated content (MGC) and blog post and search traffic volumes as proxies for user-generated content (UGC). Empirical analysis provides some interesting findings: First, the GBM by incorporating big data is helpful for forecasting the sales of Korean reverse mortgages, and second, the UGC as an exogenous variable is more useful for predicting sales volume than the MGC. The UGC can explain consumers’ interest relatively well. Additional sensitivity analysis supports that the UGC is important for increasing sales volume. Finally, prediction performance is different between blog posts and search traffic volumes.
1. Introduction
The Bass diffusion model developed by Bass [1] has been widely used to explain the diffusion of new products or services in many areas. It attempts to explain innovations with external and internal influence. The model is simple, but it has strong prediction power for long-term new product performance [2]. In addition, Bass et al. [3] extended the original Bass model to the Generalized Bass Model (GBM) by including exogenous variables that represent marketing effort and clarify external influences on consumers’ decisions.
Product prices and advertising expenditures are the most typical examples of the exogenous variables [3,4,5,6]. These are meaningful for representing the effects of marketing efforts on attracting consumers, but they fail to closely reflect consumers’ internal interests. In the context of the GBM, we attempt to include variables that are likely to well represent consumers’ interests with the aims of improving the model’s prediction power.
In recent years, researchers have made efforts to predict consumers’ behavior, opinions, or other phenomena by utilizing big data; the characteristics of big data make it possible to quickly collect large amounts of a variety of information. Many studies have reported outstanding prediction performance of big data. Separately, technology development and increased usage of the Internet accelerated the explosive growth of web-based data [7]. Most people have ready access to extensive and varied information. The Internet allows consumers and companies to obtain (or disseminate) information about products and services through a variety of channels besides traditional channels (e.g., TV advertising, newspapers, surveys, etc). Because so many data sources are available, companies can understand consumers’ behavior and predict products’ sales from data analysis. Managers can also promote their products or services through online channels, and conversely, consumers are able to share or get information about products or services online. Kim and Hanssens [8] suggested that consumers’ interests reflected in search traffic and blog posts leads to diffusion of the product as a result of Word-of-Mouth (WOM).
This work is mainly motivated by the problem of projecting the number of reverse mortgage (RM) subscribers in Korea. To alleviate the growing poverty risk of aging populations, the RM, which is a government-guaranteed loan service, was first introduced in 2007 [9]; it was designed for elderly Koreans who own property and choose to receive stable monthly payments by collateralizing their houses. Housing equity is generally the largest non-pension wealth for elderly homeowners in Korea. For example, the 2019 Survey of Household Finances and Living Conditions (http://kostat.go.kr/) data suggest that housing wealth accounts for 74.7% of the total wealth. Because of its economic appeal and the trust in the government, the demand for subscribing to RM continues to grow. The annual growth volume of RM subscribers is, on average, more than 5000, and the market size was over 10 billion USD in 2016 [10]. Moreover, the number of people aged 65 and older is expected to increase from 12.69 million in 2030 to 17.62 million (40.1% of the total population) in 2060, and the rapid increase in elderly people would expand the market size. Despite a growing demand, the long-term viability of Korean RM is arguable because it is highly uncertain and risky for the guaranteeing or lending institution; thus, suitable demand prediction of RM subscribers is necessary for stable and sustainable operation. The preliminary analysis revealed that the sales of RM in recent years fit well into the S-shaped Bass diffusion model. Thus, we decided to formulate the sales projection as the GBM by considering additional exogenous variables that better explain consumers’ behavior to improve the prediction power.
There has been much literature on the determinants of RM demand in Korea [9,11]. In addition to presenting demographic information on RM subscribers, Shan [12] showed that house price is the most significant influence on the decision to take an RM, because monthly mortgage payments correlate highly with house prices. In this sense, the House Price Index (HPI) has been widely used as a proxy for house price [9,13]. There is, however, a drawback in the use of the HPI because the Korean government annually updates the index, and it thus lags behind the housing market [14].
To overcome the drawbacks of variables that lag behind the market, we attempt to include variables that closely represent the market situation and consumers’ interests by utilizing big data. Under the conditions of Korea’s RM market, the purpose of this paper is twofold: (i) To forecast the sales of Korean RMs in the context of the GBM including exogenous variables, and (ii) to evaluate the effects of big data and to understand which type of big data is more valuable.
The rest of this paper is organized as follows. In Section 2, we review the preceding literature on the performance of big data and diffusion models. Section 3 explains the GBM and variables used in the model; we also propose our model in this section. Section 4 describes the procedure for data collection and analysis and presents results. In Section 5, we validate the effects of big data variables through scenario analysis. Finally, we provide conclusions and implications.
2. Literature Review
In the field of marketing, diffusion models have been widely used for forecasting sales over product life cycles [15]. For example, Frank [16] used a logistic diffusion model to forecast the wireless market in Finland, and Lee and Huh [17] similarly employed a logistic diffusion model to evaluate the effects of policy and oil price on the growth of renewable energy. Qian and Soopramanien [18] compared three types of diffusion models, Bass, Logistic, and Gompertz, to forecast sales in the Chinese vehicle market.
The GBM extends the simple Bass diffusion model by including additional exogenous variables, and much literature showed that the GBM has better a prediction power than that of the original Bass model. When formulating a GBM, it is important to employ appropriate exogenous variables to identify external influences. Researchers have considered a number of various exogenous variables in the literature. For instance, Bass et al. [3], Danaher et al. [19] and Boehner and Gold [20] proposed a GBM that included exogenous variables representing marketing mix and compared its prediction accuracy with that of the Bass diffusion model. Researchers also frequently considered government subsidies and policies as exogenous variables in forecasting the adoption of solar photovoltaic (PV) systems [21,22,23].
Some papers have recently proposed modified diffusion models that integrate big data, such as search traffic and blog posts (i.e., online reviews) as exogenous variables. Lee et al. [24] explained the diffusion of hybrid vehicles and industrial robots by including the volume of patent citations and search traffic as exogenous variables. Kim et al. [25] proposed a new diffusion model to forecast the sales of vehicles using big data. They show that their proposed model including search data volume is superior to the other models in terms of prediction power. Fan et al. [26] proposed a model that combines a conventional Bass and Norton model with a sentiment analysis of online reviews. The proposed model represented better prediction accuracy than those of benchmark models for sales forecasting.
The idea behind using big data is that big data on consumer behaviors provides better market prediction accuracy than do models that only rely on indirect measurements such as price and advertising efforts [8,27,28,29,30,31]. Kim and Hanssens [8] analyzed advertising and WOM effects in the U.S. motion picture industry during the pre-launch period, and they quantified consumers’ interest using blog posts and search traffic volumes.
Prior studies have affirmed that search traffic effectively explains market behavior [28,29,31,32,33,34]. Ettredge et al. [35] argued a relationship between economic statistics and Internet search activities. They indicated that the online search data were useful for predicting the unemployment rate in the U.S. Ginsberg et al. [36] showed that Google search traffic could be used to respond to influenza-like diseases, and Goel et al. [27] have studied sales forecasting of films, video games, and Billboard songs using search query volumes. Chumnumpan and Shi [37] proposed a model incorporating Google Trends data for sales prediction of non-durable products. They compared the results with Bass and Norton–Bass models, and the proposed model provided better performance than those of the other diffusion models.
Blog post volume is another type of big data. Onishi and Manchanda [30] and Gopinath et al. [38] showed that blog post volume better predicted market performance than advertising expenditures did. Onishi and Manchanda [30] found that conventional TV advertisements increased blogging activity and sales during the pre-launch period, and blog post volume had more significant influence on the sales during the post-launch period. Regarding volume of web-news, Cooper et al. [39] showed that search activity and media coverage can be used to monitor and predict for disease outbreaks. Liang [40] explored that news volume possibly affects the stock price.
The literature shows the potential use of big data for improving market prediction accuracy as a part of GBMs. However, researchers have made little effort to evaluate which types of big data are better for improving the prediction accuracy of GBMs. With this paper, we attempt to fill this gap by applying the GBM to predict Korean RM sales.
3. Research Methodology
The purpose of this research is to predict the sales of Korean RMs in the context of the GBM, and we aim to evaluate the effects of utilizing big data on improving the prediction accuracy. To address this research purpose, we first clarify the problem and highlight hypotheses. Then, we extend the conventional GBM by including big data within the exogenous variables to test the hypotheses.
3.1. Research Hypotheses
The conventional GBM has considered indirect measurements (e.g., price) as exogenous variables with the aim of effectively elucidating consumers’ purchase decisions [3,19,20]. Boehner and Gold [20] asserted the influence of exogenous variables by developing the modified GBM. They showed that higher prices decrease the diffusion rate of demand but that high advertising levels increase the rate.
Despite its potential advantages, we believe that the conventional GBM relying on indirect measurements has limitations in improving the prediction accuracy. Therefore, it is worth considering how to effectively integrate big data into the GBM to improve their prediction performance. To support this idea, we developed the first hypothesis.
Hypothesis 1.
Including big data in the GBM as exogenous variables provides better prediction accuracy in predicting the sales volume of reverse mortgages in Korea.
Much literature on the Korean reverse mortgages market has examined the HPI as a proxy for housing price or interest rate, which have a significant influence on sales volume [9,13]. This paper uses the HPI as an exogenous variable to represent indirect measurement. In the field of market prediction, researchers have investigated various types of big data; the most common examples have been search traffic [27,28,29,31,32,33,34,36], blog posts [30,38], and web-news [39,40]. Referring to the literature, we consider three types of big data, such as search traffic, blog posts, and web-news volumes, to explore consumers’ attention to target products in order to test our first hypothesis.
Kim and Hanssens [8] classified media into two types based on who generates consumers’ interest: Companies’ marketing activities and consumers’ online activities. Blog posts and search traffic are mainly generated by consumers and thus are considered to represent consumers’ interest in new products. Similarly, we consider search traffic and blog posts as user-generated content (UCG), which represents consumers’ attention to Korean RMs, whereas online news is considered as a proxy for marketer-generated content (MGC). Potential consumers relatively tend to spread more positive online content than negative online content [41], and they are more likely to share online news with informational utility [42]. From this perspective, online news is utilized as a tool to promote product information.
Kim and Hanssens [8] demonstrated that consumers’ demand is highly sensitive to the data volumes of search traffic and blog posts. Their research on sales prediction in the movie and game industries showed that the UGC had more influence on demand than did firms’ marketing activities. Consumers intentionally generate blog posts and search traffic, and the UGC thus more successfully demonstrates their interests. Firms’ marketing activities promote consumers’ interests by increasing the chance of exposure to products. The work proposed by Kim and Hanssens [8] motivated us to develop our second hypothesis about which type of big data is more beneficial for improving prediction accuracy.
Hypothesis 2.
The UGC (i.e., volumes of blog posts and search traffic) provides better prediction accuracy in predicting the sales of RMs than does the MGC (i.e., web-news volume).
According to Kim and Hanssens [8], the effects of search traffic and blog posts differ for predicting the sales in the movie and game industries. They showed that search traffic volume was superior to blog post volume in predicting the box office revenues. Thus, to identify the differences depending on consumers’ interest, we extend the Hypothesis 2 to develop the last hypothesis.
Hypothesis 3.
There are differences between search traffic and blog posts as the UGC in predicting the sales of RMs.
3.2. The Models
To test the hypotheses, we modified the conventional GBM [3] by including big data as additional exogenous variables. This section describes how to include big data as exogenous variables in the GBM and provides its mathematical formulation.
The mathematical formulation of the conventional GBM is as follows:
where p denotes an innovation coefficient referring to external influences such as advertising, and q denotes an imitation coefficient that refers to internal influences such as WOM. In the generalized model, is “current marketing effort”, which refers to all marketing mix variables such as product price and expenditure on marketing advertisement over time t, and m represents market potential (saturation level). is the cumulative function describing the proportion of those adopting at time t, and is the density function of .
Bass et al. [3] defined as shown in Equation (2), where and are the current price and level of advertising expenditure at time t.
In Equation (2), and are percent changes in price and advertising at time t, and the coefficients and represent how sensitive the diffusion process is to price and advertising. If is greater than 1, the timing of adoption will be accelerated. Otherwise, the adoption timing will be delayed. Equation (3) defines cumulative market effort from periodic market effort .
Here, m represents market potential (saturation level), which is constant and not influenced directly by the marketing efforts. The , which represents exogenous variables, is included in the model as a proportional change form. According to Mahajan et al. [43], this form could eliminate redtrend and mitigate spurious regression.
We modify from Equation (2) to Equation (5) by replacing conventional variables (e.g., price and advertisement expenditure) with big data and HPI. Referring to the literature [3,44], we measure the percent change of each type of big data and include the changes in . For example, means the percent change of search traffic volume at time t, and is its corresponding parameter. We use the Nonlinear Least Squares (NLS) method to estimate the parameters in the model [45].
To address the hypotheses, we develop six models, summarized in Table 1, by configuring variables in Equation (5). We evaluate the prediction accuracy of each model with the aim of clarifying the contribution of variables to improving the model’s prediction power.

Table 1.
Models associated with hypotheses.
The first hypothesis is verified through the comparison between Model 1, which has only HPI, and the others that include big data. To validate the second hypothesis, we compare Model 2 with the Models 3, 4, and 5. Finally, comparing Model 3 and the Model 4 is considered for the last hypothesis.
4. Empirical Analysis
4.1. Data Collection
We obtained the HPI as a proxy measure for Korean house prices from the Korea Appraisal Board (KAB) (http://www.kab.co.kr/kab/home/main/main.jsp). The monthly RM sales volume in Korea was obtained from the Korea Housing Finance Corporation (HF). We collected web-news and blog post volumes by crawling entire web pages related to the RMs from NAVER (http://www.naver.com/), the dominant domestic portal site in Korea. In 2017, a survey (http://www.internettrend.co.kr/) reported that the market shares of the NAVER portal and NAVER blogosphere were about 80% and 66%, respectively. In addition to its market dominance, we believe that elderly Koreans, who are potential RM subscribers, would prefer to use NAVER, while other social media could be more attractive for younger generations. Accordingly, much literature has used NAVER instead of considering other social media such as Facebook or Twitter in their analysis of user-generated contents in the context of the Korean market [46,47,48]. Meanwhile, we used Google Trends (http://www.google.com/trends) to obtain search traffic volume, which was not available in NAVER. We compiled the data for the period from July 2007 to June 2017, and the data used for analysis are summarized in Table 2. We used R software version 3.6.1 to collect, process, and analyze the data.
Table 2.
Summary of data sources.
The level of data aggregation is well known to be important in fitting the S-shaped Bass curve [49,50]. A high level of data aggregation removes or reduces the seasonality and random fluctuation in time-series data. However, we may fail to capture the characteristics of the original data if we aggregate the data too coarsely. We conducted a series of preliminary analyses to determine the level of data aggregation that minimizes the prediction error without losing the characteristics. We compared three levels of data aggregation (i.e., monthly, quarterly, and yearly) by measuring prediction accuracy, MAPE (Mean Absolute Percentage Error, %). The test results shown in Table 3 revealed that quarterly data provided stable and reliable performance in the model. Based on this observation, we aggregated the monthly data into quarterly data for the last part of this paper.
Table 3.
The level of data aggregation and prediction error.
4.2. Big Data Analysis
This paper relies on the assumption that big data such as web-news and blog post volumes are highly associated with the sales volume, so the use of big data improves the prediction power. However, collecting and analyzing the data that represents consumers’ interest well with respect to Korea’s RM market is a challenging task. In this section, we describe how we collected the data, and statistical analysis follows to validate the association between big data and the sales volume of Korean RMs over time.
Table 4 summarizes the overall procedures of analyzing web-news and blog post volumes. The first step is to collect text-based documents by crawling web pages that contain the keyword ‘JooTaek-YeonKeum’, which means reverse mortgage in Korean, in their titles. The initial crawling process resulted in 3923 documents.
Table 4.
Procedures for data collection.
Next, we preprocessed the documents by removing stop words and repeated documents in the second step. The word ‘JooTaek-YeonKeum’ is linguistically classified as a compound noun that consists of two nouns, ‘JooTaek’ and ‘YeonKeum’. Thus, some documents crawled on the web contain either just ‘JooTaek’ or just ‘YeonKeum’ in the title, and these are highly likely to be unrelated to ‘JooTaek-YeonKeum’. We removed 241 documents from the initial 3923.
Much literature has widely used TF–IDF (Term Frequency–Inverse Document Frequency) to generate term vectors [51,52,53,54]. However, unlike prior literature, this paper simply used a Document–Term matrix to include every document containing the word ‘JooTaek-YeonKeum’ and to enrich the term vectors.
Based on the Document–Term matrix, applying association rule mining to the term vectors found terms that were closely associated with ‘JooTaek-YeonKeum’ in the documents. With 277 words having high term frequencies, the association rule mining provided a complete set of 16,665 rules that satisfied and thresholds of 0.35 and 0.9, respectively. Although many research efforts have been devoted to finding an optimal threshold [55], we arbitrarily determined the minimum thresholds based on the analysis results. We then used these rules to identify a set of 11 keywords strongly associated with the RMs (i.e., JooTaek-YeonKeum): Subscription, collateral, after retirement, living, loan, payment, guaranty, increase, ownership, capital, and new. In Step 4, we re-crawled web pages that contain at least ‘JooTaek-YeonKeum’ and one out of the 11 keywords. We finally used 9652 documents to measure monthly volumes of web-news and blog posts related to Korea’s RM.
The search traffic volume was obtained by using Google Trends (http://www.google.com/trends/), which enabled us to determine the popularity of query terms over time on Google. Google Trends adjusts search traffic volumes by normalizing the query data on a scale of 0–100 to allow for comparisons over time. The absolute search traffic volume is not available at Google Trends, but the GBM only requires the relative change rate in the volume over time. We expect that using normalized data on search traffic volume would be successful for the GBM context, and we used the results for the query ‘JooTaek-YeonKeum’.
Figure 1 illustrates the changes in sales volume and big data in the period from 2007 to 2017 and shows the association between the two. In particular, the volumes of web-news and blog posts behaved similarly to the sales volume over time. To statistically validate the associations, we conducted correlation analysis, as summarized in Table 5. The results statistically prove that the sales volume has significant and positive correlations with other variables that represent big data. Therefore, we conclude that it is worth considering big data as a part of the GBM so as to improve the accuracy of predicting sales volumes.
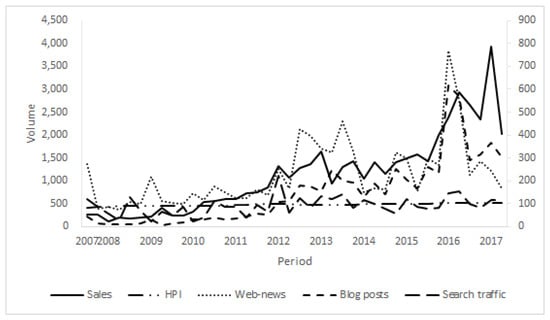
Figure 1.
Trends in sales volume and big data.
Table 5.
Correlation analysis.
Despite the representative nature of big data, the high correlation between variables, as shown in Table 5, is highly likely to incur multi-collinearity in the further analysis. To address this issue, we employ principle component analysis (PCA), which enables a lower-dimensional representation without a significant loss of information. We performed PCA on the big data variables, which are highly correlated, so that these variables are projected to a lower-dimensional subspace. Table 6 and Table 7 summarize the results, which show that over 98% of the variance in the data was explained by the first component of the PCA. Thus, Models 5 and 6 are estimated with a single parameter representing the UGC and all three types of big data, respectively.
Table 6.
Principle components: Blog post and search traffic volumes.
Table 7.
Principle components: Blog post, search traffic, and web-news volumes.
4.3. Estimation of Parameters
We estimated the parameters in Equation (1) and Equation (4) by using NLS, which has outstanding performance over other parameter estimation methods, such as MLE (Maximum Likelihood Estimation) [45]. The model becomes less stable when there are many parameters to estimate within it [17]. Therefore, it is preferred to estimate parameters separately, if possible, to improve the stability. Much literature has used several methods to estimate market potential (i.e., parameter m) and considered the estimate of m as a fixed value. For example, some authors referred to the sizes of similar markets [56,57], used Delphi methods to compile experts’ opinions [58,59], or surveyed groups of consumers [60,61].
There has been no product that is similar to the RMs in Korea. Moreover, referring to the RM market in other countries is inappropriate because of their differing economic and policy structures. To ensure more stable results, this work thus independently and separately estimated the market saturation of the Korean RMs by employing our previous work [62]. The steps for estimating the market saturation m are summarized in Table 8. The proposed method consists of two main steps. The first is to find the eligible borrowers. Second, we estimate potential market size by applying consumers’ preference for the Korean RMs to the pool of eligible borrowers.
Table 8.
Market Potential Estimation Procedure.
In Step 1, we specified the eligible borrowers under assumptions of Korea’s current RM regulation with no changes on the planning horizon. The current regulation is that homeowners over age 60 are regarded as eligible borrowers. The problem is, however, that populations are not deterministic but continue to change over time, and the dynamics in population structure should be considered; for example, the population at the age of 50 in 2017 is expected to be eligible in the year 2027. To address this issue, we used birth and death rates for each age group and estimated the population size at various times in the future. The analysis showed that the potential market will be saturated in 2027, and no more significant changes in the potential market size m are observed after 2027. From 2017 to 2027, the annual average growth rate of the potential market size is estimated to be 2.21%. However, we expect that the growth rate will significantly drop to 0.1% for the next 10 years, from 2027 to 2037. Therefore, we set a ten-year forecasting horizon from 2017 to 2027 [62].
We referred to the literature [63,64] to determine consumers’ preference for Korea’s RM. The literature reports that about 11.2% to 17.2% of eligible borrowers are willing to subscribe to Korea’s RM, so we estimated the potential market size to be between 605,888 and 930,471 in 2027.
Based on the estimate of potential market size m, we apply NLS to estimate the parameters in the proposed GBMs. Table 9 summarizes the results of the parameter estimations, which show the statistical significance of big data variables. This statistical significance supports that considering big data enables us to better understand the diffusion of the Korean RMs. As described previously, Models 5 and 6 used the first principal component and have only one coefficient at a time that represents several big data variables.
Table 9.
Coefficients of parameters.
The coefficient of HPI () is negative, which means that higher house prices decrease sales volumes of Korean RMs. However, all three types of big data have a positive association with the sales volume; , , and all have positive values.
4.4. Evaluation Results
To measure the prediction accuracy of the proposed models in Section 3.2, we used MAPE, RMSE (Root Mean Square Error), and MAE (Mean Absolute Error). Table 10 shows the prediction accuracy of each model. Using the results of MAPE, we achieved the best prediction accuracy when we included blog post volumes in the prediction model (i.e., Model 3). However, Model 4, which included search traffic, outperformed the other models, especially in RMSE and MAE. Model 1 with only HPI and without big data provided the lowest prediction accuracy. Comparing the performance of Model 1 with those of the other models supported the first hypothesis: Using big data in the GBM improves the accuracy of predicting the Korean RM sales.
Table 10.
Prediction accuracy in each model.
The results revealed that the models utilizing blog post and/or search traffic volumes had better prediction accuracy than that of Model 2 with web-news volume. Big data on UGC provided better information on the diffusion of the Korean RMs than did big data on MGC.
Regarding Hypothesis 3, Model 3 had lower MAPE but higher RMSE and MAE than those of Model 4. This comparison concludes that the prediction accuracy differed by the data type, although both blog post and search traffic volumes are classified as UGC. More interestingly, Model 5 and Model 6 point out that adding more types of big data does not always guarantee better performance. We summarize the findings for each hypothesis in Table 11.
Table 11.
Summary of hypotheses.
5. Sensitivity Analysis
In the previous section, we showed that using big data improved prediction accuracy. In addition, empirical analysis represented that UGC is more effective than MGC in improving prediction accuracy. Based on these results, we consider that increasing the volume of big data could expedite sales growth. Therefore, the purpose of this section is to evaluate which type of big data is the most influential on sales growth. To address this problem, we conducted a series of sensitivity analyses by varying three exogenous big data variables (i.e., search traffic, blog post, and web-news volumes) and observed the changes in the sales volume.
We first developed six test scenarios by varying the average annual growth rates for three big data volumes. The baseline scenario assumes that there is no change in the current average growth rates: 1.09% for web-news, 1.13% for blog posts, and 1.09% for search traffic. The optimistic scenarios assume that the average annual growth rates would increase by 2% from the current level. Similarly, the pessimistic scenarios assume that these average annual growth rates would decrease by 2%. We consider blog posts and search traffic volumes together because they are both classified as UGC. Table 12 summarizes the six test scenarios.
Table 12.
Test scenarios.
Figure 2 illustrates the sensitivity analysis results for two test scenarios: Test scenario 1 and the baseline scenario. The results show that any increase (or decrease) in big data volume resulted in increased (or decreased) sales volume. To investigate the effects of each big data type in detail, this paper changes the average annual growth rates for each big data type individually and compares these results with those for the baseline scenario.

Figure 2.
Test results: Baseline scenario and Test scenario 1.
In addition to the baseline scenario, we ran scenarios in which we modified the growth rate of web news volume while fixing those of blog post and search traffic volumes (Test scenario 3). The results given in Figure 3 show little difference in the Bass diffusion curves for the three test scenarios, which indicates that the changes in web-news volume had insignificant influences on consumers’ adoption of Korea’s RM.
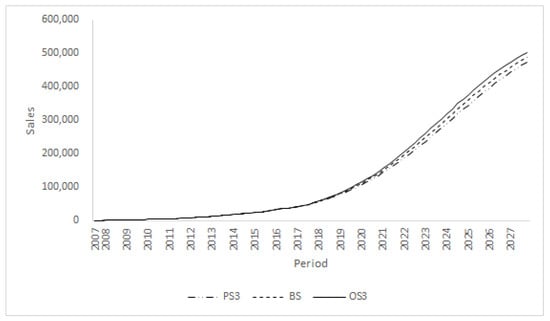
Figure 3.
Test results: Baseline scenario and Test scenario 3.
To evaluate the effects of UGC, we compare the baseline scenario with Test scenario 2, in which we changed the annual growth rates of search traffic and blog post volumes but fixed the web-news volume at the current level. Figure 4 shows the sensitivity analysis results. We found that changing the blog post and search traffic volumes significantly moved the Bass diffusion curve from the baseline scenario. For example, the gap between PS2 and OS2 reached about 81,125 in the fourth quarter of 2027.
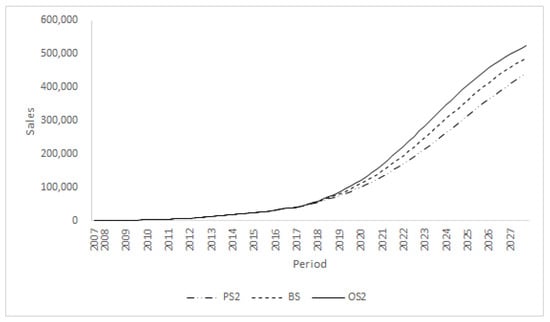
Figure 4.
Test results: Baseline scenario and Test scenario 2.
Figure 4 closely resembles Figure 2, and this comparison provides an interesting finding. The UGC (i.e., blog post and search traffic volumes) is more important for promoting the sales volume than web-news volume, MGC. This finding supports the findings of Kim and Hanssens [8], who emphasized the importance of UGC.
Finally, we investigated which type of UGC is more effective for promoting the sales volume. For this purpose, we developed Test scenarios 4 and 5, where the average growth rate of either blog post volume or search traffic volume is modified. Figure 5 shows the test results, but we observed no significant difference between the two test scenarios. This means that RM sales volume is sensitive to either blog post volume or search traffic volume, but the difference is ignorable.
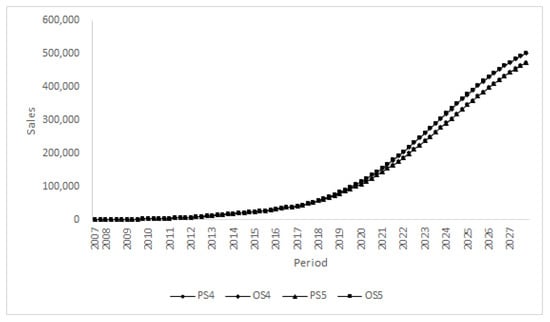
Figure 5.
Test results: Test scenarios 4 and 5 (PS4, OS4, PS5, OS5).
6. Conclusions
With this paper, we investigated whether big data can be used effectively to predict the sales of RMs in Korea by applying the GBM. To evaluate the effects of utilizing big data, we compared prediction accuracy between an economic variable (i.e., HPI) and big data variables in forecasting RM sales. Similarly to previous studies, this paper classified big data into two measurements to reflect consumers’ purchase decisions: MGC and UGC.
We compared the prediction accuracy of each model. First, we found that big data was more effective in predicting RM sales than was the HPI, which is a proxy of an economic variable. All big data variables showed relatively low MAPE, which indicates that big data variables can be used to predict the RM sales in Korea. Second, we found that UGC was a greater influence on the choice of Korean reverse mortgages than was MGC. This suggests that predicting RM sales would be improved by incorporating consumers’ search traffic and blog post behaviors. Finally, the prediction accuracy differs by the types of UGC. This result showed that both blog post and search traffic volumes do effectively measure domestic consumers’ interest in Korea’s RM. This finding suggests that the Korean government should consider information generation activities by consumers besides promotion, advertising, and so on.
Based on the sensitivity analysis results, we can infer that predicting the choice to subscribe to an RM depends on the changes in big data volumes. We set a variety of scenarios based on our hypotheses, and each scenario showed different RM sales volumes along the planning horizon. That is, the big data volumes affect the market penetration rate. However, changing web-news volume had little impact on RM sales, whereas increasing UGC accelerated the adoption of RMs. Thus, increased blog post and search traffic volumes could expand the sales volume of Korean reverse mortgages.
Finally, UGC volumes had greater impact on RM sales volume. This implies that UGC is key for forecasting RM sales. If the Korean government wants to manage the future sales of Korean RMs, it needs to properly use web-news, blog post, and search traffic volumes. In particular, the Korean government should recognize the synergic effects between blog posts and search traffic. Although it is difficult for the Korean government to control big data volumes, they could manage the RM diffusion rate by monitoring changes in consumers’ information search behavior.
In this study, we evaluated the effects of big data in predicting the sales of reverse mortgages in Korea. In addition, we demonstrated that big data improves prediction accuracy in terms of forecasting market penetration of Korea’s RMs using a GBM. However, opportunities for future research remain. For instance, we did not conduct any sentiment analysis of web-news or blog posts. We could consider the valences of these variables in future research to build a more elaborate model.
Author Contributions
J.Y. has been responsible for methodology and the first draft of the manuscript. D.M. has critically revised the manuscript. J.K. has collected the data by crawling web pages. All authors have read and agreed to the published version of the manuscript.
Funding
This research received no external funding
Conflicts of Interest
The authors declare no conflict of interest.
References
- Bass, F.M. A new product growth for model consumer durables. Manag. Sci. 1969, 15, 215–227. [Google Scholar] [CrossRef]
- Turk, T.; Trkman, P. Bass model estimates for broadband diffusion in European countries. Technol. Forecast. Soc. Chang. 2012, 79, 85–96. [Google Scholar] [CrossRef]
- Bass, F.M.; Krishnan, T.V.; Jain, D.C. Why the bass model fits without decision variables. Mark. Sci. 1994, 13, 203–223. [Google Scholar] [CrossRef]
- Horsky, D.; Simon, L.S. Advertising and the diffusion of new products. Mark. Sci. 1983, 2, 1–17. [Google Scholar] [CrossRef]
- Jain, D.C.; Rao, R.C. Effect of price on the demand for durables: Modeling, estimation, and findings. J. Bus. Econ. Stat. 1990, 8, 163–170. [Google Scholar]
- Robinson, B.; Lakhani, C. Dynamic price models for new-product planning. Manag. Sci. 1975, 21, 1113–1122. [Google Scholar] [CrossRef]
- Jin, X.; Wah, B.W.; Cheng, X.; Wang, Y. Significance and challenges of big data research. Big Data Res. 2015, 2, 59–64. [Google Scholar] [CrossRef]
- Kim, H.; Hanssens, D.M. Advertising and word-of-mouth effects on pre-launch consumer interest and initial sales of experience products. J. Interact. Mark. 2017, 37, 57–74. [Google Scholar] [CrossRef]
- Kim, J.J. A Study on Determinants of Changes in Reverse Mortgage Demand and the Policy Implications. Seoul Inst. 2013, 14, 13–33. [Google Scholar]
- Oh, S.H. Policy challenges for activating reverse mortgage programs. Health Welfare Forum 2017, 247, 92–104. [Google Scholar]
- Kim, S.; Woo, Y. A study on factors of housing pension application for housing-based welfare in the era of aging society. J. Soc. Sci. 2016, 18, 79–94. [Google Scholar]
- Shan, H. Reversing the trend: The recent expansion of the reverse mortgage market. Real Estate Econ. 2011, 39, 743–768. [Google Scholar] [CrossRef]
- Kim, C.; Kim, E.; Jeong, S. A study on the house price assumptions for house-based annuities. Korea Real Estate Acad. Rev. 2015, 65, 166–179. [Google Scholar]
- Anenberg, E.; Laufer, S. A more timely house price index. Rev. Econ. Stat. 2017, 99, 722–734. [Google Scholar] [CrossRef]
- Wu, F.S.; Chu, W.L. Diffusion models of mobile telephony. J. Bus. Res. 2010, 63, 497–501. [Google Scholar] [CrossRef]
- Frank, L.D. An analysis of the effect of the economic situation on modeling and forecasting the diffusion of wireless communications in Finland. Technol. Forecast. Soc. Chang. 2004, 71, 391–403. [Google Scholar] [CrossRef]
- Lee, C.Y.; Huh, S.Y. Forecasting the diffusion of renewable electricity considering the impact of policy and oil prices: The case of South Korea. Appl. Energy 2017, 197, 29–39. [Google Scholar] [CrossRef]
- Qian, L.; Soopramanien, D. Incorporating heterogeneity to forecast the demand of new products in emerging markets: Green cars in China. Technol. Forecast. Soc. Chang. 2015, 91, 33–46. [Google Scholar] [CrossRef]
- Danaher, P.J.; Hardie, B.G.; Putsis, W.P., Jr. Marketing-mix variables and the diffusion of successive generations of a technological innovation. J. Market. Res. 2001, 38, 501–514. [Google Scholar] [CrossRef]
- Boehner, R.; Gold, S.C. Modeling the impact of marketing mix on the diffusion of innovation in the generalized bass model of firm demand. Dev. Bus. Simulat. Experient. Learn. 2012, 39, 75–91. [Google Scholar]
- Guidolin, M.; Mortarino, C. Cross-country diffusion of photovoltaic systems: modelling choices and forecasts for national adoption patterns. Technol. Forecast. Soc. Chang. 2010, 77, 279–296. [Google Scholar] [CrossRef]
- Yamaguchi, Y.; Akai, K.; Shen, J.; Fujimura, N.; Shimoda, Y.; Saijo, T. Prediction of photovoltaic and solar water heater diffusion and evaluation of promotion policies on the basis of consumers’ choices. Appl. Energy 2013, 102, 1148–1159. [Google Scholar] [CrossRef]
- Wang, W.; Yu, N.; Johnson, R. A model for commercial adoption of photovoltaic systems in California. J. Renew. Sustain. Energy 2017, 9, 025904. [Google Scholar] [CrossRef]
- Lee, W.S.; Choi, H.S.; Sohn, S.Y. Forecasting new product diffusion using both patent citation and web search traffic. PLoS ONE 2018, 13, e0194723. [Google Scholar] [CrossRef]
- Kim, D.; Woo, J.; Shin, J.; Lee, J.; Kim, Y. Can search engine data improve accuracy of demand forecasting for new products? Evidence from automotive market. Ind. Manag. Data Syst. 2019, 119, 1089–1103. [Google Scholar] [CrossRef]
- Fan, Z.P.; Che, Y.J.; Chen, Z.Y. Product sales forecasting using online reviews and historical sales data: A method combining the Bass model and sentiment analysis. J. Bus. Res. 2017, 74, 90–100. [Google Scholar] [CrossRef]
- Goel, S.; Hofman, J.M.; Lahaie, S.; Pennock, D.M.; Watts, D.J. Predicting consumer behavior with web search. Proc. Natl. Acad. Sci. USA 2010, 107, 17486–17490. [Google Scholar] [CrossRef]
- Du, R.Y.; Kamakura, W.A. Quantitative trendspotting. J. Mark. Res. 2012, 49, 514–536. [Google Scholar] [CrossRef]
- Kulkarni, G.; Kannan, P.; Moe, W. Using online search data to forecast new product sales. Decis. Support Syst. 2012, 52, 604–611. [Google Scholar] [CrossRef]
- Onishi, H.; Manchanda, P. Marketing activity, blogging and sales. Int. J. Res. Mark. 2012, 29, 221–234. [Google Scholar] [CrossRef]
- Hassani, H.; Silva, E.S. Forecasting energy data with a time lag into the future and Google trends. Int. J. Energy Stat. 2016, 4, 1650020. [Google Scholar] [CrossRef]
- Choi, H.; Varian, H. Predicting the present with Google Trends. Econ. Record 2012, 88, 2–9. [Google Scholar] [CrossRef]
- Hand, C.; Judge, G. Searching for the picture: forecasting UK cinema admissions using Google Trends data. Appl. Econ. Lett. 2012, 19, 1051–1055. [Google Scholar] [CrossRef]
- Du, R.Y.; Hu, Y.; Damangir, S. Leveraging trends in online searches for product features in market response modeling. J. Mark. 2015, 79, 29–43. [Google Scholar] [CrossRef]
- Ettredge, M.; Gerdes, J.; Karuga, G. Using web-based search data to predict macroeconomic statistics. Commun. ACM 2005, 48, 87–92. [Google Scholar] [CrossRef]
- Ginsberg, J.; Mohebbi, M.H.; Patel, R.S.; Brammer, L.; Smolinski, M.S.; Brilliant, L. Detecting influenza epidemics using search engine query data. Nature 2009, 457, 1012. [Google Scholar] [CrossRef]
- Chumnumpan, P.; Shi, X. Understanding new products’ market performance using Google Trends. Aust. Mark. J. (AMJ) 2019, 27, 91–103. [Google Scholar] [CrossRef]
- Gopinath, S.; Chintagunta, P.K.; Venkataraman, S. Blogs, advertising, and local-market movie box office performance. Manag. Sci. 2013, 59, 2635–2654. [Google Scholar] [CrossRef]
- Cooper, C.; Mallon, K.; Leadbetter, S.; Pollack, L.; Peipins, L. Cancer internet searcha activity on a major search engine, United States 2001-2003. J. Med. Internet Res. 2005, 7. [Google Scholar] [CrossRef]
- Liang, X. Mining associations between web stock news volumes and stock prices. Int. J. Syst. Sci. 2006, 37, 919–930. [Google Scholar] [CrossRef]
- Berger, J.; Milkman, K.L. What makes online content viral? J. Mark. Res. 2012, 49, 192–205. [Google Scholar] [CrossRef]
- Bobkowski, P.S. Sharing the news: Effects of informational utility and opinion leadership on online news sharing. Journal. Mass Commun. Q. 2015, 92, 320–345. [Google Scholar] [CrossRef]
- Mahajan, V.; Muller, E.; Wind, Y. New-Product Diffusion Models; Kluwer Academic Publisher: Boston, MA, USA, 2000. [Google Scholar]
- Simon, H. ADPULS: An advertising model with wearout and pulsation. J. Mark. Res. 1982, 19, 352–363. [Google Scholar] [CrossRef]
- Srinivasan, V.; Mason, C.H. Nonlinear least squares estimation of new product diffusion models. Mark. Sci. 1986, 5, 169–178. [Google Scholar] [CrossRef]
- Park, S.; Ko, M.; Kim, J.; Liu, Y.; Song, J. The politics of comments: predicting political orientation of news stories with commenters’ sentiment patterns. In Proceedings of the ACM 2011 Conference on Computer Supported Cooperative Work, Hangzhou, China, 19–23 March 2011; pp. 113–122. [Google Scholar]
- Sung, M.; Hwang, J.S. Who drives a crisis? The diffusion of an issue through social networks. Comp. Hum. Behav. 2014, 36, 246–257. [Google Scholar] [CrossRef]
- Yang, J.S.; Ko, M.S.; Chung, K.S. Social emotional opinion decision with newly coined words and emoticon polarity of social networks services. Future Internet 2019, 11, 165. [Google Scholar] [CrossRef]
- Heeler, R.M.; Hustad, T.P. Problems in predicting new product growth for consumer durables. Manag. Sci. 1980, 26, 1007–1020. [Google Scholar] [CrossRef]
- Wright, M.; Upritchard, C.; Lewis, T. A validation of the bass new product diffusion model in New Zealand. Mark. Bull. Dep. Mark. Massey Univ. 1997, 8, 15–29. [Google Scholar]
- Bilgin, M.; Köktaş, H. Sentiment analysis with term weighting and word vectors. Int. Arab. J. Inf. Technol. 2019, 16, 953–959. [Google Scholar]
- Christian, H.; Agus, M.P.; Suhartono, D. Single document automatic text summarization using term frequency-inverse document frequency (TF-IDF). ComTech Comp. Math. Eng. Appl. 2016, 7, 285–294. [Google Scholar] [CrossRef]
- Fauzi, M.A.; Arifin, A.Z.; Yuniarti, A. Arabic book retrieval using class and book index based term weighting. Int. J. Electr. Comp. Eng. (IJECE) 2017, 7, 3705–3710. [Google Scholar] [CrossRef]
- Qazi, A.; Goudar, R. An ontology-based term weighting technique for web document categorization. Proc. Comp. Sci. 2018, 133, 75–81. [Google Scholar] [CrossRef]
- Coenen, F.; Leng, P. The effect of threshold values on association rule based classification accuracy. Data Knowl. Eng. 2007, 60, 345–360. [Google Scholar] [CrossRef][Green Version]
- Goodwin, P.; Dyussekeneva, K.; Meeran, S. The use of analogies in forecasting the annual sales of new electronics products. IMA J. Manag. Math. 2013, 24, 407–422. [Google Scholar] [CrossRef]
- Jun, S.P.; Sung, T.E.; Park, H.W. Forecasting by analogy using the web search traffic. Technol. Forecast. Soc. Chang. 2017, 115, 37–51. [Google Scholar] [CrossRef]
- Thomas, R.J. Forecasting new product market potential: Combining multiple methods. J. Prod. Innov. Manag. 1987, 4, 109–119. [Google Scholar] [CrossRef]
- Rowe, G.; Wright, G. The delphi technique as a forecasting tool: issues and analysis. Int. J. Forecast. 1999, 15, 353–375. [Google Scholar] [CrossRef]
- Bass, F.M.; Gordon, K.; Ferguson, T.L.; Githens, M.L. DIRECTV: Forecasting diffusion of a new technology prior to product launch. Interfaces 2001, 31, 82–S93. [Google Scholar] [CrossRef]
- Jian, L.; Yongqiang, Z.; Hyoungmi, K. The potential and economics of EV smart charging: A case study in Shanghai. Energy Policy 2018, 119, 206–214. [Google Scholar] [CrossRef]
- Yang, J.; Min, D.; Choi, H. Long-term projection of demand for reverse mortgage using the bass diffusion model in Korea. J. Korean Operat. Res. Manag. Sci. Soc. 2017, 42, 29–41. [Google Scholar]
- Annual Report 2008: Korea Housing Finance Survey and Research; Korea Housing Finance Corporation: Busan, Korea, 2008.
- Annual Report 2010: Korea Housing Finance Survey and Research; Korea Housing Finance Corporation: Busan, Korea, 2010.
© 2020 by the authors. Licensee MDPI, Basel, Switzerland. This article is an open access article distributed under the terms and conditions of the Creative Commons Attribution (CC BY) license (http://creativecommons.org/licenses/by/4.0/).