Article

Multi-Scale Evaluation of Suzhou City’s Sustainable Development Level Based on the Sustainable Development Goals Framework

1
School of Geographic and Oceanographic Sciences, Nanjing University, Nanjing 210023, China
2
Key Laboratory of Coastal Zone Exploitation and Protection, Ministry of Natural Resources, Nanjing 210023, China
*
Author to whom correspondence should be addressed.
Sustainability 2020, 12(3), 976; https://doi.org/10.3390/su12030976
Submission received: 16 December 2019 / Revised: 16 January 2020 / Accepted: 24 January 2020 / Published: 29 January 2020
(This article belongs to the Section Sustainable Urban and Rural Development)

Abstract

:
A sustainable development system involves resource limitation, environmental stress and policy regulation, and the flow and integration of resources and factors on a multi-level spatial scale. However, it is difficult to meet the actual needs of local development through traditional single-scale and macro-scale evaluation of the comprehensive level. Taking Suzhou City as an example, based on the United Nations (UN) sustainable development goals (SDGs) framework, the entropy method and fuzzy comprehensive evaluation (FCE) were used to construct an evaluation index system of the municipal sustainable development level. Growth and obstacles of the sustainable development system and its subsystems were systematically analyzed on a multi-level spatial scale. Results show that during the study period (2000-2016), the sustainable development system in Suzhou was relatively low at the beginning of the study. With the passage of time, it generally developed in a stable, continuous, and balanced direction. The levels of development, deficiencies, and obstacle factors of sustainable development systems and their subsystems are significantly different between levels; especially during the study period, the order change between towns is significantly higher than the order change between districts. Within an evaluation unit, there is a process of rising and continuing growth among certain subsystems, but some subsystems have been developing slowly due to resource constraints, environmental load, etc., or their contribution to the level of sustainable development has remained low. The city sustainable development evaluation index system based on the SDGs framework can meet the requirements of regional assessment and has the potential for further promotion and use. The evaluation results can provide a necessary reference for the subsystem coordination, scale linkage, and resource space allocation of the sustainable development system in Suzhou.

1. Introduction

With rapid socio-economic development, rapid population growth [1], and resource over-exploitation and utilization [2], the problems of ecological environment destruction and imbalanced development are increasingly apparent [3,4,5,6]; global, national, and regional sustainable development research has become an important topic and hot issue facing the world today [7,8]. The 2030 Agenda for Sustainable Development, adopted at the 2015 UN Summit, set out 17 Sustainable Development Goals (SDGs). SDGs are the continuation and expansion of seven Millennium Development Goals (MDGs) of the 2000 United Nations Millennium Declaration to eradicate extreme poverty and hunger, universal primary education, promote gender equality and empower women, reduce child mortality, improve maternal health, fight HIV, ensure environmental sustainability, and promote global cooperation. The Chinese Government has supported and implemented the 17 SDGs targets for 2030, and, based on the contents of the 2030 Agenda for Sustainable Development, and combining past achievements and experience, it has formulated the China National Program for Implementation of the 2030 Agenda for Sustainable Development, and supports local governments in typical regions conduct pilot experiments.
The academic community has made positive progress in sustainable development research. From the perspective of research, it mainly focuses on the connotation of sustainable development and the effects and analysis of socio-economic development [9]. From the perspective of system theory, sustainable development can be defined as a system that is able to achieve its development goals in a state of internal balance and maintain human survival needs at the same time [10,11]. Sustainable development involves many aspects of resources, society, and economy, and the state of the entire system is affected by its internal developmental balance [12]. Many researchers have analyzed the connotation of sustainable development from the perspectives of ecological stability, resource security, and anti-interference [13,14,15]. Similarly, Brown pointed out that through effective control of population expansion and resource protection, the efficiency of renewable energy development and utilization has been improved [16]. Other typical studies include: based on the understanding of the agricultural system’s impact on the environment, proposing technical methods to make food systems meet the needs of sustainable development in the future [17]; exploring the relationship between human stress and reduced biodiversity [18]; and study the impact of dietary habits on agricultural greenhouse gas emissions [19]. From the perspective of research scales, it is mainly concentrated on global, intercontinental, and national macro-scales [20,21,22,23].
On the whole, although domestic and foreign scholars have carried out a lot of research on the theory of sustainable development, there are still some problems that need to be further deepened. (1) The municipal level is the "top-down" management of China’s departments, the formulation of social and economic development policies; it is an important level of implementation, but there is a lack of research and analysis on the comprehensive measurement of sustainable development level and analysis of the internal development process of the sustainable development system within the city; (2) there are correlations and differences between spatial scales, involving resources, factor flows, and integration processes. The current research, however, is mostly focused on a single spatial scale, and research on multi-level spatial scales needs to be improved; (3) current international and national development policies and situations are changing, and new research theory is needed for quantitative measurement of sustainable development.
The need emerges for appropriate method to support evaluation of the sustainability for internal systems at different scales, from local to global [24]. Since faced with different social-economic-environmental conditions, the existing SDGs framework on the national scale cannot be applied directly to local scale. There are some connections and differences between national scales and local scales, however. For example, whether at national scale or at local scale, SDG2 (Zero hunger), SDG3 (Good health & Well-being) should be pay more attention to; different from formal similarity, SDG17 (Partnerships for the goals) must be an important goal at national scale, but it may not be the goal which should take into consideration at local scale. Besides, the SDGs may be checked and measured more and more clearly, and they can be transformed into indicators. The indicators can provide important information for policy making in a variety of way at a certain extent [25,26,27]. Moreover, a series of aggregated indicators may make a more representative and concise index, and the composite index can present more targeted and effect information than individual indicators [28]. Therefore, based on the SDGs framework, constructing the evaluation index system of sustainable development at the local scale is good for linking problems of different scales and helping to achieve national goals.
Suzhou City plays a leading role in the economic and social development of the Yangtze River Delta Economic Zone and the Yangtze River Economic Belt. Although the city is typical in terms of economic growth mode, urban construction expansion, infrastructure support, and industrial space layout, Suzhou City is facing multiple forms of pressure from the economic structural upgrades, urban–rural differences, resource constraints, and environmental pressure. In light of these challenges, this study took Suzhou City as an example to construct a city-wide sustainable development evaluation index system based on the UN SDGs framework, combined with the entropy method and the fuzzy comprehensive evaluation method, from multiple time nodes and multiple scales of a sustainable development system. The overall system and its internal subsystem developmental characteristics were evaluated, and then the advantages, bottlenecks, and key issues of regional development at different temporal and spatial scales were analyzed.

2. Materials and Methods
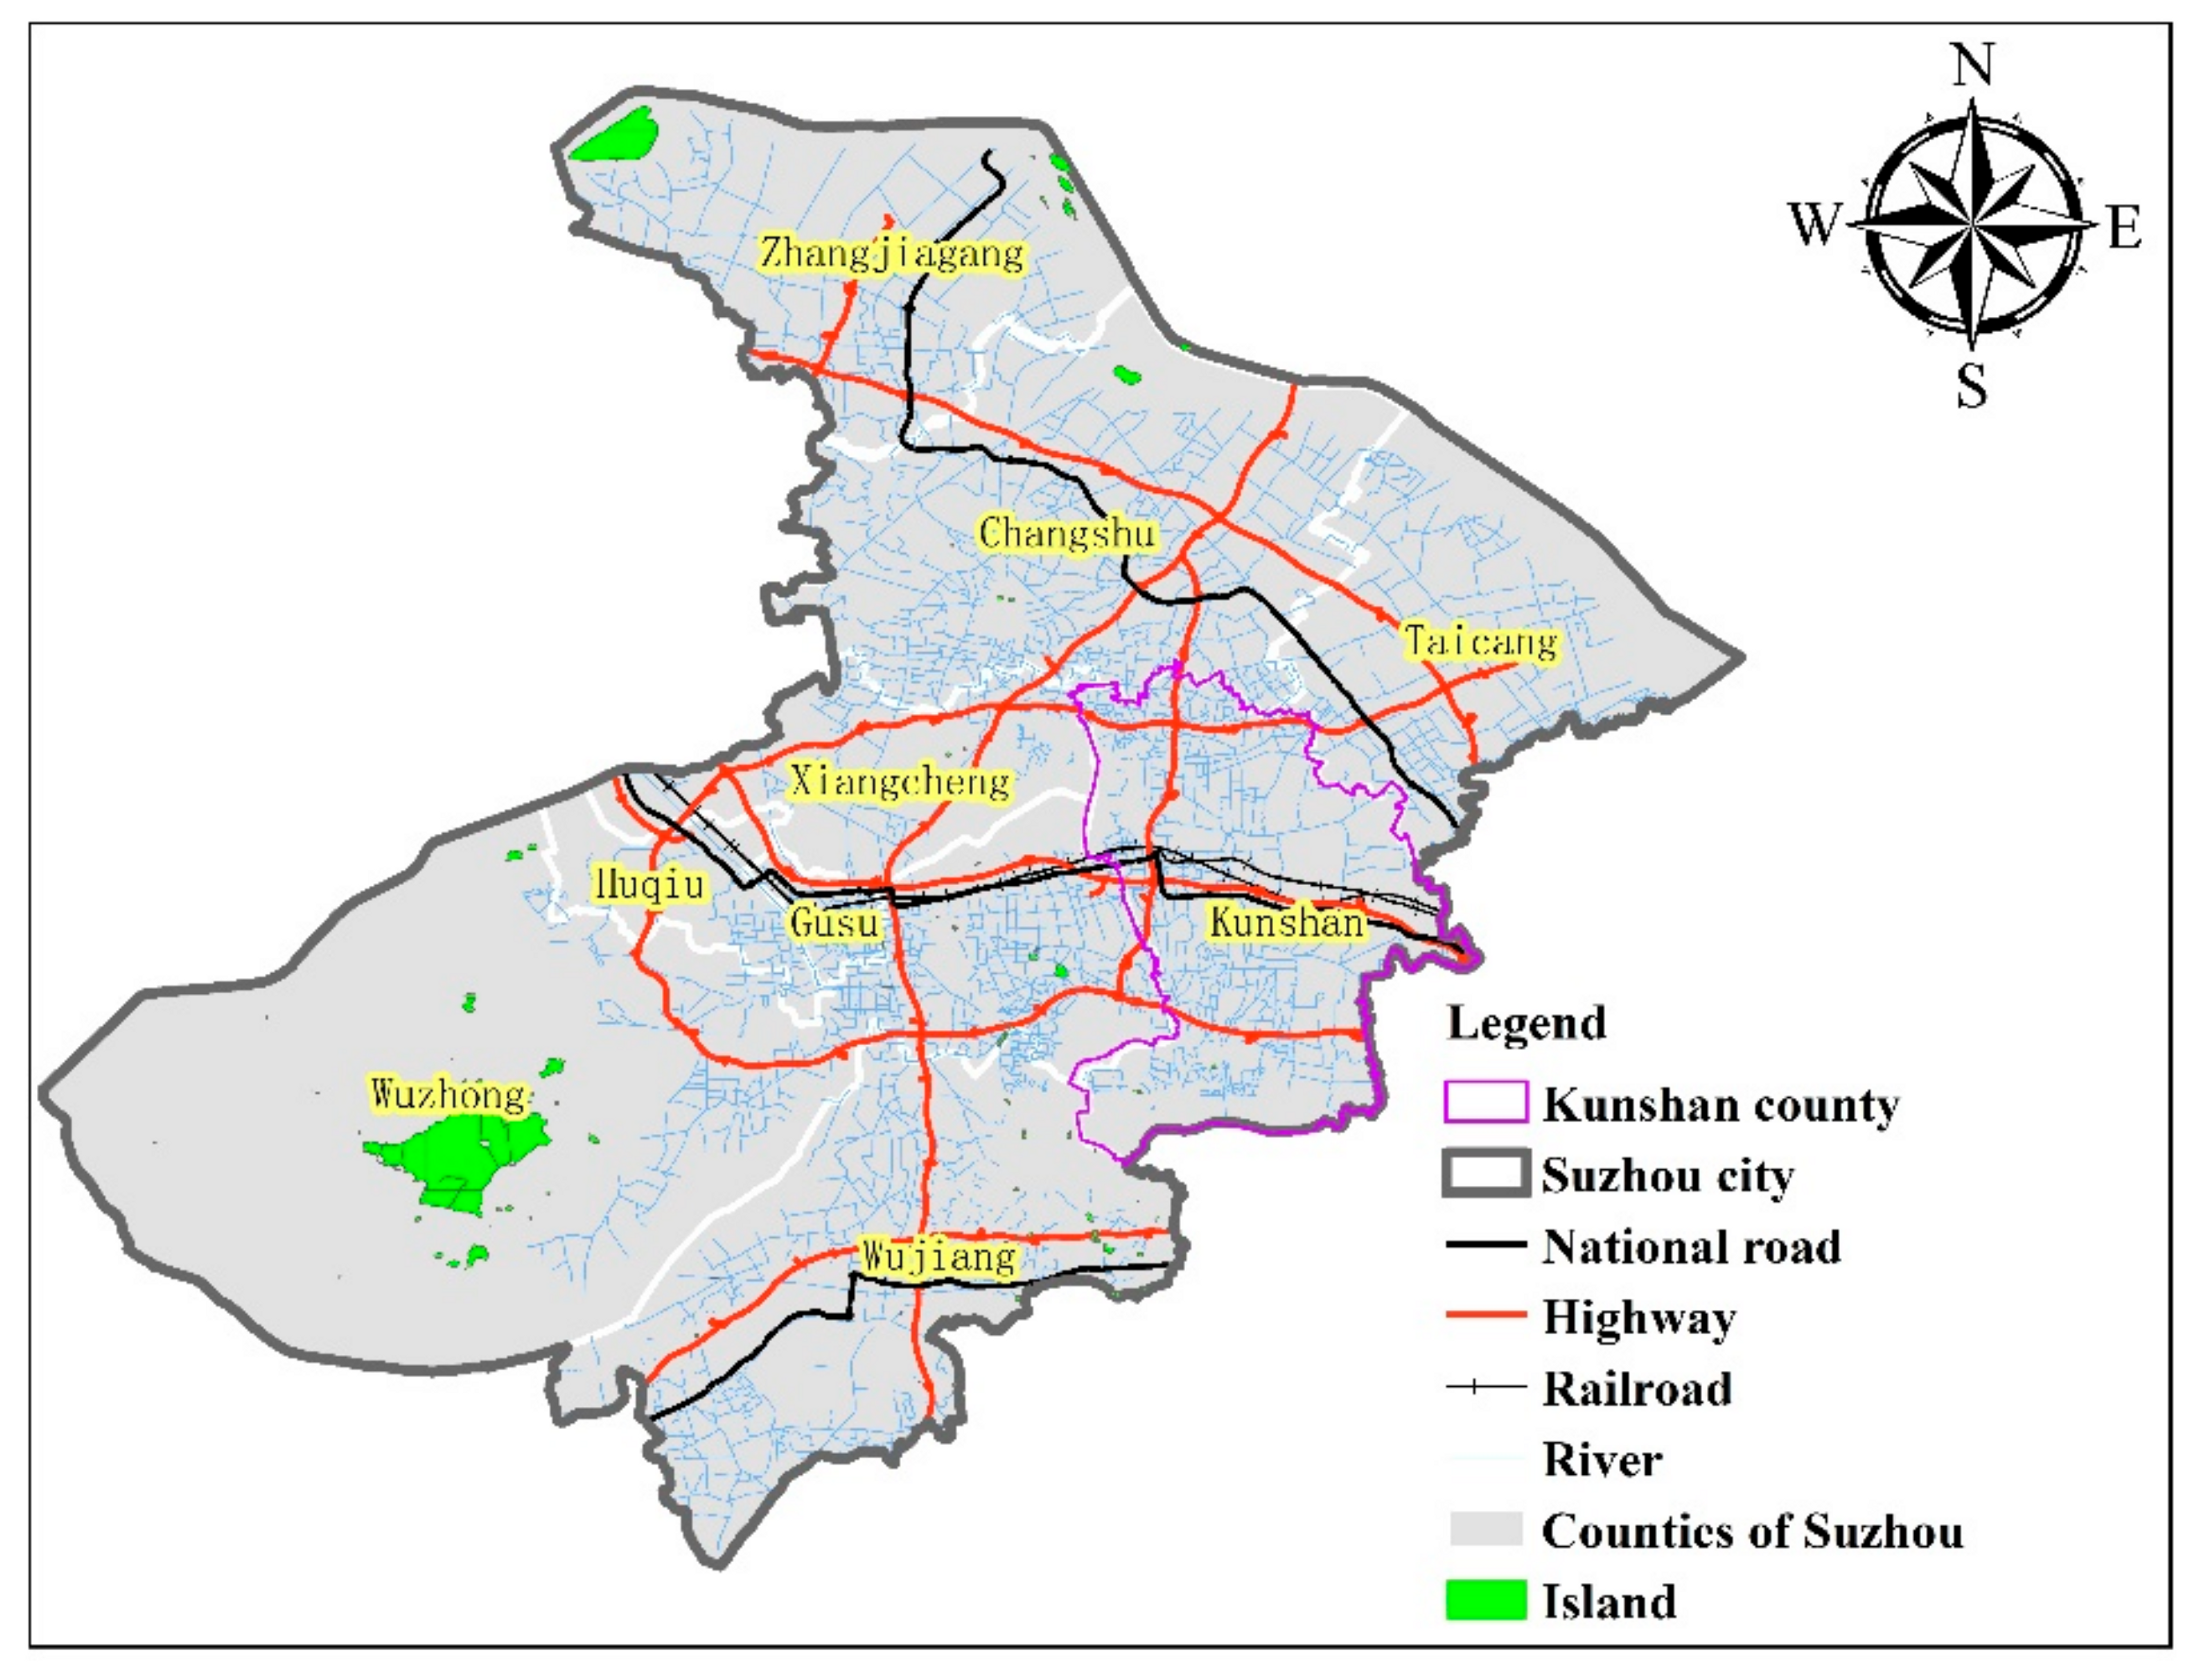
2.1. Study Area

Suzhou City is located in the lower reaches of the Yangtze River, adjacent to China’s largest modern city (Shanghai City), between 119°55′–121°20′ east longitude and 30°47′–32°2′ north latitude. It has five districts (Zhengcheng, Huqiu, Gusu, Wuzhong, and Wujiang), and four county-level cities (Zhangjiagang, Changshu, Taicang, and Kunshan) (Figure 1). Among them, Kunshan has 10 towns: Bacheng, Zhoushi, Yushan, Zhangpu, Lujia, Huaqiao, Qiandeng, Dianshanhu, Jinxi, and Zhouzhuang. Suzhou City has a land area of 8488 square km, with an average elevation of 3 to 4 m. The plain area accounts for 55% of the total land area. It has a subtropical maritime monsoon climate with four distinct seasons. The annual average precipitation is 1100 mm, and the annual average temperature is 15.7 °C. Its frost-free period is about 220 d. In 2017, the total population of Suzhou City was 10.684 million, and the urbanization rate was nearly 80%.
Suzhou is a typical economic development model of the "Southern Jiangsu Model", a typical city in China that starts with township and village enterprises. Its economic development has gone through three stages. The first stage (1980s–1990s) was an economic development model led by township enterprises, and the transition from an agricultural economy to an industrial economy; the second stage (1990s–early 2000s) was an export-oriented economic development model driven by foreign investment, and the transition from a closed economy to an open economy; the third stage (since the early 2000s), mainly featuring structural adjustment and an export-oriented economy, took the form of an open economy, a private economy, and a new pattern of economies of scale with independent intellectual property rights. Because of the rapid development of the social economy, the urban construction land area of Suzhou City increased from 108.61 square kilometers to 702.44 square kilometers from 2001–2016, and the land development intensity exceeded 28%, which is close to the internationally recognized limit for livable city land development intensity (30%).

2.2. Construction of the Index System

2.2.1. Principle of Construction

The level of sustainable development is difficult to obtain directly through observation, and a certain method is needed to quantitatively evaluate it. Constructing an indicator system is one of its important ways. Currently, sustainable development measures have different criteria for evaluation in different countries or regions. For example, the UK government has adopted five categories of indicators: sustainable production and consumption, climate change and energy resources, natural resources and environment, sustainable development of communities, and world equality. The US Environmental Protection Agency has adopted 12 indicators: education, economy, environment, government, residence, health, population, public safety, entertainment, society, resource utilization, and human beings [29]. Although there are differences in the selection of indicators, they usually follow certain principles [30]. The purpose of this study was to serve the assessment objectives of sustainable development in the study area. Based on existing studies [31], we aligned our study with four basic principles (comprehensive principles, genetic principles, predictive principles, and quantifiable principles) to build a city’s sustainable development evaluation index system [32]. The four principles were as follows:
(1)
Comprehensive Principle. The comprehensive principle generally regards regional development as an organic whole or system and mainly focuses on the detailed identification of the similarities and differences between elements within the system. Under the guidance of this principle, it was not advisable or necessary to reflect all the elements involved in regional development in the sustainable development evaluation index system. This principle advocates comprehensively and specifically analyzing the potential underlying factors of sustainable development through comprehensive analysis in order to reveal the dominant factors and the possible limiting factors affecting sustainable development.
(2)
Principle of Genesis. Genesis is mainly about the origin and processes related to this origin. The principle of genesis primarily explores the internal factors of system development and focuses on the causes and processes of the development of things. According to this principle, when constructing a sustainable development evaluation index system, attention needs to be paid to factors of intergenerational fairness that involve time, and factors of regional differences that involve space.
(3)
Principle of Anticipation. Indicators cannot be selected in isolation from international, national, and local realities, and local feasible development goals should also be considered in the future.
(4)
Principle of Quantifiability. The elements within the sustainable development system feature temporal and spatial variation, which often presents characteristics of uncertainty, randomness and non-linearity. Although traditional qualitative analysis can reflect the relevant information of the sustainable development system to a certain extent, it is still insufficient to accurately assess the level of sustainable development in the region. The quantifiable principle requires that the indicators involved in sustainable development evaluation can be directly quantified or indirectly assigned. The quantified results of the indicators can be used for accurate analysis, comparison and evaluation of sustainable development systems, and then make up for the limitations shown by qualitative analysis.

2.2.2. Index System Framework

The construction and reasonable measurement of the evaluation index system is an important basis for system analysis and evaluation. The theoretical system of sustainable development evaluation involves several research fields (e.g., resource environment and social economy), and its composition methods are also diverse. The theory system of sustainable development evaluation involves a wide range (including resources, environment, socio-economics, etc.), and there are a variety of methods. If simply listing and superimposing all the indicators increases the workload, the accuracy of the evaluation results may be affected [26]. Recently, some scholars have successfully achieved a comprehensive evaluation on the sustainable development level on the national scale based on the SDGs framework (17 targets and 169 indices) and dozens of indices collected by different countries [33]. This study intends to draw on this research method and other existing studies [34,35], based on the SDGs framework and combined with local actual conditions, and builds indicator systems. In principle, the core representative indicators that meet the local conditions are screened and the indicators are localized (Table 1). Moreover, the regional development was regarded as an organic system with reference to the traditional method of evaluating the regional development level. Since there is usually a relationship between multiple indices, and these indices often contribute to the same subsystem within the system, the indices were integrated into three subsystems (social, economic, and environmental subsystems) during the process of evaluating the level of regional sustainable development in the past. As a typical prefecture-level city in China, Suzhou City faces a series of policies and concepts, such as rural revitalization, innovation drive, and intensive use of resources, raising new and higher requirements for relevant exploration within the sustainable development system. In view of this, this study intended to further divide the index system on the basis of traditional social, economic, and environmental subsystems into the following six subsystems: resource conservation, ecological environment, economic growth, social livelihood, innovation drive, and rural development. The subsystems were characterized by the resource conservation index, ecological protection index, economic growth index, quality of life improvement index, scientific and technological progress index, and rural development index (Table 1).

2.3. Definition of Evaluation Unit

In the process of dividing administrative units, the natural, social, and economic states of all districts and towns in Suzhou have both certain commonalities and certain differences. Through detailed analysis of the resource subsystem, ecological environment subsystem, social and people’s livelihood subsystem, economic subsystem, innovation driving subsystem and rural development subsystem in the three spatial dimensions of prefecture-level cities, districts (county-level cities) and township levels. Research on the city sustainable development evaluation index system. When calibrating the evaluation unit, the Suzhou Industrial Park in Wuzhong District and the Kunshan Development Zone in Kunshan City were not included in the analysis. The reason is that the former two are industrial parks with special policies, which have relatively concentrated industries and good economic benefits; land development tends to be saturated.

2.4. Data Sources and Processing

2.4.1. Data Sources

The socioeconomic data used in this study were mainly derived from the data search website CNKI (https://www.cnki.net) and relevant government departments. The data sources included local statistical bulletins including the Suzhou Statistical Yearbook, Changshu Statistical Yearbook, Zhangjiagang Statistical Yearbook, Kunshan Statistical Yearbook, Taicang Statistical Yearbook, Wujiang Statistical Yearbook, Wuzhong Statistical Yearbook, Xiangcheng Statistical Yearbook, Gusu Statistical Yearbook, and Huqiu Statistical Yearbook. They also included investigative data obtained by the author from the government office, the development and reform commission, the commission of the economy and information technology, the planning bureau, and the natural resource department of different districts and counties of Suzhou City and the towns and villages of Kunshan City from June 2018–March 2019.
The data were collected per the index system and then checked and corrected one by one based on how detailed the data were. Because of the great number of indices and the large time span, as well as many administrative districts and administrative departments and the differences in their functions, deviations occurred between the data of various departments. Thus, it was necessary to identify and select valid data. If some of the data failed to meet the evaluation requirements, approximate indices were collected to replace the data [26].

2.4.2. Data Standardization

The larger the value of the positive index, the more significant the dominant feature is; the larger the value of the reverse index, the less significant the dominant feature is; as for the fit index, the closer the index value is to a certain value, the more significant the dominant feature is. Since the dimensions between different indices are not the same, the dimensions cannot be directly compared, making them difficult to be used for comprehensive evaluation. Hence, the standard method is generally used to convert the absolute value of the index into a dimensionless relative value, so that the indices can be compared directly. In this study, the commonly used range standardization method [36] was used to process the sustainability evaluation indices, as follows:
For positive indices:
A i j = X i j min X i j max X i j min X i j
For inverse indices:
A i j = max X i j X i j max X i j min X i j
where X i j represents the value of the jth sample of the ith index, A i j denotes the value of normalized X i j , max X i j represents the maximum value of X i j , and min X i j stands for the minimum value of X i j . The values of all the standardized indices ranged from 0 to 1.

2.5. Methods

2.5.1. Entropy Method

Weight is an important hub for comprehensive evaluation after connecting multiple indicators. Reasonable allocation of weight is important for multi-index analysis and is an important step for comprehensive evaluation. At present, the widely used weight assignment methods are more common, such as the principal component analysis method and expert scoring method. Among them, the principal component analysis method, analytic hierarchy process, and expert method depend to a large extent on human cognition and lack of objective performance; the entropy method can effectively avoid subjectivity when artificially determining index weights [37,38]. This study uses the entropy method to measure the contribution of sustainable development evaluation indicators.
As a mathematical method, the entropy method evaluates the discreteness of indicators. As the dispersion degree increases, the impact of the indicators in the comprehensive evaluation phase becomes increasingly significant. In information theory, entropy is a measurement of uncertainty. According to the characteristics of entropy, we can judge the randomness and degree of disorder of an event by calculating the entropy value. The entropy value can also be used to judge the dispersion degree of an index. The greater the dispersion degree of an index, the greater the impact of this index on comprehensive evaluation is. Therefore, according to the variation degree of various indices, the information entropy could be used to calculate the weight of each indicator, providing a basis for comprehensive evaluation of multiple indicators. The larger the entropy value, the stronger the variability of the indicator and the greater the role it plays in the evaluation [38,39]
The specific steps of the entropy method were as follows:
(1)
Standardize the index values according to the direction of the positive and negative development of the indices;
(2)
Calculate the proportion of the jth index of the evaluated object i:
Z i j = x i j / i = 1 n x i j
(3)
Calculate the information entropy value of the jth index:
e j = 1 l n n i = 1 n Z i j l n Z i j
(4)
Calculate the information entropy utility value of the jth index:
g j = 1 e j
(5)
Calculate the weight of the jth index:
w j = g j / j = 1 m g j
It is worth noting that since this study involved many spatial scales, such as municipal level, county level, and town level, there were similarities and differences between different regions in terms of the natural, social, and economic conditions. The contribution of resource conservation, ecological protection, economic growth, improvement of people’s livelihood, rural development, and scientific and technological progress to the sustainable development levels may have varied in different areas. Therefore, when assessing the level of sustainable development in a city, the entropy method is used to determine the weights of the indicators for sustainable development on three spatial scales: city, district (county-level city), and town.

2.5.2. Comprehensive Evaluation of Sustainable Development

Based on the basic idea of fuzzy comprehensive evaluation (FCE) method, the entropy method was applied in this study to determine the weight and form the entropy-fuzzy comprehensive evaluation method, which was then used to evaluate the sustainable development level of Suzhou City.
The fuzzy comprehensive evaluation method enables fuzzy indexes to meet the quantitative requirements by constructing different levels of fuzzy subsets [40]. From the actual development situation, each index or factor exerted a certain impact on the FCE method. Mainly based on the fuzzy data analysis method, the FCE method understood the actual influence of different events; then, the layer-by-layer recursion method was used to calculate the final target value. The core feature of natural language is a certain degree of ambiguity. Generally, fuzzy events cannot be processed with special thinking logic. Instead, they need to be processed using interval values, while ensuring that the objective description needs are met accordingly [41]. The core idea of the FCE method is to achieve the best model factor conversion effect on the premise of understanding factors and evaluation level factors [42]. The FCE method uses a multi-layer composite operation method to determine the level of the final object. The specific steps used in the study were as follows:
(1)
Determine the domain of discourse of the evaluated object and construct the set of participating factors, U. The single factor was expressed as u i ( i = 1, 2, 3, …, m); if there were m indices, the set of participating factors could be expressed as U = {u1∣u2∣……∣um}.
(2)
Establish the evaluation set V. The domain of discourse of the evaluation level was determined as V j (j = 1, 2, …, n), and the level set was expressed as V = {v1∣v2∣……∣ v n }.
(3)
Determine the membership function and calculate the membership degree of each factor. Here, r i j is the membership degree of the factor u i to v j , and the single moving speed evaluation set of the i th moving speed u i could be expressed as r i j = (ri1, ri2, …, r i n ).
(4)
Construct a fuzzy relation matrix. Matrix R corresponds to the element r i j in the ith row and the jth column, which represents the frequency distribution state of the i th factor u i in the jth comment V j , and 1 n r i j = 1 .
R = r i j m × n = r 11 r 12 r 1 n r 21 r 22 r 2 n r m 1 r m 2 r m n   i = 1 , 2 ,   ,   m ;   j = 1 , 2 ,   ,   n
(5)
Determine the weight vector of the evaluation factor. The weight was determined by the entropy method, and the weights of the factors were combined into a set expressed as W= (w1, w2, …, wm). The element w i contained in the weight vector, W, denotes the membership degree for factor u i to be divided into a fuzzy set. The weight is the importance of each index, and the sum of the index weights is 1; that is, i = 1 m w i = 1 , wi ≥ 0 ( i = 1,2, …, m).
(6)
Measure the level of sustainable development. Based on the results about the fuzzy membership, the indices were synthesized, with corresponding results expressed as vector B. The equation was as follows:
B = W × R = W 1   /   W 2   /   /   W m × r 11 r 12 r 1 n r 21 r 22 r 2 n r m 1 r m 2 r m n = b 1 b 2 b m

3. Results

Based on the constructed city sustainable development evaluation index system, and combined with the entropy-fuzzy comprehensive evaluation method, the target years (2000, 2005, 2010, 2016) were calculated to obtain different spatial scales (prefecture-level city scales, districts (counties), and town) in Suzhou City. The level and process of the sustainable development system and its subsystems were described.

3.1. Sustainable Development Level on Prefecture Scale

Figure 2 and Table 2 show the evaluation results of Suzhou City’s sustainable development level in each target year. On the whole, from 2000–2016, Suzhou City’s sustainable development showed a steady and sustained growth trend. However, there were similarities and differences between the performance of the sustainability subsystems at different times. The similarity lay in the growing trend of the resource conservation index, ecological protection index, economic growth index, livelihood improvement index, scientific and technological progress index, and rural development index. The difference was manifested in the difference between the growth rate and speed of each index. Moreover, the contribution of each index to the sustainable development system varied from one target year to another.
Comparing the contribution of each index to the level of sustainable development in the same period, the results show that: at the beginning of the study (2000), the contributions of the economic growth index and the ecological protection index to the level of sustainable development were in the first and second places, respectively, and technological progress The contribution of the index and rural development index to the level of sustainable development is small. In 2005 and 2010, the contribution of the people’s livelihood improvement index exceeded the economic growth index and ecological protection index, and the contribution of the scientific and technological progress index remained low. In 2016, the contribution of the people’s livelihood improvement index still ranked first, the contribution of the rural development index exceeded the economic growth index, and the contribution of the resource conservation index was significantly lower.
Comparing the growth differences of the indexes at the same time, the results show that: from 2000 to 2005, the improvement of the people’s livelihood index and the rural development index was the largest, and the economic growth index was the smallest; from 2005 to 2010, the rural development index had the largest increase, and The increase of the protection index was the smallest; from 2010 to 2016, the improvement of the people’s livelihood index was the most obvious, and the increase of the ecological protection index was still small. From the perspective of the entire research period (2000-2016), the growth rate is: Livelihood Improvement Index (0.21)> Rural Development Index (0.15)> Science and Technology Progress Index (0.10)> Economic Growth Index (0.08)> Resource Conservation Index (0.07 > Ecological protection index (0.03).
Comparing the growth differences of the same index at different time periods, the results show that: the level of sustainable development reached the largest in 2010-2016; the improvement index of the people’s livelihood and the rural development index increased the most in 2000-2005, and the two in the last two The economic growth index and the scientific and technological progress index increased the most in 2005-2010; the resource conservation index increased the most in 2010-2016; and the ecological protection index did not change significantly in the three time periods.

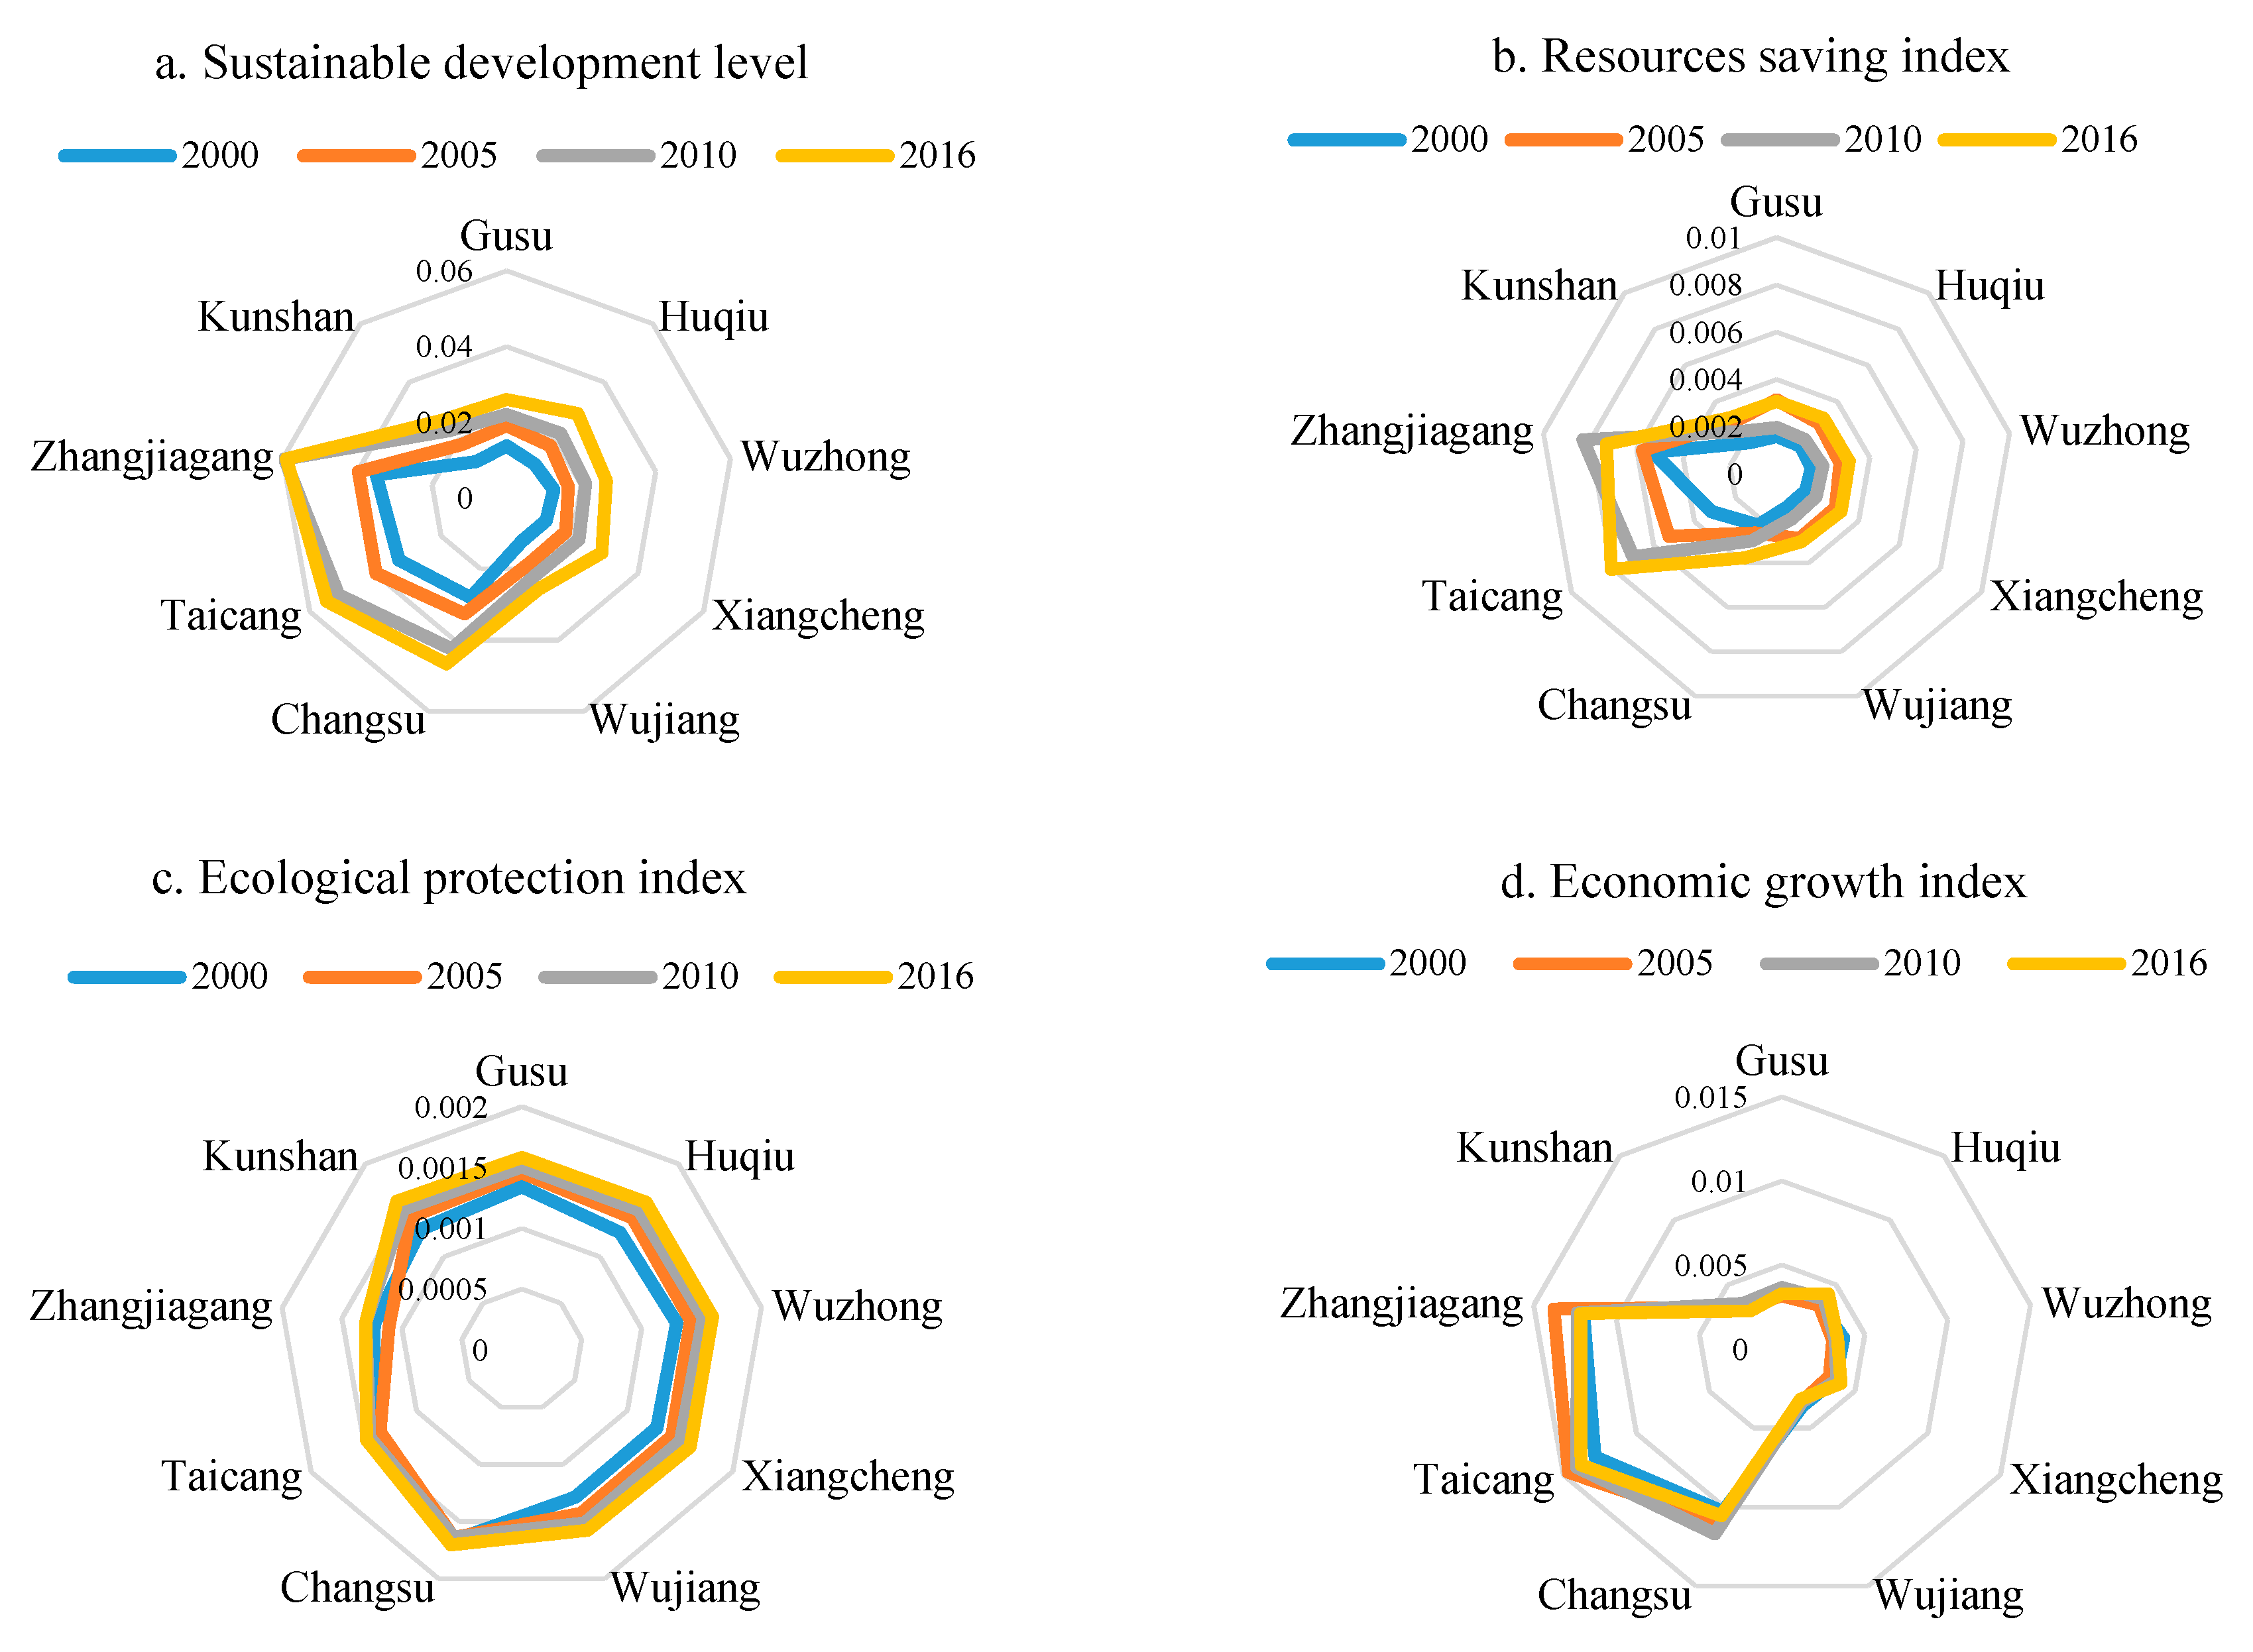
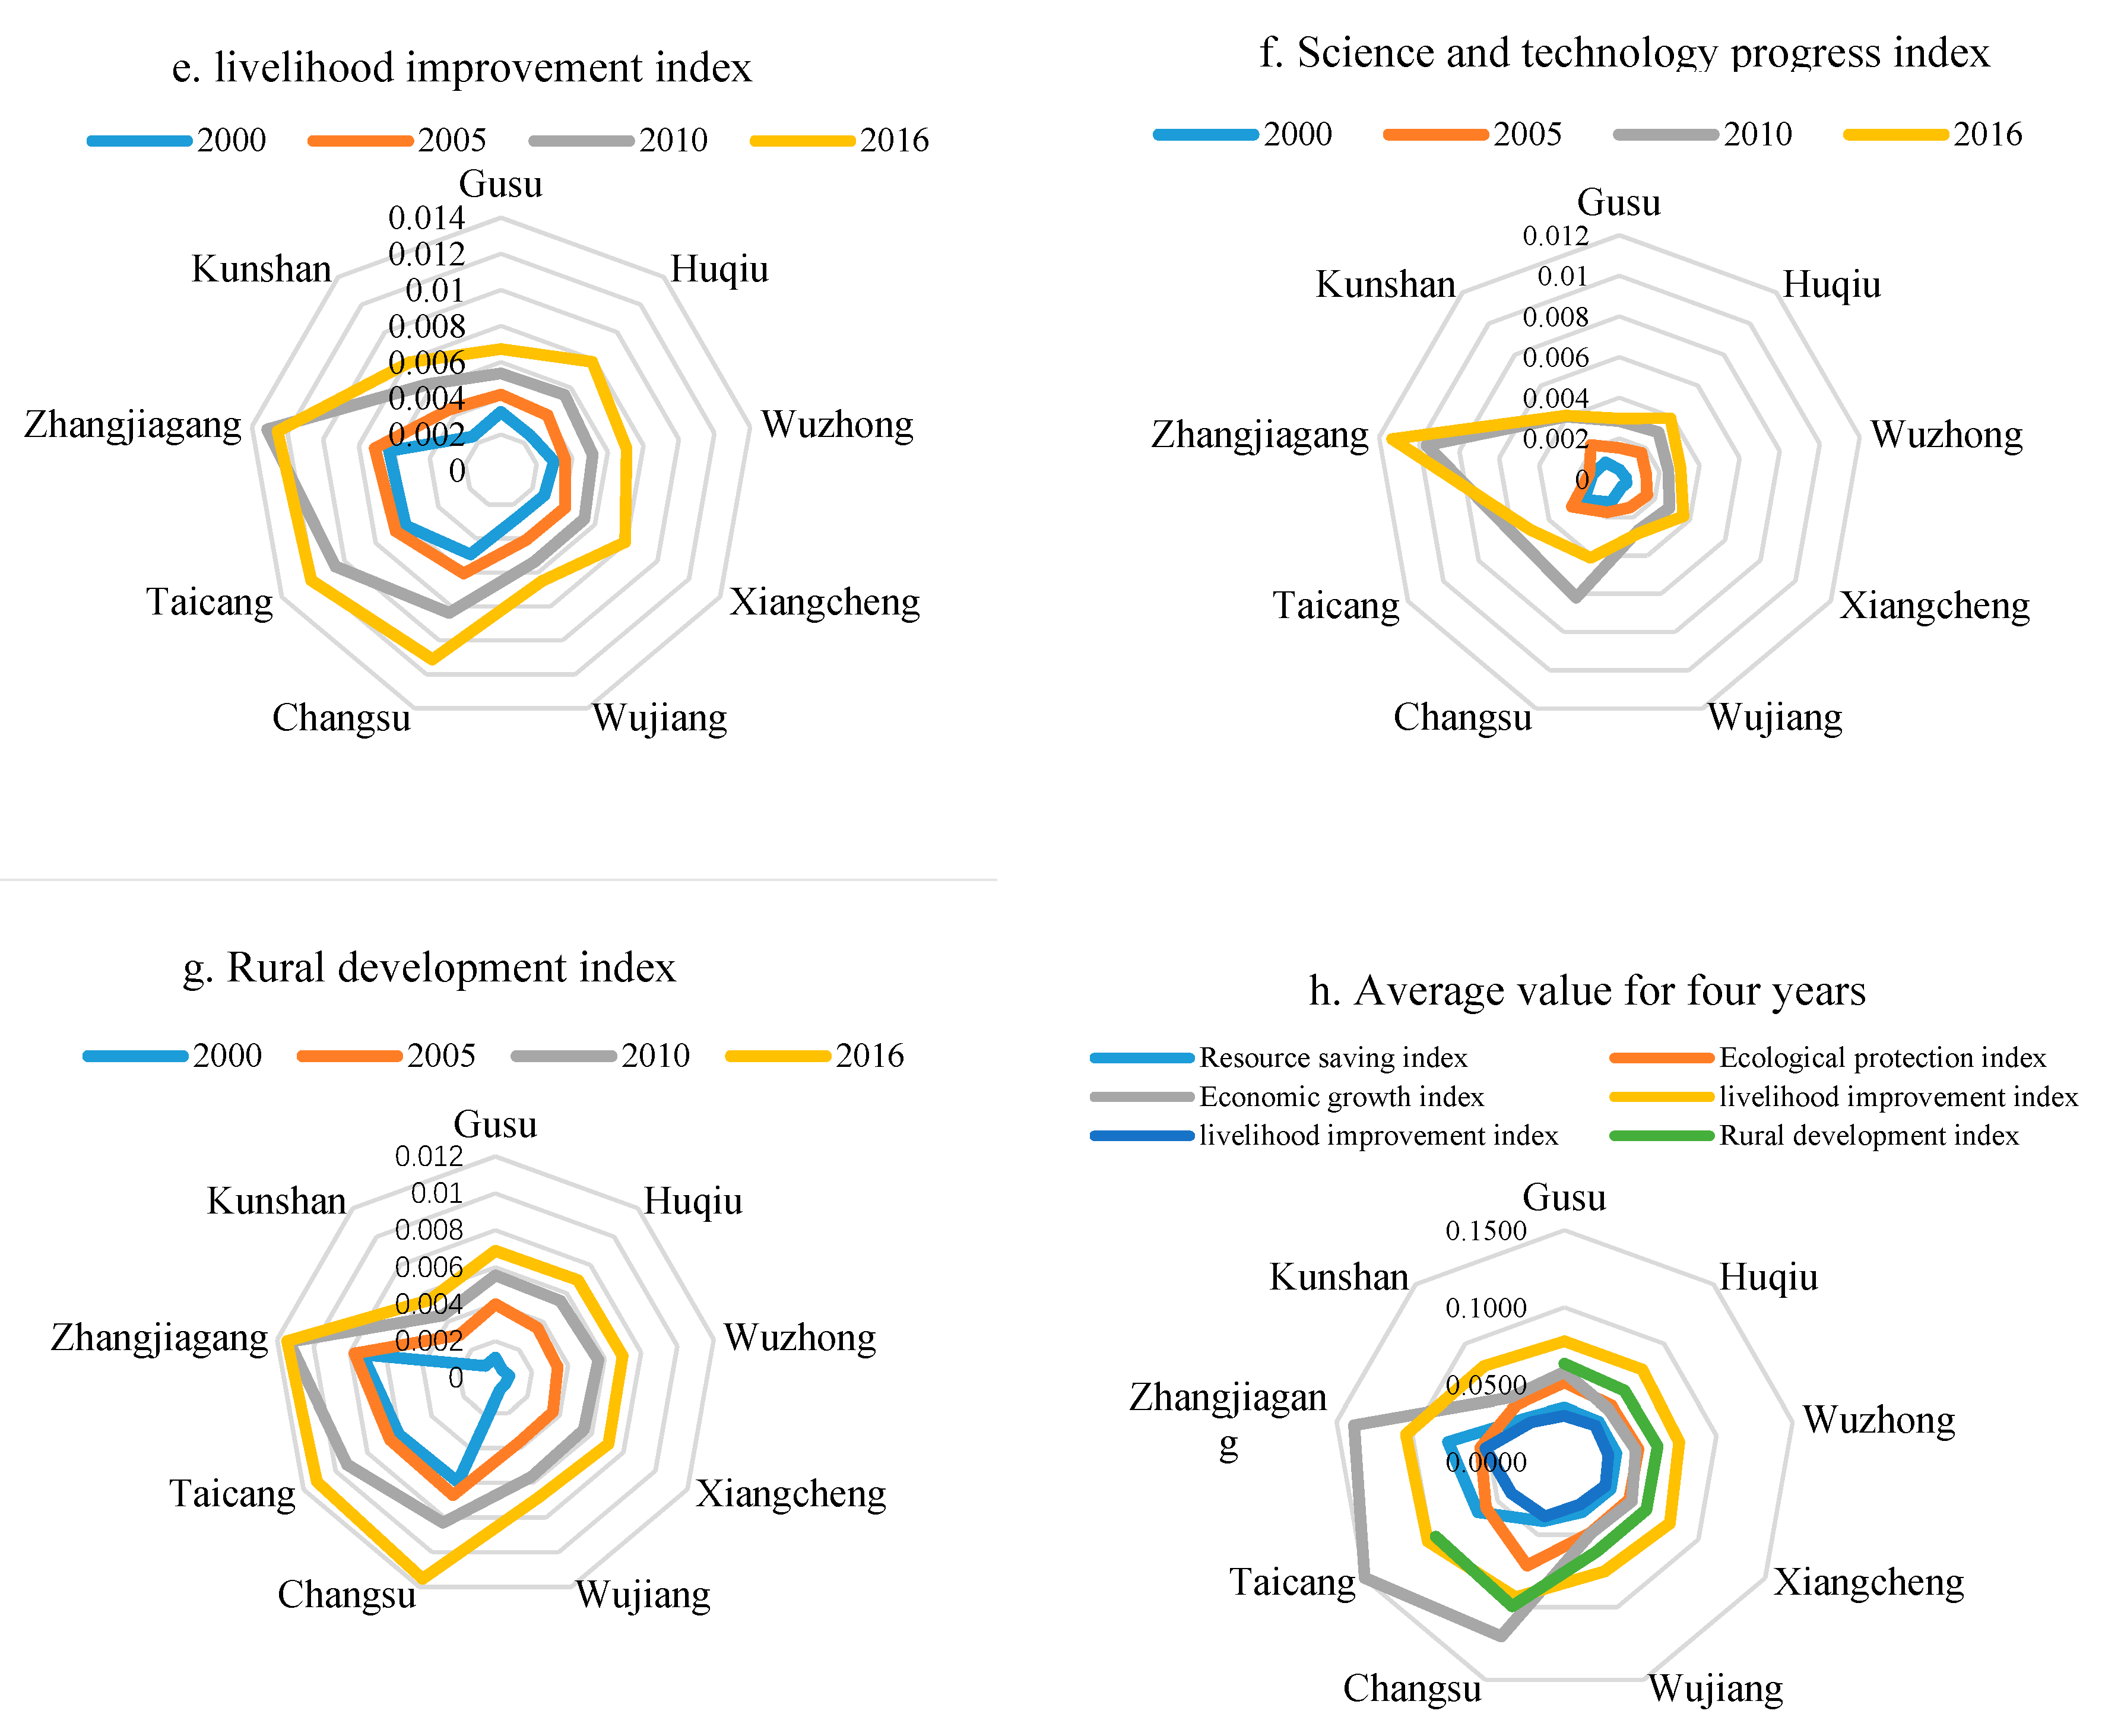
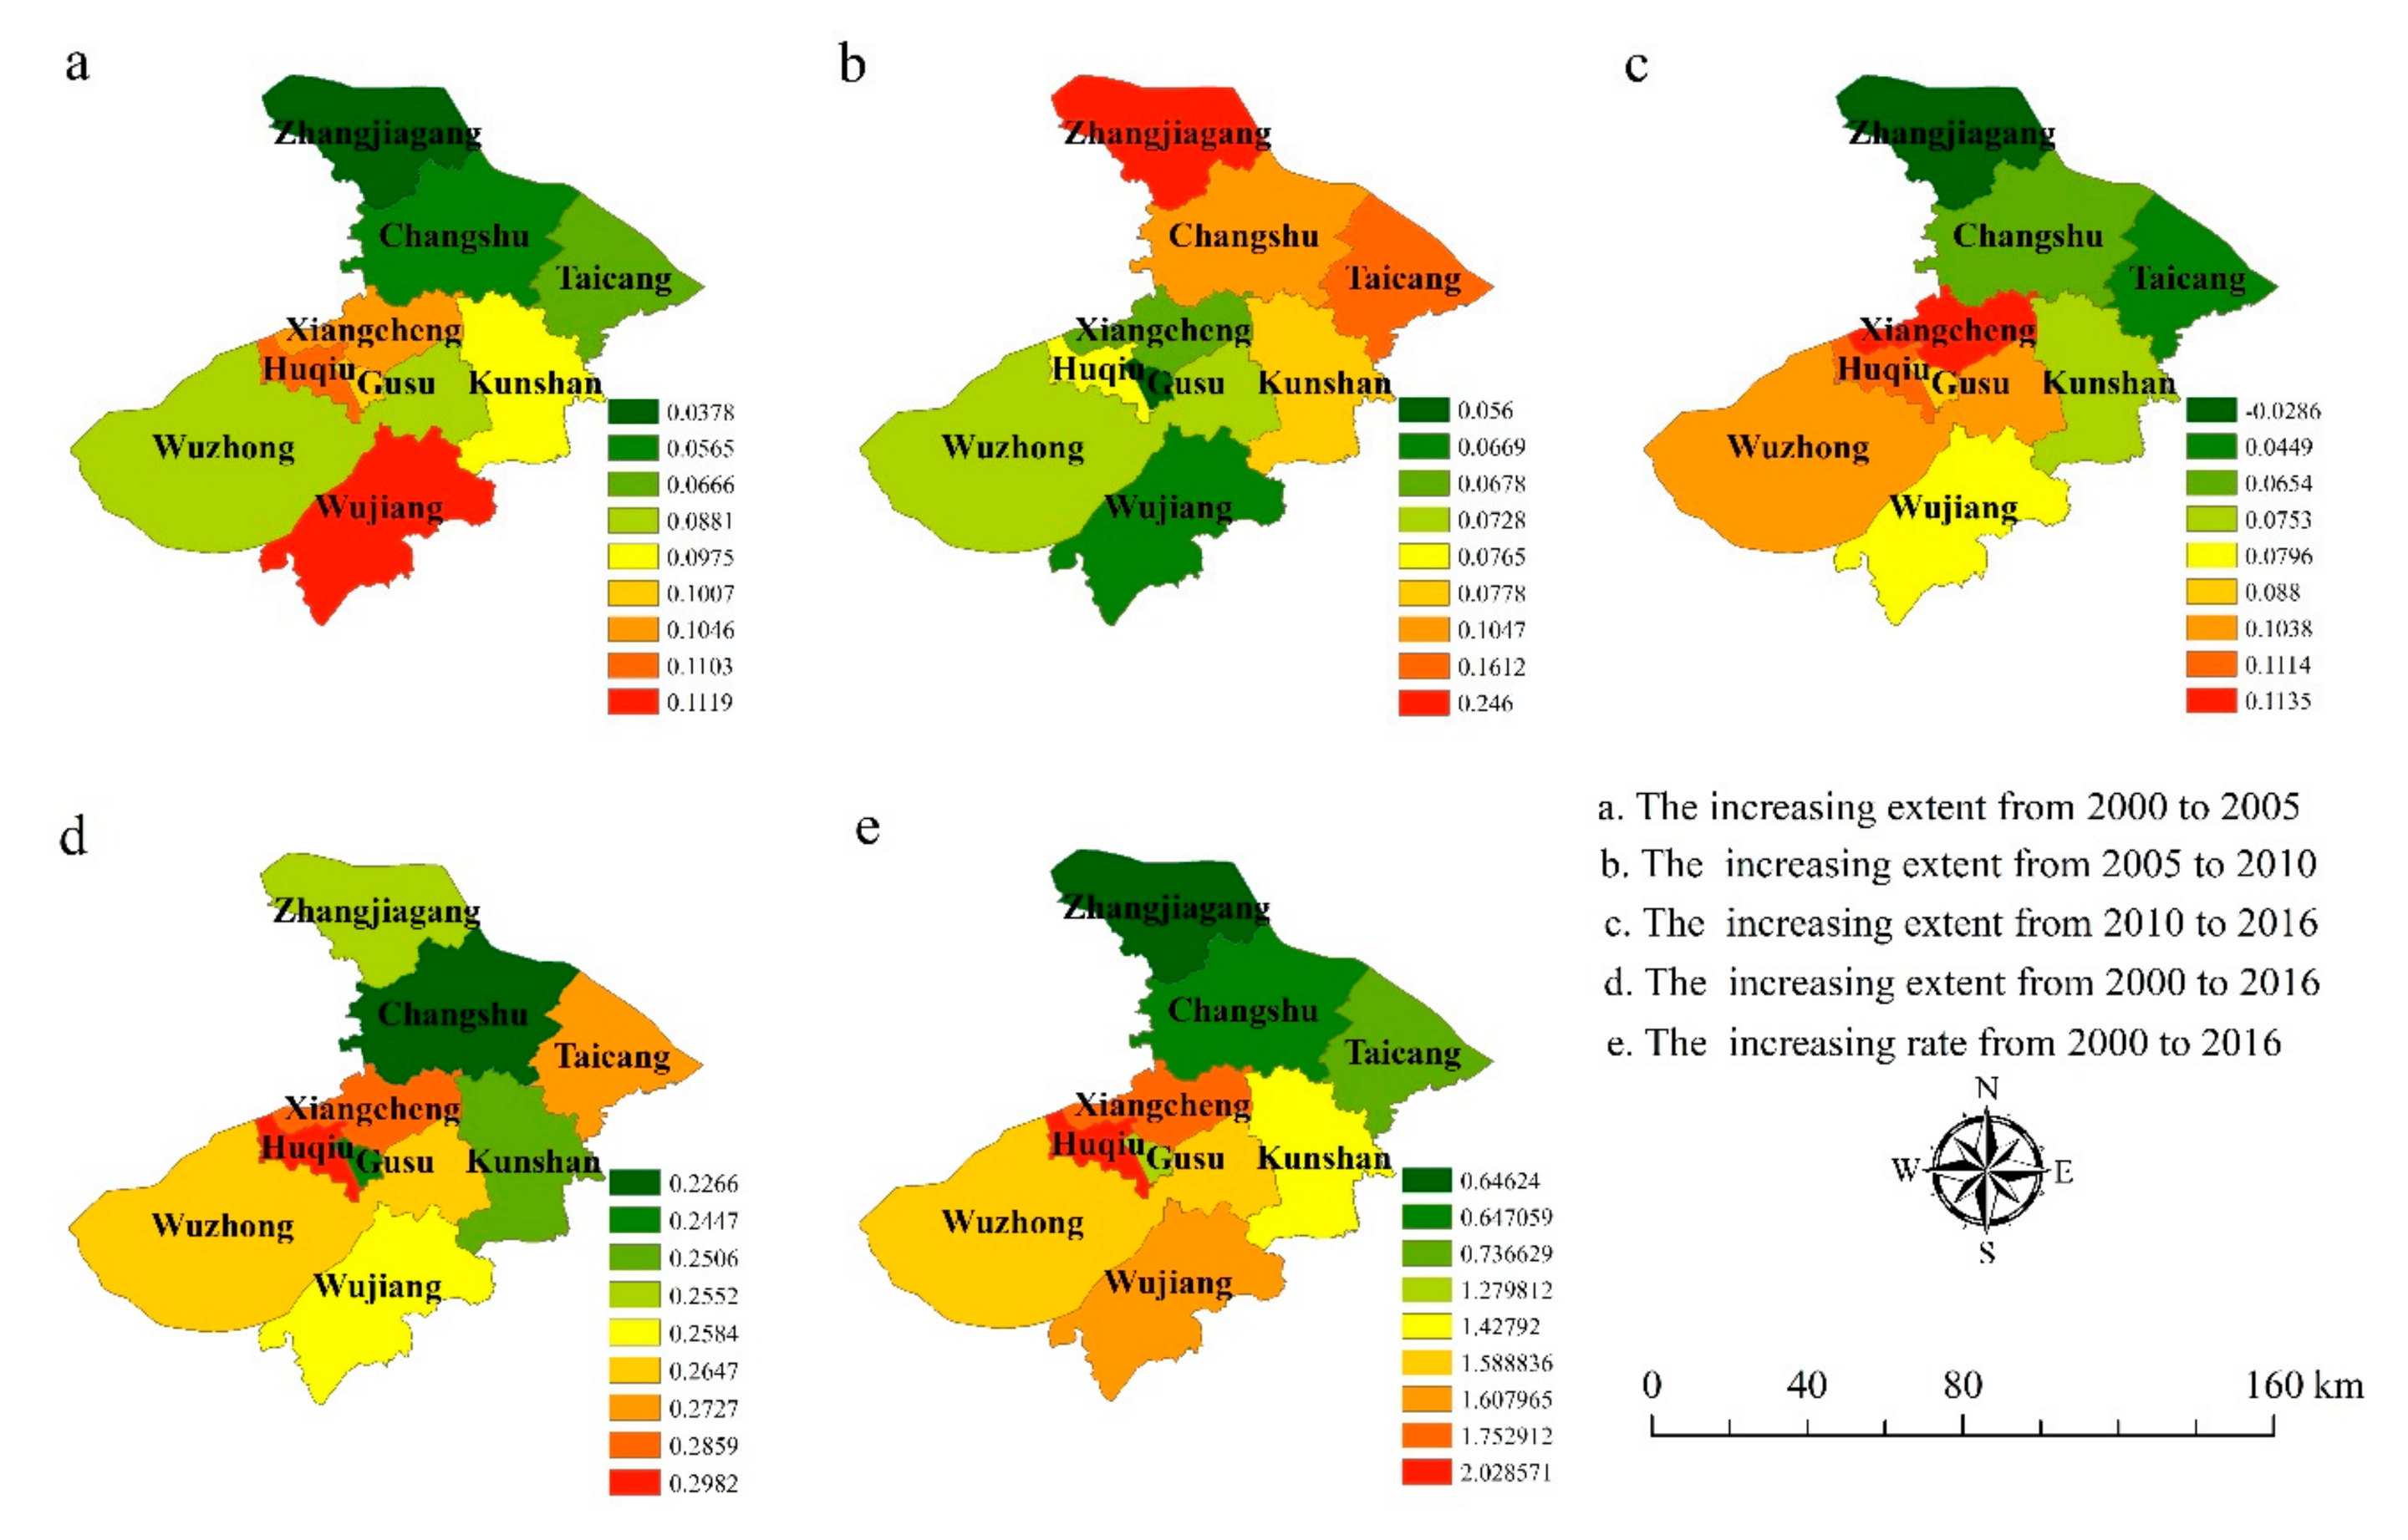
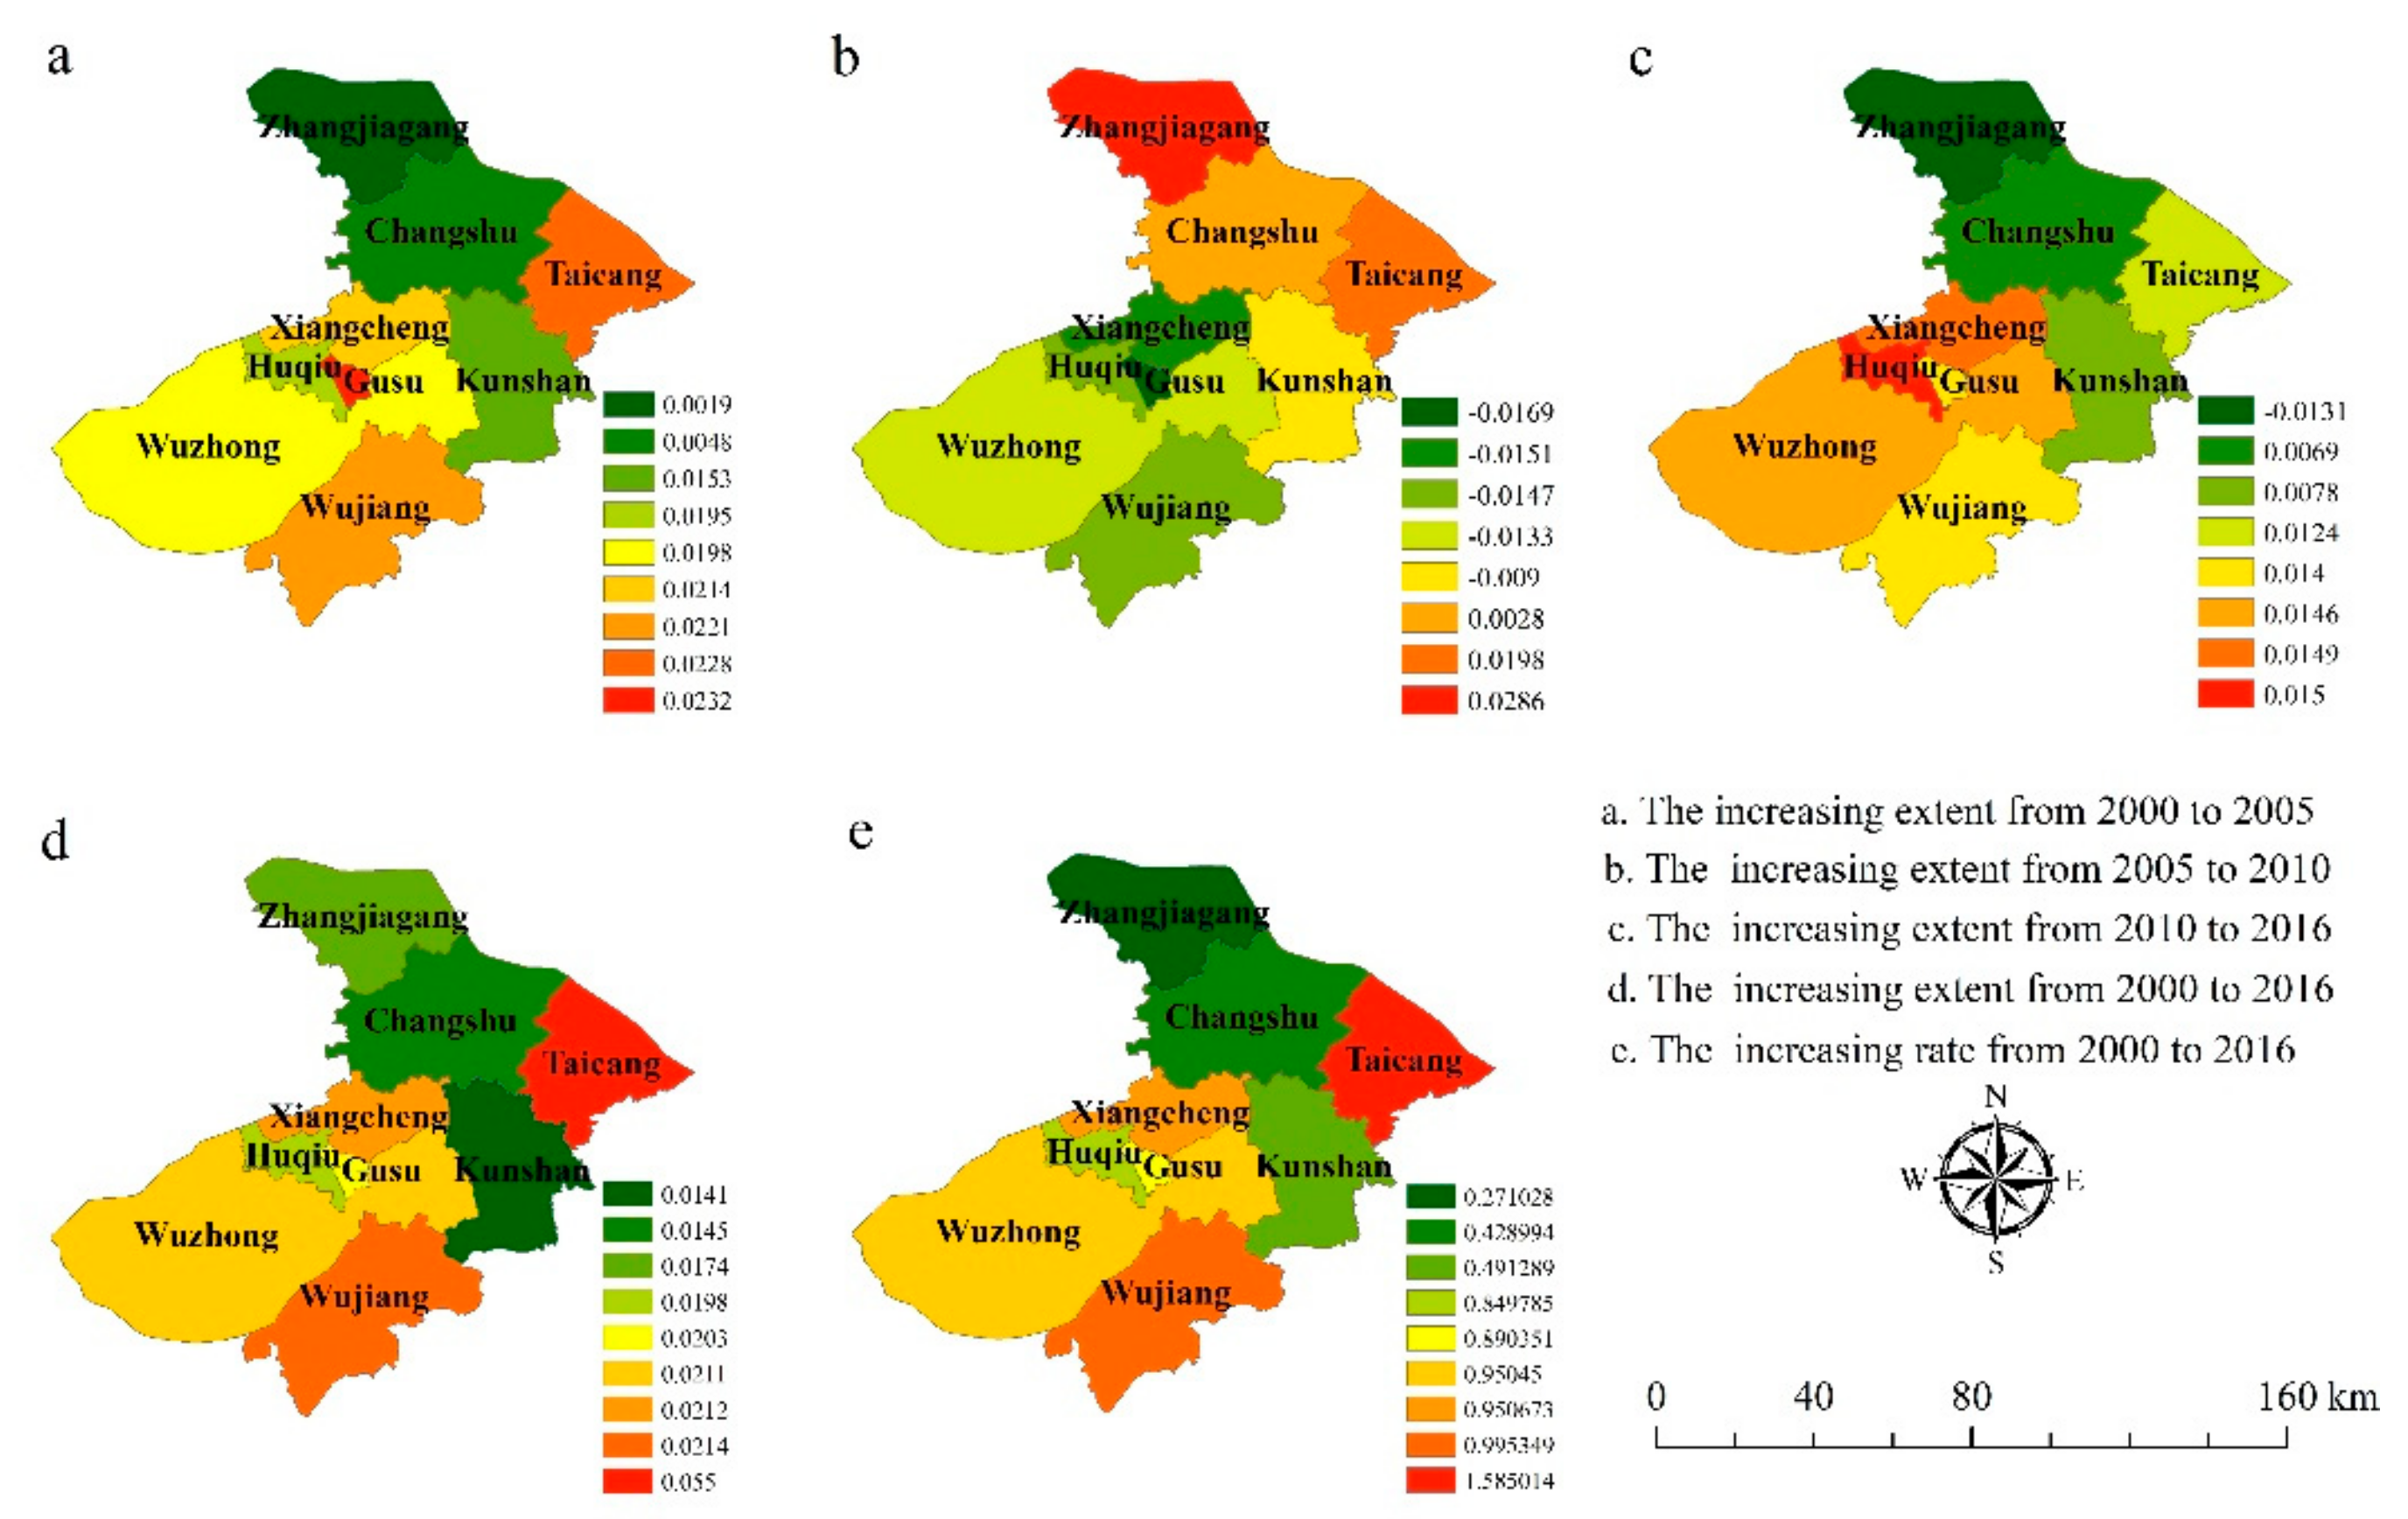
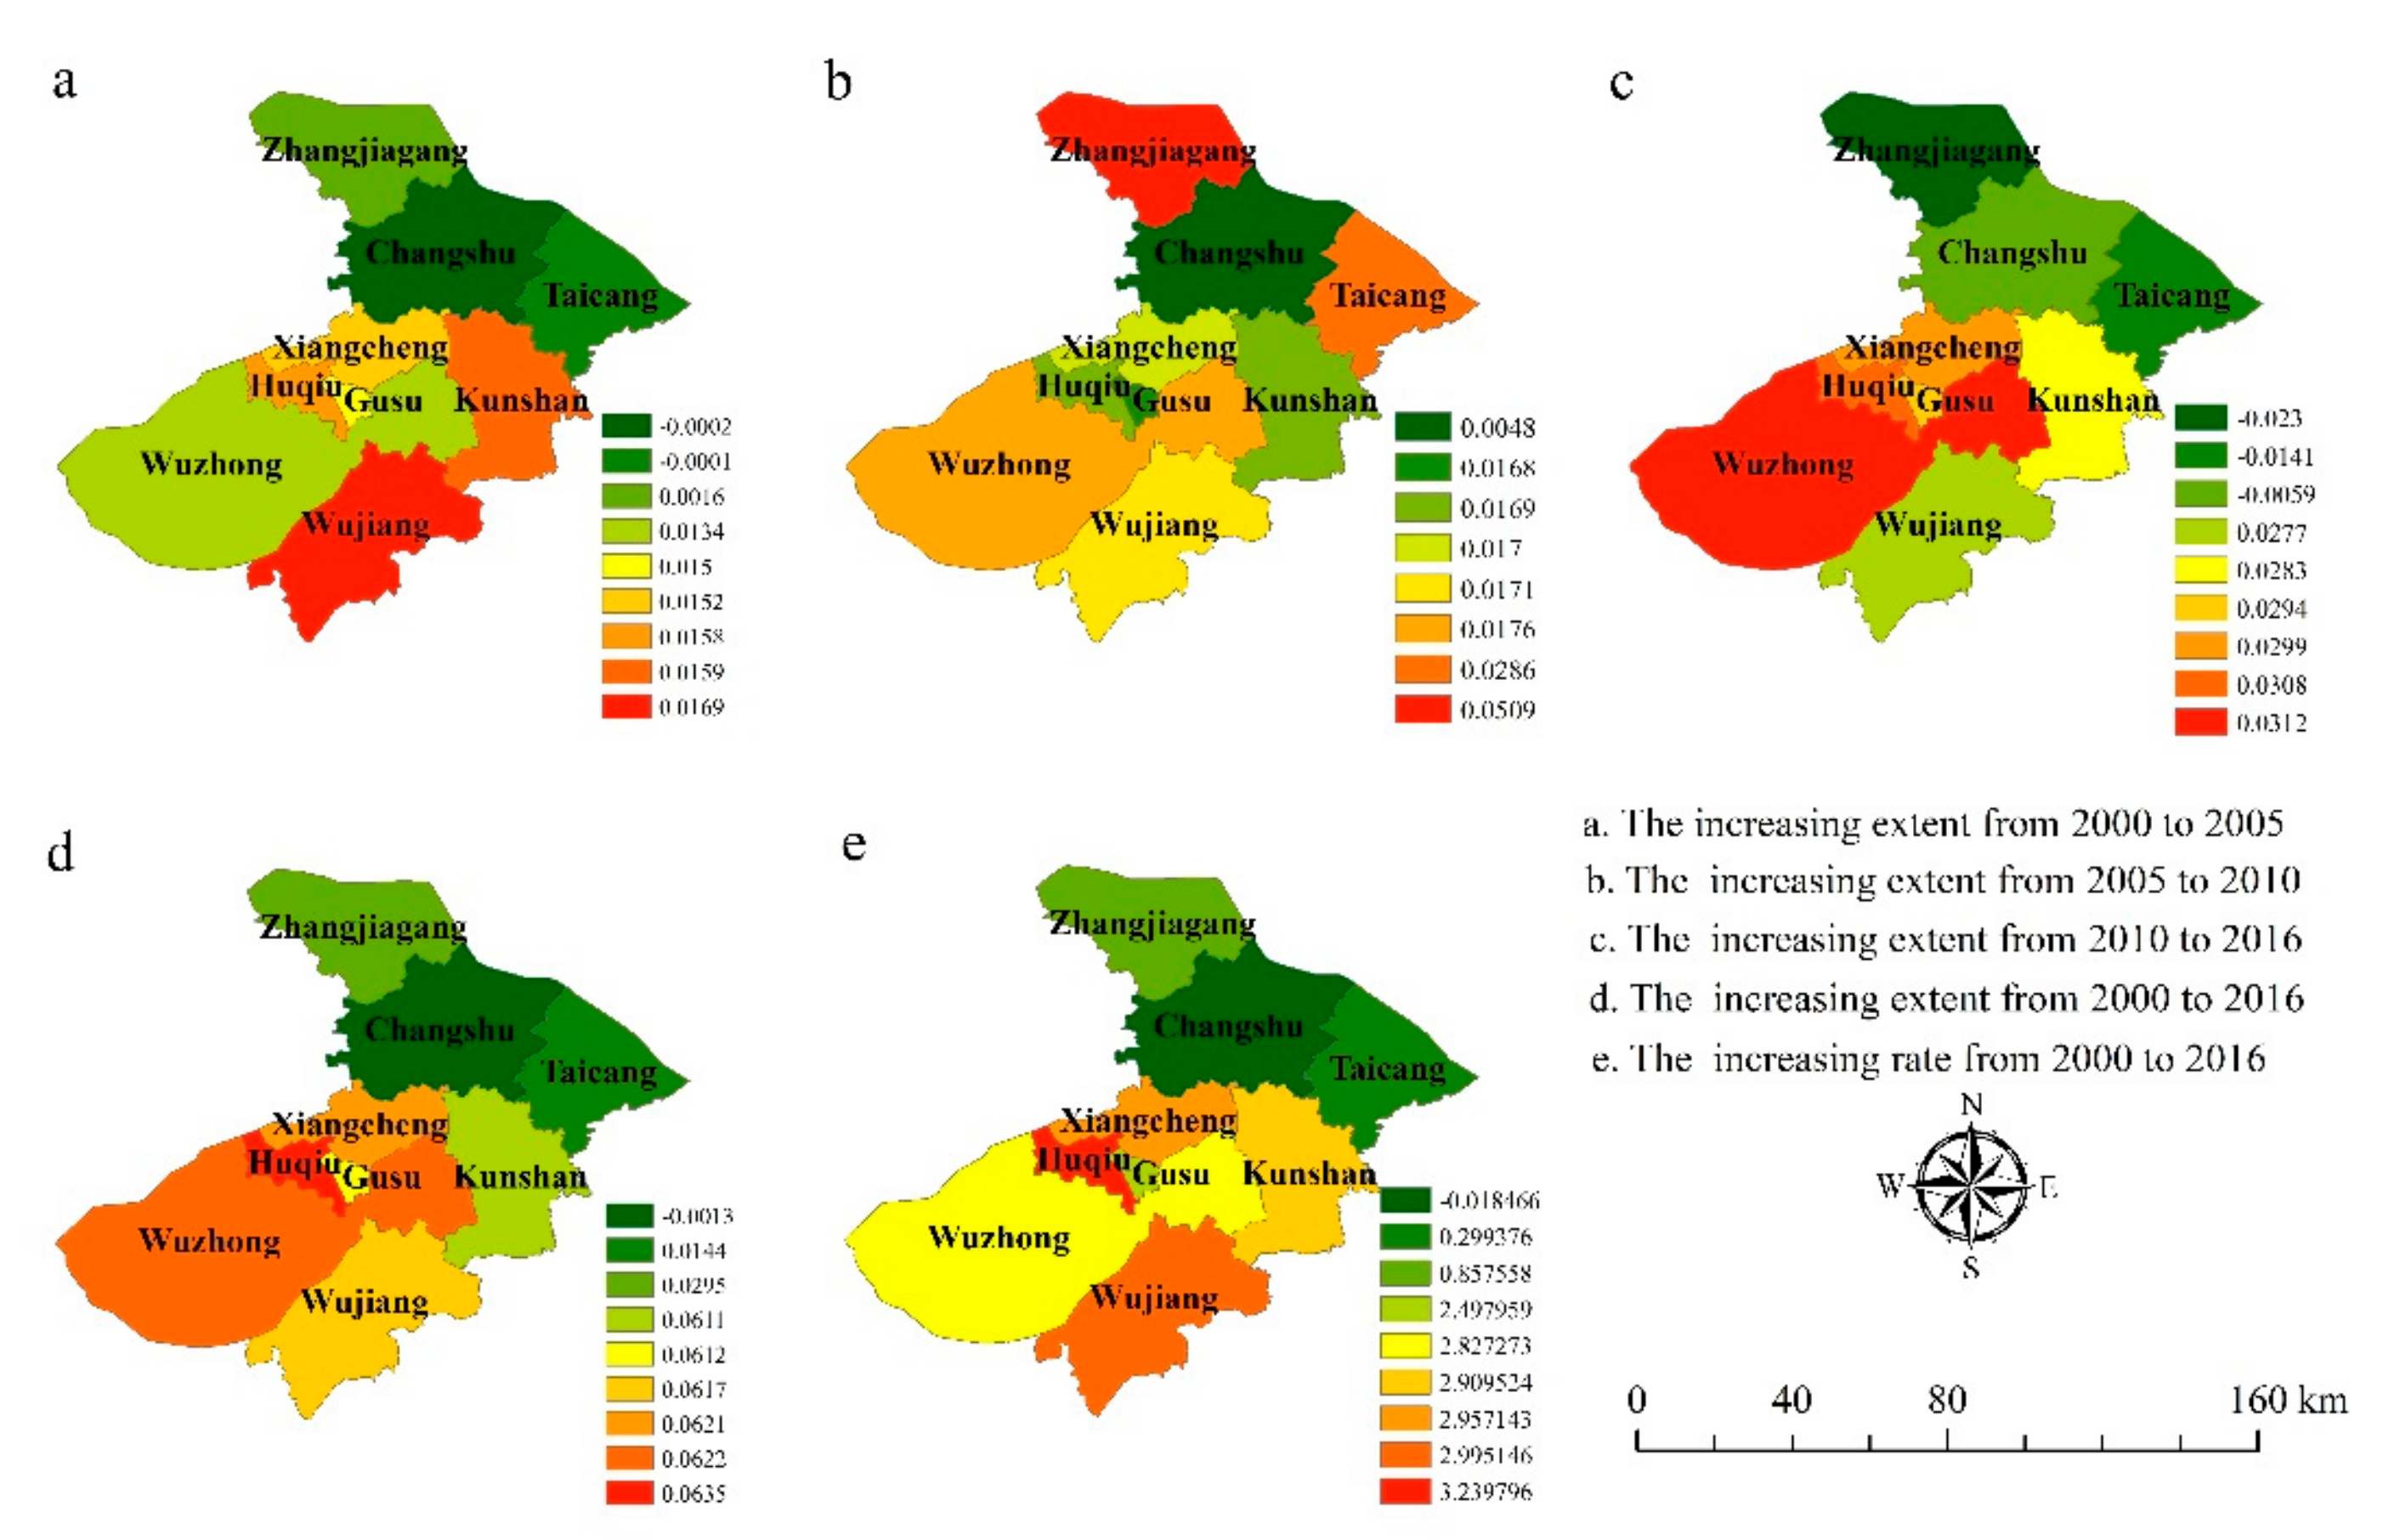
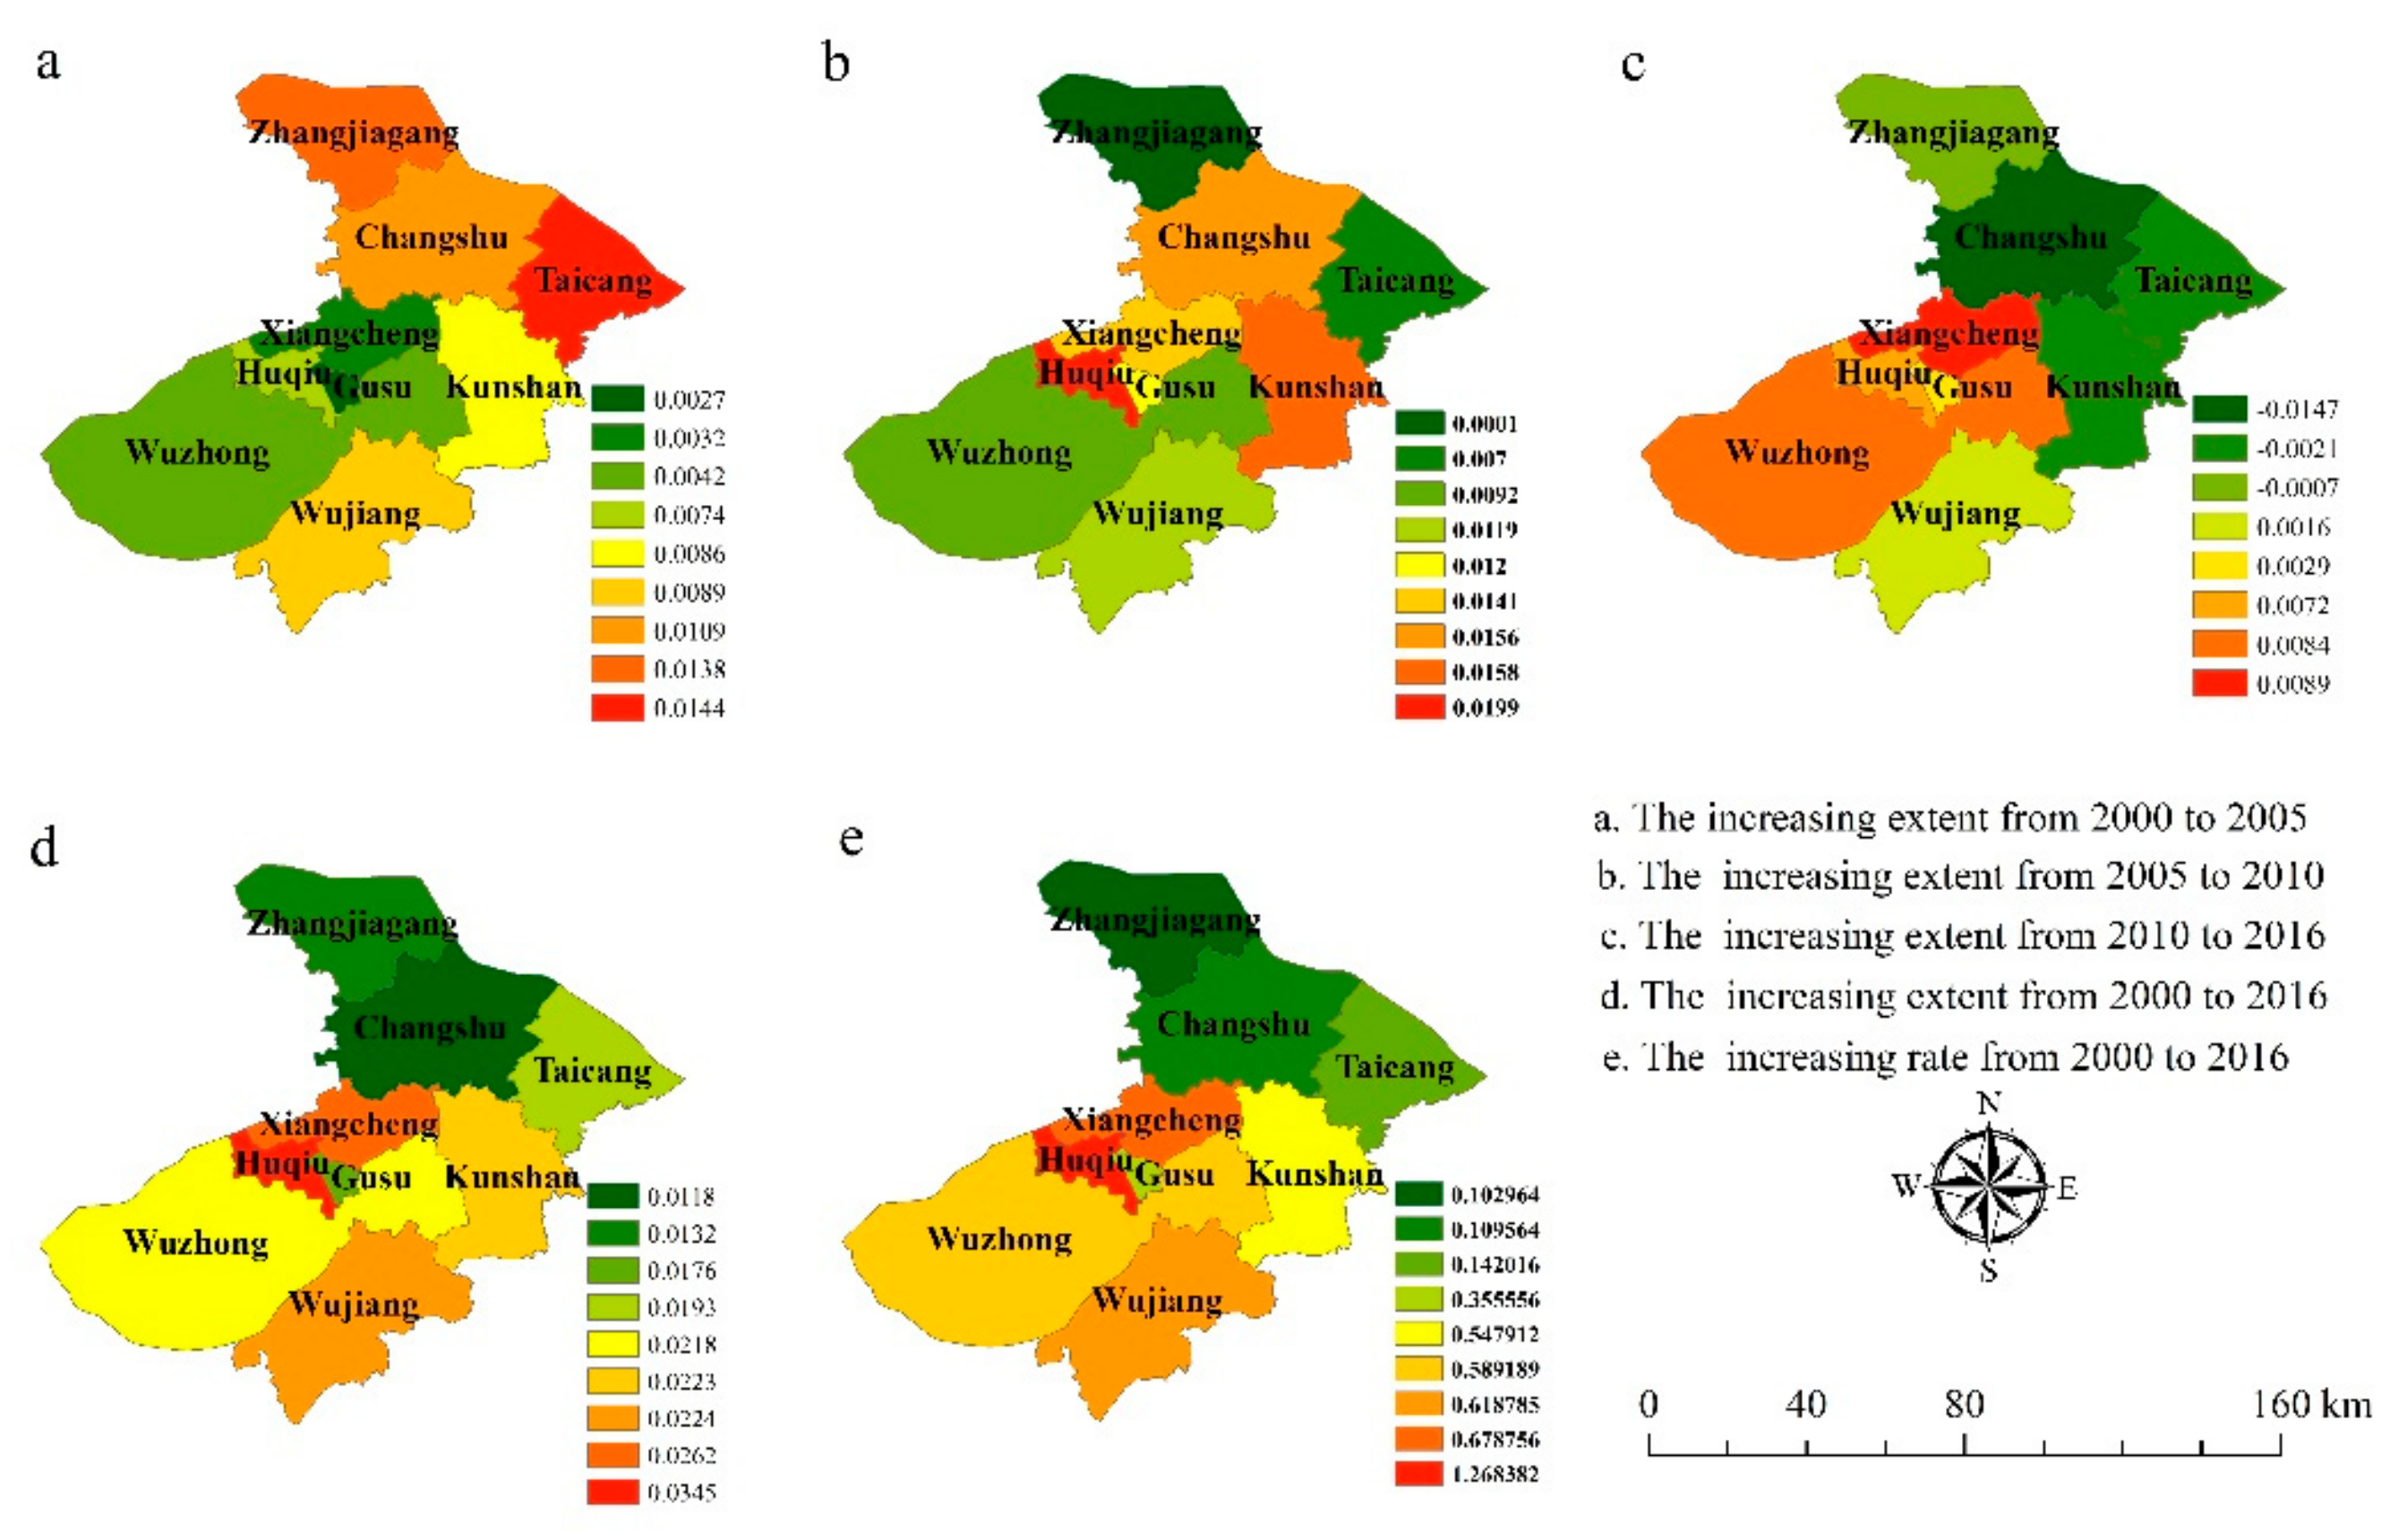
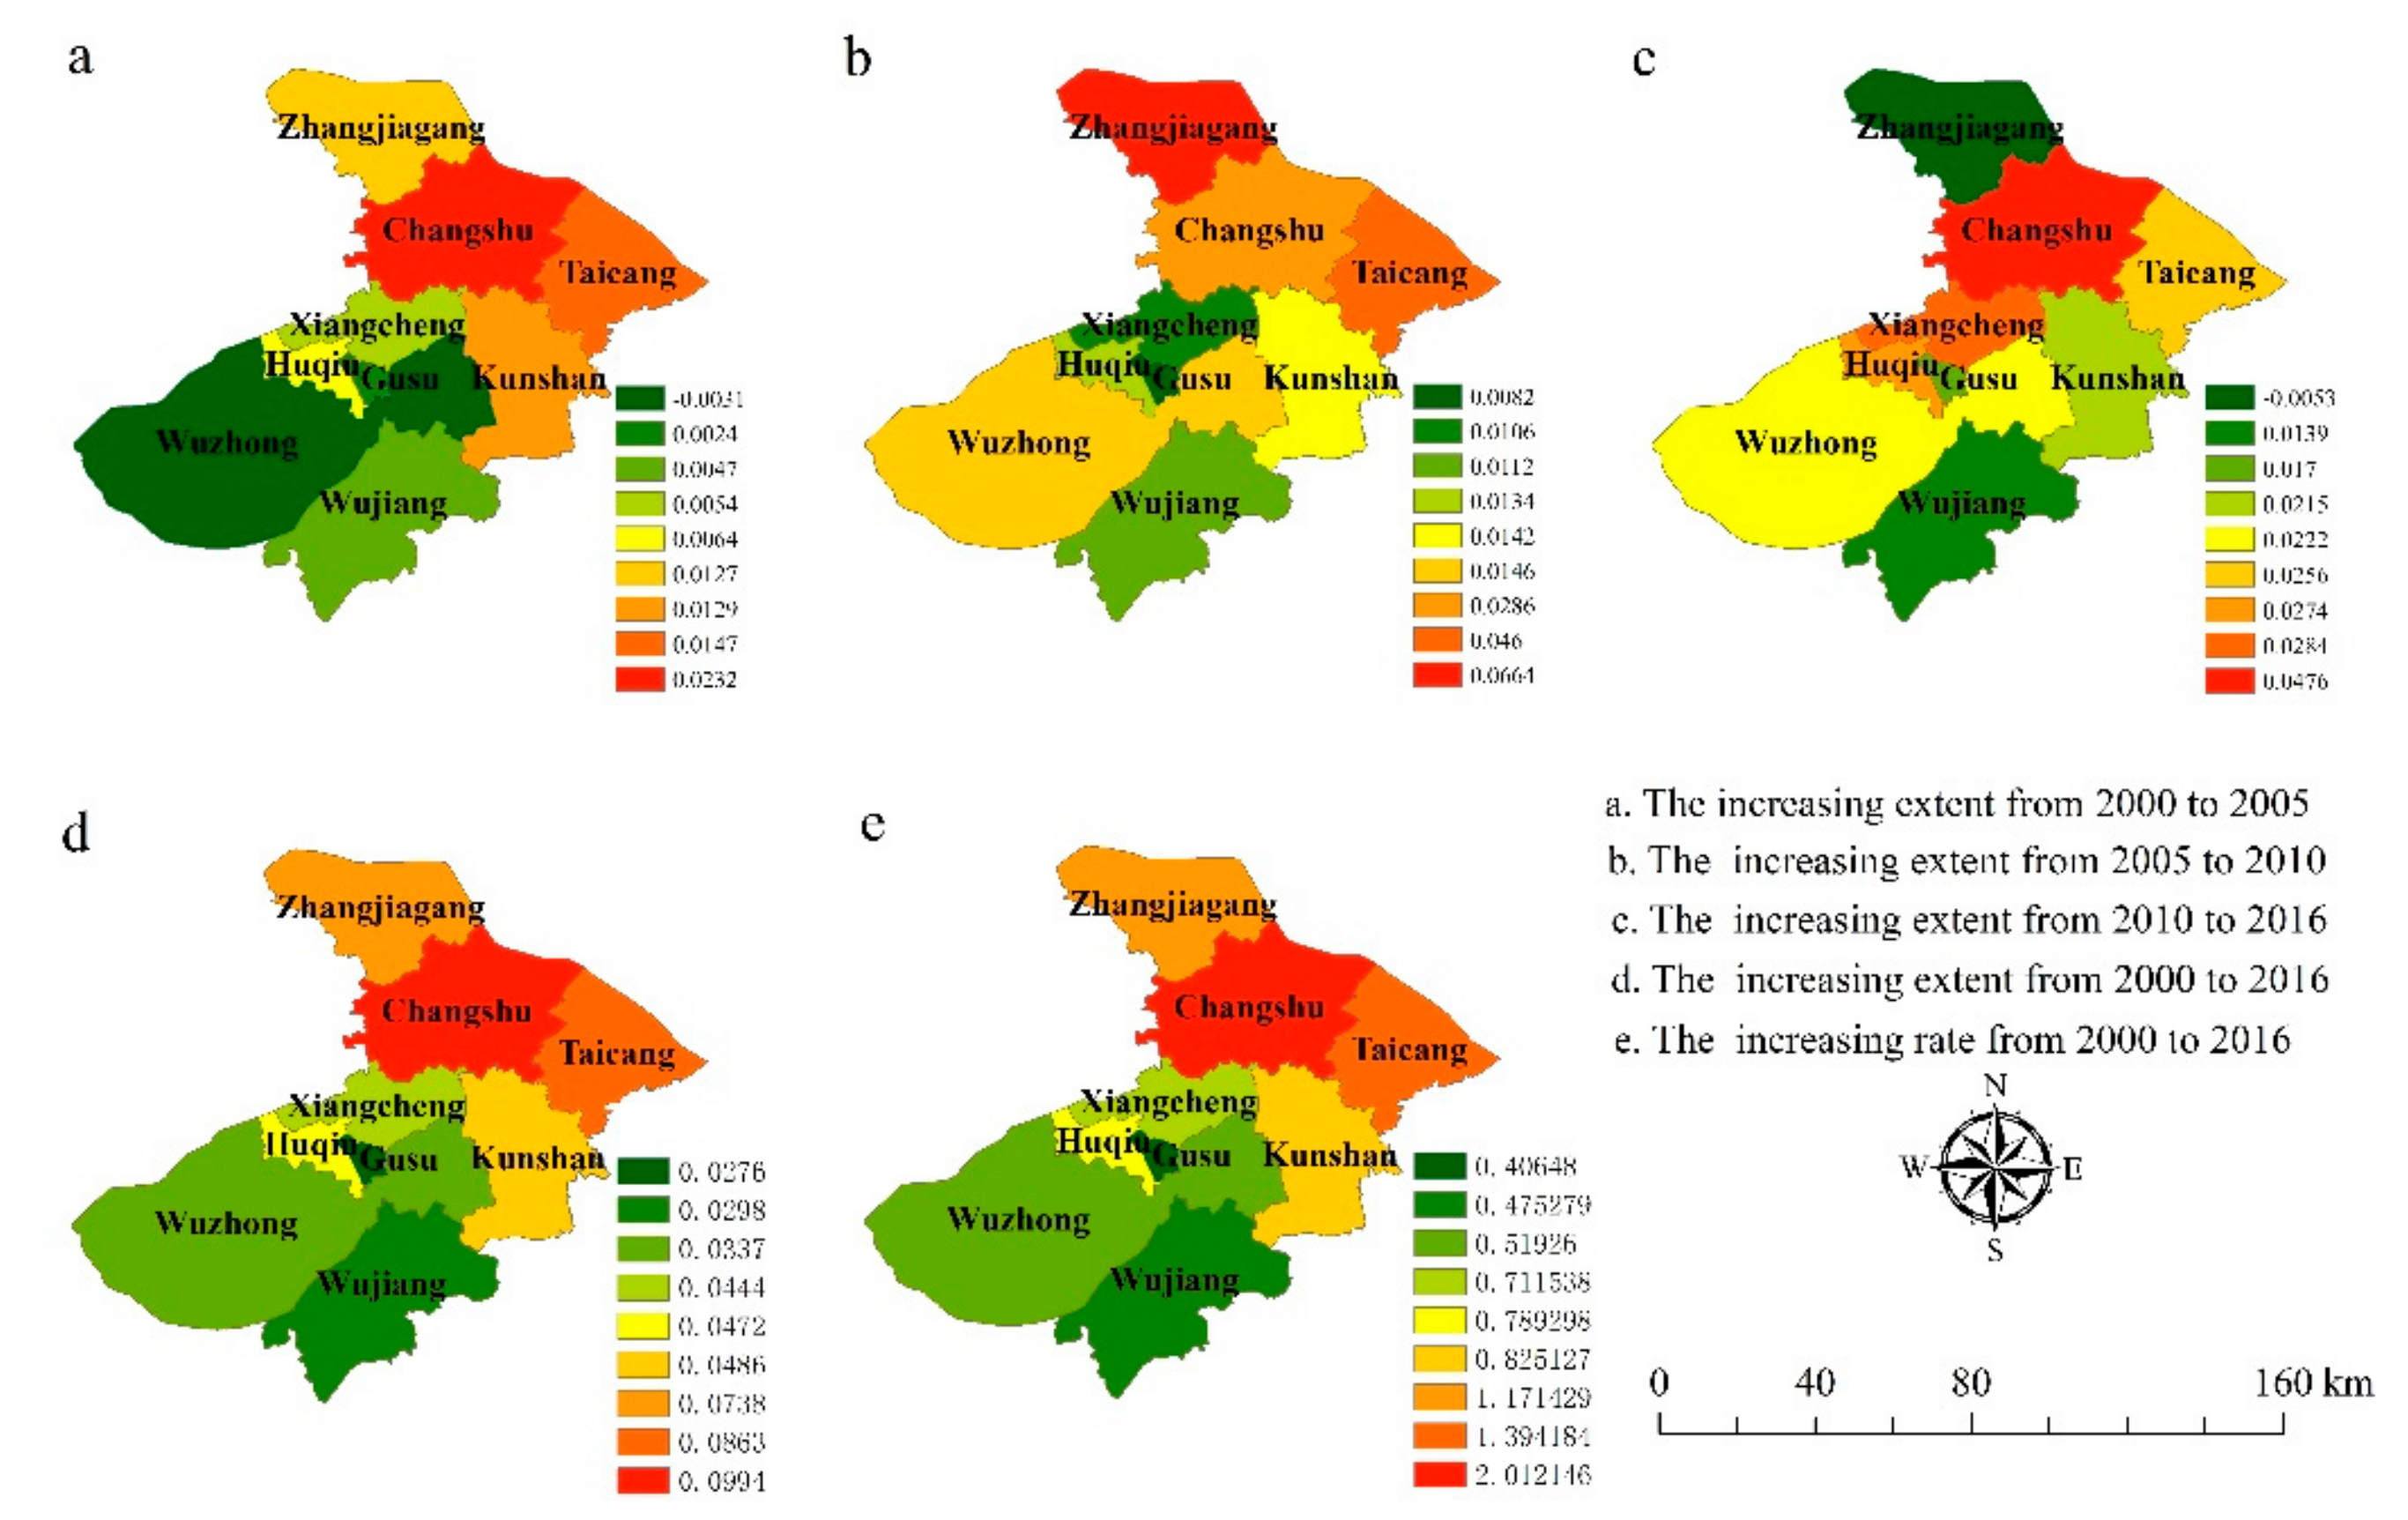
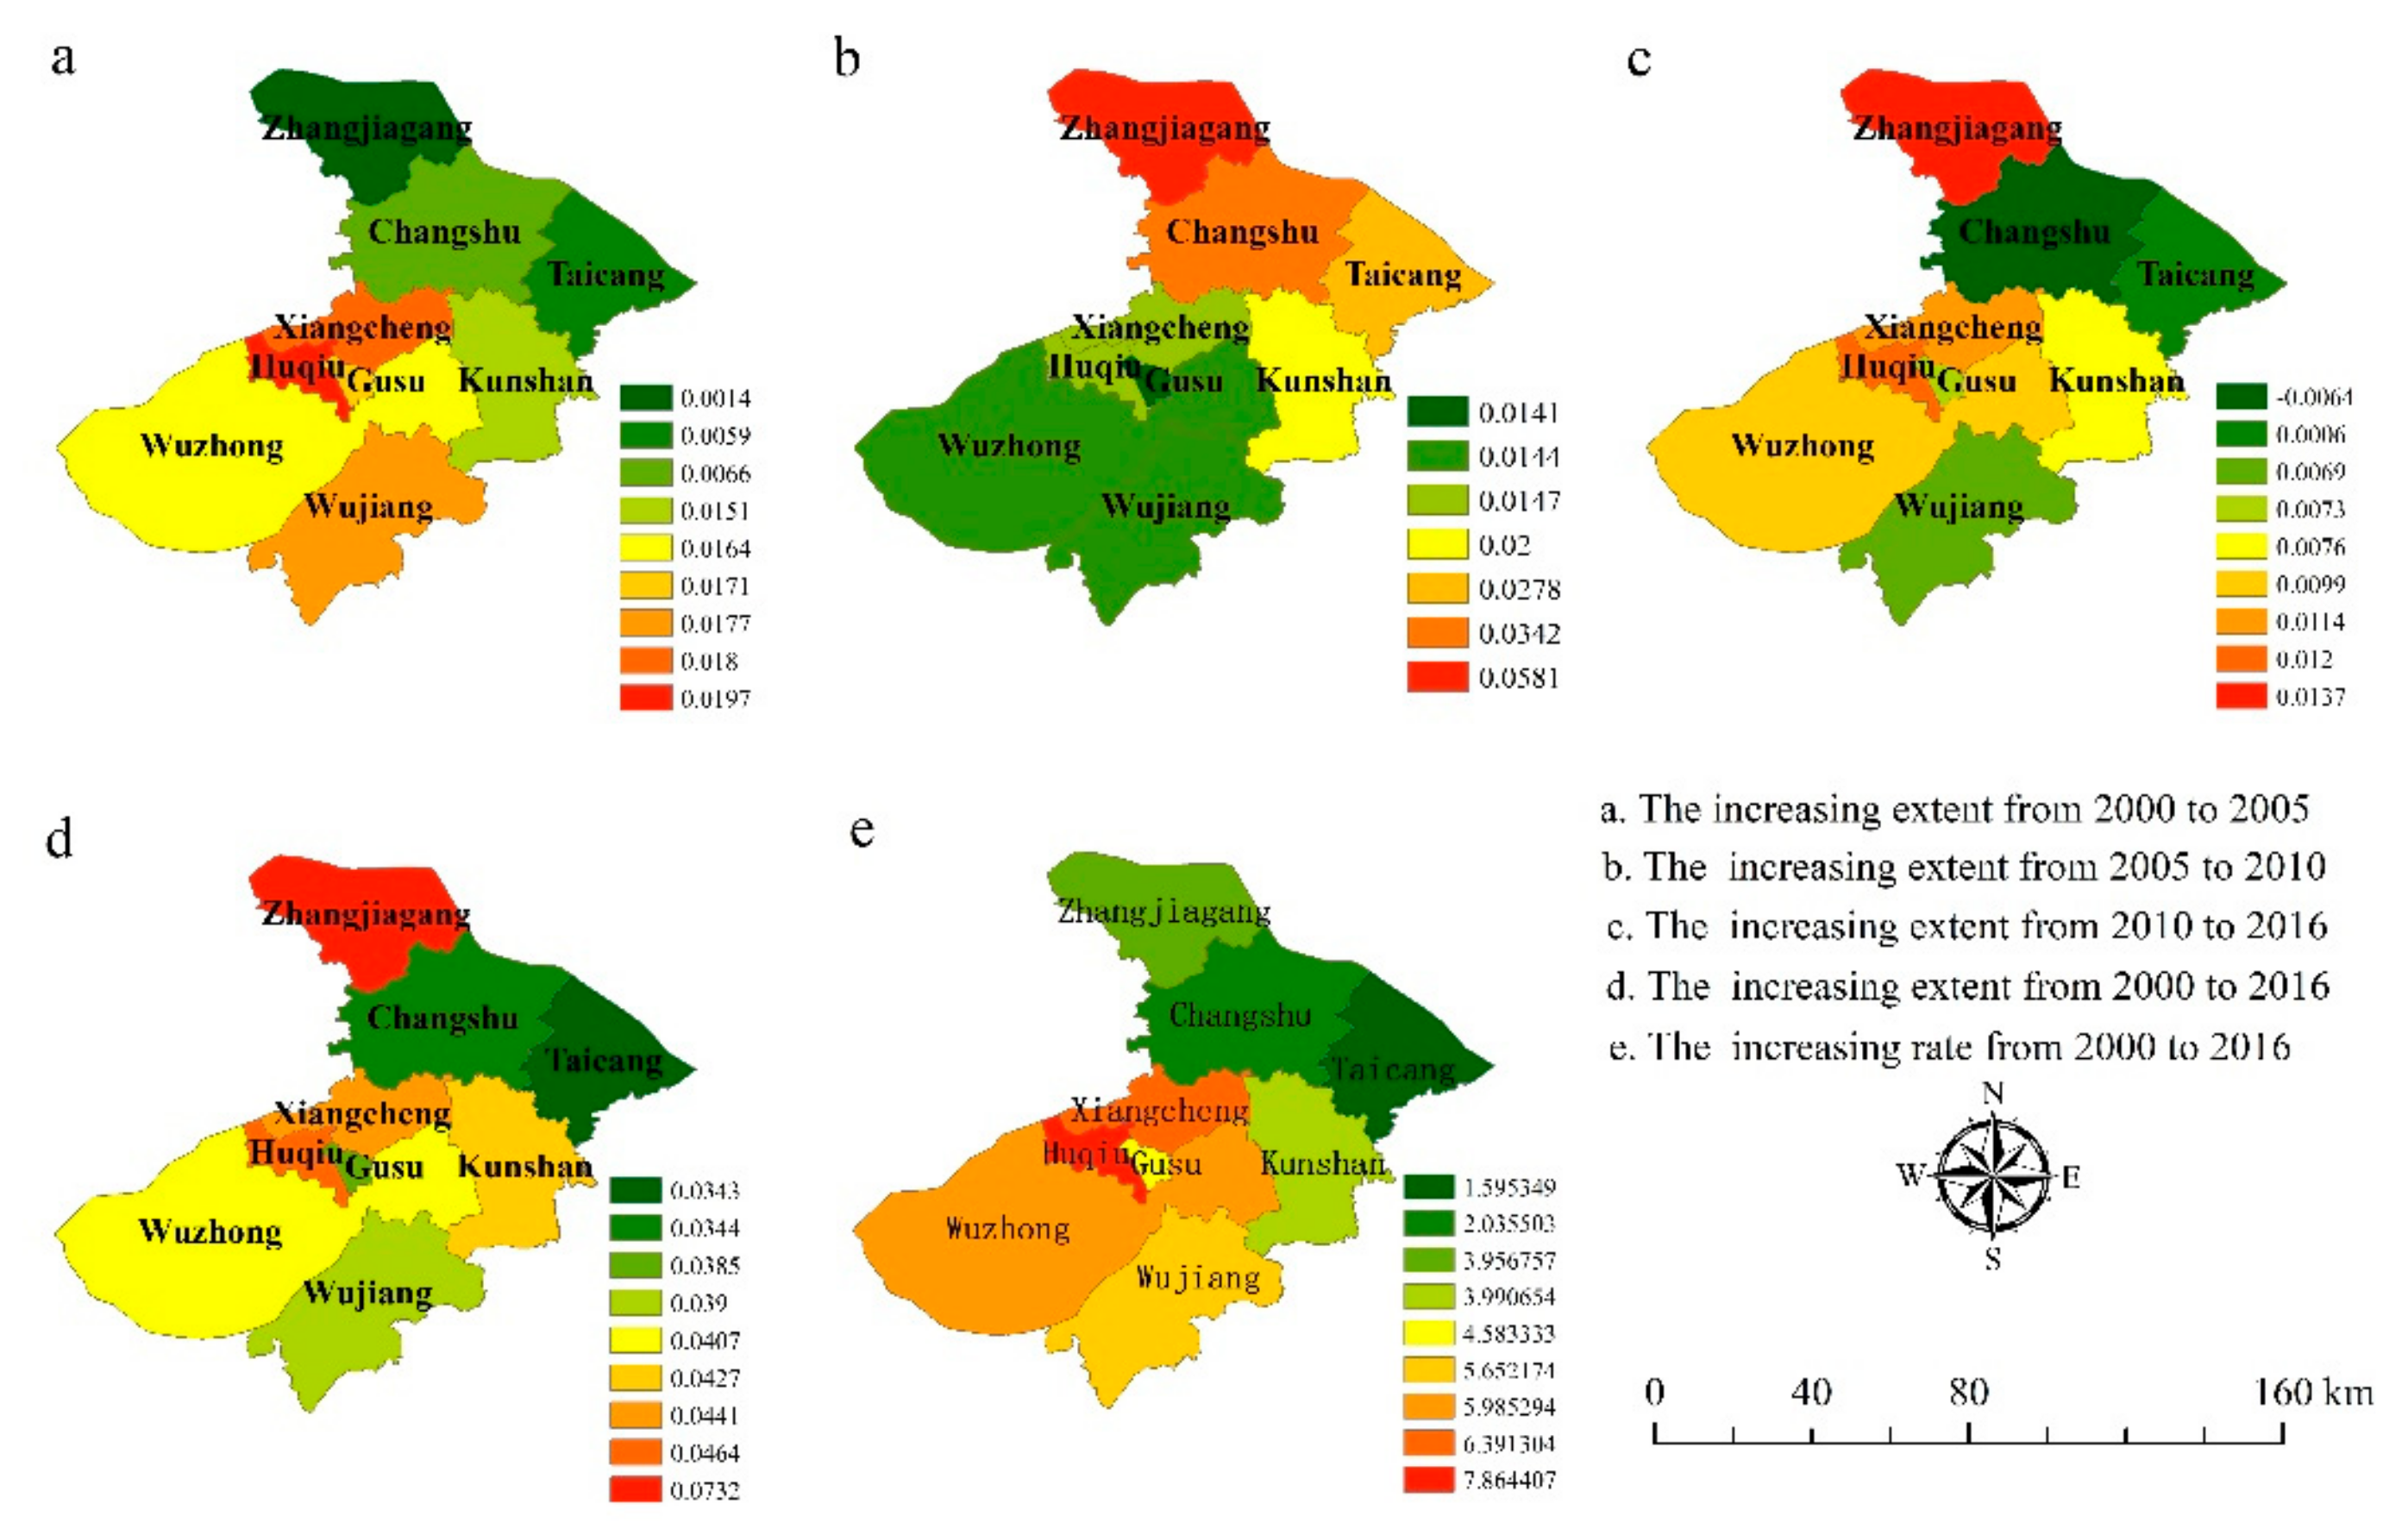
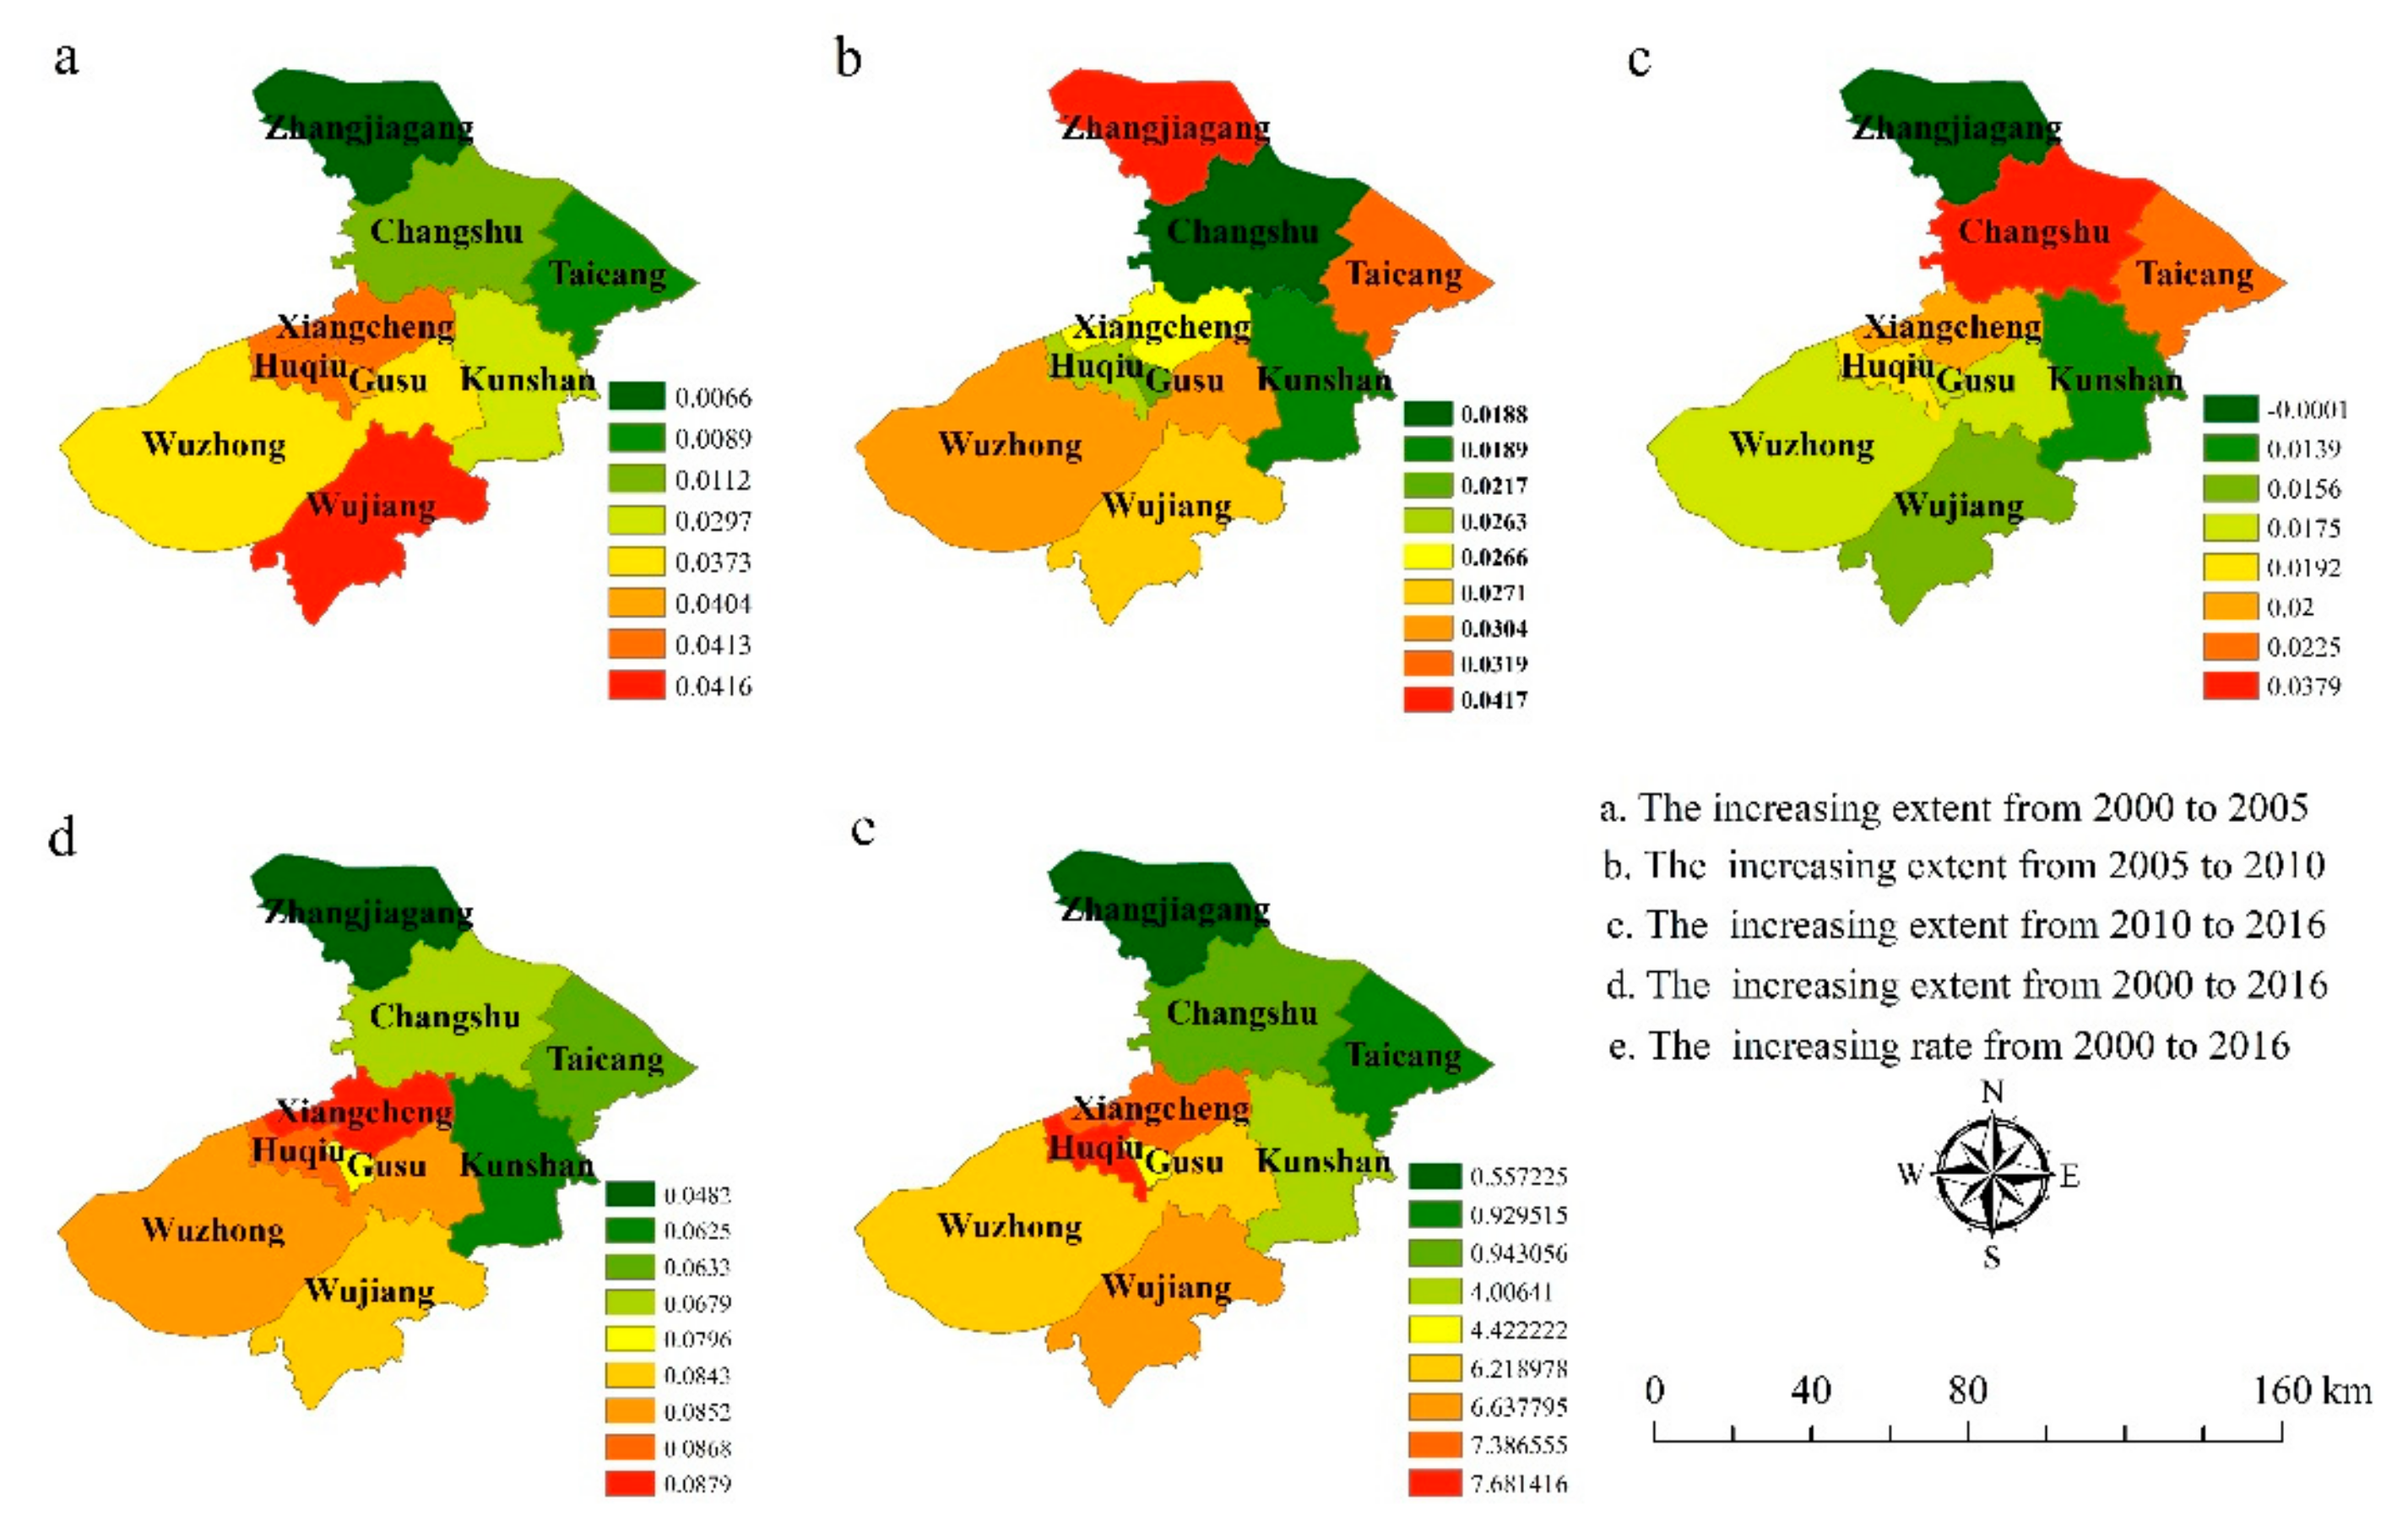
3.2. Sustainable Development Level on County Scale

Figure 3 shows the evaluation results of the sustainable development levels of various county-level cities in Suzhou City in each target year. As shown in Figure 3a, when it came to the comprehensive evaluation of sustainable development level, Zhangjiagang, Taicang, and Changshu ranked among the top in each target year, whereas Kunshan City, Gusu District, Huqiu District, Wuzhong District, Xiangcheng District, and Wujiang District had a relatively low sustainable development level.
The sustainable development subsystems of various county-level cities in Suzhou City also had different performances in each target year. In terms of the resource conservation index (Figure 3b), Zhangjiagang and Taicang were superior to other county-level cities in each target year. When it came to the ecological protection index, shown in Figure 3c, Zhangjiagang, Taicang, and Changshu performed better than other county-level cities in 2000, 2005, and 2010, whereas the case was exactly the opposite in 2016. In terms of the economic growth index, shown in Figure 3d, and the rural development index, shown in Figure 3g, the relative merits of the various county-level cities in each target year were basically the same as the performance of each county-level city when it came to the comprehensive evaluation results. As for the livelihood improvement index, shown in Figure 3e, and the scientific and technological progress index, shown in Figure 3f, there was no significant difference between the county-level cities in 2000 and 2005. In 2010 and 2016, Zhangjiagang performed the best, with Taicang and Changshu ranking in second and third place, respectively.
According to the multi-year average of the sustainable development subsystems of various county-level cities in Suzhou City, shown in Figure 3h, the livelihood improvement index and the rural development index were the two indices with relatively good performance in Gusu District, Huqiu District, Wuzhong District, Xiangcheng District, Wujiang District, and Kunshan City. In Changshu, Taicang, and Zhangjiagang, the economic growth index was significantly larger than the other indices, with the livelihood improvement index the rural development index ranking in second and third places, respectively.
Based on the evaluation results of subsystems in each county-level city, the proportion of each index to the comprehensive evaluation results of sustainable development level was calculated so as to evaluate the contribution of subsystems to the overall sustainable development system. According to the results, Gusu District, Wuzhong District, and Wujiang District made the largest contribution to the sustainable development level in 2000 and 2005 in terms of the livelihood improvement index. In 2010 and 2016, the rural development index contributed the most to the sustainable development level. For Huqiu District, the contribution made by the livelihood improvement index remained in first place in all target years; the economic growth index ranked second in 2000 and third in the other years; and the rural development index was in the second place in 2005, 2010, and 2016. For Xiangcheng District, the rural development index made the largest contribution in 2010, with the people’s livelihood improvement index ranking in the first place in the remaining years. For Changshu City, the economic growth index contributed the most to the comprehensive sustainable development level in 2000, 2005, and 2010, with its contribution ranking in the third place in 2016. Moreover, the livelihood improvement index and the rural development index made the largest and second largest contribution to the comprehensive sustainable development level in 2016, respectively. For Taicang City, the contribution made by the economic growth index remained at the top in each target year. In contrast, the contribution of the scientific and technological progress index was at the lowest level in all years. For Zhangjiagang City, the contribution made by the economic growth index was also in first place. The scientific and technological progress index made the lowest contribution in 2000, 2005, and 2010, and the contribution of the ecological protection index was at the lowest level in 2016. For Kunshan City, the livelihood improvement index and the economic growth index ranked in the top two places when it came their contribution to the sustainable development level.
The scientific and technological progress index and the rural development index performed relatively worse in 2000 as compared with the other indices. The contribution of the scientific and technological progress index and the ecological protection index was relatively low in 2005, and that of the resource conservation index was relatively poor in 2010 and 2016.
According to Figure 4a–c, from 2000 to 2005, the sustainable development level of Wujiang District increased the most significantly, followed by Huqiu District and Xiangcheng District, whereas Zhangjiagang City, Changshu City, and Taicang City exhibited the lowest growth rate. The situation was almost the opposite from 2005 to 2010. From 2010 to 2016, the sustainable development level of Gusu District, Xiangcheng District, Huqiu District, and Wuzhong District increased significantly, whereas that of Zhangjiagang City, Taicang City, and Changshu City, along the Yangtze River, had a relatively low growth rate. As shown in Figure 4d, according to the perspective of the increase in the sustainable development level from 2000 to 2016, Huqiu District, Xiangcheng District, and Taicang City had relatively significant growth rates, whereas those of Changshu City, Zhangjiagang City, and Kunshan City were relatively low. According to the change rate of the sustainable development level from 2000 to 2016, shown in Figure 4e, the three cities along the Yangtze River (i.e., Zhangjiagang City, Changshu City, and Taicang City), had the lowest change rate. Moreover, the changes in Xiangcheng District, Huqiu District, and Wujiang District were relatively large, and the sustainable development level of Kunshan City had a moderate change rate.
As indicated by the changes in the sustainable development subsystems of various districts (county-level cities) in Suzhou City from 2000 to 2016, in terms of the resource conservation index, Taicang City had the largest growth and change rates, followed by Wujiang District. Kunshan City, Changshu City, and Zhangjiagang City, along the Yangtze River, featured the lowest growth and change rates, but they all exhibited a growth trend (Figure 5). When it came to the ecological protection index, except for Changshu City, which experienced a slight decrease, the ecological protection index of other districts in Suzhou City showed an increasing trend. Among them, the ecological protection index of Gusu District, Huqiu District, and Wuzhong District increased significantly, whereas the growth rate of that of Taicang City, Zhangjiagang City, and Kunshan City was relatively small (Figure 6). As for the economic growth index, the growth and change rates of Changshu City, Zhangjiagang City, and Taicang City were comparatively small, whereas the Xiangcheng District and Huqiu District were characterized by an obvious rate of increase (Figure 7). Significantly different from other indices, the livelihood improvement index of the three cities along the Yangtze River turned out to be more ideal when it came to both the growth rate and the change rate (Figure 8). In terms of the scientific and technological progress index, Zhangjiagang City had the largest growth rate, whereas that of Taicang City and Changshu City was relatively low, with that of Gusu District and the surrounding areas ranked in the middle. In addition, the scientific and technological progress index of Gusu District, Xiangcheng District, Huqiu District, and Wuzhong District had a relatively high change rate (Figure 9). The rural development index of Gusu District, Xiangcheng District, Huqiu District, Wuzhong District, and Wujiang District had relatively high growth and change rates, whereas that of the three cities along the Yangtze River and Kunshan City was characterized by comparatively low growth and change rates (Figure 10).

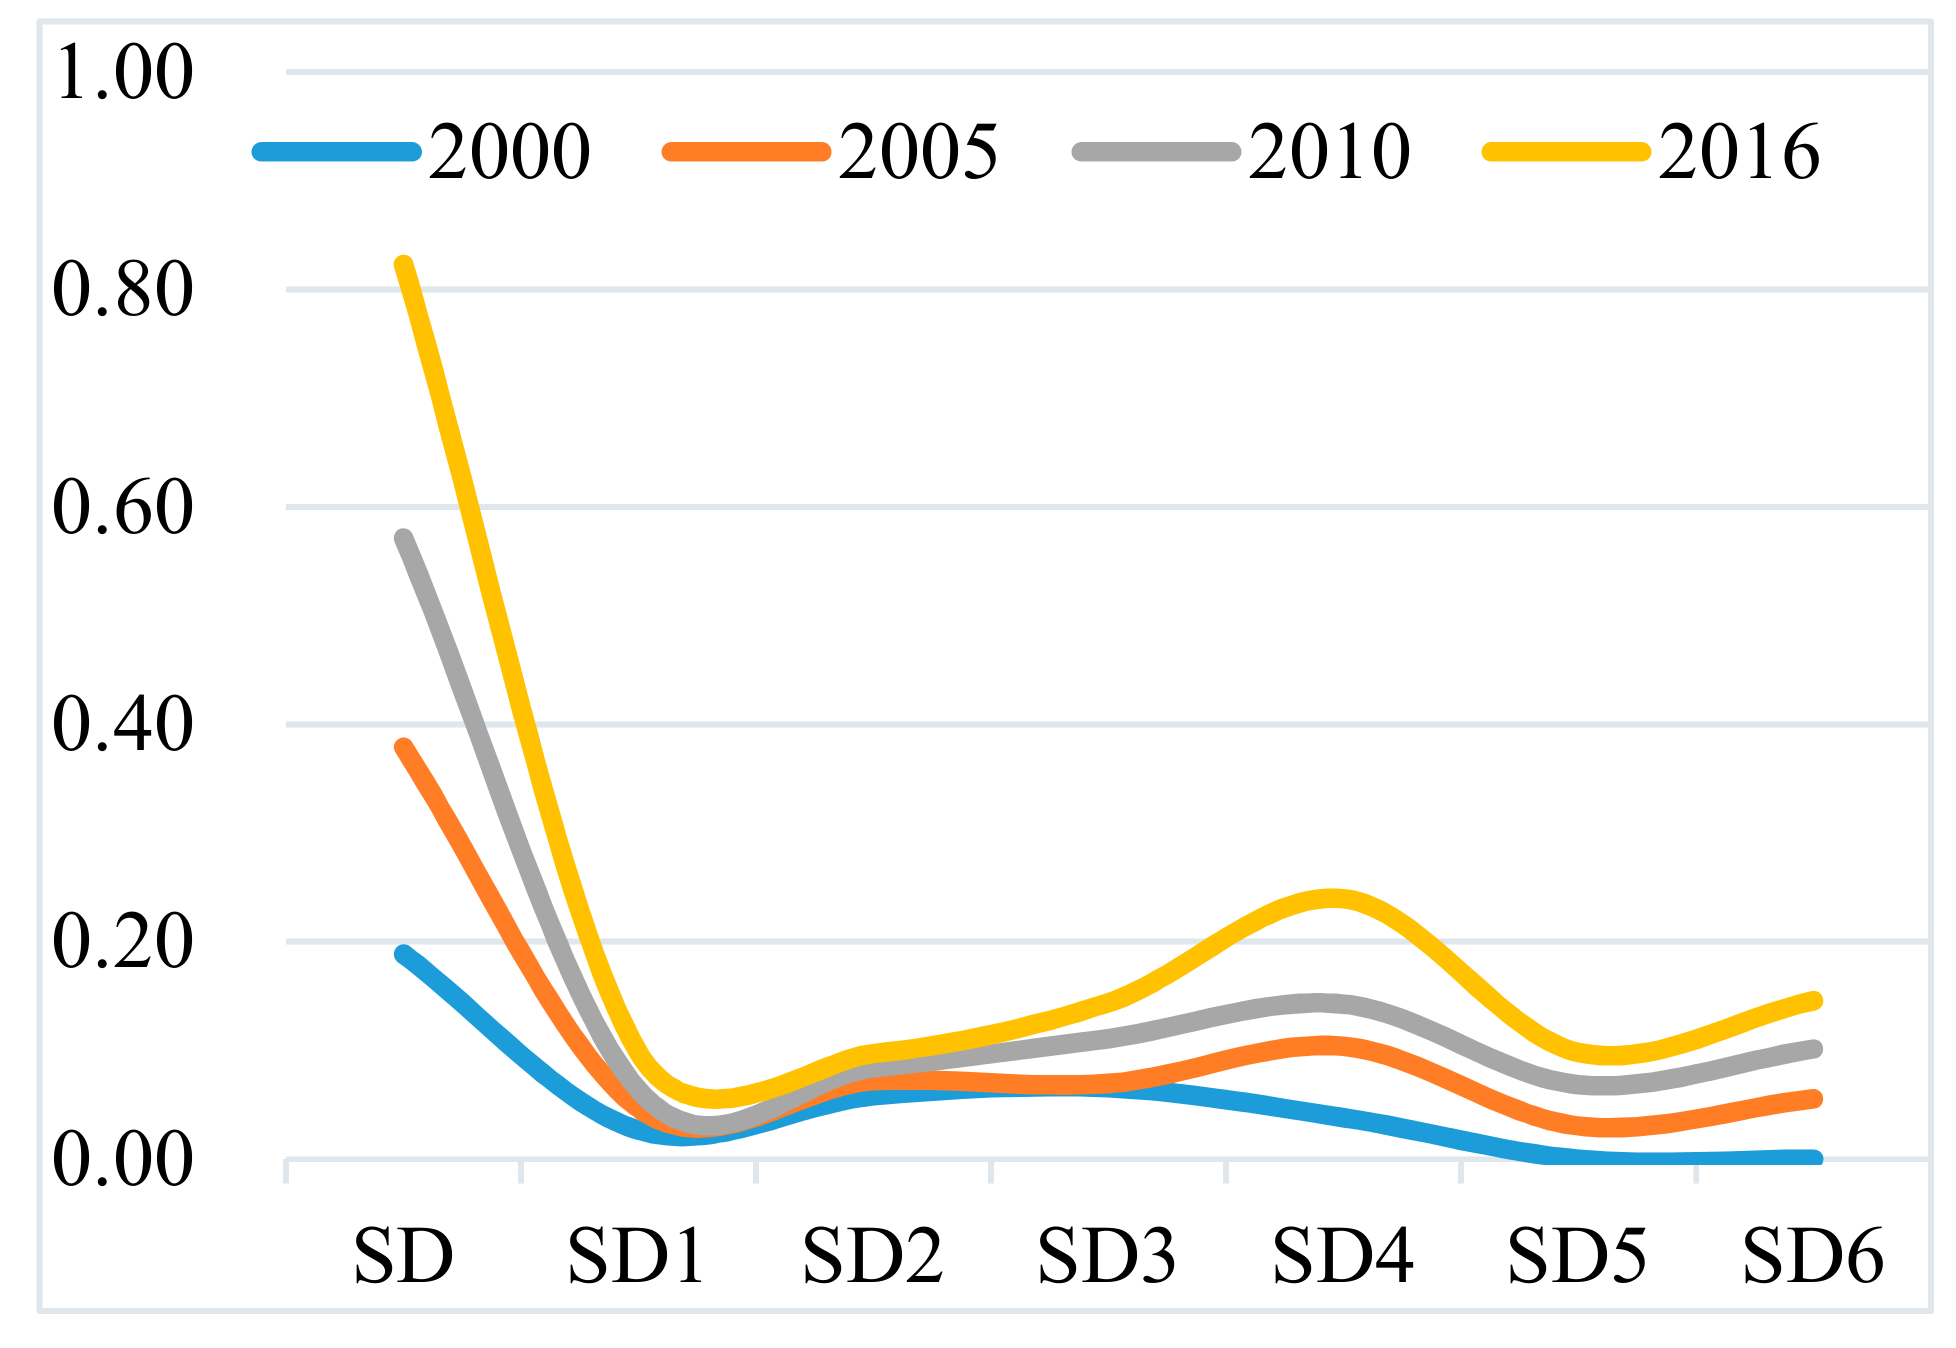
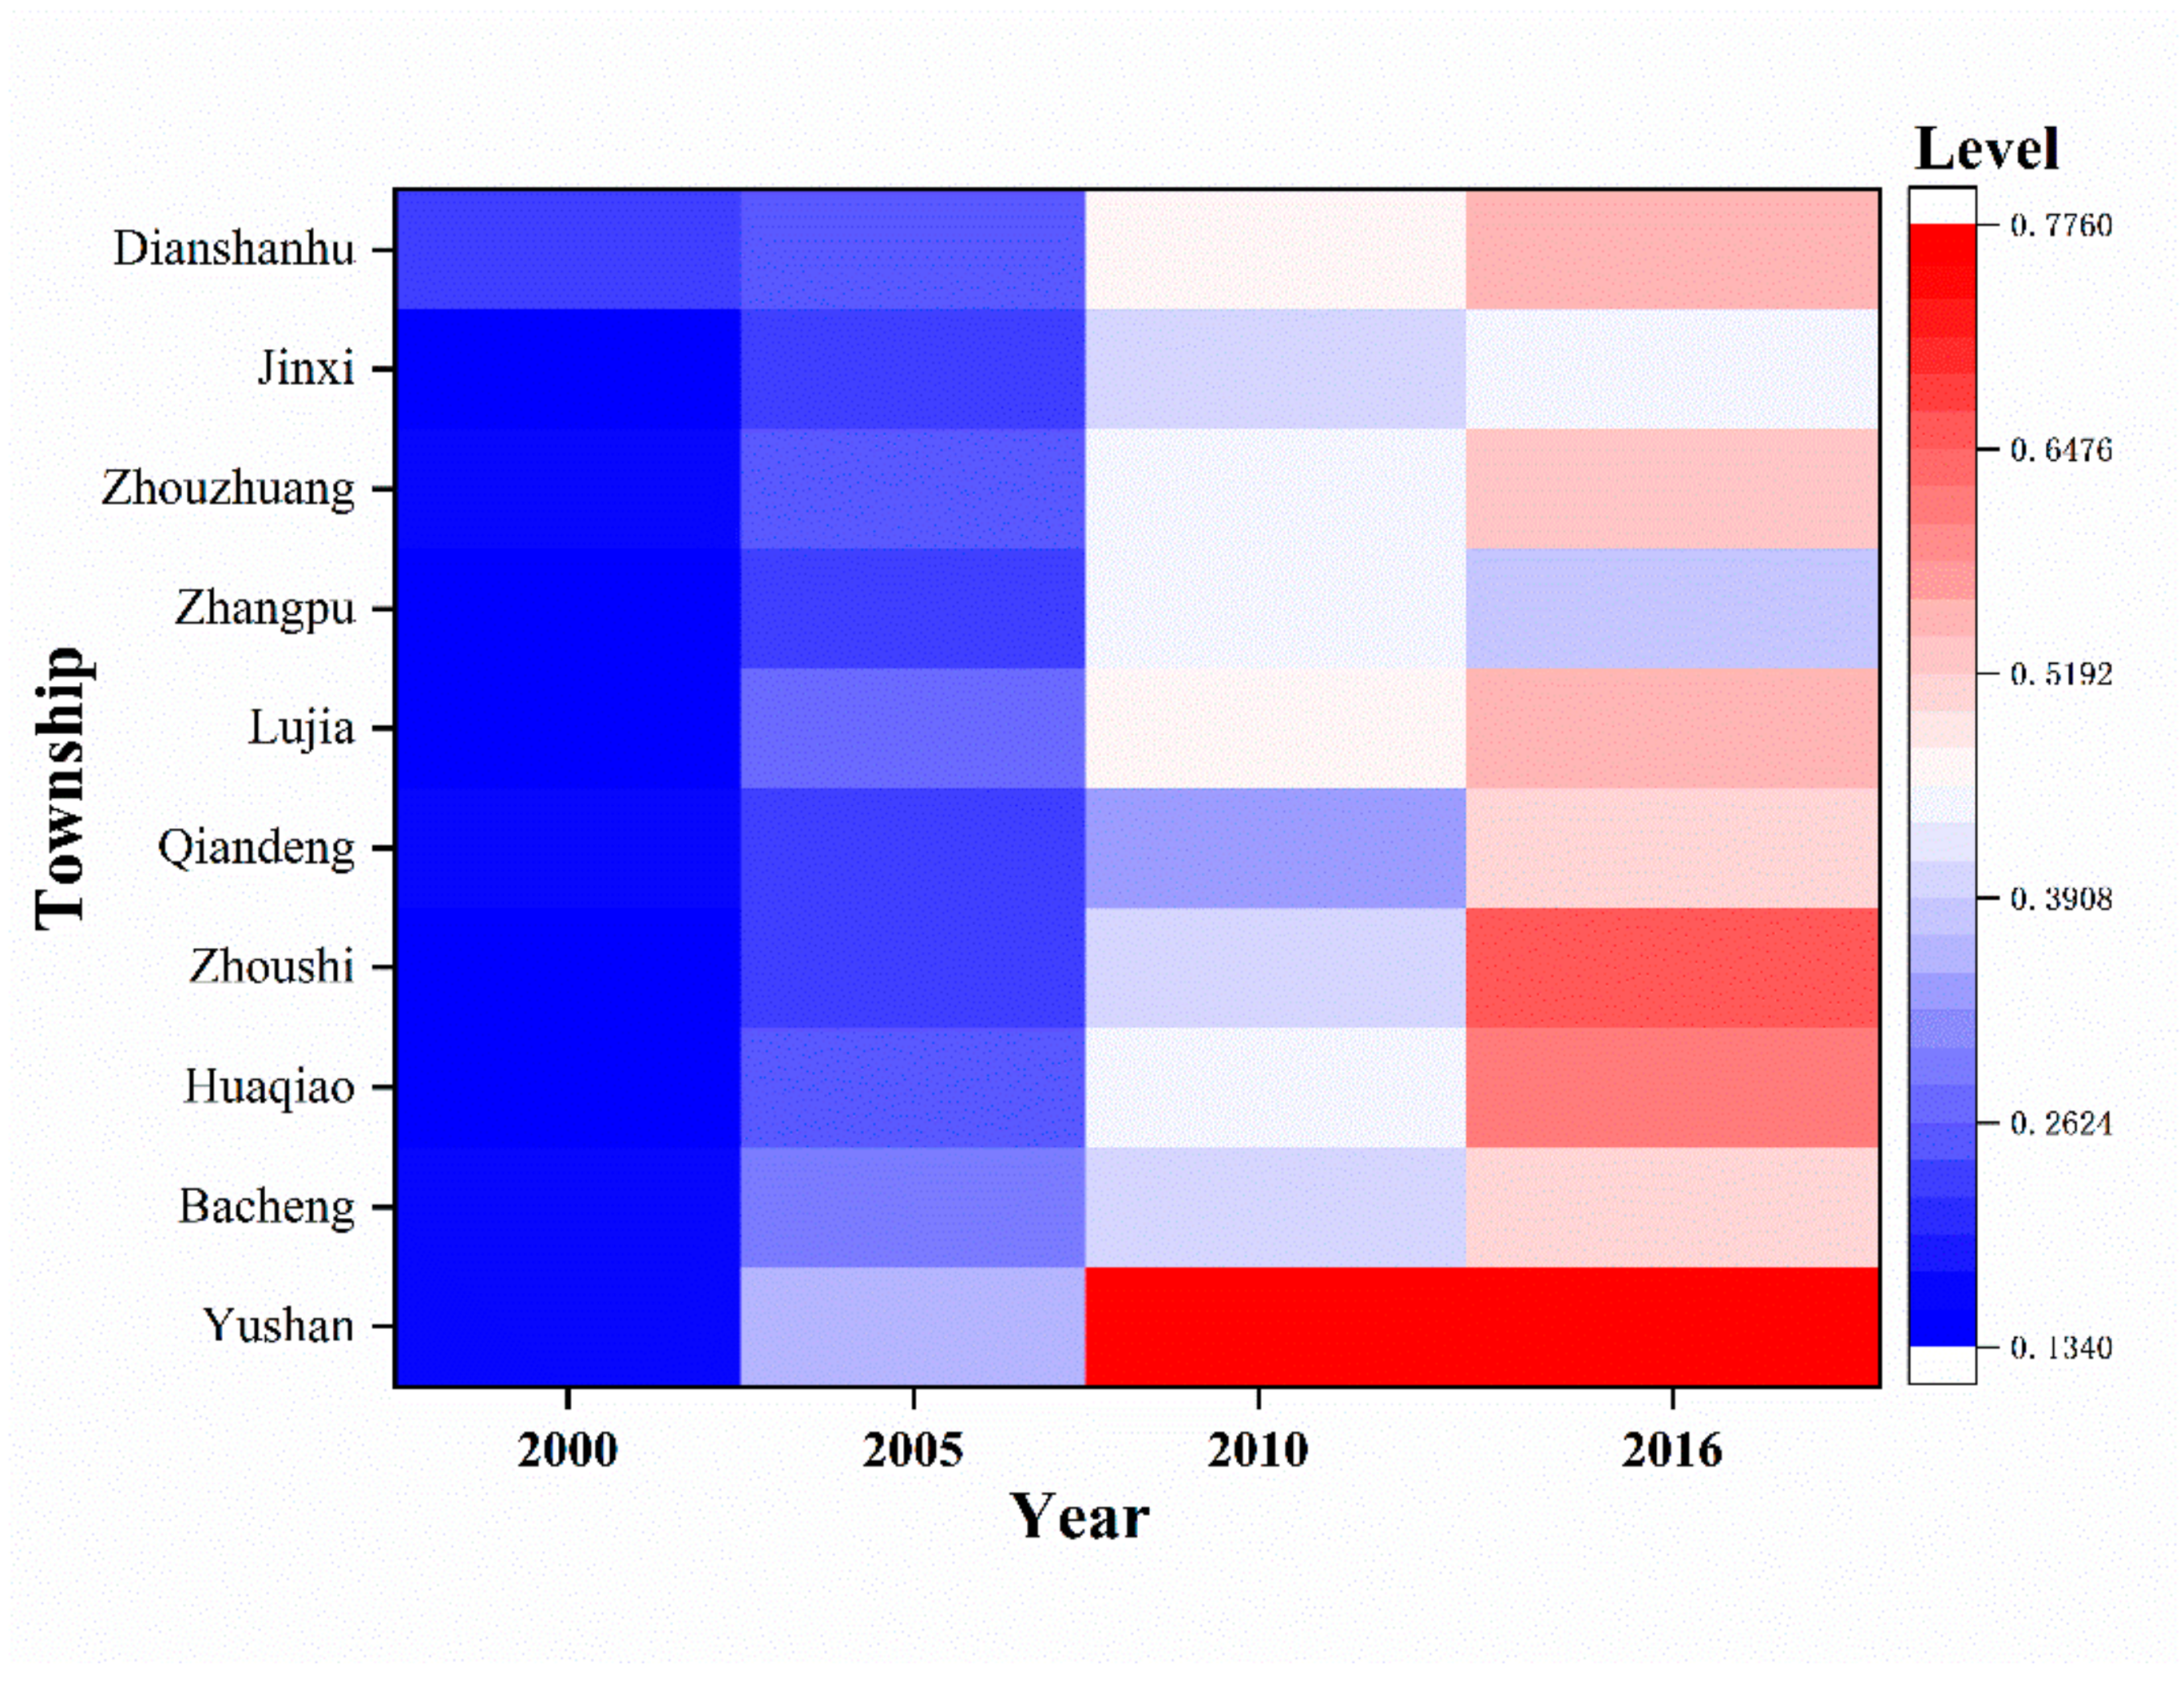
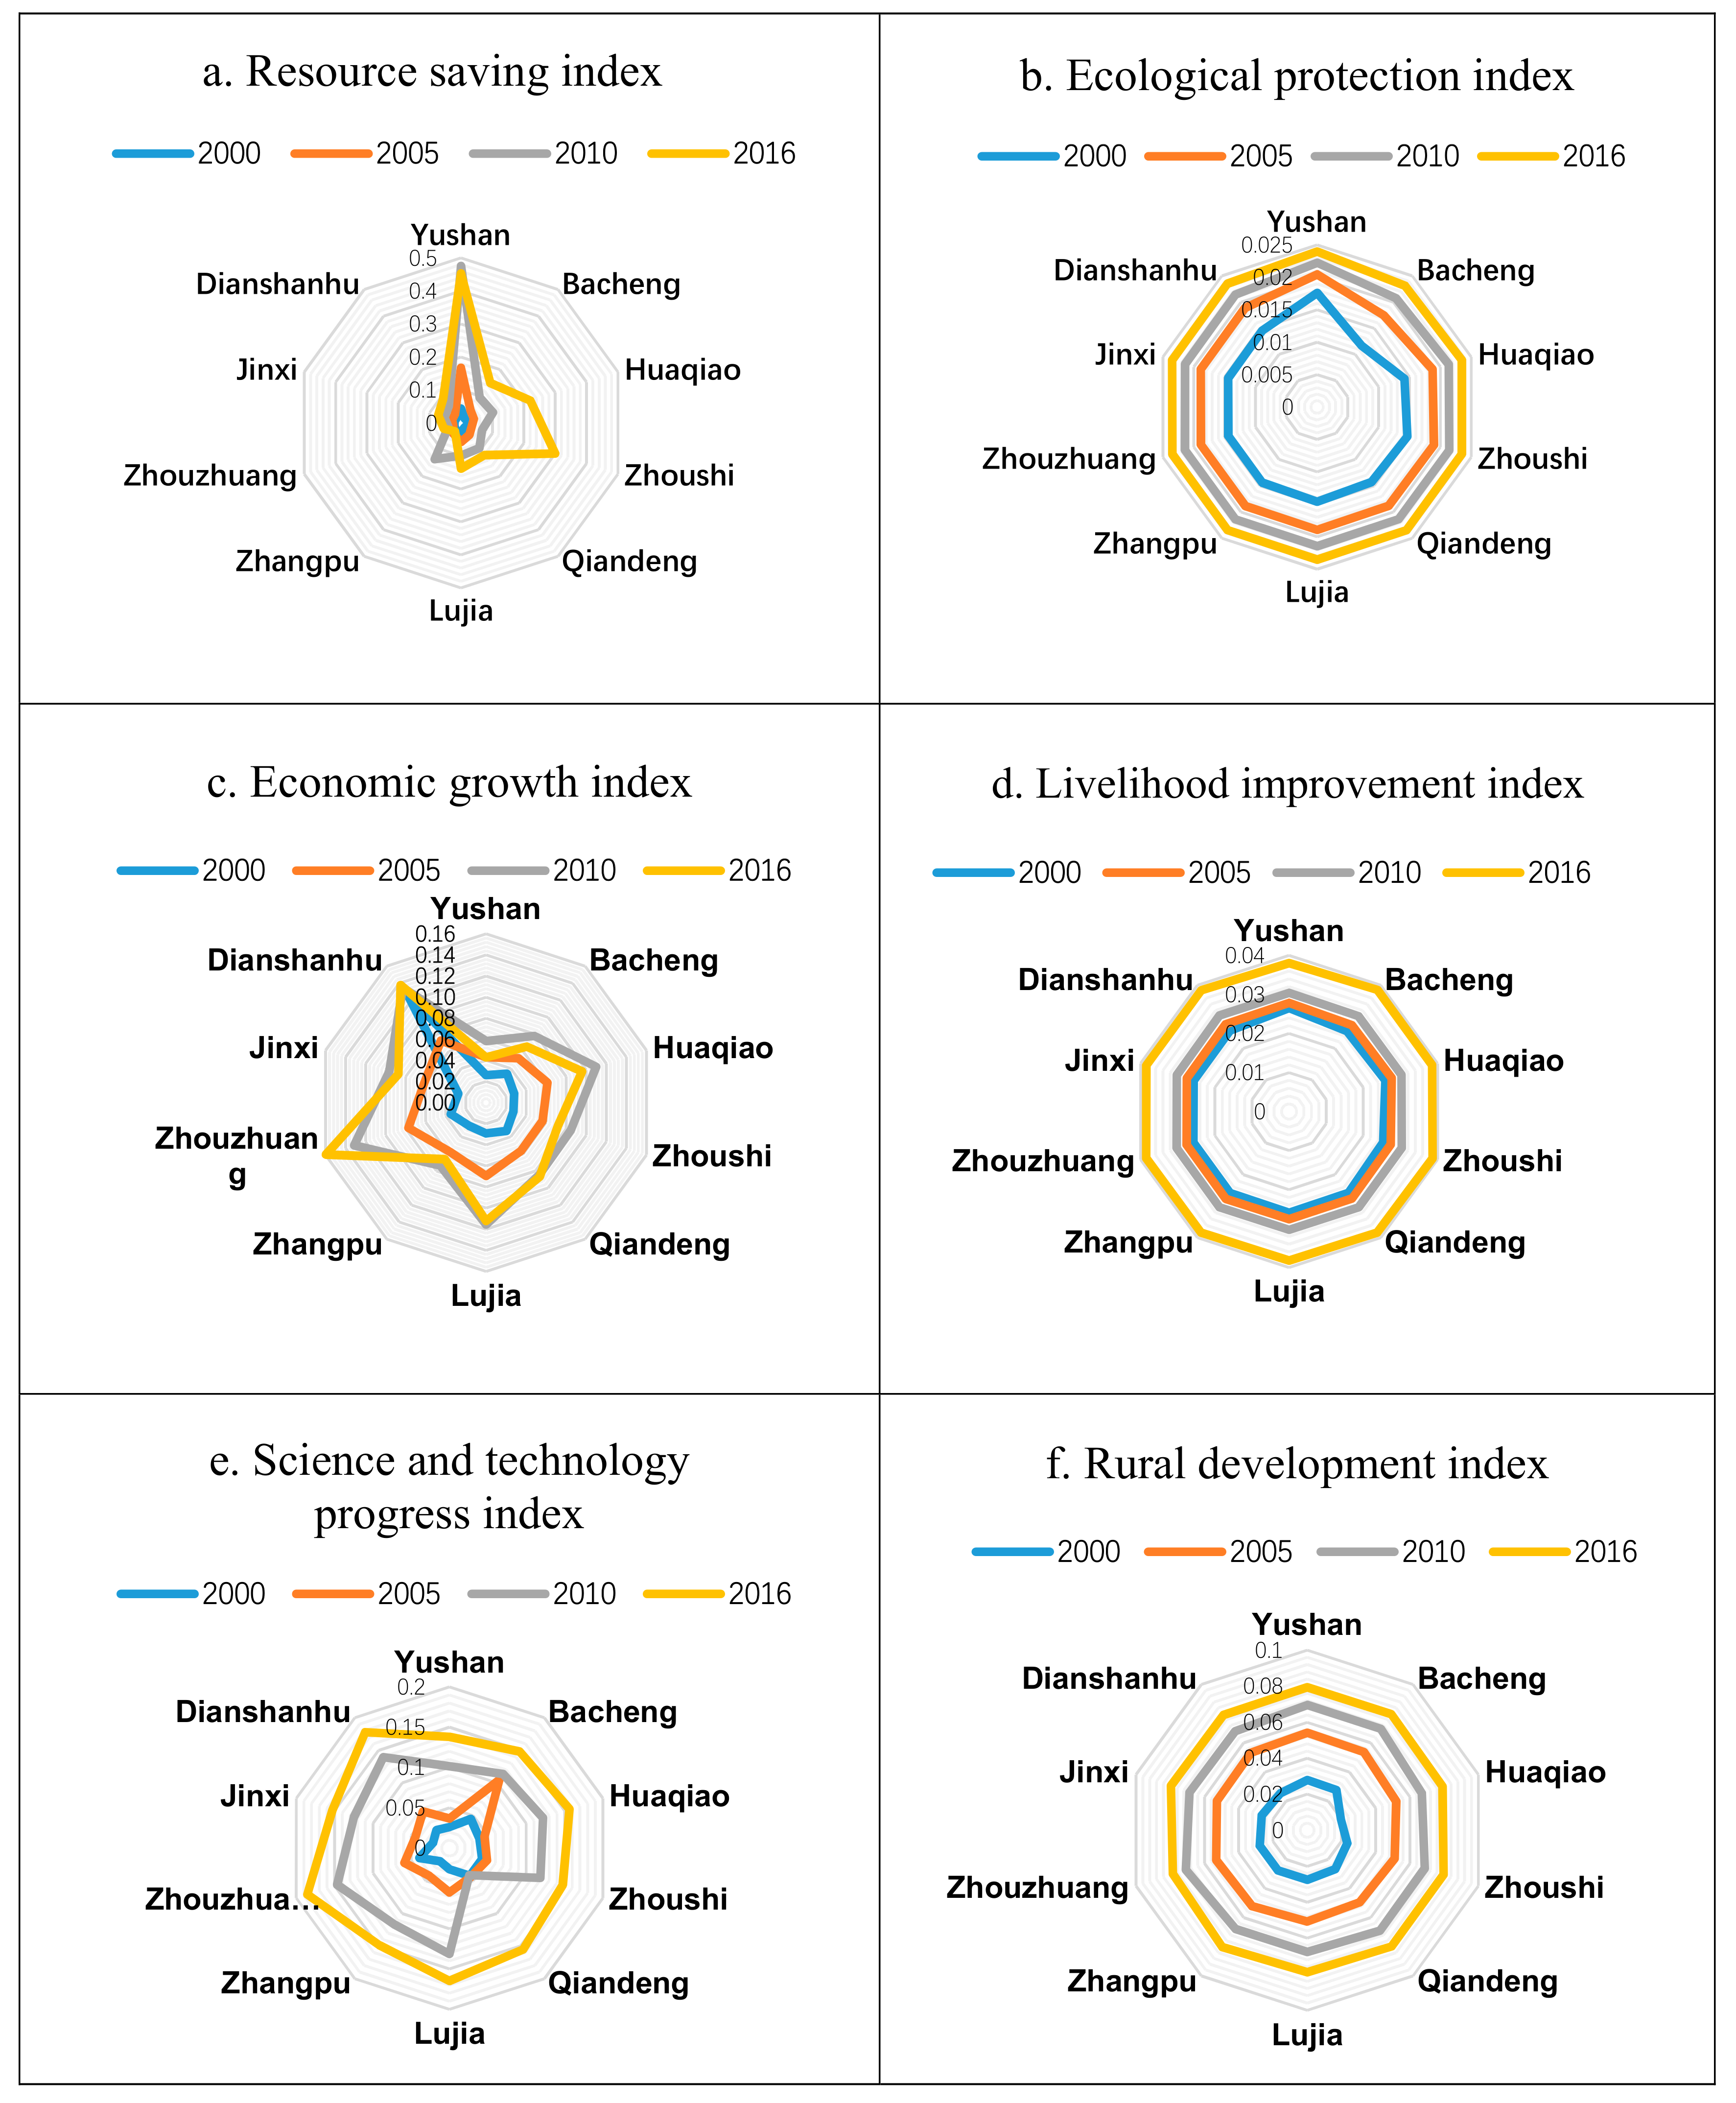
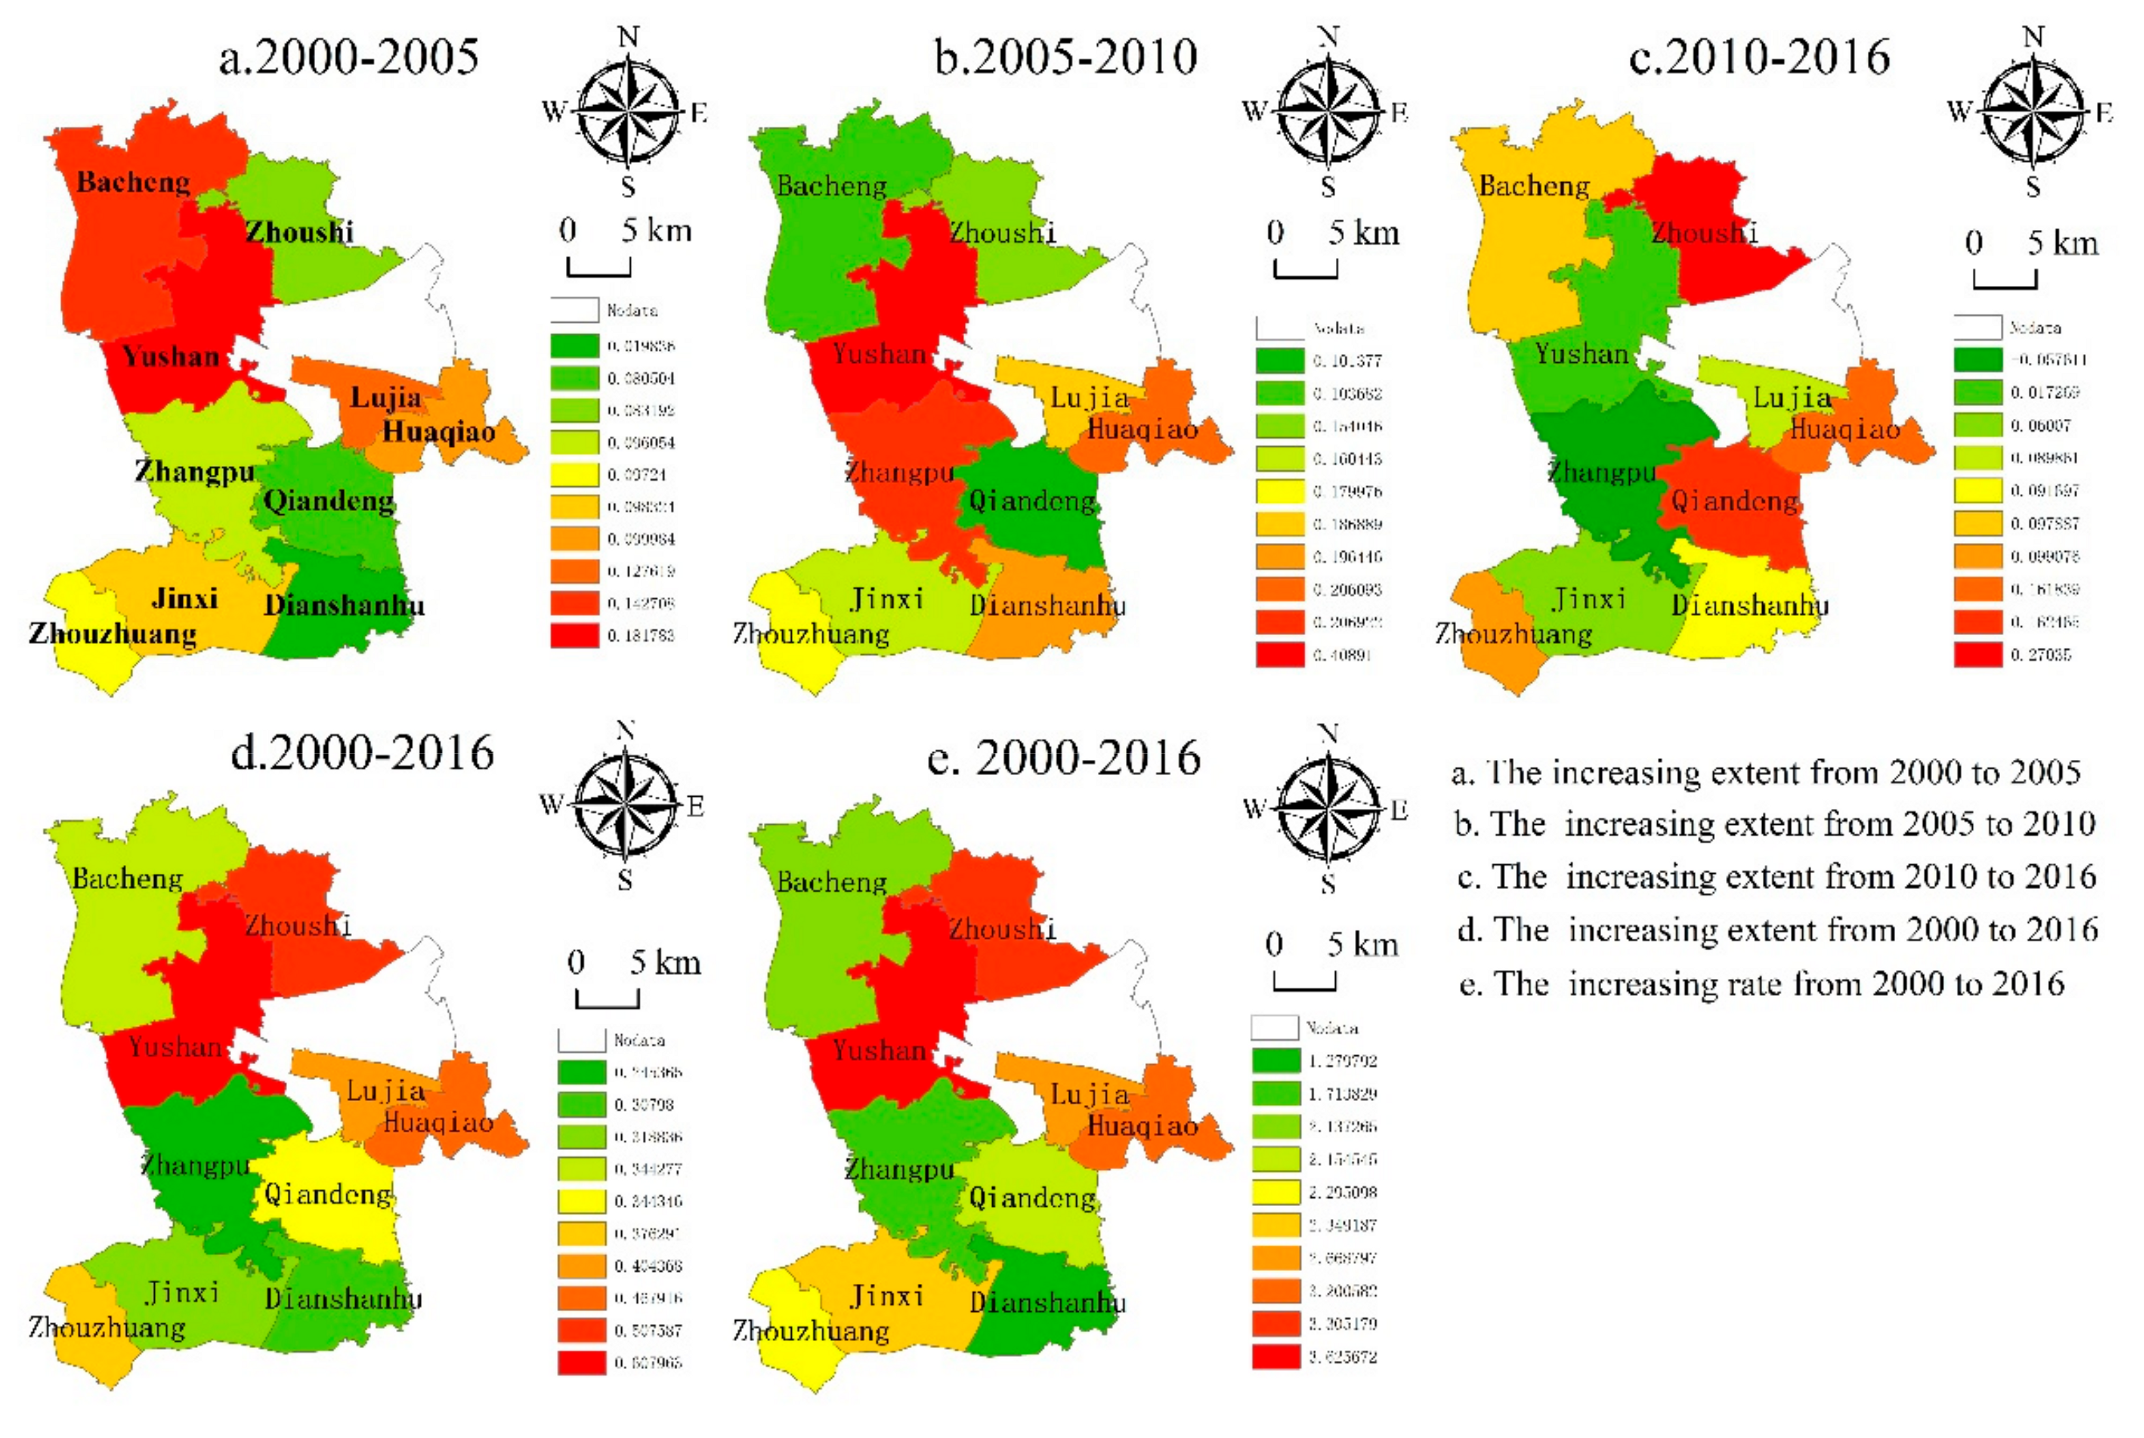
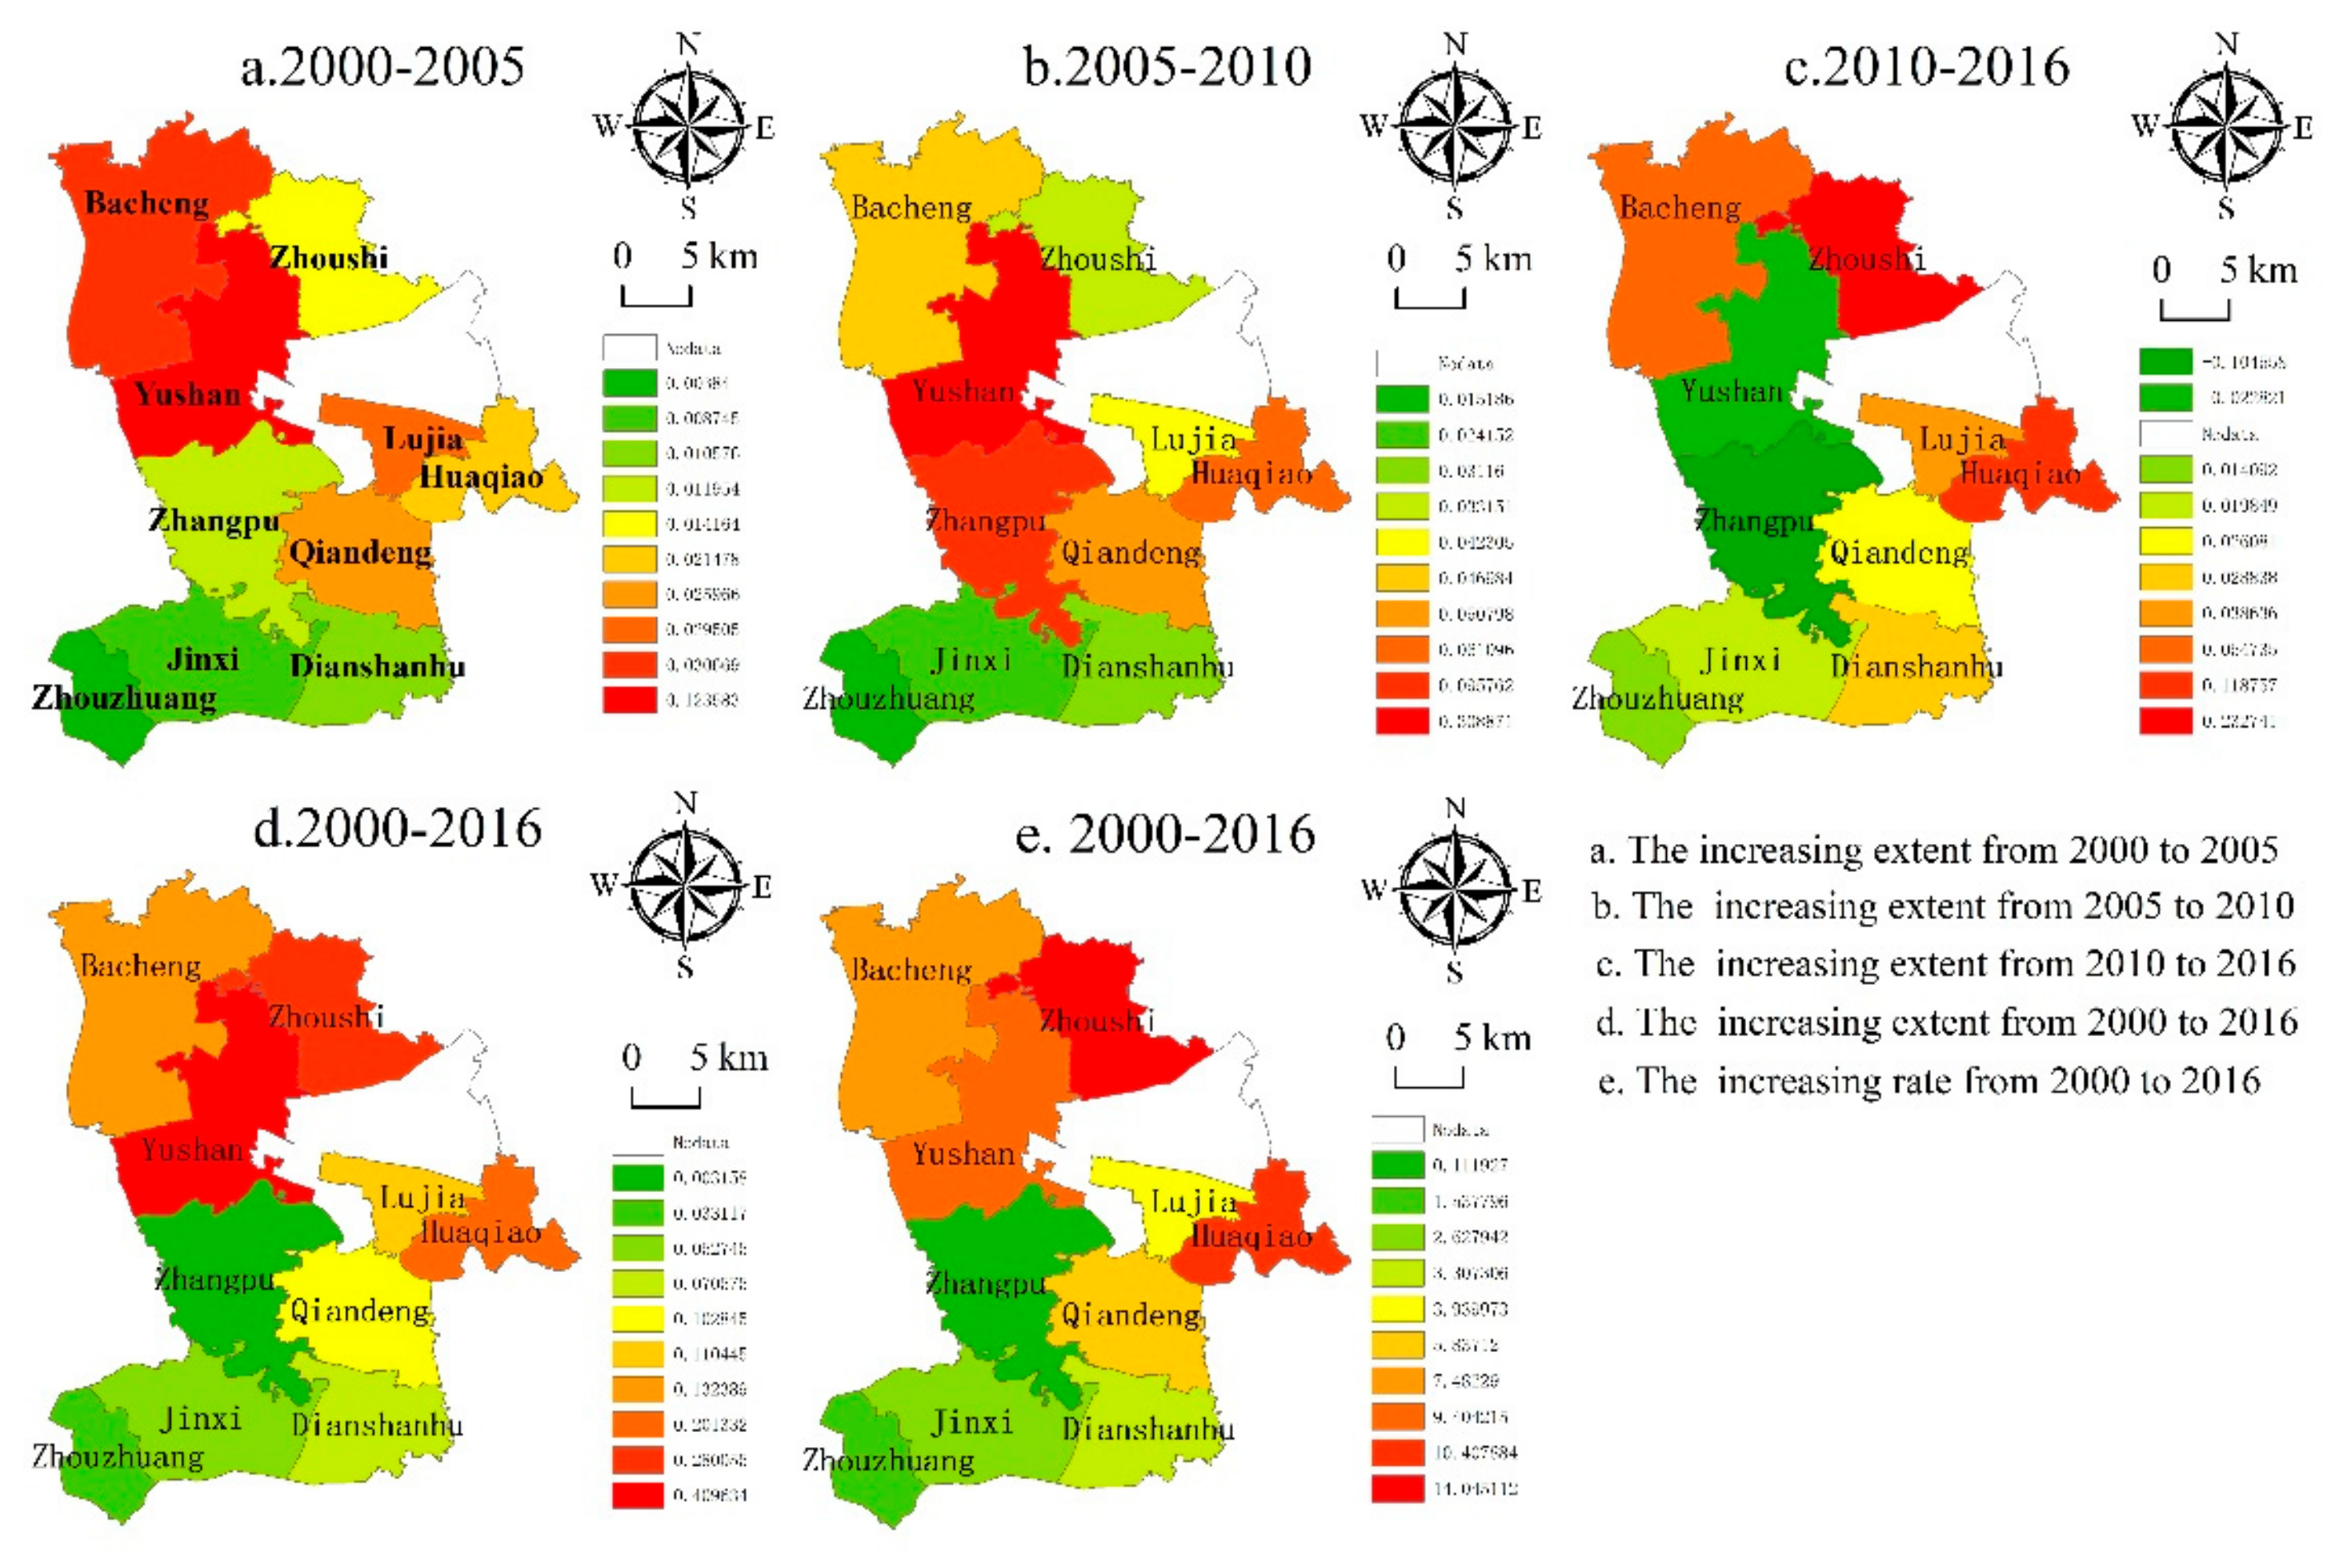
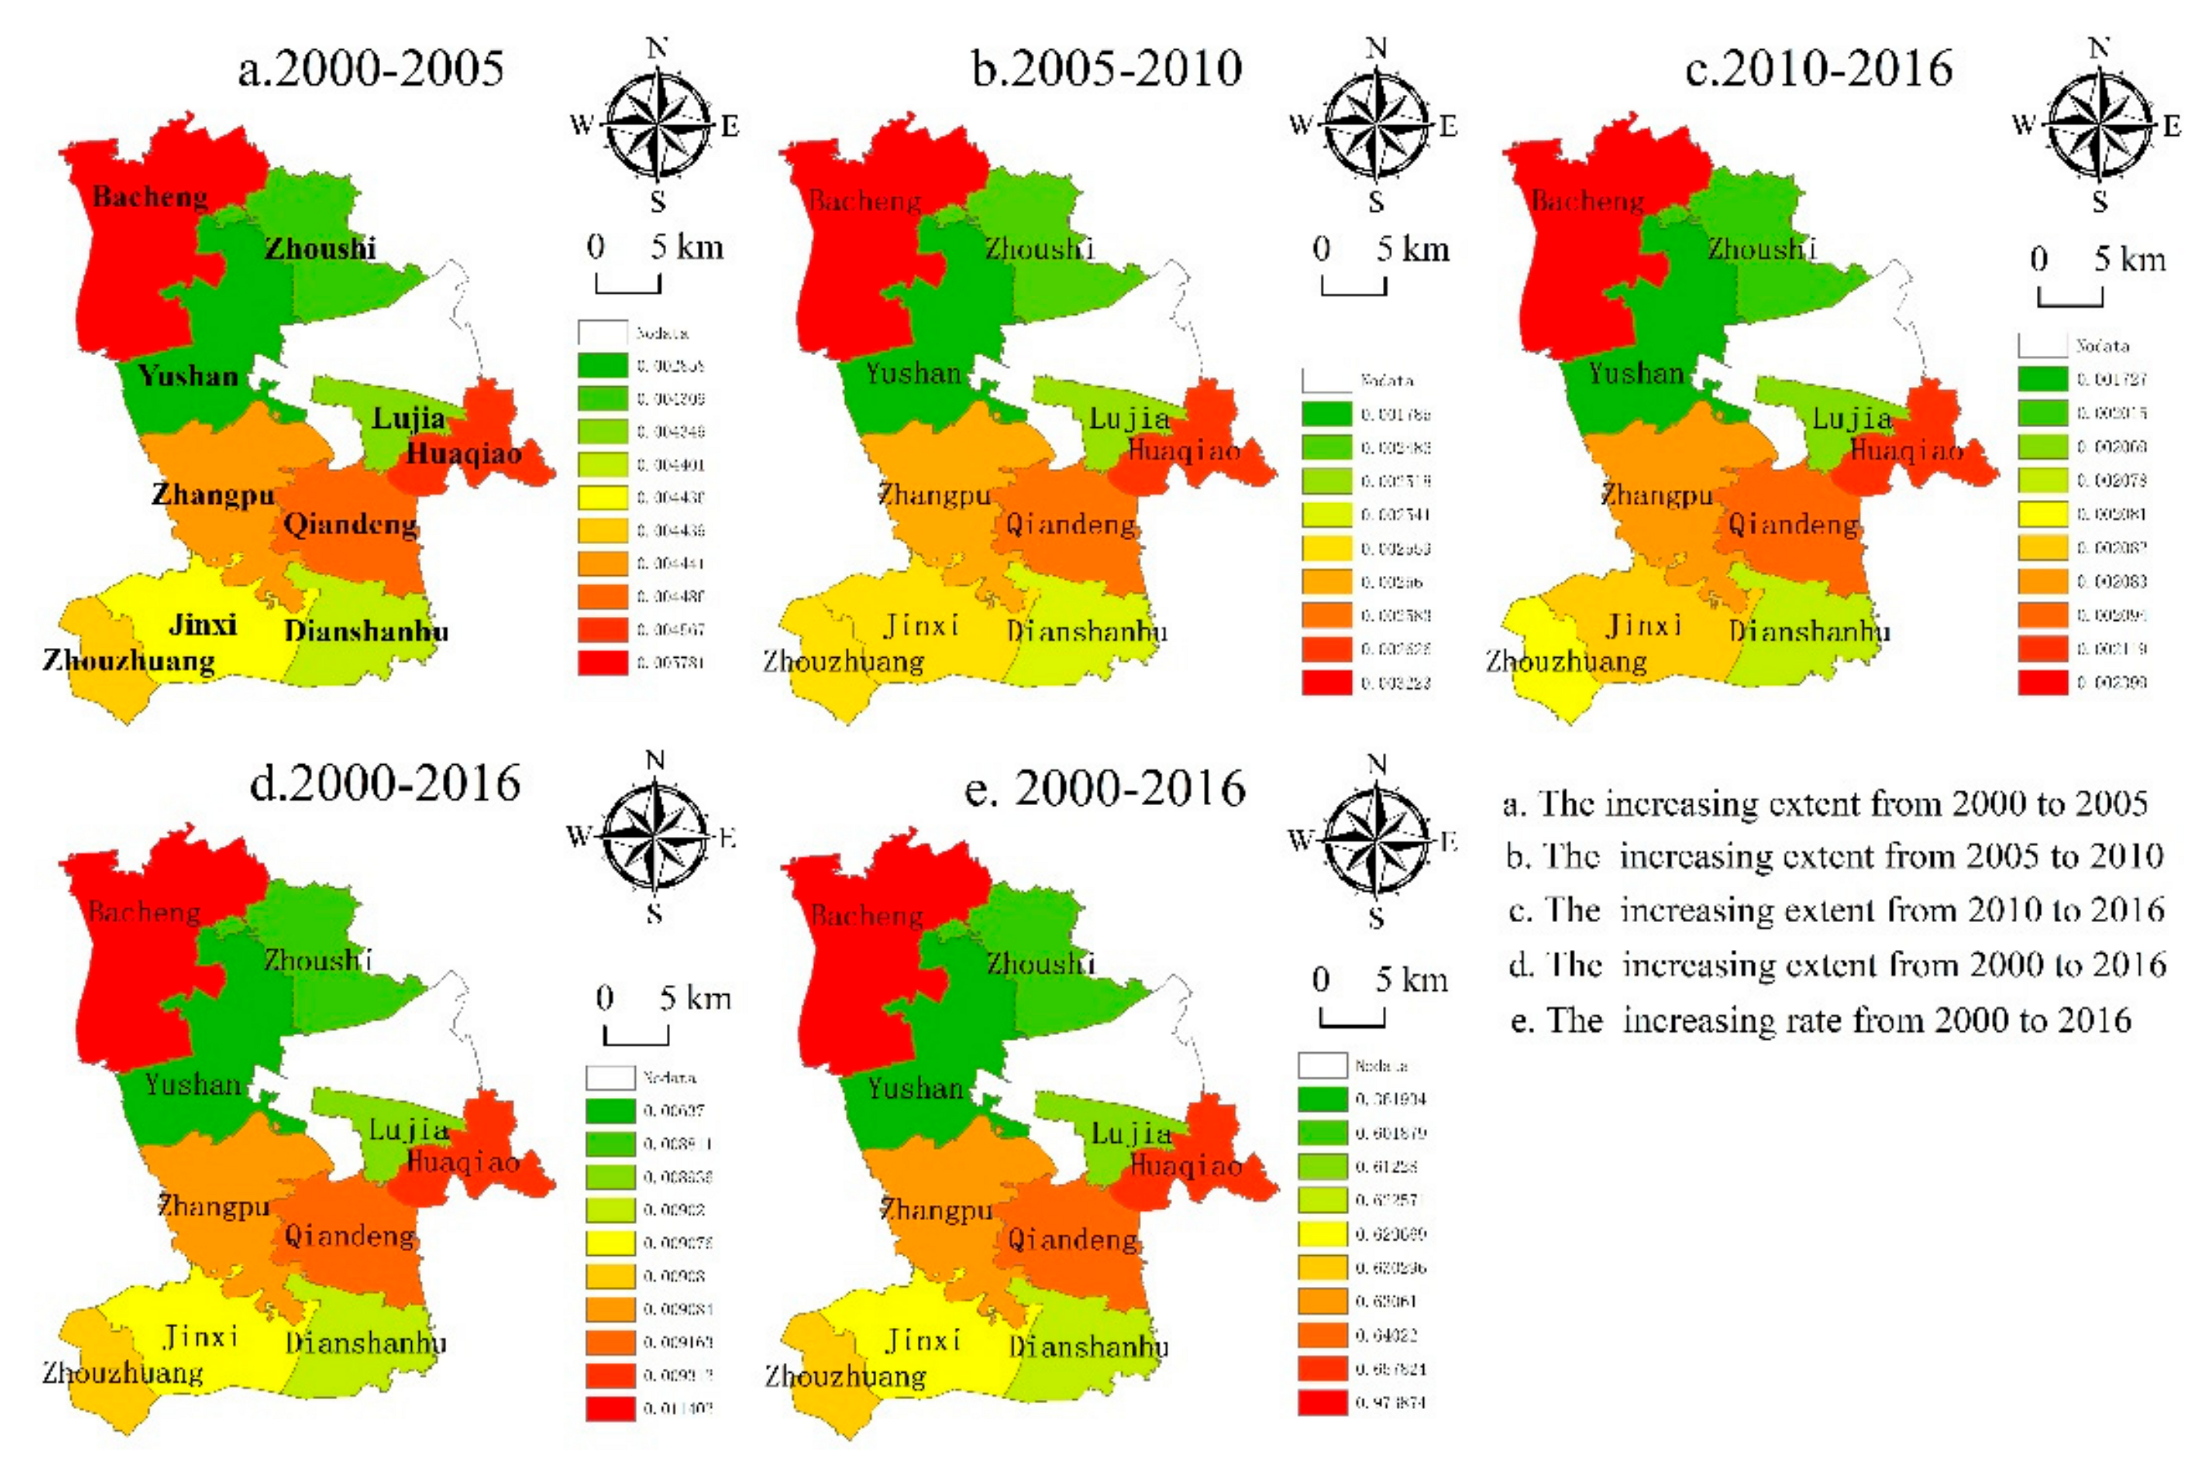
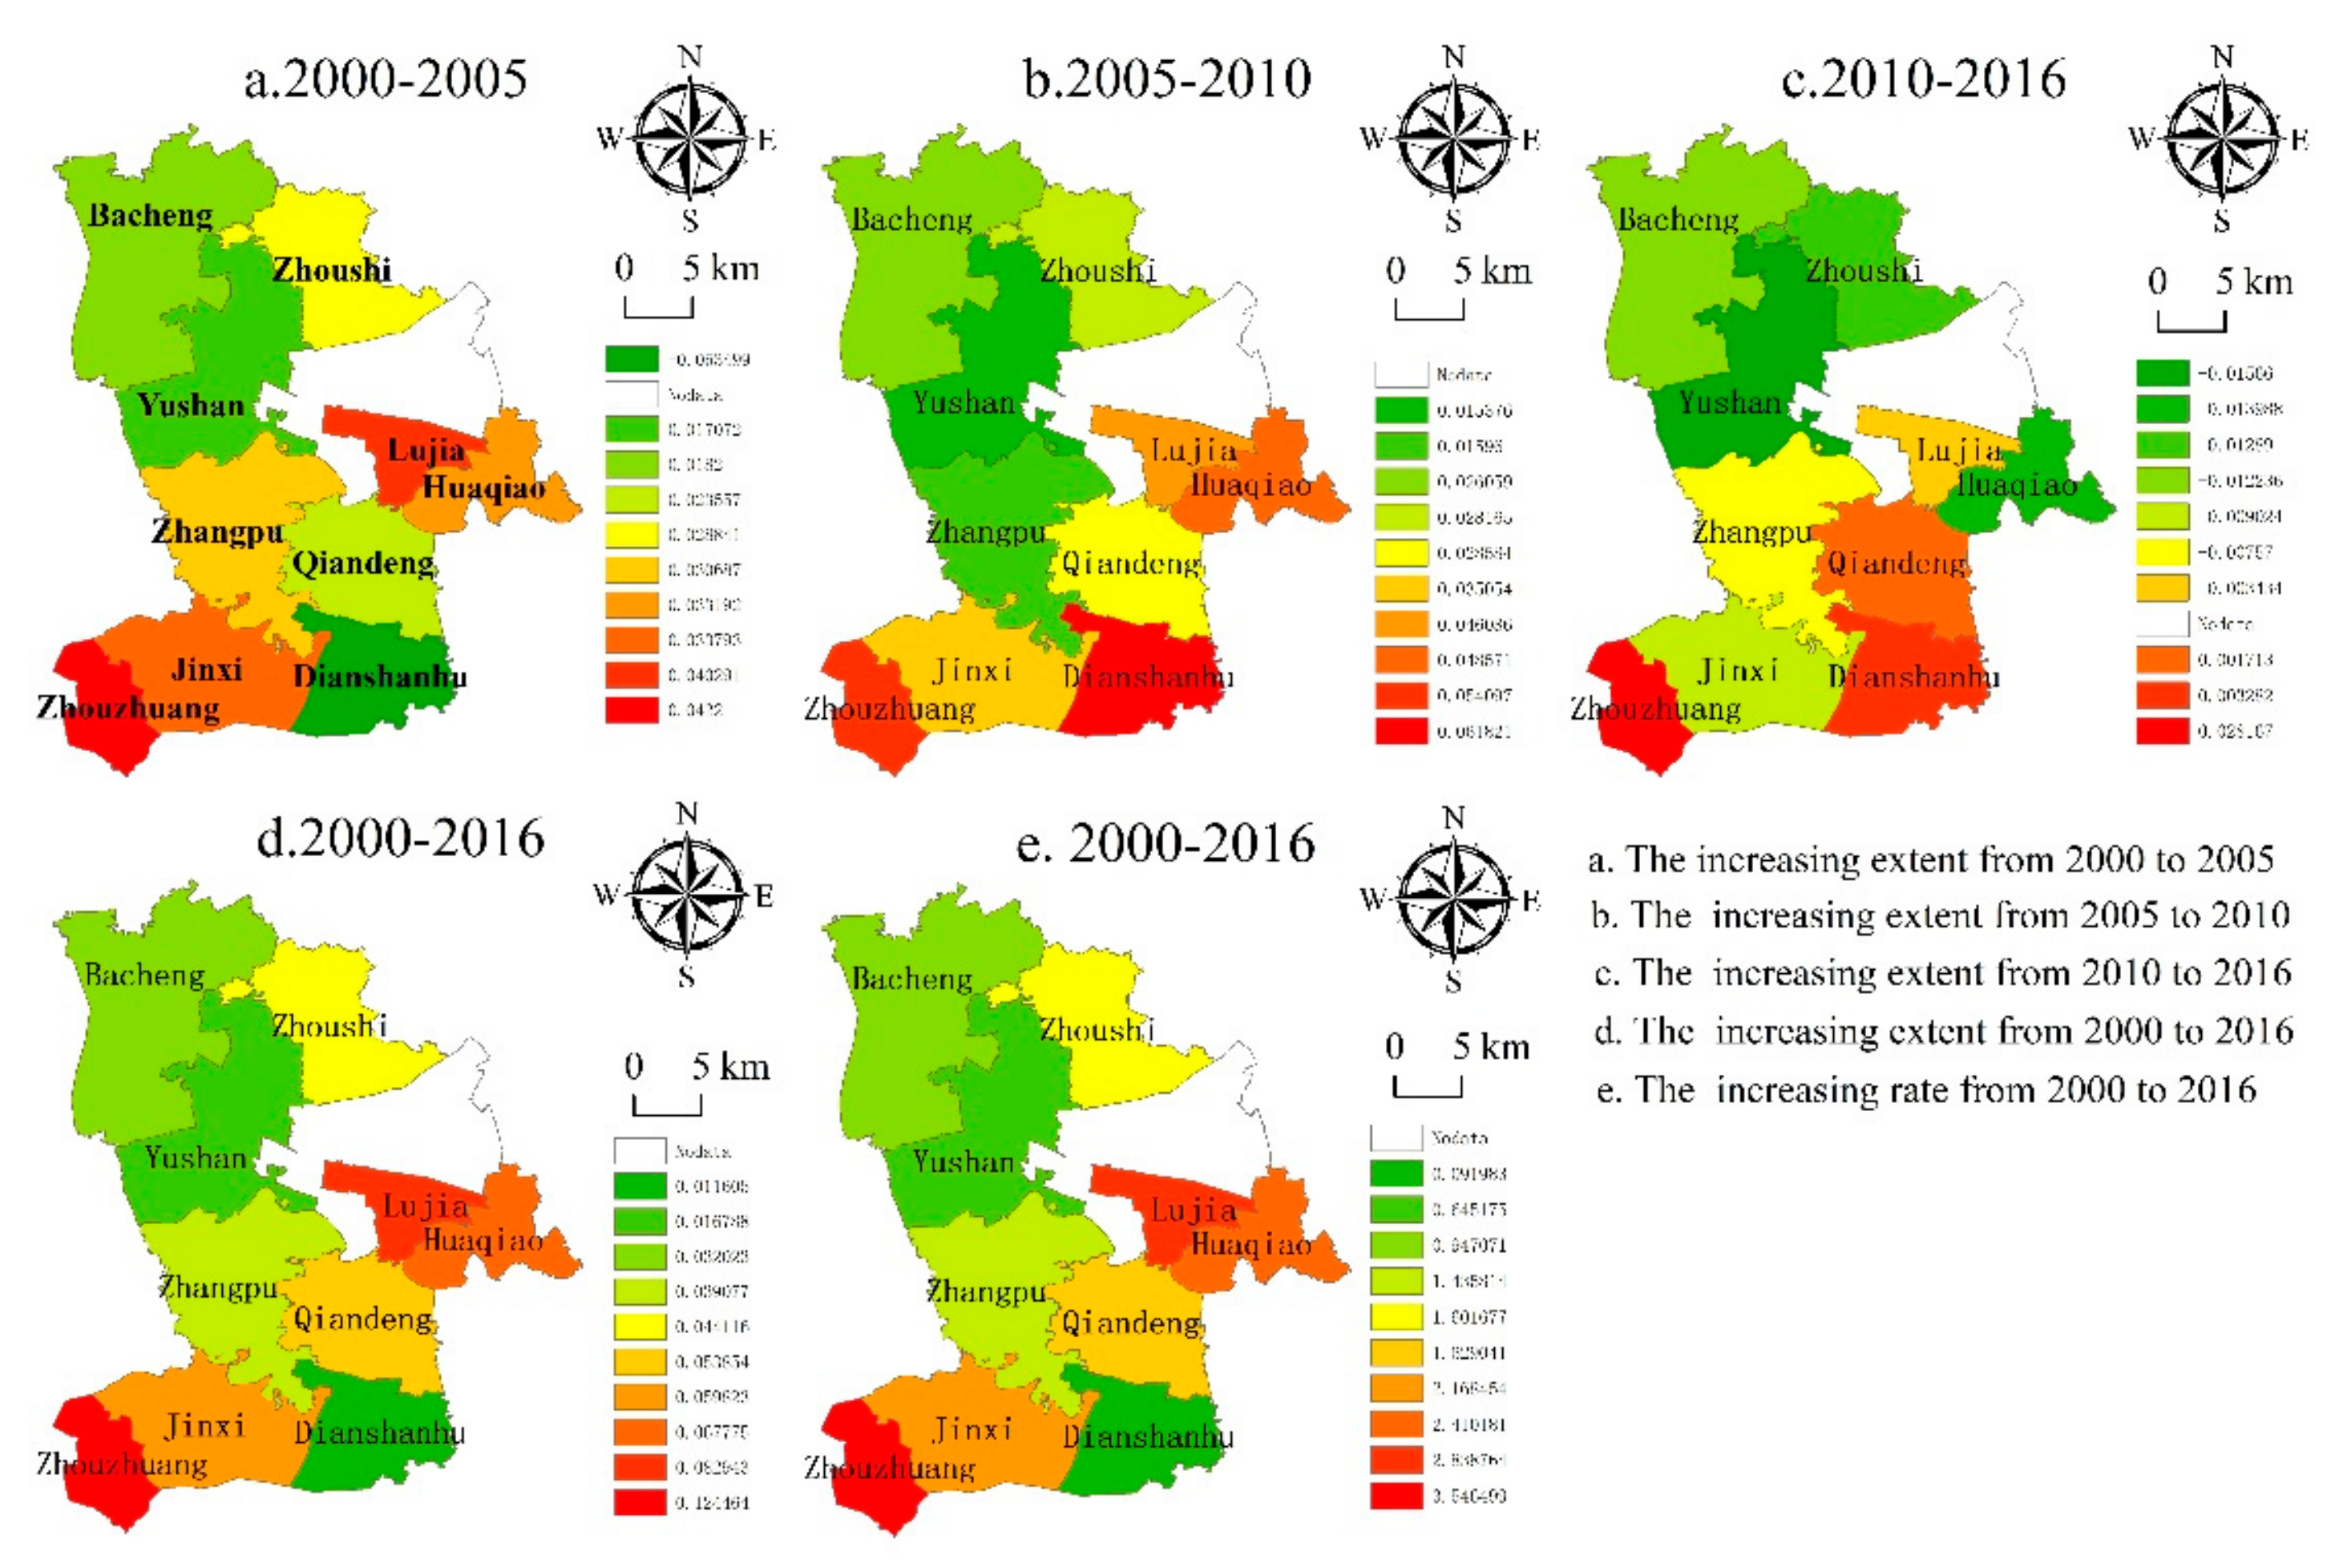
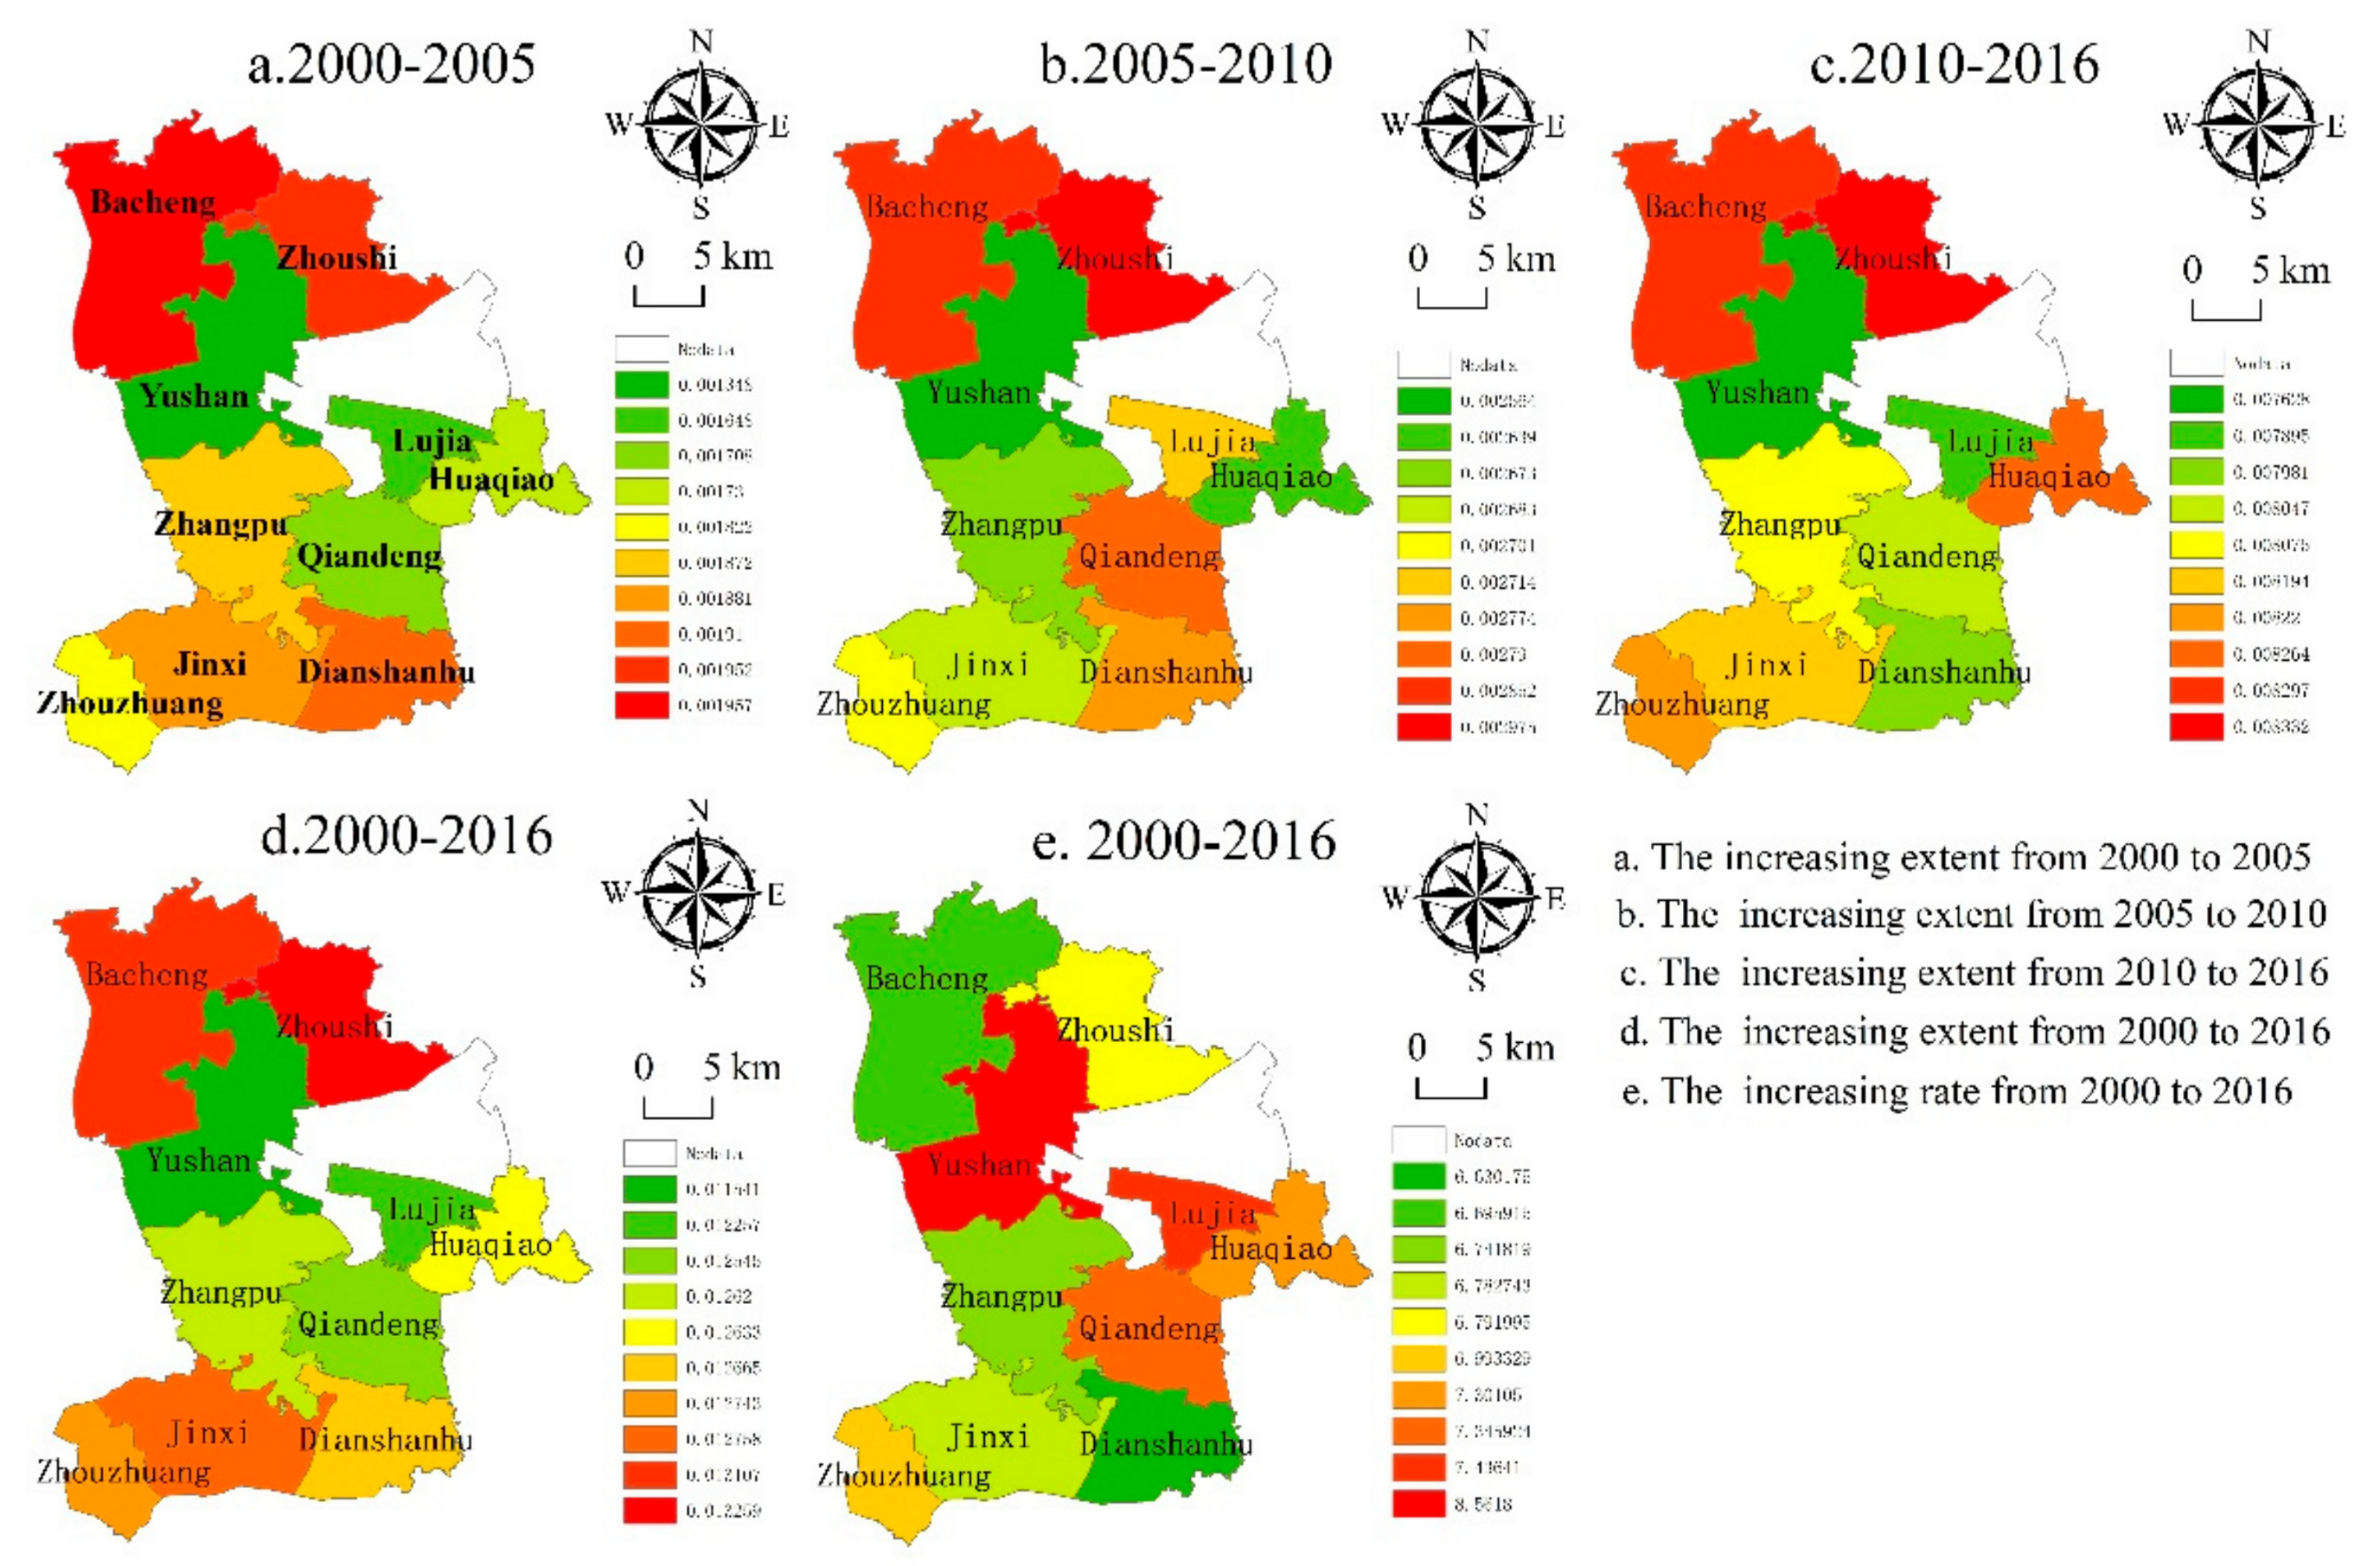
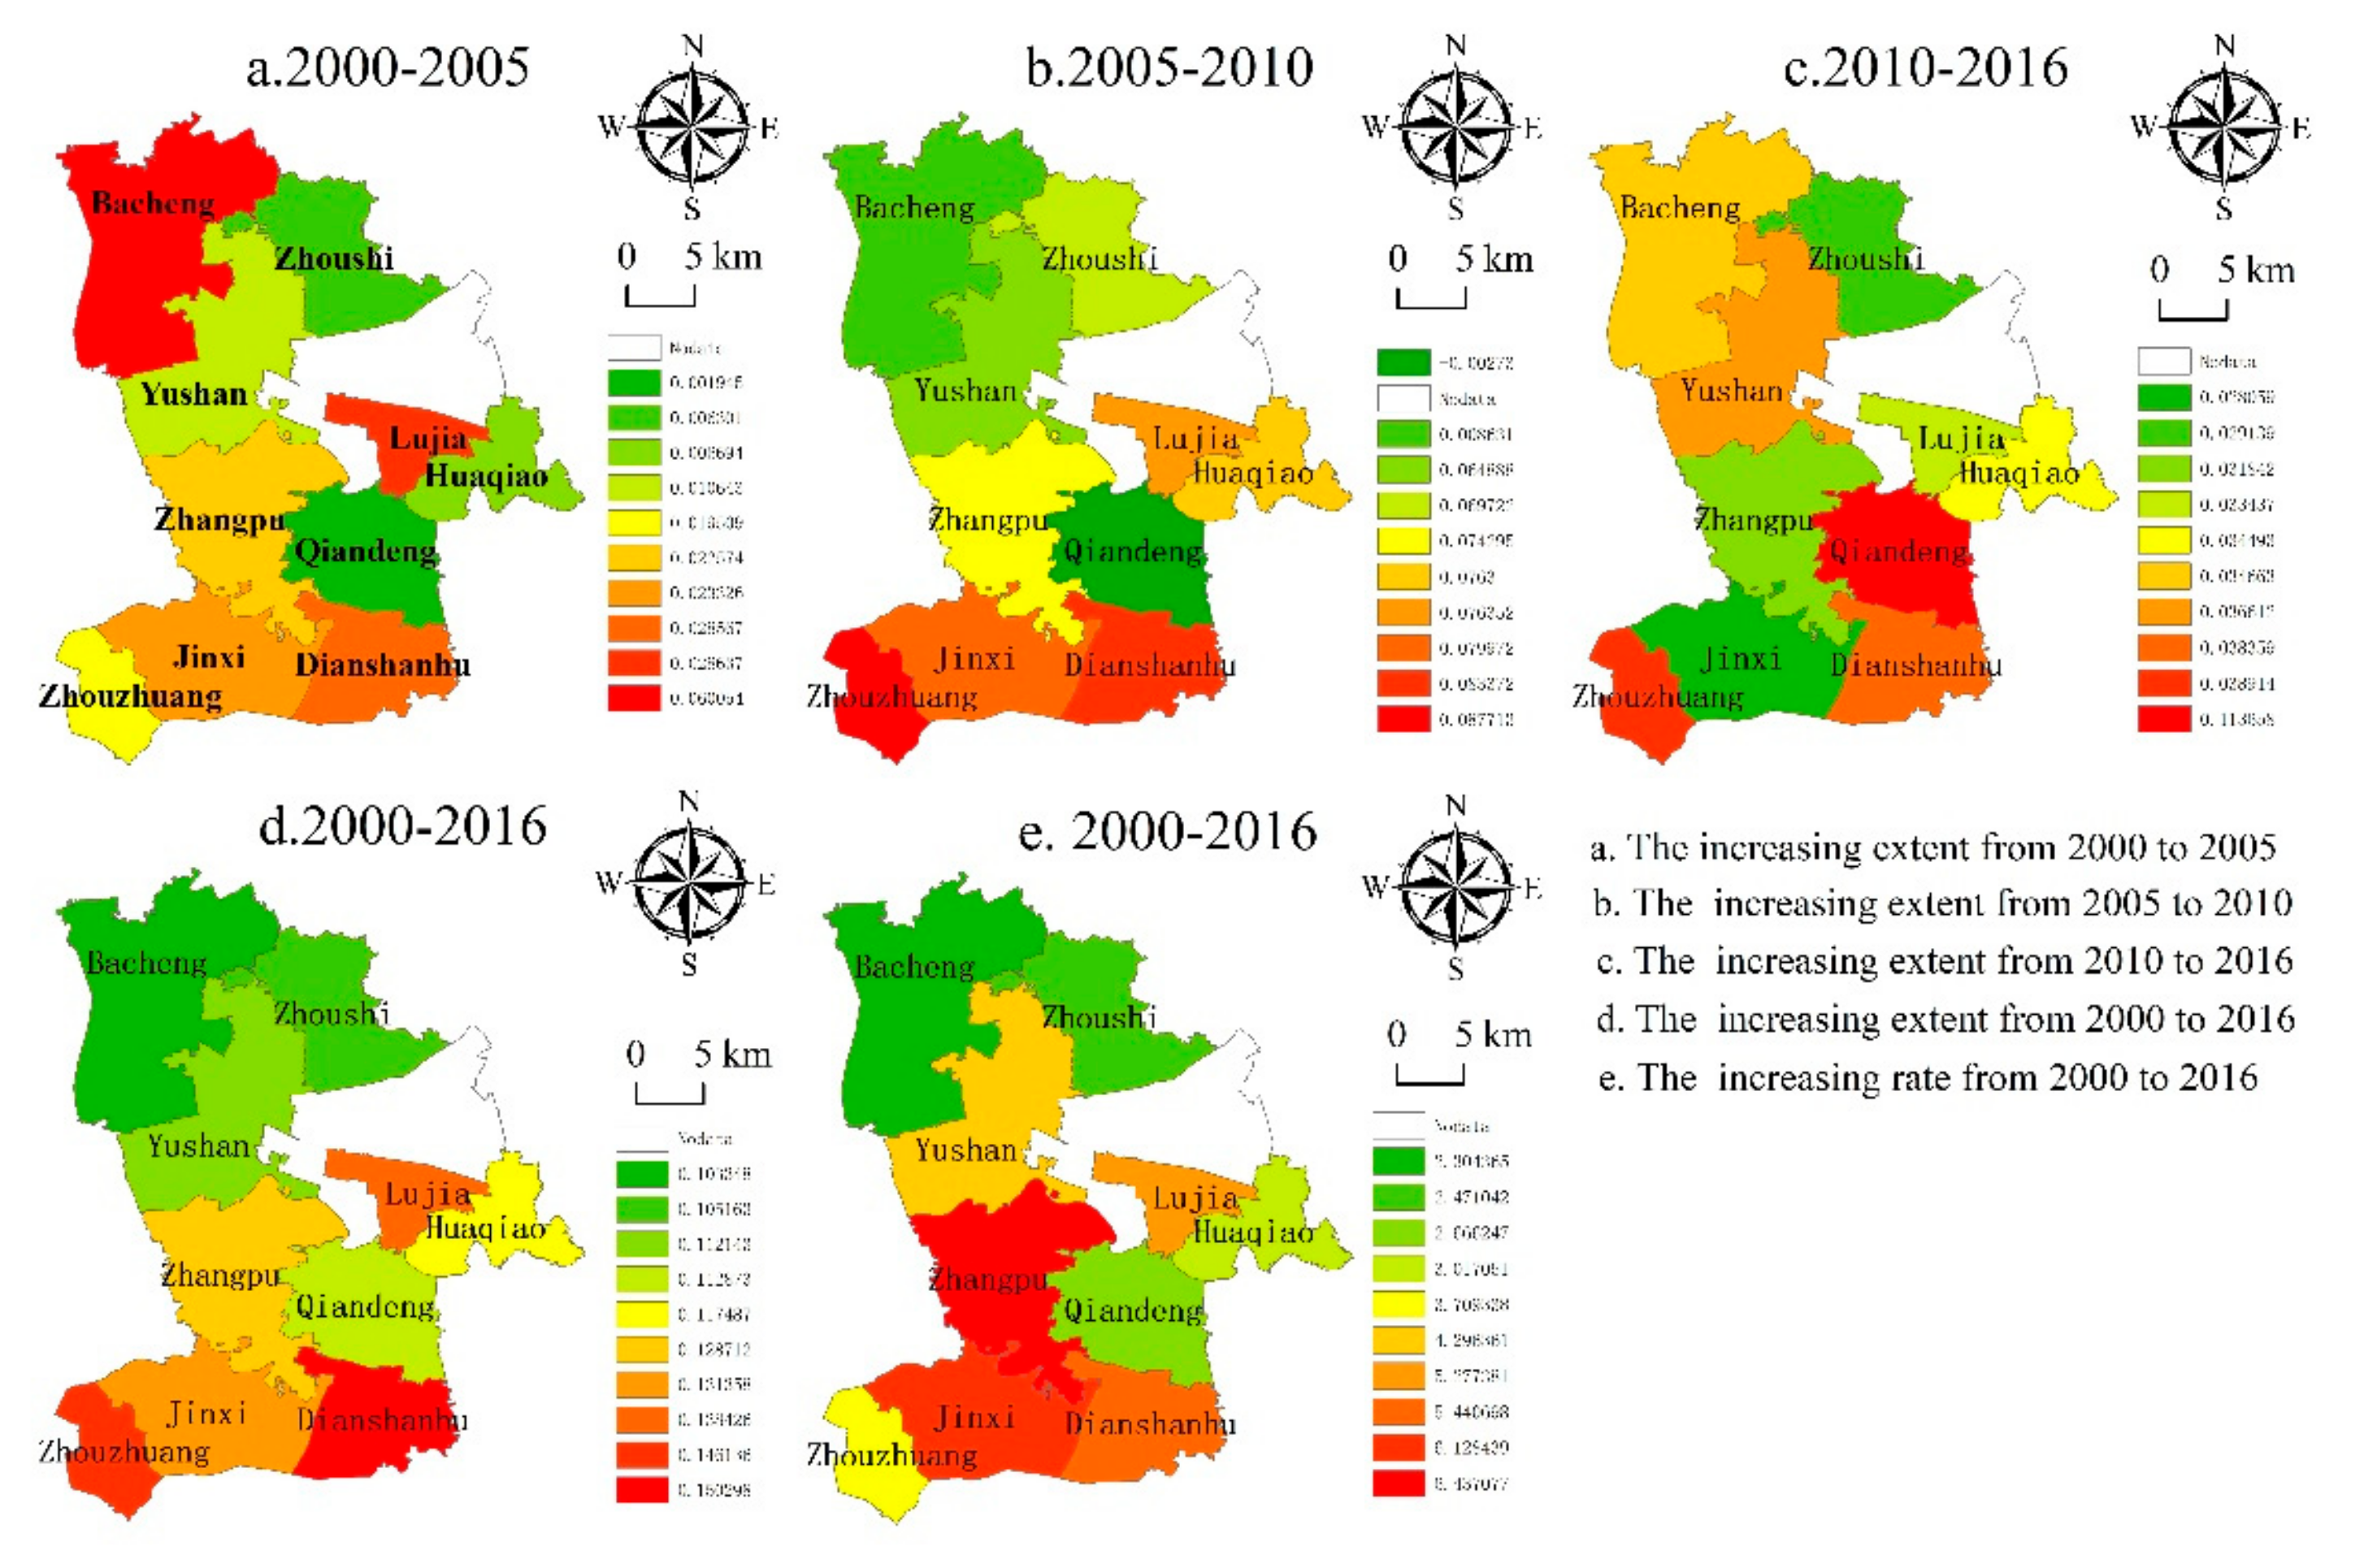
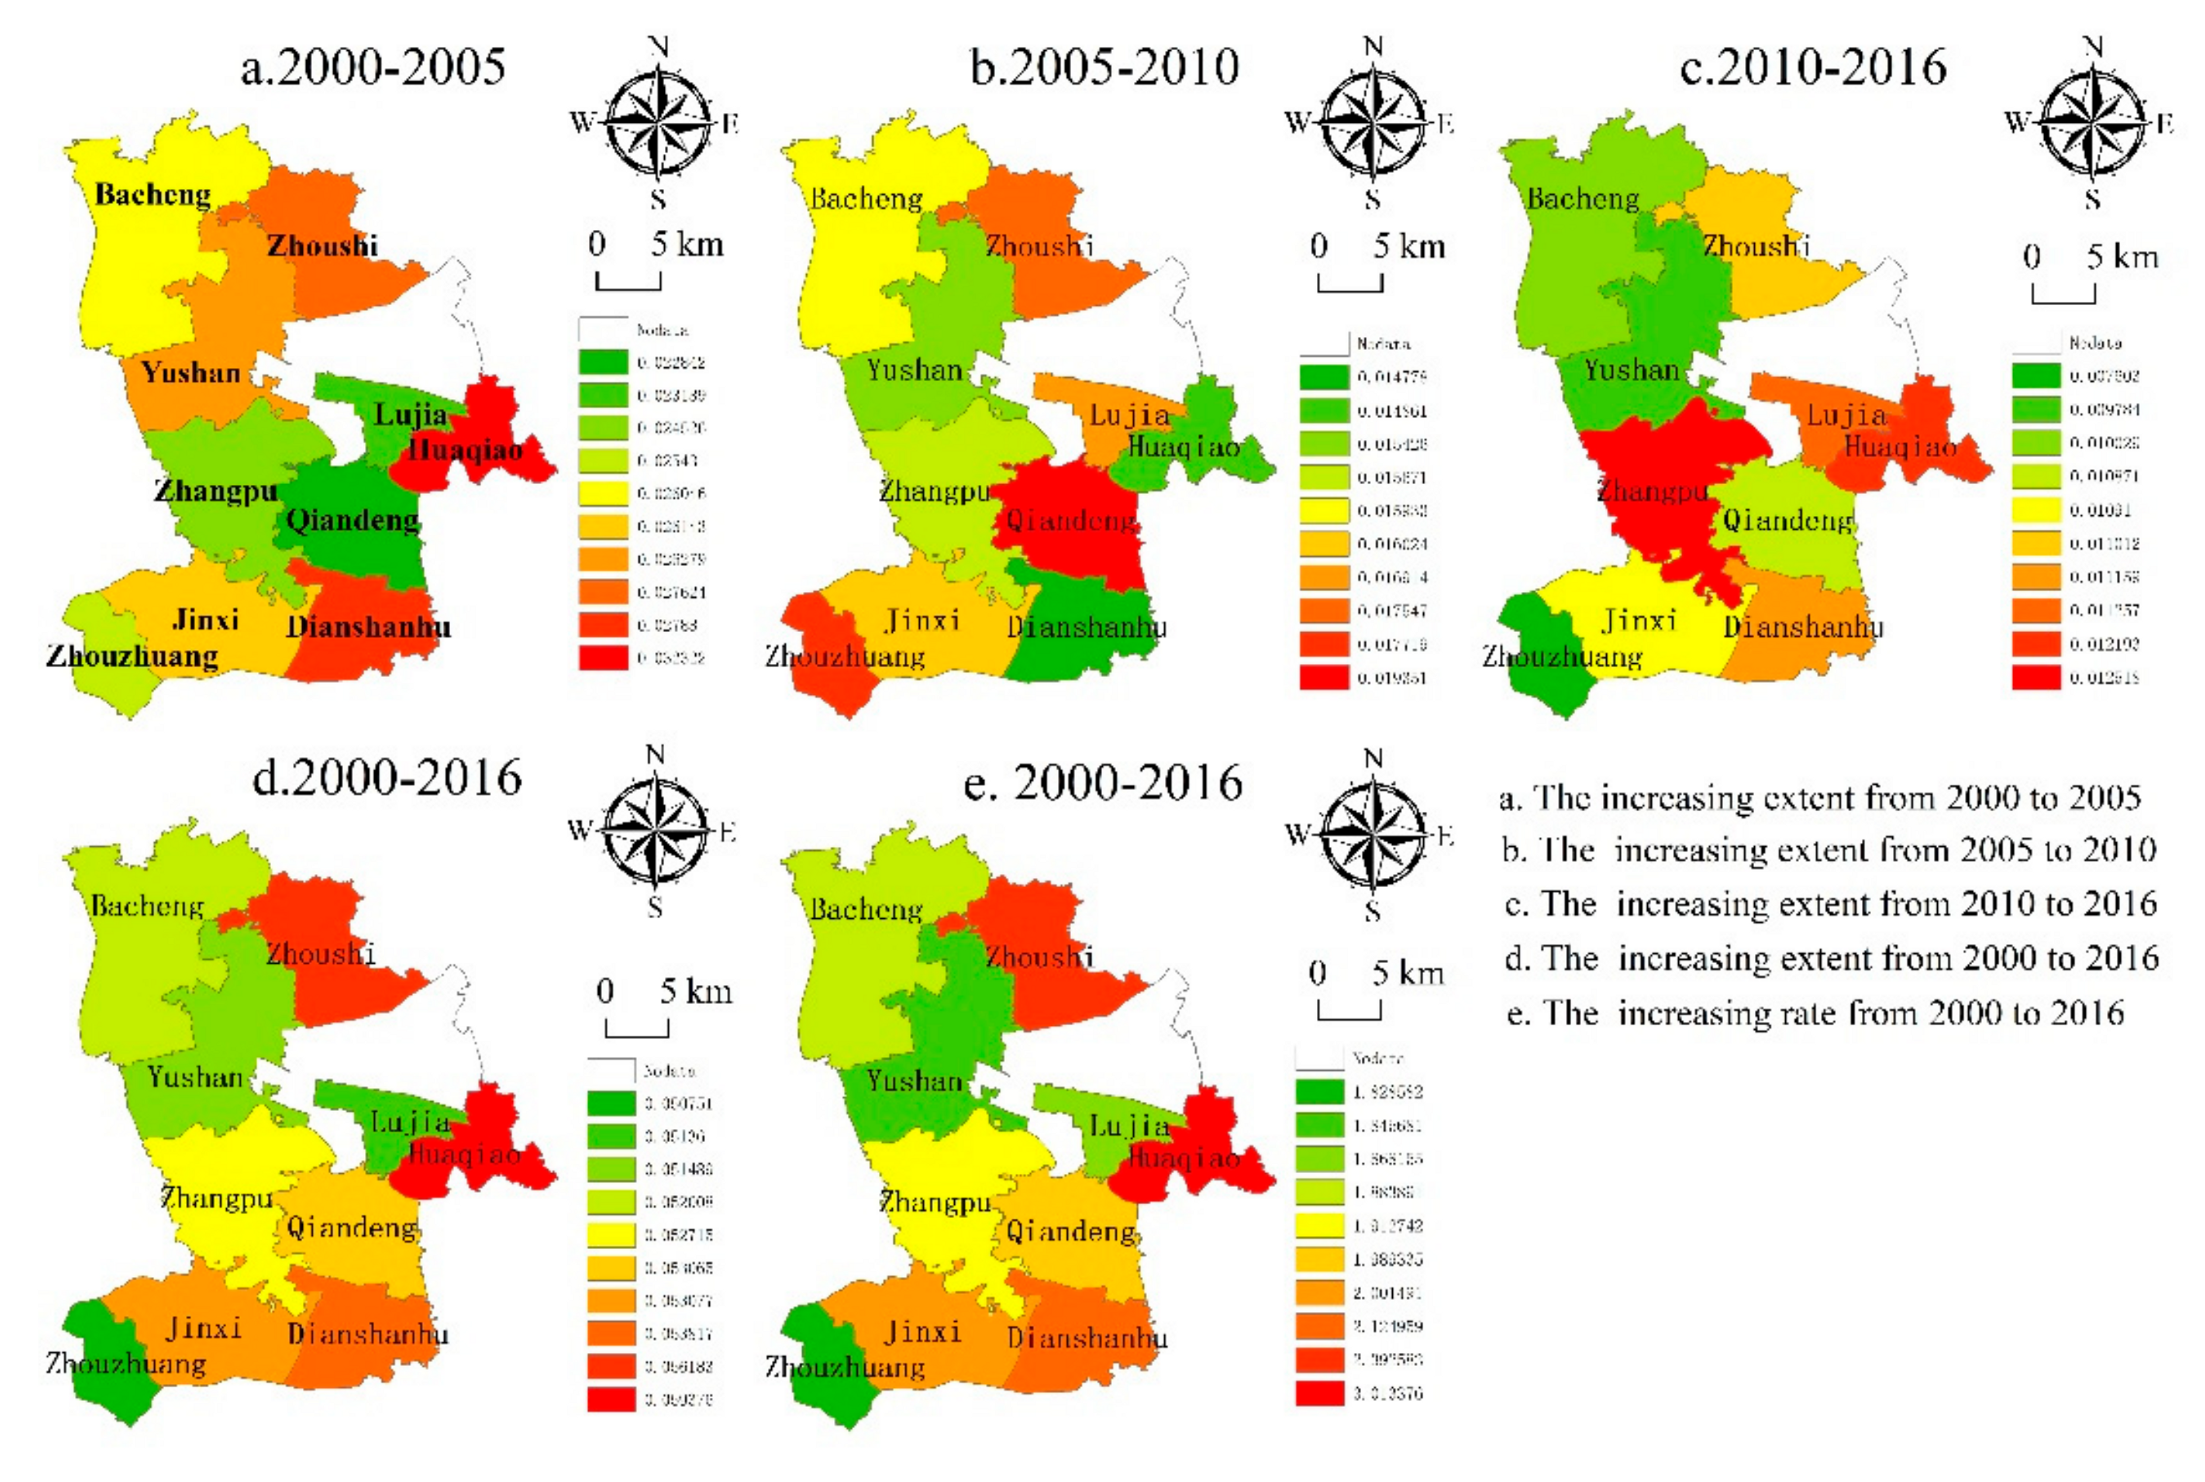
3.3. Sustainable Development Level On Township Scale

Figure 11 shows the results of the sustainable development level of various towns in Kunshan City in each target year. The overall sustainable development level of towns in Kunshan City developed in a positive direction, but the situation varied from one year to another. In the early stage of the study (2000), the sustainable development level of Dianshanhu Town ranked in first place, and the sustainable development level of Jinxi Town was the lowest, at about half that of Dianshanhu Town. In 2005, Yushan Town had the highest sustainable development level, followed by Bacheng Town, with Jinxi Town having the lowest sustainable development level. In 2010, Yushan Town still performed the best, and Lujia Town had the second highest sustainable development level, with Qiandeng Town ranking in last place. In 2016, Yushan Town continued to maintain the highest sustainable development level, followed by Zhoushi Town, with Zhangpu Town having the lowest sustainable development level. Overall, the sustainable development level of Yushan Town remained high over the course of the study period, while the sustainable development level of other towns changed. In addition, the gap between the sustainable development levels of different towns slightly expanded.
Figure 12 shows the development level of the sustainable development subsystems of various towns in Kunshan City in each target year. As shown in Figure 12a, the resource conservation index of Yushan Town was significantly higher than that of other towns in each target year, with that of Qiandeng Town, Zhouzhuang Town, and Zhangpu Town being the lowest in different target years. When it came to the ecological protection index, shown in Figure 12b, the livelihood improvement index, shown in Figure 12d, and the rural development index, shown in Figure 12f, all the towns showed a relatively balanced state in different target years. According to Figure 12c, in the early phase of the study (2000), the economic growth index of Dianshanhu Town was the largest, at roughly four to five times that of other towns; in 2005, 2010, and 2016, the economic growth indices of Zhouzhuang Town and Dianshanhu Town were higher than that of other towns. As shown in Figure 12e, the scientific and technological progress index of Bacheng Town was significantly higher than that of the other towns in 2005, whereas that of Qiandeng Town was obviously lower than that of the other towns in 2010. In addition, there was no apparent difference between the scientific and technological progress indices of the other towns in each target year.
Figure 13d,e show the performance of the sustainable development levels of various towns in Kunshan City from 2000 to 2016. The growth (>0.4) and change rates (>260%) of the sustainable development level of Yushan Town, Zhoushi Town, Lujia Town, and Huaqiao Town were higher than those of other towns in Kunshan City. According to the growth and change rates of the sustainable development subsystem of each town throughout the study period, the growth and change rates of the resource conservation index of towns in the northern part of Kunshan City were higher than those of towns in the southern part (Figure 14). Bacheng Town had the largest ecological protection index, followed by towns in the southern part of Kunshan City, with that of Yushan Town, Zhoushi Town, and Lujia Town being relatively low (Figure 15). In terms of the economic growth index, Zhoushi Town, Lujia Town, and Zhouzhuang Town outweighed the other towns, with that of Dianshanhu Town being comparatively low (Figure 16). In terms of the growth rate of the people’s livelihood improvement index, there was no significant difference between the towns, but the change rate of the livelihood improvement index of Yushan Town, Lujia Town, Qiandeng Town, and Huaqiao Town was significantly higher than that of the other towns in Kunshan City (Figure 17). In terms of the growth rate of the scientific and technological progress index, there was no obvious difference between the towns in Kunshan City, but the change rate of the scientific and technological progress index of Zhangpu Town, Jinxi Town, Dianshanhu Town, and Lujia Town was significantly higher than that of other towns (Figure 18). When it came to the growth rate of the rural development index, there was no significant difference between various towns in Kunshan City, but the change rates of the rural development index were quite different, with Huaqiao Town and Zhoushi Town having a relatively large change rate, whereas Yushan Town and Zhouzhuang Town had a comparatively small change rate (Figure 19).

4. Discussion

4.1. Prefecture Scale

During the research period (2000–2016), Suzhou’s sustainable development system generally developed towards a balanced and stable development level, and its development path can be summarized into four stages: the first stage (~2000), focusing on development economy, while paying attention to ecological protection; the second phase (2000–2005), focusing on improving people’s livelihood, accelerating scientific and technological progress and rural development; the third phase (2005–2010), simultaneously promoting economic growth, scientific and technological progress, rural development, development of the improvement of people’s livelihood; the fourth stage (2010–2016), while continuing to promote economic growth, scientific and technological progress, rural development and other aspects, focus on improving people’s livelihood again. Through four stages of development, Suzhou’s socio-economic level has been greatly improved, the ecological environment has been maintained, and people’s quality of life, sense of gain, and urban satisfaction have increased year by year [43].
Nonetheless, the study indicated that Suzhou City faces some urgent problems in its future development: (1) Despite the strong ecological protection awareness of people in Suzhou City, Suzhou City is facing increasingly larger pressure of ecological environmental protection. The reasons may include that the output value of the secondary industry accounts for a large proportion of the GDP until now, close to 50%, and construction land continues to expand, occupying a large number of cultivated land and ecological space, and so on. Others, including industrial policies, natural environment degradation, disaster risks, and resource constraints [44,45,46], have prevented Suzhou City from fully realizing its ecological protection measures [47]; (2) Although the level of education continues to improve and the average number of years of education continues to increase, Suzhou’s industrial development remains dependent on foreign technology. Especially, German manufacturing enterprises are the core components of Suzhou second industry, their core technologies remain mainly dependent on themselves. Suzhou City is still lagging behind when it comes to the scientific and technological progress. Therefore, the level of technological development needs to be further enhanced to strengthen its role in the economic and social development of Suzhou [48]; (3) With rapid social and economic development, the accelerated accumulation of migrant populations (i.e. the resident population has exceeded eight millions), and the further consumption of regional resources (land development intensity is close to 30%), the shortcomings regarding resource constraints (i.e. the local water resources are insufficient and highly dependent on external water) have become increasingly significant, and the efficiency, level and comprehensive efficiency of resource use need to be further improved [49,50].

4.2. County Scale

The sustainable development level of Zhangjiagang City, Taicang City, and Changshu City were relatively high, the reasons are: these counties have more township enterprises (i.e. labor productivity is improving), the proportion of output value of tertiary industry in GDP is relatively high (>46%), and foreign investment is relatively high (i.e. economic vitality is increasing) [51]. In contrast, the sustainable development level of Gusu District was relatively low, as its development, especially economic and rural development, is limited to a certain extent by the protection of the old city, moreover, land resources are too limited to develop in large quantities, and the pressure of ecological protection is great due to relatively concentrated population) [52]. Limited by resource conditions such as land, insufficient industrial transformation (the proportion of output value of second industry in GDP remains relatively high), and inadequate foreign investment, the sustainable development levels of Huqiu District, Xiangcheng District, and Wuzhong District were comparatively low [53,54]. The sustainable development levels of Wujiang District and Kunshan City were also relatively low, mainly because the utilization efficiency of coal, electricity, fossil energy and other resources is relatively low, the industrial transformation is slow (i.e. the proportion of output value of second industry in GDP remains relatively high), and the rural development is lagging (i.e. rural development should be pay more attention to) [55].
In terms of the sustainable development subsystem, during the study period, the main reason for the high resource conservation index in Zhangjiagang City and Taicang City was the high resource utilization efficiency (for example, the water consumption per 10,000 yuan GDP, electricity consumption, and coal consumption were relatively high Low), and the waste recycling rate is relatively high. Compared with other districts and counties, the ecological protection index of Changshu City was relatively large in the early period (2000, 2005, and 2010), and relatively small in the later period (2016). The reason for its better performance in the early stage is the high greening degree of the built-up area, good air quality, and relatively low fossil energy consumption. In the later period, with the rapid development of social economy, the pressure of ecological protection continued to increase, making the improvement degree of its ecological environment lower than that of other districts (county-level cities). Zhangjiagang City, Taicang City, and Changshu City had a high economic growth index because of abundant foreign direct investment, relatively high tax revenue per unit of GDP, small differences in urban and rural per capita net income, a low Gini coefficient, and a positive growth trend in the GDP from tourism. The livelihood improvement index of Zhangjiagang City, Taicang, City and Changshu City in 2010 and 2016 was larger than that of other districts (county-level cities) because their social welfare level, communication facilities, and drinking water safety are improving more significantly as compared with other districts (county-level cities). Thanks to the ideal output value of high-tech industries and an ideal number of patents applied and authorized, Zhangjiagang City performed better than the other districts (county-level cities) in 2010 and 2016 in terms of the scientific and technological progress index. Compared with the other districts (county-level cities), Kunshan City had a low rural development index is mainly due to the relatively low rural transportation convenience and agricultural output capacity.

4.3. Township Scale

In terms of the sustainable development level, there were no significant differences between towns in Kunshan City during the early period (2000, 2005), whereas such differences expanded in the later period (2010, 2016). Compared with all districts (county-level cities) in Suzhou City, the changes in the ranking of the towns in sustainable development in Kunshan City were more pronounced during the later period (2010, 2016). Furthermore, the changes in the ranking of the towns in sustainable development in Kunshan City were mainly caused by changes in the resource conservation index, the economic growth index, and the scientific and technological progress index.
The growth and change rates of Yushan Town, Huaqiao Town, Zhoushi Town, and Lujia Town were higher than those of other towns. The main reason for such a phenomenon was the more sufficient infrastructure and clustered urban functions that Kunshan City and Yushan Town possess. Similarly, Huaqiao Town is a well-known development zone in the province that is mainly service-oriented, and is close to Shanghai. Over the years, infrastructure investment has been huge, and location advantages and policy advantages have gradually emerged. Zhoushi Town and Lujia Town, located around the urban area, were apparently influenced by the development spillover effects of Yushan Town and Huaqiao Town.
From the perspective of economic growth, Zhouzhuang Town, Zhoushi Town, and Lujia Town performed relatively well; thus, the towns close to the main urban area of Kunshan City and the towns relatively close to Shanghai find it easier to attract investment, with their economy growing relatively fast. Bazhou Town had the largest increase in the ecological protection index, followed by towns in the southern part of Kunshan City (Yushan Town, Zhoushi Town and Lujia Town) where the difference was not obvious. The reason was that the urban water consumption has increased sharply with the agglomeration of the population and industries, and its ecological protection index is relatively large because an important drinking water source (Kuilei Lake) in Kunshan City is located in Bacheng Town.
The towns in the southern part of Kunshan City are typical towns and villages in the south of the Yangtze River with special characteristics. However, the local government attached great importance to the protection of ancient towns in the early planning process; it moderately developed tourism and continued to carry out land space control and ecological environmental protection, so its ecological protection index has not increase significantly [56]. Yushan Town, Zhouzhuang Town, and Lujia Town are located in and around the center of Kunshan City. Due to rapid economic development, resources and environment constraints are tightening, and the ecological protection index is relatively low.

4.4. Policy Implications

At a prefecture scale, similar with other indexes, resources saving index, ecological protection index, and science and technology progress index have improved during the study period; however, they are relatively low. In view of this, some suggestions are put forward as following: 1) Optimize land use structure and save intensive land use. Determine the towns’ boundary of development and construction, raise the access threshold of industrial land, actively promote the renewal of old urban areas, continue to promote the further development of the tertiary industry. 2) Protect ecological space. Protect Tai Lake and its surrounding hilly areas, including nature reserves and forest park areas, and in particular, reduce water pollution and soil pollution along the Yangtze river coast; Besides, 13% of the construction land is in the fragile ecological environment, which poses a great threat to the ecological security of Suzhou [57], this question should attract our attention seriously. 3) Strengthen scientific and technological innovation and technological transformation, build more independent innovative enterprises and get rid of dependence on foreign-funded enterprises. At the county scale, in order to alleviate the resource limitation and ecological pressure, it is necessary to control the population scale of urban areas such as Gusu district; at the same time, in order to speed up the healthy development of the economy, some measures can be taken, such as accelerate the transfer of other industries to the tertiary, actively introduce foreign investment and so on; in addition, improving the efficiency of resource utilization and develop rural areas will be helpful for Wujiang and Kunshan districts. At the township scale, the difference of sustainable development level between different towns mainly come from the differences of location condition, policy, water resource, and the protection of ancient towns. Therefore, targeted improvements could include that promote the balanced development of transportation, strengthen the cooperation of production factors in different towns to take full advantage of the policy for each town; besides, similar with the situation at prefecture scale and county scale, it is necessary to improve the efficiency of resource utilization and save water resources at township scale.

5. Conclusions

The target oriented index system at a local scale, which is consistent with the SDGs framework, is more suitable for regional development. The SDGs framework can lay the foundation for the construction of our index system, facilitating the discovery of the shortcomings and advantages of regional development. Furthermore, the index system derived from the SDGs framework could be helpful for linking up the development issues of different scales.
Based on detailed analysis of natural, social, and economic statistics of Suzhou at four time points (2000, 2005, 2010, 2016) and three spatial scales (prefecture-level cities, districts (county-level cities), and townships), we come to the following conclusions: (1) Sustainable development is an organic system. It is important to pay close attention to the development process and differences of all subsystems in the system to avoid the impact of imbalance in the system caused by the one-sided and rapid development of a subsystem; the sustainable development system presents different development problems on different spatial scales, and the lower spatial scale is the basis of the upper spatial scale, so it is necessary to pay attention to the organic connection between different scales. (2) During the study period, Suzhou City generally developed in a positive direction, showing a stable and sustained growth trend. On the prefecture scale, although the six sustainable development subsystems exhibited a rising trend and moved a balance, the sustainable development level of the resource conservation subsystem continued to be low, the ecological protection subsystem faced great pressure, and the scientific and technological subsystem remains to be improved. On the county scale, the sustainable development level of different county-level cities may vary due to changes in economic base, industrial policy, old city protections, land resources, energy resources, and foreign investment. On the township level, since the differences between towns in terms of resources, development basis, location conditions, and policy advantages are more significant than the differences between the county-level cities, the intensity of the changes in the ranking of the towns in sustainable development in Kunshan City was higher than that of the changes in ranking of the county-level cities in Suzhou City. Furthermore, the changes in the ranking were mainly reflected in three subsystems: the resource conservation subsystem, economic growth subsystem, and scientific and technological progress subsystem.
The city’s sustainable development evaluation index system with the main components of "resource conservation, economic growth, ecological protection, improvement of people’s livelihood, technological progress, and rural development" is applicable to the Suzhou city, which basically reflects Suzhou’s regional development laws, differences in the spatial and temporal scales of the system’s internal subsystems, and key issues at different spatial scales. Although some of the data involved in the study were obtained through interviews and subjective judgments, there is a certain deviation from the actual situation, but it can basically reflect the situation in the region. In the future, the scope of research can be further narrowed, and more specific issues (such as land use issues, water resources issues, urban-rural differences, etc.) will be explored in depth from a micro-scale. In addition, it can also take advantage of remote sensing data in terms of spatial coverage and data objectivity to promote more sustainable and regional development with more refined and scientific spatial arrangements.

Author Contributions

All authors have read and agree to the published version of the manuscript. W.L., C.H., Y.Z. conceived and designed the manuscript. Conceptualization and methodology, W.L. and C.H.; formal analysis, W.L. and Y.Z.; investigation and data curation, W.L; original draft preparation, W.L. and C.H.; visualization and funding acquisition, C.H. and Y.Z. All authors analyzed the results, contributed to the writing of paper.

Funding

This research was funded by Nanjing University Innovation and Creative Program for PhD candidate, grant number CXCY19-55; and the National Natural Science Foundation of China, grant number 41971235.

Acknowledgments

Thanks to Jiang Zhou and Gu Zhengming for their help in data collection and processing.

Conflicts of Interest

The authors declare no conflict of interest.

References

  1. Dawson, I.G.J. Assessing the Effects of Information about Global Population Growth on Risk Perceptions and Support for Mitigation and Prevention Strategies. Risk Anal. 2018, 38, 2222–2241. [Google Scholar] [CrossRef]
  2. Mousivand, A.; Arsanjani, J.J. Insights on the historical and emerging global land cover changes: The case of ESA-CCI-LC datasets. Appl. Geogr. 2019, 106, 82–92. [Google Scholar] [CrossRef]
  3. John, P.; Holdren, P.R.E. Human population and the global environment: Population growth, rising per capita material consumption and disruptive technologies have made civilization a global ecological force. Am. Sci. 1974, 62, 282–292. [Google Scholar]
  4. Rind, D. Complexity and Climate. Science 1999, 284, 105–107. [Google Scholar] [CrossRef] [PubMed] [Green Version]
  5. Arrow, K.; Bolin, B.; Costanza, R.; Dasgupta, P.; Folke, C.; Holling, C.S.; Jansson, B.O.; Levin, S.; Mäler, K.G.; Perrings, C.; et al. Economic growth, carrying capacity, and the environment. Ecol. Econ. 1995, 15, 91–95. [Google Scholar] [CrossRef]
  6. Liu, Y.; Huang, X.; Yang, H.; Zhong, T. Environmental effects of land-use/cover change caused by urbanization and policies in Southwest China Karst area – A case study of Guiyang. Habitat Int. 2014, 44, 339–348. [Google Scholar] [CrossRef]
  7. Krank, S.; Wallbaum, H.; Grêt-Regamey, A. Perceived contribution of indicator systems to sustainable development in developing countries. Sustain. Dev. 2013, 21, 18–29. [Google Scholar] [CrossRef]
  8. Caiado, R.G.G.; Filho, W.L.; Quelhas, O.L.G.; Nascimento, D.L.D.M.; Ávila, L.V. A literature-based review on potentials and constraints in the implementation of the sustainable development goals. J. Clean. Prod. 2018, 198, 1276–1288. [Google Scholar] [CrossRef]
  9. Ward, M.; Possingham, H.; Rhodes, J.R.; Mumby, P. Food, money and lobsters: Valuing ecosystem services to align environmental management with Sustainable Development Goals. Ecosyst. Serv. 2018, 29, 56–69. [Google Scholar] [CrossRef] [Green Version]
  10. Hansen, J.; Jones, J. A systems framework for characterizing farm sustainability. Agric. Syst. 1996, 51, 185–201. [Google Scholar] [CrossRef]
  11. Kates, R.; Clark, W.C.; Al, E.; Hall, J.M.; Jaeger, C.; Lowe, I.; McCarthy, J.; Schellnhuber, H.J.; Bolin, B.; Dickson, N.M.; et al. Sustainability Science. SSRN Electron. J. 2001, 292, 641–642. [Google Scholar]
  12. Xiao, W.; Mills, J.; Guidi, G.; Rodriguez-Gonzalvez, P.; Barsanti, S.G.; González-Aguilera, D. Geoinformatics for the conservation and promotion of cultural heritage in support of the UN Sustainable Development Goals. ISPRS J. Photogramm. Remote. Sens. 2018, 142, 389–406. [Google Scholar] [CrossRef]
  13. Isan, M. Sustainable Development: Principles, Analysis and Policies; Parthenon Publication Group: New York, NY, USA, 1996. [Google Scholar]
  14. Susan, B.H. Environmental Planning and Sustainability; John Wiley & Sons: Hoboken, NJ, USA, 1996. [Google Scholar]
  15. Campbell, A.; Lurches, K.S. Core Competency-Based Strategy; International Thomson Business Press: New York, NY, USA, 1997. [Google Scholar]
  16. Brown, W.B. Building a Sustainable Society; Education Resources Information Center (ERIC): New York, NY, USA, 1981. [Google Scholar]
  17. Springmann, M.; Clark, M.; Mason-D’Croz, D.; Wiebe, K.; Bodirsky, B.L.; Lassaletta, L.; De Vries, W.; Vermeulen, S.J.; Herrero, M.; Carlson, K.M.; et al. Options for keeping the food system within environmental limits. Nature 2018, 562, 519–525. [Google Scholar] [CrossRef] [PubMed]
  18. Newbold, T.; Hudson, L.N.; Hill, S.L.L.; Contu, S.; Lysenko, I.; Senior, R.A.; Borger, L.; Bennett, D.J.; Choimes, A.; Collen, B.; et al. Global effects of land use on local terrestrial biodiversity. Nature 2015, 520, 45–50. [Google Scholar] [CrossRef] [PubMed] [Green Version]
  19. Tilman, D.; Clark, M. Global diets link environmental sustainability and human health. Nature 2014, 515, 518–522. [Google Scholar] [CrossRef]
  20. Blumenberg, C.; Martins, R.C.; Costa, J.C.; Ricardo, L.I.C. Is Brazil going to achieve the road traffic deaths target? An analysis about the sustainable development goals. Inj. Prev. 2017, 24, 250–255. [Google Scholar] [CrossRef]
  21. Liu, J.; Hull, V.; Godfray, H.C.J.; Tilman, D.; Gleick, P.; Hoff, H.; Pahl-Wostl, C.; Xu, Z.; Chung, M.G.; Sun, J.; et al. Nexus approaches to global sustainable development. Nat. Sustain. 2018, 1, 466–476. [Google Scholar] [CrossRef]
  22. Bryan, B.A.; Gao, L.; Ye, Y.; Sun, X.; Connor, J.D.; Crossman, N.D.; Stafford-Smith, M.; Wu, J.; He, C.; Yu, D.; et al. China’s response to a national land-system sustainability emergency. Nature 2018, 559, 193–204. [Google Scholar] [CrossRef]
  23. Gao, L.; Bryan, B.A. Finding pathways to national-scale land-sector sustainability. Nature 2017, 544, 217–222. [Google Scholar] [CrossRef]
  24. Mann, C.; Garcia-Martin, M.; Raymond, C.M.; Shaw, B.J.; Plieninger, T. The potential for integrated landscape management to fulfil Europe’s commitments to the Sustainable Development Goals. Landsc. Urban Plan. 2018, 177, 75–82. [Google Scholar] [CrossRef]
  25. Giupponi, C.; Gain, A.K. Integrated spatial assessment of the water, energy and food dimensions of the sustainable development goals. Reg. Environ. Change 2017, 17, 1881–1893. [Google Scholar] [CrossRef]
  26. Renard, D.; Rhemtulla, J.M.; Bennett, E.M. Historical dynamics in ecosystem service bundles. Proc. Natl. Acad. Sci. USA 2015, 112, 13411–13416. [Google Scholar] [CrossRef] [Green Version]
  27. Maes, J.; Paracchini, M.; Zulian, G.; Dunbar, M.; Alkemade, R. Synergies and trade-offs between ecosystem service supply, biodiversity, and habitat conservation status in Europe. Boil. Conserv. 2012, 155, 1–12. [Google Scholar] [CrossRef]
  28. Khosla, A. Science and technology for sustainable development. Curr. Sci. 1999, 76, 1080–1086. [Google Scholar]
  29. Hart, M. Guide to Sustainable Community Indicators, 2nd ed.; Hart Environmental Data: North Andover, MA, USA, 1999. [Google Scholar]
  30. Chen, J.; Wang, Y.; Li, F.; Liu, Z. Aquatic ecosystem health assessment of a typical sub-basin of the Liao River based on entropy weights and a fuzzy comprehensive evaluation method. Sci. Rep. 2019, 9, 14045. [Google Scholar] [CrossRef] [Green Version]
  31. Yang, B.; Xu, T.; Shi, L.Y. Analysis on sustainable urban development levels and trends in China’s cities. J. Clean. Prod. 2017, 141, 868–880. [Google Scholar] [CrossRef]
  32. Cao, Z.L. The construction and evaluation of regional agricultural sustainable development index system- a case study of Hengyang city. Econ. Geogr. 2012, 32, 113–116. [Google Scholar]
  33. Schmidt-Traub, G.; Kroll, C.; Teksoz, K.; Durand-Delacre, D.; Sachs, J.D. National baselines for the Sustainable Development Goals assessed in the SDG Index and Dashboards. Nat. Geosci. 2017, 10, 547–555. [Google Scholar] [CrossRef]
  34. Sidorchuk, I.; Akhrymenka, A.; Shmakova, O.; Grigoriev, A.; Parfenchyk, A.; Kulai, O. Implementing sustainable development on the regional level in belarus. Eur. J. Sustain. Dev. 2017, 6, 435–443. [Google Scholar] [CrossRef]
  35. Su, Y.; An, X.L. Application of threshold regression analysis to study the impact of regional technological innovation level on sustainable development. Renew. Sustain. Energ. Rev. 2018, 89, 27–32. [Google Scholar]
  36. Sepehri, M.; Malekinezhad, H.; Hosseini, S.Z.; Ildoromi, A.R. Assessment of flood hazard mapping in urban areas using entropy weighting method: a case study in Hamadan city, Iran. Acta Geophys. 2019, 67, 1435–1449. [Google Scholar] [CrossRef]
  37. Singh, V. The use of entropy in hydrology and water resources. Hydrol. Process. 1997, 11, 587–626. [Google Scholar] [CrossRef]
  38. Liu, L.; Zhou, J.; An, X.; Zhang, Y.; Yang, L. Using fuzzy theory and information entropy for water quality assessment in Three Gorges region, China. Expert Syst. Appl. 2010, 37, 2517–2521. [Google Scholar] [CrossRef]
  39. Xu, H.; Ma, C.; Lian, J.; Xu, K.; Chaima, E. Urban flooding risk assessment based on an integrated k-means cluster algorithm and improved entropy weight method in the region of Haikou, China. J. Hydrol. 2018, 563, 975–986. [Google Scholar] [CrossRef]
  40. Chen, X.; Liu, X.; Hu, D. Assessment of sustainable development: A case study of Wuhan as a pilot city in China. Ecol. Indic. 2015, 50, 206–214. [Google Scholar] [CrossRef]
  41. Xue, X.H.; Yang, X.G. Seismic liquefaction potential assessed by fuzzy comprehensive evaluation method. Nat. Hazards 2014, 71, 2101–2112. [Google Scholar] [CrossRef]
  42. Zhang, W.; Lu, J.; Zhang, Y. Comprehensive Evaluation Index System of Low Carbon Road Transport Based on Fuzzy Evaluation Method. Procedia Eng. 2016, 137, 659–668. [Google Scholar] [CrossRef] [Green Version]
  43. Xiaoyu, L.; Jian, G.; Fei, C.; Hokao, K. Residential Environment Evaluation Model and Residential Preferences of the Changjiang Delta Region of China. J. Asian Arch. Build. Eng. 2007, 6, 299–306. [Google Scholar] [CrossRef] [Green Version]
  44. Chen, W.; Sun, W.; Duan, X.J.; Chen, J.L. Regionalization of regional potential development in Suzhou city. Acta Geogr. Sin. 2006, 61, 839–846. [Google Scholar]
  45. Liang, S.; Zhang, T. Urban Metabolism in China Achieving Dematerialization and Decarbonization in Suzhou. J. Ind. Ecol. 2011, 15, 420–434. [Google Scholar] [CrossRef]
  46. Bao, Z.; Lu, W.; Chi, B.; Yuan, H.; Hao, J. Procurement innovation for a circular economy of construction and demolition waste: Lessons learnt from Suzhou, China. Waste Manag. 2019, 99, 12–21. [Google Scholar] [CrossRef] [PubMed]
  47. Chen, C.; Pei, S.; Jiao, J. Land subsidence caused by groundwater exploitation in Suzhou City, China. Hydrogeol. J. 2003, 11, 275–287. [Google Scholar] [CrossRef]
  48. Chou, T.-L.; Chang, J.-Y.; Li, T.-C. Government Support, FDI Clustering and Semiconductor Sustainability in China: Case Studies of Shanghai, Suzhou and Wuxi in the Yangtze Delta. Sustainability 2014, 6, 5655–5681. [Google Scholar] [CrossRef] [Green Version]
  49. Mo, H.P.; Wen, Z.G.; Chen, J.N. China’s recyclable resources recycling system and policy: a case study in Suzhou. Resour. Conserv. Recycl. 2009, 53, 409–419. [Google Scholar] [CrossRef]
  50. Zhu, W.J.; Sun, H. Dynamic Measurement and Obstacle Tracking Analysis of Land Use Efficiency in Suzhou from 2000 to 2015. Chin. J. Soil Sci. 2019, 50, 290–297. [Google Scholar]
  51. Dennis Wei, Y.H.; Lu, Y.Q.; Chen, W. Globalizing regional development in Sunan, China: Does Suzhou industrial park fit a Neo-Marshallian District model? Reg. Stud. 2009, 43, 409–427. [Google Scholar] [CrossRef]
  52. Wang, C.L. Research on planning strategies of the mixed land use of the ancient city of Suzhou based on protection. J. Suzhou Univ. Sci. Technol. (Eng. Technol.) 2015, 28, 58–64. [Google Scholar]
  53. Wang, Y.; Wu, G.P.; He, L.Y. Analysis and simulation for landscape pattern changes of land use in Wuzhong district, Suzhou city. J. Landsc. Res. 2010, 2, 39–42. [Google Scholar]
  54. Qiao, W.F.; Sun, Z.H.; Shao, F.R.; Ni, T.; Feng, S.S.; Zhang, G. Analysis on evolution and driving factors of land use structure in highly urbanized area. Res. Environ. Yangtze Basin 2012, 21, 557–564. [Google Scholar]
  55. Gu, H.F. Finance supporting strategy of industry structure optimization from region perspective—based on Suzhou city. Econ. Geogr. 2010, 30, 790–794. [Google Scholar]
  56. Wang, Y.C.; Miller, P.; Katen, B. The traditionality evaluation of culture landscape space and its holistic conservation pattern: a case study of Qiandeng-Zhangpu Region in Jiangsu Province. Acta. Geogr. Sinica. 2011, 66, 525–534. [Google Scholar]
  57. Xu, H.L.; Gao, W.L.; Chen, S.; Chen, D.C. Identification of urban ecological space in South Jiangsu based on GIS: a case study of Suzhou. Chin. J. Ecol. 2019, in press. [Google Scholar] [CrossRef]
Figure 1. Location of the study area.
Sustainability 12 00976 g001
Figure 2. Evaluation on the comprehensive level of sustainable development and its subsystem in Suzhou city (SD, Sustainable development level; SD1, Resource saving index; SD2, Ecological protection index; SD3, Economic growth index; SD4, livelihood improvement index; SD5, Science and technology progress index; SD6, Rural development index).
Sustainability 12 00976 g002
Figure 3. The sustainable development and its sub-system development level of each district (city) of Suzhou in different years.
Sustainability 12 00976 g003aSustainability 12 00976 g003b
Figure 4. Differences in sustainable development levels in different districts in Suzhou.
Sustainability 12 00976 g004
Figure 5. Differences in resource conservation indices between different districts in Suzhou at different times.
Sustainability 12 00976 g005
Figure 6. Differences in ecological protection indices between different districts (cities) in Suzhou at different times.
Sustainability 12 00976 g006
Figure 7. Differences in economic growth index of various districts (cities) in Suzhou at different times.
Sustainability 12 00976 g007
Figure 8. Differences in the improvement index of people’s livelihood in different districts (cities) in Suzhou.
Sustainability 12 00976 g008
Figure 9. Differences in scientific and technological progress index between different districts (cities) in Suzhou at different times.
Sustainability 12 00976 g009
Figure 10. Differences in rural development index of different districts (cities) in Suzhou at different times.
Sustainability 12 00976 g010
Figure 11. Comprehensive evaluation results of sustainable development level of each town in Kunshan.
Sustainability 12 00976 g011
Figure 12. Development level of sustainable development subsystems in various towns of Kunshan in different years.
Sustainability 12 00976 g012
Figure 13. Differences in sustainable development levels in different towns in Kunshan.
Sustainability 12 00976 g013
Figure 14. Differences in resource conservation indices between different towns in Kunshan at different times.
Sustainability 12 00976 g014
Figure 15. Differences in ecological protection indices between different towns in Kunshan City at different times.
Sustainability 12 00976 g015
Figure 16. Differences in economic growth indices of different towns in Kunshan at different times.
Sustainability 12 00976 g016
Figure 17. Differences in the improvement index of people’s livelihood in different towns in Kunshan.
Sustainability 12 00976 g017
Figure 18. Differences in scientific and technological progress indices between different towns in Kunshan at different times.
Sustainability 12 00976 g018
Figure 19. Differences in rural development index of different towns in Kunshan at different times.
Sustainability 12 00976 g019
Table 1. Comprehensive index system of sustainable development level in Suzhou.
SubsystemIndex
Resource conservation indexWater consumption per 10,000 yuan of GDP, electricity consumption per 10,000 yuan of GDP, standard coal consumption per 10,000 yuan of GDP, GDP per acre, waste recycling rate, and ratio of construction land growth rate to urban population growth rate
Ecological protection indexWastewater standard compliance rate, water function compliance rate, water surface rate, ratio of ecological protection and environmental treatment industry to GDP in fixed assets investment, greening rate of urban built-up area, proportion of hazardous waste treatment, proportion of non-fossil energy consumption to primary energy consumption, the proportion of days when PM2.5 reached the standard in towns, and the annual decline rate of greenhouse gas emissions
Economic growth indexPer capita amount of investment in fixed assets, amount of foreign direct investment, proportion of tertiary industry output in GDP, proportion of industrial output in GDP, annual GDP growth rate, ratio of tax revenue to GDP, ratio of urban per capita net income to rural per capita net income, Gini coefficient, urbanization rate, and growth rate of the ratio of tourism GDP to the total GDP
People’s livelihood improvement indexEngel coefficient, the number of health technicians per 1000 permanent residents, the number of institutional beds for every 1,000 elderly people, the number of judicial employees per 10,000 permanent residents, expected life expectancy, tobacco prevalence rate for people over 15 years of age, unemployment rate, average years of education received by the newly added labor force, the proportion of mobile phone users to the total number of households, the per capita housing area of urban residents, the proportion of added value of cultural industries to GDP, and the proportion of population with access to safe drinking water
Scientific and technological progress indexHigher education enrollment rate, the proportion of industrial R&D expenditure to GDP, the proportion of high-tech industry output in industrial output value above a designated size, the proportion of Internet users to total households, and the amount of patent applications per 100,000 people
Rural development indexProportion of basic farmland protection area to agricultural land area, effective utilization coefficient of farmland irrigation water, electricity consumption per capita in rural areas, total power of agricultural machinery/the total planting area of grain, proportion of agricultural and forestry water affairs in fiscal revenue and expenditure of the general public budget expenditure, proportion of rural population living within two kilometers of the road, per-capita net income of rural residents, and grain output/the total sown area of grain
Table 2. Increase in the level of sustainable development and its subsystems in Suzhou in different periods.
Content2000–20052005–20102010–2016
Sustainable development level0.190.190.25
Resource conservation index0.020.020.03
Ecological protection index0.010.010.01
Economic growth index0.000.040.03
Livelihood improvement index0.070.040.10
Scientific and technological progress index0.030.040.03
Rural development index0.060.050.04

