Article

Fostering Circular Economy Through the Analysis of Existing Open Access Industrial Symbiosis Databases

by
Daniel Jato-Espino
* and
Carmen Ruiz-Puente
INGEPRO Research Group, Department of Transport and Projects and Processes Technology, University of Cantabria, 39005 Santander, Spain
*
Author to whom correspondence should be addressed.
Sustainability 2020, 12(3), 952; https://doi.org/10.3390/su12030952
Submission received: 3 January 2020 / Revised: 22 January 2020 / Accepted: 23 January 2020 / Published: 28 January 2020
(This article belongs to the Collection Industrial Symbiosis and Sustainability)

Abstract

:
Digital evolution underwent great progress in the late 20th century, democratizing the use of the Internet and, therefore, access to public sources of information. This technological shift caused great impacts on different fields, including Industrial Symbiosis (IS). IS stems from the concept of Circular Economy and requires well-structured information to encourage waste reuse. Under these premises, this investigation aimed at processing and analyzing existing open-access IS databases from several perspectives, including types of business areas, waste and new uses involved. In addition, existing IS data were explored with the support of different tools, such as correspondence, network and correlation analyses. The application of this methodology to a set of 496 shortlisted IS exchanges led to several findings, highlighting the strong relationship between metallurgy and the production of cement, the key role played by the electricity production sector both as a donor and a recipient, the versatility of the agriculture area due to their capacity for reusing a variety of waste as fertilizers and the importance of chemical products and steam and hot water as new uses. Overall, these results provide companies with efficient and understandable knowledge to donate or receive materials.

1. Introduction

Industrial activities result in the transformation of raw materials into products, which leads to the generation of waste or by-products that are potentially harmful to the environment [1]. The reuse of this waste cannot only avoid their conversion into contaminants, but also reduce the need for industrial companies to consume virgin raw materials [2]. This idea is one of the main premises of Circular Economy, a resource utilization system that seeks to minimize the accumulation of waste and fosters its reincorporation into the production cycle as a substitute for raw materials [3]. This reduces the magnitude of environmental impacts and production and sales costs, which results in benefits for companies, users and the environment [4].
Industrial Symbiosis (IS) is a branch of industrial ecology that emerged to facilitate achieving these benefits by favoring exchanges between pairs of companies [5], such that the waste (materials, energy or water) produced by one become the raw materials used by another [6]. Hence, this approach focuses on achieving a closed loop for materials, which is a key aspect in Circular Economy [7]. Although companies are aware of the benefits associated with IS, they either struggle to find out how and with whom to carry out potential exchanges or consider that they lack time and resources to make it effective [8]. Despite the transient nature of Circular Economy, the durability and continuity of IS projects must be guaranteed through cooperation and confidence [9].
Another of the main obstacles hindering the achievement of IS lies in the mistrust of companies in sharing information [10]. This circumstance is being overcome through the unstoppable growth of the Internet, which is continuously boosting access to information in a quick and easy manner. Not in vain, there is a rising trend in the availability of open-access repositories over the years [11]. However, this increase in information entails a rise in its disorganization, which limits the finding of what is sought by users. In other words, information needs to be structured to become useful, in order to facilitate the understanding of the concepts in which users are interested. In this vein, since the creation of the concept in the 1990s [12], there is a variety of recent initiatives devoted to produce different tools and databases to facilitate IS between companies.
For instance, Trokanas et al. (2014) [13] developed a semantic input/output algorithm to facilitate the creation of IS networks. They considered different aspects such as synergy similarity, CO2 saving, landfill diversion and virgin materials saved to support the decision-making. In a similar vein, Lignos et al. (2016) [14] conceived a hybrid approach based on a series of structural and economic metrics for the evaluation of IS. It is presented as tool to be used by a variety of stakeholders that enables comparing symbiotic bioenergy networks and producing data to conduct SWOT (Strengths, Weaknesses, Opportunities and Threats) analyses. Zheng and Jia (2017) [15] designed an agent-based model to carry out simulations about the knowledge and attitudes in IS processes. Their results indicated that the coordination of both knowledge and relationships impacted positively on the identification of IS opportunities. Yazdanpanah et al. (2019) [16] developed a Formal Industrial Symbiosis Opportunity Filtering method (FISOF) aimed at helping industrial firm evaluate IS opportunities. It consists of a decision support algorithm that first ranks potential exchanges and then facilitates contract negotiations with the shortlisted candidates. Shi and Li (2019) [17] developed a life cycle management approach whereby environmental impacts and sustainable resources use were studied through Life Cycle Assessment (LCA) and a set of indicators, respectively. The results achieved proved to help make decisions at different stages and adopt targeted strategies. As a response to the reluctance of companies to share their information, Cervo et al. (2020) [18] presented a methodology to build blueprints to facilitate IS. Its application to a petrochemical plant demonstrated its usefulness in providing a transparent and simple tool for IS opportunities’ identification.
Apart from these methodological investigations, other authors have focused on the collection and processing of data to facilitate IS. Ruiz Puente et al. (2015) [19] analyzed the industrial symbiosis opportunities for Small- and Medium-sized Enterprises (SMEs) in Cantabria, Northern Spain. To this end, they collected surveys from 104 companies about their characteristics and waste produced, thereby enabling the proposal of different prioritized synergies. Low et al. (2018) [20] built a database engine to enable waste-to-resource matching using a classification method for organizing, modeling and storing of information. Its application to two case studies demonstrated the insights that companies can obtain regarding conversion of waste into products. Domenech et al. (2019) [21] mapped the degree of development of IS across Europe. Although they identified different IS networks in a number of countries, their exchanges were found to be limited by obstacles related to risk, uncertainty and transactional costs. Neves et al. (2019) [22] evaluated the status of Portugal in terms of IS, finding that existing networks are small and consist of only two or three members in most cases. Legislative changes, funds availability or the existence of facilitators were identified as key aspects for improving the current situation.
The trend observed in these studies revealed a research gap in what concerns the facilitation of the access to and understanding of information oriented to promote IS. Although there is a variety of investigations devoted to evaluate and support IS exchanges, as well as to analyze opportunities for establishing synergies, companies still struggle to obtain easy-to-interpret information that can be really helpful in terms of Circular Economy. This is in line with the recent conclusions drawn by Kosmol (2019) [23], who highlighted the difficulties to integrate current IS-related information and knowledge into business processes, thus hindering the creation of synergies. Moreover, Yeo et al. (2019) [24] pointed to the complications associated with extracting useful information from the vast sources of data and knowledge that are available today.
Under these premises, the purpose of this research is to process and analyze existing open-access IS databases, structuring them and filling their gaps to produce a compilation of reported case studies to be examined in detail from different points of view, in order to produce knowledge to be exploited by companies willing to participate in IS exchanges in which they can donate or receive materials. The initial hypothesis on which the fulfillment of this aim depends is that existing databases reporting a large number of IS exchanges can be structured and processed with the support of exploratory and statistical analyses, thus enabling the identification and prioritization of synergies according to their frequency and intensity.
In this vein, the results achieved demonstrated the effectiveness of the analysis undertaken in providing companies with easy-to-understand and concise information regarding potential IS opportunities through the simplifications of the exchanges reviewed, including aspects such as business sectors involved, the types of waste generated and their new uses as raw materials, all of which seeks to produce clear and concise information through the simplifications of the exchanges under analysis. The rest of this manuscript is devoted to dealing with these considerations according to the following structure. Section 2 describes the methodology sought to process existing open-access IS databases, whilst Section 3 presents and discusses the results stemming from their analysis. Every table and figure included in the manuscript to support the description of both the methodology and the results were self-created. Finally, Section 4 summarizes the main conclusions drawn from the investigation, highlighting both their implications for the field of IS and potential future actions for giving continuity to this research line.

2. Materials and Methods

The approach taken aimed at analyzing the information contained in existing IS databases by following four sequential steps as shown in Figure 1. First was the identification of existing databases to enable the compilation of previous case studies. Then, the exchanges contained in the shortlisted databases were arranged according to different criteria, including type of donor and recipient company, based on their Nomenclature of Economic Activities (NACE) code, as well as type and end of use of waste. The third step concerned a verification process of the synergies found by evaluating the relationship between waste, the statistical Classification of Products by Activity (CPA) and recipient company. Next was the identification and amendment of errors and incomplete fields in the databases selected in the first step. Finally, the results stemming from the previous task were assessed through exploratory and statistical analyses.

2.1. Data Compilation

This step started with the screening of existing databases, in order to select those that best fitted the requirements for creating concise and easy-to-understand IS information. The design of tools to support IS has increased a lot during the past decade [25]. However, as pointed out before, most of these tools focus on providing companies with a computerized means to search for new synergies, lacking information about previous cases. This absence of shared knowledge prevents any potential contact with companies capable of shedding light about their past successful experiences. Only three recent developments are devoted to the compilation of previous exchanges to help companies finding new opportunities: CIRCULATOR [26], IS-Data [27], MAESTRI [28] and SYNERGie® 4.0 [29]. The first one is limited to describing the experiences of individual companies, thereby lacking complete information about the exchanges involved. For its part, the data contained in SYNERGie® is not open-access, which is against one of the main premises of this research.
As a consequence of these considerations, the databases selected to work with were MAESTRI and IS-Data. MAESTRI is the result of an EU-funded research project sought to develop an integrated platform combining different assessment tools, a new management system and a novel approach for IS implementation [28]. Overall, MAESTRI compiles 424 exchanges from 46 different case studies. This database provides two filtering systems, whereby users can refine their searches according to the companies and materials present in the exchanges. As mentioned before, companies and products are defined through their NACE and CPA codes, respectively. In addition, this database also uses the European Waste Catalogue (EWC) codes and the Chemical Abstracts Service (CAS) registry numbers, which enables identifying the composition of waste in those cases in which it is formed of several substances. Table 1 summarizes the structure and data included in MAESTRI, arranged according to the companies and materials involved in the exchanges.
Like MAESTRI, IS-Data compiles IS experiences across the globe through an open platform. This platform was created to enable using its data in combination with other open or proprietary datasets, including a series of tools to help users in achieving their goals and interests [27]. It contains 74 exchanges whose origin in terms of case studies is unknown due to its structure. IS-Data is arranged according to three sheets, such that the first one includes data about the exchange, identification codes, title, author, organization, country, summary and year of publication. The second sheet focuses on the reference of the exchanges. The Australian and New Zealand Standard Industrial Classification (ANZSIC) is also used to complement the NACE code. Additionally, the materials are described through the EWC and CPA codes, specifying whether the exchanges are under development or already implemented. The last sheet indicates the country of origin of the participating parties, the Small- and Medium-sized Enterprises (SME) involved (if any) and other information related to economic, environmental and social impacts, transmitted energy etc.
The data contained in MAESTRI and IS-Data were processed to improve both their completeness and simplicity, in order to facilitate the identification of the main aspects that can lead companies to find exchange opportunities, either in the form of raw materials acquisition or waste disposal. Although the main source used to carry out the tasks needed to achieve this purpose was MAESTRI, IS-Data was also taken into account as a complement in order to introduce some improvements, such as additional descriptions, secondary materials, location etc. Consequently, the proposed database amounted to 496 exchanges, 424 from MAESTRI and 76 from IS-Data.

2.2. Exchange Organization

Data were sorted from large to small, enabling different types of analysis according to the levels of details established. The first criterion used was the NACE code of donor companies using the four digits on which it is based. Then, the waste produced by these donor companies was identified as materials, energy or water, such that each of these groups was further ordered according to the end use made by the recipient companies. This sequence was repeated using only the first two digits of the donor NACE code, in order to get an overview of the economic areas involved in the exchanges. In addition, the whole process was replicated from the point of view of the recipient companies.
This approach enabled determining which companies were responsible for generating waste with more changes of exchanging, as well as their business area, the type of waste they generate the most, the type of waste with more prospects to be used by other companies and their most frequent end use. A field indicating the location of the exchanges was added too in case there is a need to go deeper into them. In this line, the inclusion of a link with more information about the practical cases from which the exchanges stem was addressed in subsequent steps.
In the first instance, these arrangements must be verified by considering those cases in which waste performed as raw materials. This was undertaken using the CPA code associated with the waste involved in the exchanges. In the case of waste generated by donor companies whose CPA code was known, the aim was to check their correspondence with the products used by the recipient companies. If the CPA of waste was not specified but the recipient companies were found to use them as raw materials straightforwardly, the verification consisted of finding their corresponding CPA. Finally, waste that was not associated with any CPA nor used as raw materials was investigated to determine its role in the exchanges.

2.3. Sinergy Verification

To efficiently ensure the coherence of the large amount of data resulting from the merge between the MAESTRI and IS-Data databases, the correspondence between waste and its associated CPA was verified by considering only those groups of donor companies with five or more synergies registered. Within these groups, those cases involving exchanges with a defined end use for waste were discarded, since the goal at this stage was to validate synergies in which waste performed as raw materials. This resulted in a total of 137 exchanges to verify.
A new field indicating the description of the CPA code was added to provide a means to rapidly check the alignment of waste with the classification according to its activity. Thus, the verification of synergies was based on identifying a double relationship: (1) waste–CPA and (2) CPA–recipient company. This line of action revealed that the CPA associated with waste was an indicator of its new uses. This can be illustrated with a case in which sludge (waste in the donor company) performs as a fertilizer (end use in the recipient company). The CPA of this exchange would correspond to “animal or vegetable fertilizers”.
In addition, recipient companies can make a complete or partial use of waste. For instance, the former occurs when the type of waste generated is wood, which can be used as a raw material to obtain heat in diverse areas. On the other hand, an example of partial use of waste is sewage sludge containing slags, since the latter can perform as raw materials in the manufacturing of construction products. Moreover, the correspondence between the activity indicated by the CPA and the economic area of the recipient company was also validated. Thus, the fact the new role played by waste kept a clear relationship with the type of recipient companies was taken as a confirmation of their suitability for the exchange. This verification process, which can be schematized as represented in Figure 2, enabled corroborating the relationship between waste, CPA and the end uses allocated by the companies.

2.4. Error Correction

This step was not restricted only to representative cases as before, but extended to the whole set of exchanges included in MAESTRI and IS-Data. Hence, the errors, conflictive data and incongruences found in the arranged data were processed according to donor and recipient companies. The type of errors found in the databases are listed below:
  • Inconsistencies between the description of companies and their NACE code. These errors refer not only to a lack of correspondence between description and NACE codes, but also to the cases in which a more suitable NACE code can be assigned to the companies.
  • Inconsistencies between waste, CPA codes and recipient companies. This situation concerns those exchanges in which there is not a clear linkage between these three aspects, either because the CPA codes associated with the waste allude to unlikely new uses for them or because the new uses of waste have no relationship with the recipient companies.
This process yielded 118 contradictory registers, which means 24% of the 496 initial cases. 92 of these errors stemmed from MAESTRI and 36 from IS-Data. Three groups were created to facilitate the processing of errors and differentiate between those associated with donor companies, recipient companies and CPA codes. Besides, four new fields were added to account for the following aspects:
  • Errors in the NACE / CPA code: key aspects that are provoking conflict in the data.
  • Error description: explanation of the reasons to either make corrections or accept data included in the databases.
  • Corrected main business / CPA code description: definitive main business of the companies or the CPA codes after the application of changes.
  • Corrected NACE / CPA code: definitive NACE or CPA codes after the application of changes.
Inconsistencies between the description of companies and their NACE codes were accepted in those cases in which there was an explanation justifying their use. Otherwise, doubtful data in this sense was considered incorrect and NACE codes more aligned with the description of the companies were proposed. As for the irregularities between waste, CPA codes and recipient companies, the approach taken consisted of using exchanges containing data about waste treatment as references, since these cases can be very useful in the identification of relationships between waste and its new uses. As a result, 93 of the 118 conflicting cases were corrected (79%), a figure that amounts to 19% of the 496 original exchanges.
Apart from the amendment of incorrect data present in MAESTRI and IS-Data, this step also dealt with the absence of information regarding the description of donor and recipient companies, as well as the identification through the EWC, CPA and NACE codes. The results of this task were grouped this time according to donor company, recipient company, CPA and EWC. This code was not considered in the correction of errors because it was not conflictive in that case. All these groups included a new field in which the filling proposal was explained.
The hardest fields to complete were the description of companies and their NACE codes. Those cases in which both fields were unavailable could not be completed unless specific data about them was found and comparable with other exchanges. In the absence of EWC, the procedure consisted of assigning the code that best fitted the descriptions available in the databases. The fact that this code not only represents the type of waste but also its origin was taken into account in the proposal of new values. Again, if both the EWC code and the waste description were missing, the empty space could not be filled with rigor.
The situation with the CPA code was more complex, since it depends on its double relationship with waste and recipient companies. Each CPA empty case was studied individually by analyzing the companies involved in the exchange and the type of materials they usually work with. Additionally, the most frequent new uses allocated to waste were also evaluated, in order to collect as much data as possible to set the most suitable code for each exchange. Moreover, CPA codes were also obtained through comparison with similar exchanges available in the databases.
Once these flaws were addressed, the information grouped according to donor and recipient NACE codes was updated by adding the corrections and fields completed in this step. This resulted in the definitive arrangement of the 496 exchanges included in MAESTRI and IS-Data based on NACE codes, waste (including CPA and EWC) and new uses assigned by the recipient companies. Table 2 shows the arrangement of information once this step was completed, including a trio of examples representing all possible casuistries in what concerns data acquisition and processing.

2.5. Exploratory and Statistical Analysis

This whole refinement procedure was required to prepare the data for their analysis in both exploratory and statistical terms in the final step of the methodology. In the first instance, data were evaluated with the support of a simple correspondence analysis. This technique handles data in the form of contingency tables by indicating the degree of relationships between rows and columns. In this case, variables such as donor and recipient areas, waste or new uses performed as the rows and columns in such tables. Hence, data variability was broken down into dimensions and then associated with rows and/or columns.
This enabled the creation of graphs to represent row and column points or coordinates that help examine the structural relationships between the variables under analysis. In the case of plotting business areas according to their NACE codes, row and column coordinates represent the chi-square distances between the raw data indicating the frequency of donor and recipient sectors divided by the number of rows and columns, respectively. There are symmetric and asymmetric plots to display the coordinates for row and column categories. Symmetric plots display principal coordinates for both rows and columns, whilst asymmetric row and column plots display principal coordinates and standardized coordinates for row categories, and vice versa for column categories. Since this standardization facilitates the interpretation of distances and angles between row and column points, asymmetric plots were selected for the analysis. Further choice between asymmetric row plots and asymmetric column plots was made according to visualization criteria with the aim of reducing points’ overlap.
The degree of association between the variables involved in IS were explored through network analyses. The exchanges contained in the refined database could be represented through different networks, with the pairs of either donor–recipient business areas or waste–new uses performing as nodes, and the intensity between their relationships playing the role of links or edges. Networks can be characterized through a series of concepts. Centrality refers to the relative importance of each node in the network. This term is closely related to the connectivity between such nodes, since their relevance or centrality is given by the number of exchanges in which they participate.
Another important concept is nodal degree, which indicates the number of nodes each node is connected with. This is strongly associated with the diversity of the nodes, which concerns the variety of nodes to which they are linked. Taking all these considerations into account, networks can be divided into centralized, decentralized and distributed. A centralized network contains a single central node to which all others are related. A decentralized network stems from the union of a series of centralized networks, such that central nodes can also be linked to other nodes in the general network. Instead, distributed networks highlight by lacking any central node. Due to the characteristics of IS data, every network to be obtained throughout the next section was expected to be distributed.
To ensure the statistical validity of the inferences drawn from the aforementioned analyses, data were also examined using correlation coefficients, which measure the degree of association between two variables. Positive correlations indicate that both variables increase in the same direction, whilst negative correlations mean that one variable increases whenever the other decreases. These two types of coefficients are quantified through intervals ranging from 0 to 1 and −1 to 0, respectively. Statistical correlations are measured using different coefficients depending on whether data are quantitative, ordinal or nominal. In this case, data were nominal variables representing business areas, waste and new uses.
Nominal data must be first dichotomized to enable quantifying any relationship between the variables through correlation coefficients. Hence, the variables under study were represented with values of 1 and 0, which indicated whether they were present or absent. For instance, the correlation between donor NACE 01.10 and recipient NACE 16.29 was approached by creating two columns with all the exchanges. Hence, the first column included values of 1 when the donor was 01.10, whilst the cells in the second column were 1 in those cases in which the recipient was 16.29. The remaining cells were set at 0 in both columns, indicating that the participating donor and recipient areas were neither 01.10 nor 16.29. The validity of correlation coefficients was measured through the p-value, which indicates the probability of wrongly rejecting the hypothesis whereby there was not enough evidence to conclude that two variables are correlated. Therefore, a p-value below the significance level, which was set at 0.05, suggested that there was less than 5% probability that this hypothesis was correct.

3. Results and Discussion

The presentation and discussion of results was carried out according to the variety of levels of detail involved by the different codes used to represent economic areas, types of waste and product uses. In this vein, the results achieved according to the NACE code were explored by using one, two or four digits, involving increasingly narrow clusters to indicate the activity of companies. In the case of the EWC and CPA codes, the analysis tightened from generic to specific by considering two and six digits.

3.1. Analysis According to Business Areas (NACE Codes)

As a first step, a simple correspondence analysis was undertaken to examine the interactions between donor and recipient companies according to their 1-digit NACE codes. Figure 3 shows the asymmetric row plot stemming from this analysis, which displays a row of principal coordinates (donor) and a column of standardized coordinates (recipient). The main information provided by this diagram is that the further categories are from the origin, the more distinct they are, and vice versa. In this case, this means that NACE donor H (transportation and storage) and recipients F (construction), H and E (water supply) are less likely to participate in exchanges with other sectors. Instead, NACE codes like C (manufacturing) and D (electricity gas, steam and air conditioning) are located close to the origin, indicating more chances to create synergies with other businesses. The strength of the relationships between donor and recipient areas increased proportionally to the acuteness of the angles between the lines connecting their positions with the origin. Hence, a couple of examples of strong relationships were those between donor D (electricity) and recipient C (manufacturing) or donor C and recipient A (agriculture), since the virtual lines connecting their coordinates with the origin of the plot were acute.
A more detailed arrangement of the data according to the NACE codes is depicted in Figure 4, which represents donor and recipient companies through 2 digits. Thicker links represent the more frequent exchanges between the 49 NACE codes included in the 496 cases that formed the processed database. Hence, the chemical industry (20) was found to participate in 26% of the total exchanges, followed by the supply of electricity, gas, steam and air conditioning (35), the manufacture of basic metals (24), the food industry (10) and the manufacture of other non-metallic mineral products (23), which amounted to 23%, 20%, 16% and 15% of the synergies considered, respectively.
As further proof of their importance, the exchanges among these 5 economic areas concentrated a third of the registered synergies. This figure increased up to 75% when taking into account the participation of these sectors in any exchange, which corroborates their great importance in terms of IS due to the type of waste they generate and their high reusability. As introduced before, Figure 1 shows a distributed network, since there is neither a single node centralizing the relationships with the others nor a decentralized tree-shaped structure where the generation of exchanges is sequential.
As a consequence of the impossibility of fill or complete some the absent data, there were 42 and 23 unknown registers involving the participating companies (NA), which amounts to 13% of the exchanges under study. Still, these results highlighted the complexity of the connectivity between the nodes of the networks, defined as the capacity of the companies of the same or different economic areas to communicate with each other, share information and establish mutually beneficial relationships.
The analysis of data from the perspective of donor and recipient companies resulted in some differences with respect to Figure 4, as observed in 
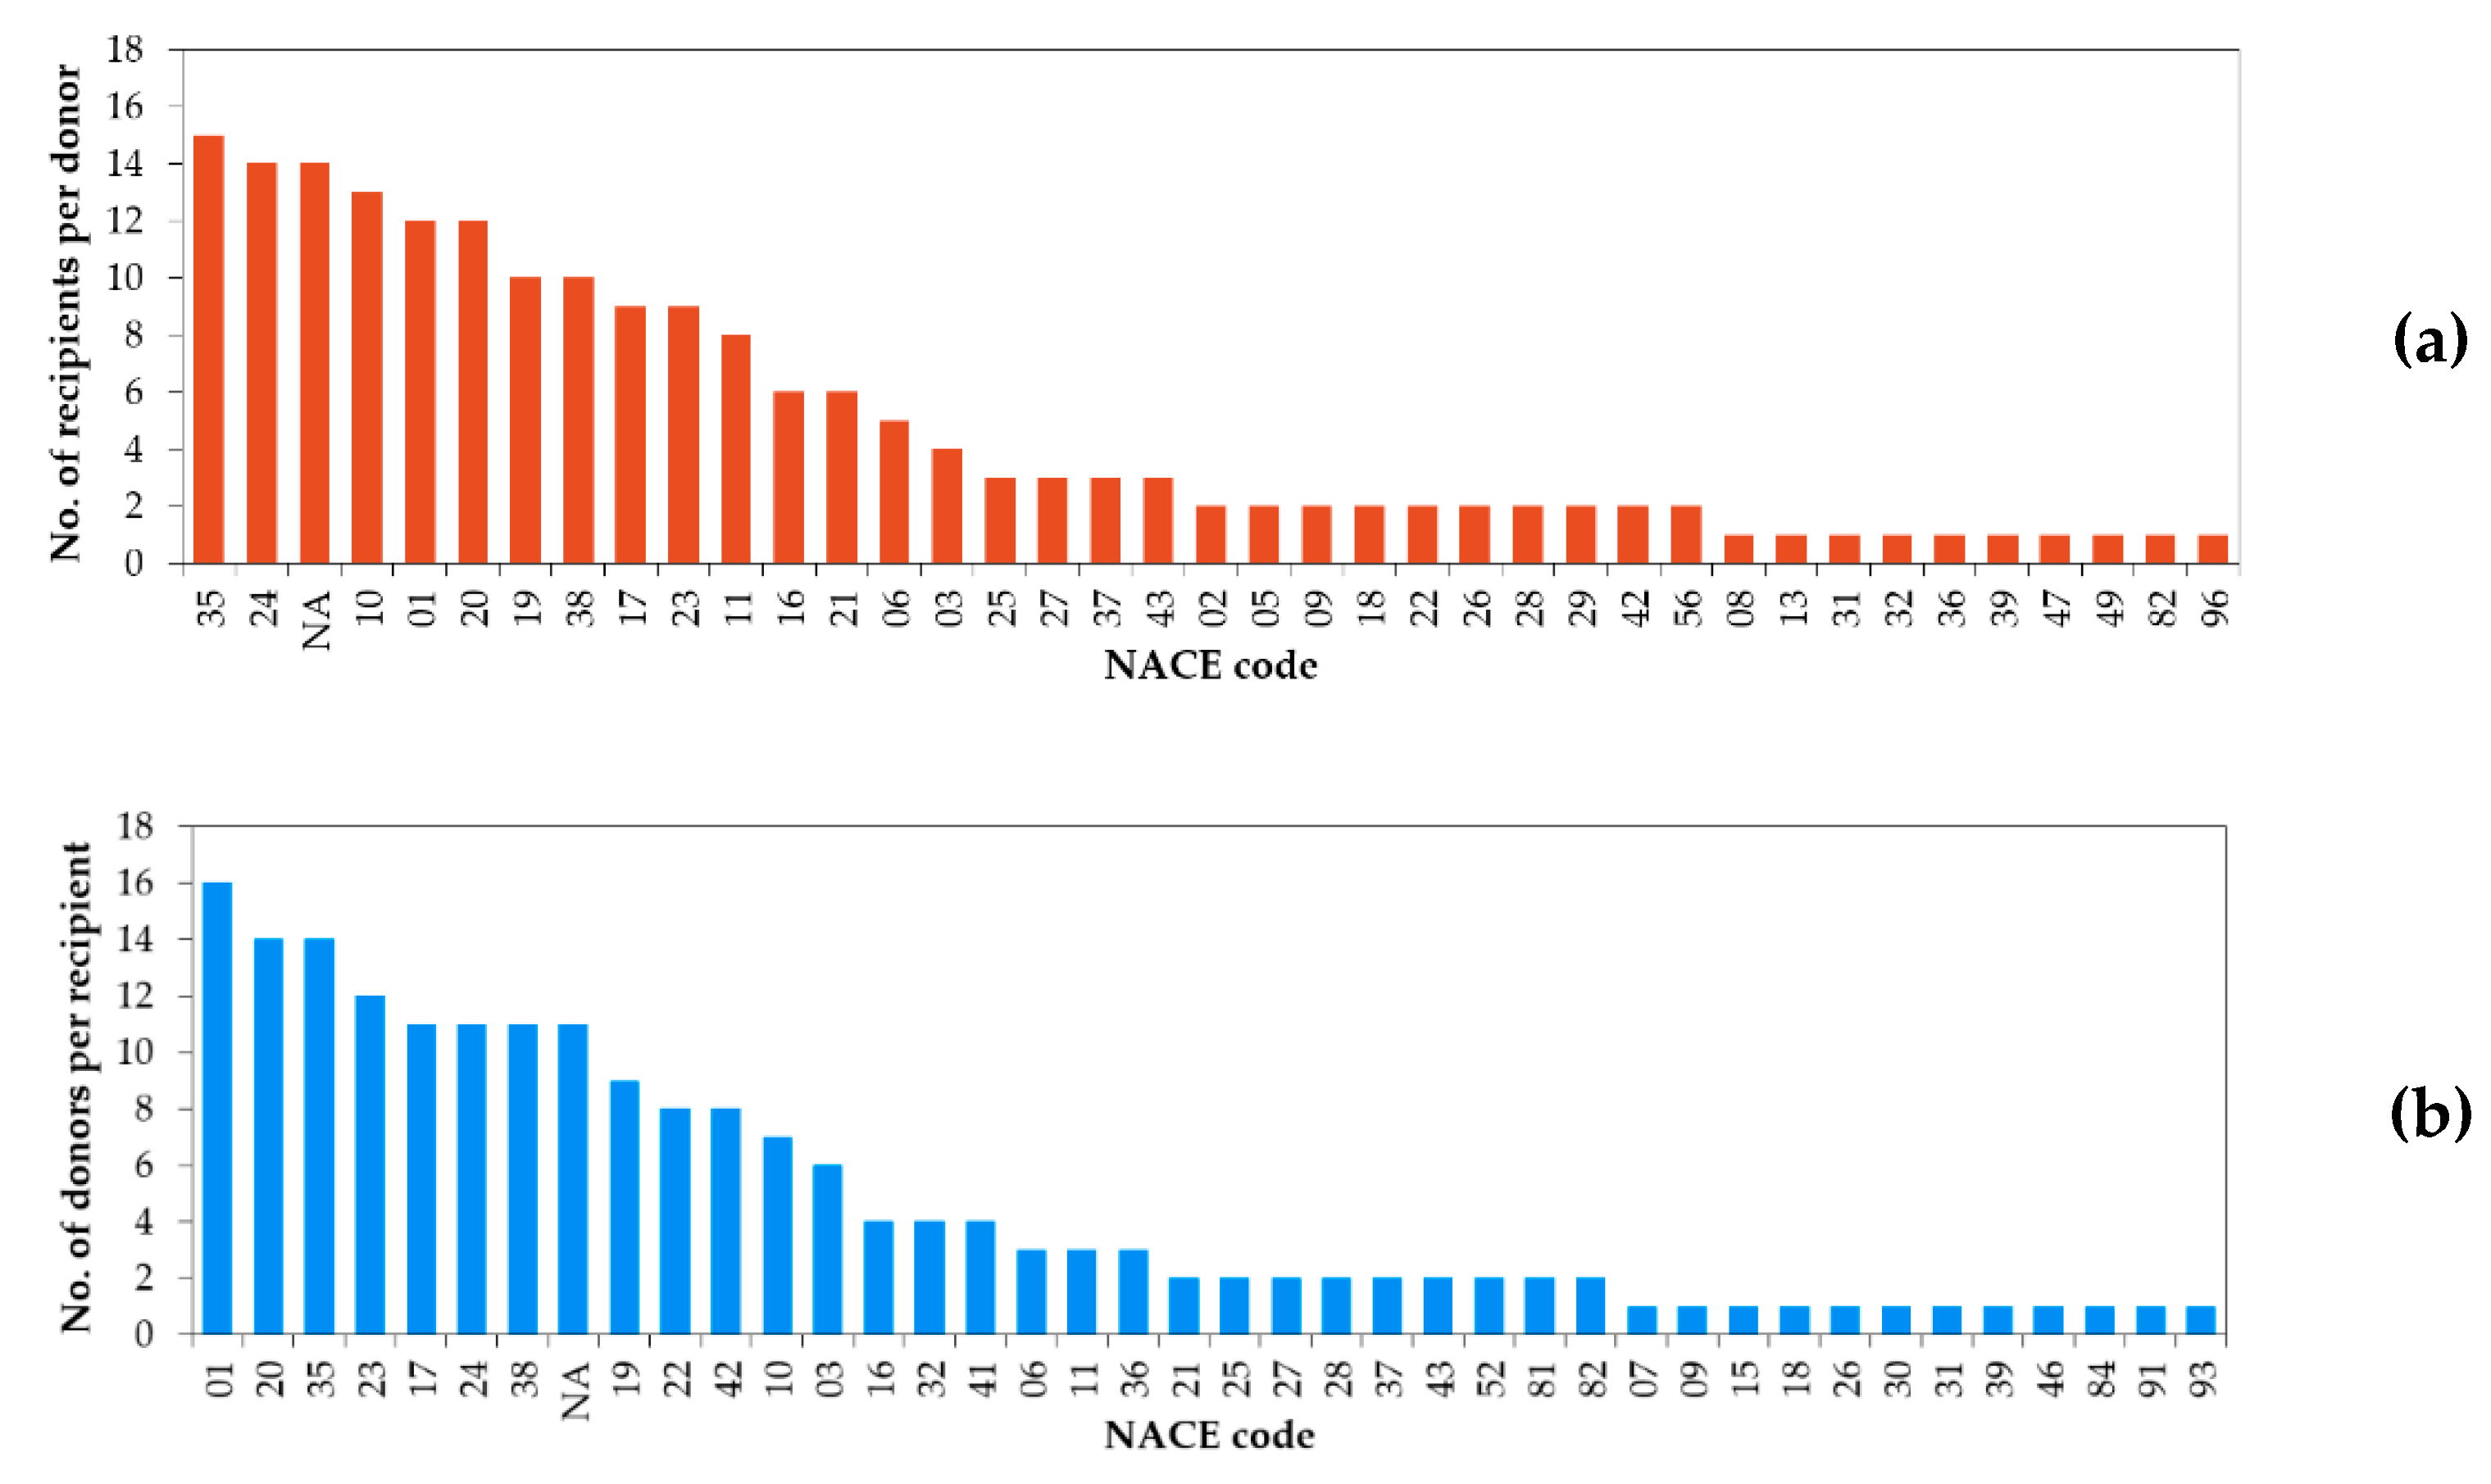
Figure 5a,b. For instance, areas 01 (crop and animal production), 20 (manufacture of chemicals) and 23 (manufacture of other non-metallic products) were found to be unbalanced in favor of their role as recipients, and vice versa for area 24 (manufacture of basic metals). On the one hand, those donor areas reaching top positions both in Figure 4 and Figure 5a experienced a decrease in the number of NACE codes to which they donate in comparison with their participations in exchanges, due to the existence of repeated donations to the same areas. For instance, category 24 (metallurgy) donates 67 times to 14 different sectors, among which code 23 (other non-metallic mineral products) highlights as a recipient with 21 exchanges. This fact is exacerbated in those areas participating in less synergies, such as code 16 (wood), which had a 100% diversity in its donations to 6 different areas.
On the other hand, code 20 (manufacture of chemicals) highlighted by being the greatest recipient in Figure 4; however, Figure 2b indicated that the receptions in this area stemmed only from 14 different sectors, of which 91% related to NACE codes 20 (chemicals), 24 (basic metals), 35 (electricity, gas, steam and air conditioning) and 19 (coke and refined petroleum products). Instead, the high number of participations of code 01 (agriculture) as a recipient from different donors was due to the variety of sectors producing waste that can be used to fertilize soils. This trend is consistent with many research studies aimed at assessing the suitability of a variety of waste types stemming from different sources to perform as fertilizers, such as iron [30], volcanic rocks [31], coffee [32], wine [33] or seaweed and fish [34].
The validity of the synergies between donor and recipient companies was further analyzed by determining their Phi correlation coefficients, whose values proving to be statistically significant are compiled in Table 3. The implications of these results differed from those of previous analyses, since high correlation coefficients are associated with exclusivity rather than capacity for establishing a lot of synergies. The greatest exponents of this situation are exchanges 26–26 (manufacture of computer, electronic and optical products) and 47–31 (Retail trade, except for motor vehicles and motorcycles—manufacture of furniture), which only favored exchanges with each other and, therefore, resulted in the highest possible correlation coefficient. By contrast, donor companies with codes 11 (manufacture of beverages) and 24 (manufacture of basic metals) diversified their synergies a lot, thereby leading to weaker correlations. Hence, the results in Table 3 provide an excellent complement to the data depicted in Figure 3 and Figure 4, since they enable moving from the quantitative characteristics of exchanges to their representativeness.

Subanalysis Using 4-digit NACE Codes

A more exhaustive breakdown of the data through the 4-digit NACE codes of the companies is provided in Table 4. This subanalysis revealed that the production of electricity (35.11) appeared in 99 of the 496 exchanges. This is in line with the findings of Rattner and Garimella (2011) [35], who found that there was sufficient waste heat from power plant outlet streams to satisfy all the USA space and water heating needs. Other important areas were the manufacture of basic iron and steel and of ferro-alloys (24.10) with 61 participations, the manufacture of refined petroleum products (19.20) with 56 and the manufacture of cement (23.51) with 46. This contrasts with the results obtained for the 2-digit NACE codes, whereby the chemical industry (20) was in the first place. This singularity was due to the disaggregation of this economic area into multiple codes, such as 20.11 (industrial gases), 20.12 (dyes and pigments), 20.13 (other inorganic basic chemicals), 20.14 (other organic basic chemicals) or 20.15 (fertilizers and nitrogen compounds). Instead, the emergence of 19.20 (manufacture of refined petroleum products) when considering 4 digits was a consequence of the division of the manufacture of coke and refined petroleum products (19) into only two categories, which favored the concentration of cases for this particular code.
The predominant trio of areas according to the 4-digit NACE code, namely 35.11 (production of electricity), 24.10 (manufacture of basic iron and steel and of ferro-alloys) and 19.20 (refined petroleum products), persisted when exploring the frequency of exchanges per donor, with remarkable differences with subsequent codes. The main exception to this trend was 10.81 (manufacture of sugar), which performed as a donor in 21 exchanges addressed to 14 different sectors. In this vein, code 35.11 (production of electricity) highlighted by both its centrality and diversity, since its 59 donations were distributed across 24 different sectors. By contrast, 24.10 (basic iron and steel) was less diverse due to the repeated linkages with the same areas, such as its 12 donations to the manufacture of cement.
The business area with the highest number of exchanges as a recipient remained 35.11. However, the differences between the 2–3 most frequent codes and the remaining ones was not so abrupt as in the case of exchanges per donor, which is logical due to the versatility of some types of waste in terms of new uses. Agricultural companies did not highlight when considering the 4-digit NACE codes, due to their aforementioned distribution across different activities such as 01.13 (vegetables and melons, roots and tubers) or 01.50 (mixed farming). One of the most striking cases at this stage of the study was the presence of 38.21 (treatment and disposal of non-hazardous waste), which performed sixth as the sector with more receptions registered (18) and almost 100% diversity (17 different origins), as a result of its capacity for admitting both organic and inorganic waste. Another example of diversity was 01.10 (growing of non-perennial crops), whose 8 exchanges were with 8 different business areas. These cases illustrate how versatile some areas are when it comes to make new uses of a variety of types of waste, thereby providing them with different business opportunities to exploit.

3.2. Analysis According to Material Exchanges (EWC and CPA Codes)

Similarly to the previous subsection, the asymmetric row plot (Figure 6) yielded by a simple correspondence analysis enabled exploring the relationships between waste (EWC code) and new uses (CPA code). In this case, EWC 14 (organic solvents, refrigerants and propellants) and CPA 28 (machinery and equipment) were very far from the origin of the chart, which indicated their almost null compatibility with the remaining waste types and new uses. On the contrary, waste types such as 07 (organic chemical processes) or 19 (human or animal health care) highlighted by their versatility, lacking narrow or specific new uses.
The sharp angles formed between the origin of Figure 6 with the combos EWC 02 (agriculture) –CPA 10 (food products) and EWC 10 (thermal processes)–CPA 35 (electricity, gas, steam and air conditioning) suggested that these were the strongest interactions between waste and new uses. This inference was confirmed by the thick arrows connecting these elements in the network diagram represented in Figure 7. Other examples of powerful links were EWC 10 (thermal processes) and CPA 08 (mining and quarrying products) or EWC 06 (petroleum refining, gas purification and coal treatment) and CPA 20 (chemicals), as shown in Figure 6 and Figure 7. Moreover, the intensity and frequency of the links in which EWC 20 (waste management) and CPA 38 (waste collection and treatment) were involved was also remarkable.
As suggested by 
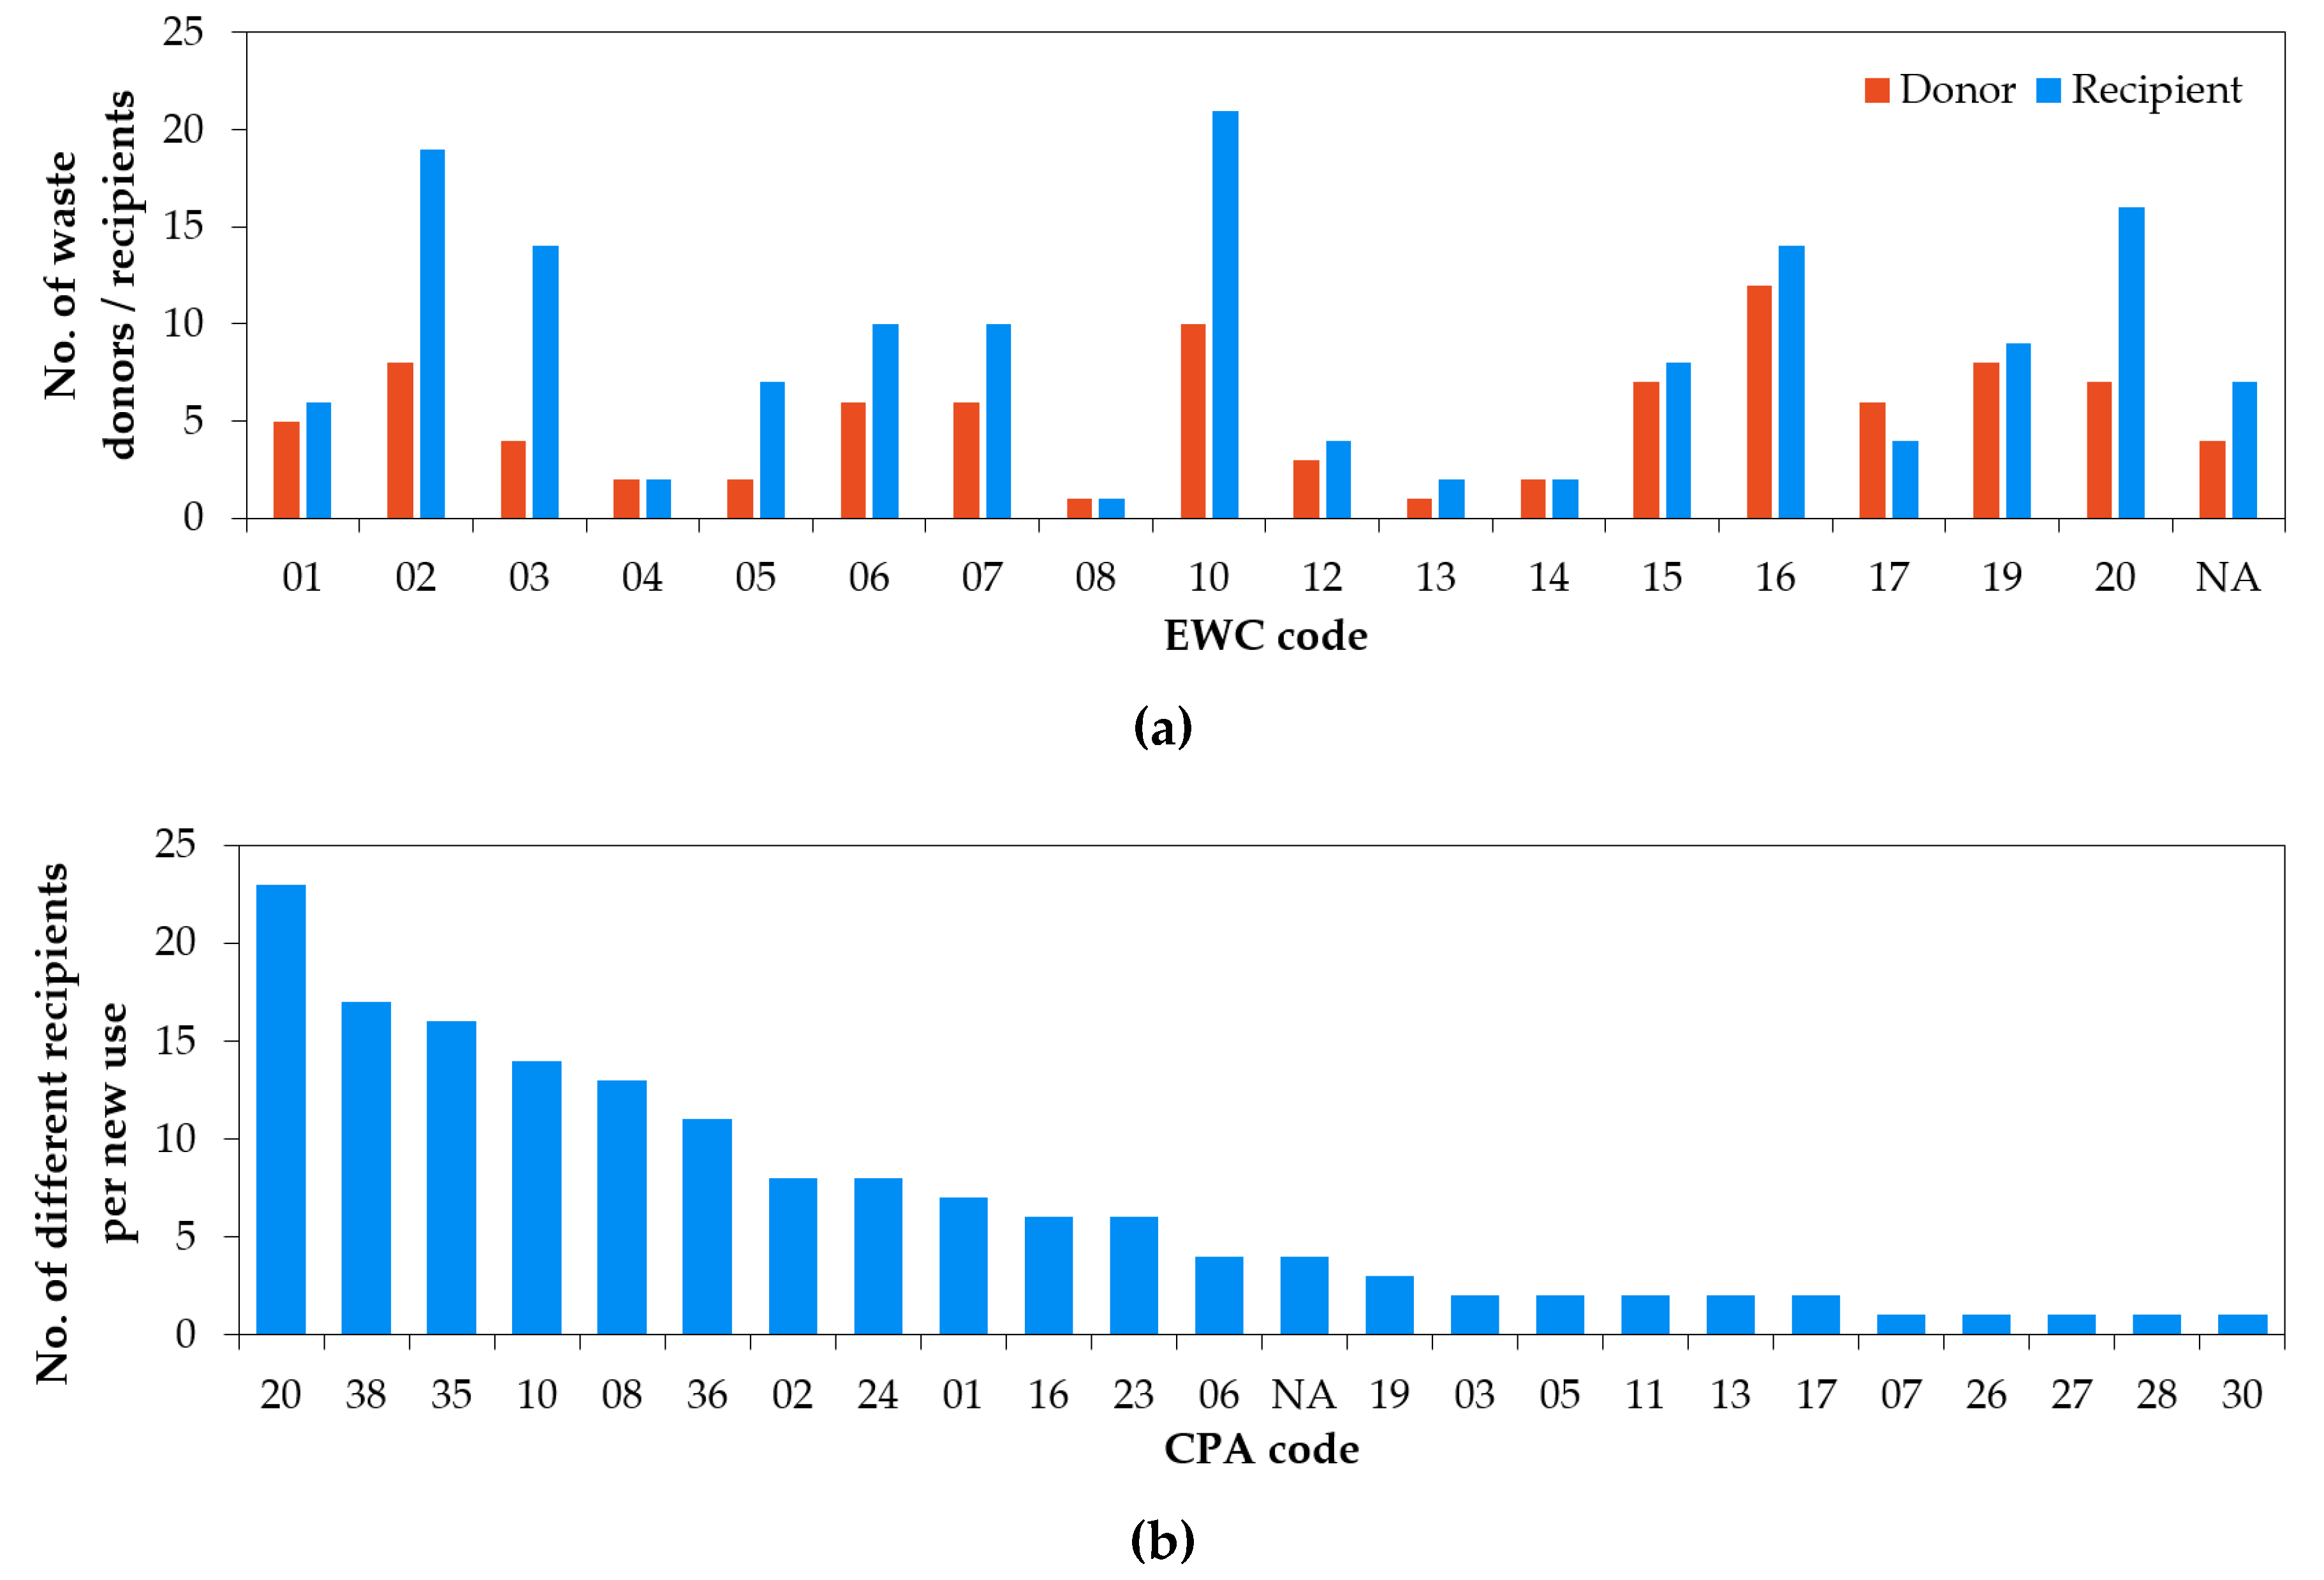
Figure 7, EWCs 10 (thermal processes) and 02 (agriculture) were the two types of waste most widely involved in the network, to the extent that they participated in 29% (144/496) and 21% (102/496) of the exchanges registered. The distribution of waste according to donor and recipient NACE codes is explored in Figure 8a. From the point of view of donors, the importance of EWC 16 (waste not otherwise specified in the list) was logical, since this code agglutinates every type of waste that is not included in other categories. The preponderance of EWC 10 (thermal processes) pointed out to the importance of thermal processes in the production activities of different industrial sectors, such as extraction, chemicals, metal, electricity, paper, wood or cement. Next was EWC 02 (agricultural and food waste), which were generated by 8 different donor areas. Their presence in these terms is interesting, since agricultural companies were not among the greatest donors in Figure 4. However, the food industry played an important role as a donor, to the extent of being responsible for 61% of the exchanges in which EWC 02 (agricultural and food waste) was involved.
From the perspective of recipients, thermal processes (EWC 10) also generated the most usable waste by a greater number of companies. A large proportion of this waste was slags used as additives in cement, road construction and other civil engineering activities. The literature provides multiple examples corroborating how common this relationship is [36,37,38,39,40], in consistency with the predominance of the construction sector as the largest consumer of raw materials [41]. Another part was steam and hot gases used as energy in petroleum refineries, factories and the chemical industry. Agricultural waste (EWC 02) was distributed among 19 recipients, thanks to its versatility to act as fertilizers, an energy source or animal food. Waste management (EWC 20) and wood–paper waste (EWC 03) also achieved a high degree of variety with 16 and 14 recipient areas, respectively. EWC 20 (waste management) is very varied, including plastics, clothes, batteries or paint, which increases its suitability for a large range of business areas. The high diversity of wood and paper waste was explained by their ability to produce energy, which is a much-demanded source in different sectors. At the opposite side, EWC 06 (waste from inorganic chemical processes), which was the third most frequent waste with 47 participations, was only received by 10 different recipients. This is justified by the fact that most of the waste types in this code are fertilizers, gases or water, which in most cases end up in the chemical industry or in power plants in the form of energy (NACE 20).
As illustrated in Figure 6 and Figure 7, the most frequent CPA codes, namely 10 (food products), 38 (waste collection, treatment and disposal) and 08 (other mining and quarrying products), were not directly proportional to the NACE codes of recipient companies. In consequence, Figure 8b was prepared to observe the relationships between CPA and recipient NACE codes. Chemical products (CPA 20) were used by 23 different recipients; however, 36% of these areas corresponded to NACE 20 (chemicals). This fact, which might seem logical, did not apply for CPA 35 (electricity, gas, steam and air conditioning), since there were only 12 times out of 77 in which these raw materials ended up in the energy sector (NACE 35). The remaining 65 times were distributed across 15 different NACE recipients, highlighting the importance of energy in almost every business sector. CPA 08 (mining and quarrying products) also had an uneven distribution, although on this occasion it involved that more than half of the exchanges involving this code were related to its correspondent NACE code (08). Other relevant raw materials in this sense, such as CPAs 38 (waste collection and treatment) or 10 (food products), were more balanced in what concerns frequency and number of recipient areas.
The statistically significant Phi correlation coefficients derived from the relationships between 2-digit EWC and CPA codes are collected in Table 5. As a remarkable difference with respect to the results listed in Table 3, the analysis yielded several negative correlation coefficients in this case. This fact emphasized the existence of incompatibilities between several types of waste and some potential new uses registered by the recipient companies. The interactions between waste types 02 (agriculture), 06 (inorganic chemical processes) and 10 (thermal processes) with the new uses 35 (electricity, gas, steam and air conditioning), 38 (waste collection, treatment and disposal) and 20 (chemicals), respectively, epitomized this situation. Although the inferences derived from these relationships might be obvious, sometimes the potential new uses that can be assigned to waste are unclear. Therefore, this type of information is useful to discard options straightforwardly when thinking of potential synergies aimed at valorizing waste. The highest correlation coefficients corroborated the strength of some of the links identified in Figure 7, such as those between EWC 02 (agriculture) with CPA 06 (crude petroleum and natural gas) and EWC 10 (thermal processes) with CPA 35 (electricity, gas, steam and air conditioning). Other coefficients like those between EWC 01 (waste from mining and quarrying) and CPAs 05 (coal and lignite) and 06 (crude petroleum and natural gas) indicated that mineral waste is most likely to become raw materials used for combustible purposes, thereby suggesting a clear search pattern for donor companies. It is also worth mentioning the highest correlation coefficient in Table 5, which corresponded to the association between EWC 14 (wearing apparel) and CPA 28 (machinery and equipment). This is completely aligned with Figure 6, in which the location of these two elements suggested a strong independent symbiosis between both of them.

Subanalysis Using 6-digit EWC and CPA Codes

When taking into account the 6-digit version of the EWC code, a total of 170 different waste types were found. Since 89 of them only participated in one single case, 48% of the waste types were involved in several exchanges. In line with the trend observed in Figure 7, the most widely present waste types were 100202 (unprocessed slag) and 100118 (waste from gas cleaning containing hazardous substances), as highlighted in Table 6. Therefore, the most widely involved waste belonged to two of the three most frequent donor areas: metallurgy (NACE 24) and electric energy (NACE 35). Instead, the relevance of other types of waste highlighted in Figure 7, such as 06, was diluted when considering the whole EWC codes due to its balanced distribution over different categories such as 060204 (sodium and potassium hydroxide) or 061002 (hazardous substances).
In terms of the number of donors that produced each type of waste, EWCs 020103 (plant-tissue waste) and 150102 (plastic packaging) highlighted by being produced by 9 and 6 different business areas, respectively. Regarding plastic packages, these areas belonged to 5 NACE groups (2-digits), namely 01 (agriculture), 10 (food), 18 (printing), 20 (chemicals) and 25 (metal products), which indicates that special attention must be paid to this type of waste due to its high degree of extension in the industry. The situation for plant-tissue waste was the opposite, such that the 2-digit NACE codes associated with its generation were only agriculture (01), fishing (03) and food (10). Hence, these groups conformed much more to the type of waste.
Regarding the distribution of waste according to the recipients, the sixth most repeated EWC codes were 100118 (gas cleaning containing hazardous substances), 020499 (general sugar waste), 020103 (plant-tissue waste), 020399 (general waste from fruit, vegetables, cereals, edible oils, etc.), 100202 (unprocessed slag) and 100199 (general waste from power stations). Their ratios of number of times produced to number of recipient areas were 22/15, 16/12, 12/10, 25/11 and 18/10, respectively. These figures highlighted the scarce diversity of 100202 (unprocessed slag), which was due to the great number of cases in which this type of waste went to NACE codes 24.10 (manufacture of iron) and 23.51 (manufacture of cement).
In what concerns new uses, 122 different categories emerged when considering the 6-digit CPA code. In this case, the number of singly used raw materials was 60, which implied that almost 50% of them were unique. CPA codes like 353011 (steam and hot water), 360012 (non-drinking water) and 081213 (slags and industrial waste products for construction use) were among the most widely observed new uses, as shown in Table 7. Code 360012 (non-drinking water) contrasted with the trend whereby every category highlighted in Figure 7 kept having important representatives when taking into account 6 digits. This was favored by the characteristics of its root group (water), whose new use was non-drinking water in most cases.
The analysis of CPA codes based on the recipient areas was consistent with the aforementioned trend, since steam and hot water (353011) and non-drinking water (360012), which amounted to 53 exchanges in 25 different sectors and 32 exchanges in 17 different sectors, respectively, were primarily used by NACE 35.11 companies (production of electricity). Some materials such as 081213 (mixtures of slags and similar products) and 244530 (other non-ferrous metals) were more centralized, with most of their exchanges associated with construction companies (NACE codes 23.51 and 23.61). By contrast, CPA 201111 (hydrogen, argon, rare gases, nitrogen and oxygen) participated in 7 exchanges with 7 different NACE codes as recipients, such as refineries, coal power plants or production of gases and chemicals.

3.3. Analysis of Industrial Symbyosis (IS) Synergies

Taking into account the large amount of information contained in the refined database, the essence of some exchanges might be repeated. This would not apply to the exchanges themselves because of their belonging to different companies, but synergies could indeed be repeated. The networks in Figure 4 and Figure 7 reveal the existence of some repetitions, whereby either the same business areas are involved in exchanges or a new use is assigned to the same type of waste more than once. This circumstance suggested that simplifying the information might be beneficial to reach essential ideas and, therefore, facilitate the access to knowledge about IS opportunities based on real cases involving other companies with similar characteristics.
Therefore, those waste types with a single presence in the database participated in only one synergy, excluding any chance of repetition. The existence of repeated synergies was also discarded in those cases in which waste frequency and the number of different donor or recipient areas were the same. Regarding those waste types with more than one participation in synergies involving only one donor and recipient, repetitions were identified by checking that the CPA codes remained constant. These three steps led to a first simplification of synergies.

3.3.1. Synergies Between Donor-Recipient Areas and Waste-Recipient Areas

Those exchanges including coincidences in their NACE, EWC and CPA codes were identified as repeated synergies. To illustrate this process, Table 8. includes the most repeated synergies in the refined database. As observed throughout all the steps in the analysis, the relationships between the production of iron and steel (NACE 24.10) and the production of cement (NACE 23.51) through the connections involving EWC 100202 (steel slags) and CPA 081213 (slags to be used in construction) were very frequent.
To a lesser extent, the exchanges representing synergies between the donations of coal fly ash (EWC 100102) and steam (EWC 100118) to cement plants and oil refineries, respectively, were also remarkable. Overall, this process of simplification reduced the number of exchanges in the refined database from 496 to 435, of which 58 were incomplete because of the absence of some codes, as mentioned in previous subsections. Thus, 435 exchanges in the database were concluded to represent completely different synergies.

3.3.2. Synergies Between Waste and New Uses

An additional simplification of the database was conducted by focusing on the EWC and CPA codes. The coincidences found as a result of this process were partial, since complete repetitions also considered the business areas involves in the exchanges. However, the exclusion of partial synergies contributed to ensuring that final synergies did not contain any exchange in which the type of waste and its new use were repeated.
Unlike Table 8, the most frequent coincidences according to this procedure corresponded to EWC 100118 (steam) and CPA 353011 (steam and hot water), as demonstrated in Table 9. This was due to the specifics of steam, which was exclusively generated by power plants. However, this waste was reused by 15 different NACE areas, which used it straightforwardly as a raw material to provide heat for the production processes of companies.
The main novelty in Table 9 concerned the presence of EWC 100199 (generic waste from power and combustion plants), which was used as electric energy (CPA 353011) by recipient companies. In this case, the simplification procedure led to a further reduction of the database from 435 to 285 exchanges, among which 35 contained unknown codes. In consequence, 285 exchanges in the database were found to represent partially different synergies.

3.4. Discussion

The difficulties to replicate the emergence of IS opportunities from place to place by conducting repeated experiments highlight the need for carrying out investigations devoted to facilitate access to IS information [15]. As pointed out by Grant et al. (2010) [42], the communication of IS knowledge can be divided into explicit and tacit, such that the latter is difficult to transmit because of its know-how nature. In the same vein, Lombardi and Laybourn (2012) [43] highlighted the importance of trust, mutual learning and access to knowledge as three of the main aspects influencing the existence of IS experiences. These ideas are completely in line with the purpose and initial hypothesis of this research, since the aim was to synthetize large amounts of data in the form of previous IS exchanges to produce easy-to-understand and yet comprehensive information to support the existence of new IS opportunities.
This contrasts with the traditional approach was taken more frequently in previous studies, which consisted of analyzing particular exchanges in eco-industrial parks or limited geographical regions [44]. The results presented throughout this section demonstrate how the application of the proposed methodology enables extracting relevant information from raw data, thereby facilitating access to knowledge and, by extension, increasing trust through learning from previous and successful cases. The relevance of this tiered process has been corroborated by authors like Bansal and Mcknight (2009) [45], who put a focus on the key role played by trust and data sharing in fostering IS. In this sense, this investigation contributes to increasing these aspects through an approach that yields novel contributions to the state of the art in which it is framed, especially in what concerns the use of statistical methods to identify significant relationships between companies and materials. This line of action enables providing mathematical evidence about the reliability of some exchanges, which is helpful to establish proved references to support the creation of IS guidelines for companies [46].
The outputs of this study are not limited to its own boundaries, but can also affect existing tools [25] aimed at facilitating IS according to the geographic context of the companies involved. Therefore, depending on the type of company, these tools might provide general recommendations tailored to their corresponding business sectors using the refined information produced in this research, such as compatible donor and recipient companies, useful waste to be either donated or received, etc. Furthermore, the opportunities identified using these tools might be supported with data about how common the suggested exchanges are, as well as with their statistical significance. The implications of this research go beyond the generation of benefits for companies. The simplification of processing of raw data enables contributing to broader purposes related to IS and sustainability, since the explicitness of these results can also help boost the involvement by governing bodies as well as their close cooperation with stakeholders and the general public, thereby improving IS public acceptance [47]. The use of a common EU nomenclature to codify companies, waste and products based on its types and characteristics is also helpful in facilitating communication between the parties involved.

4. Conclusions

The improvement of resource efficiency through Industrial Symbiosis (IS) largely depends on the structure, quality and accessibility of information. However, the rapid increase in the amount of available information and the effects of this abundance are hindering the achievement of this target. Many companies willing to participate in IS initiatives rapidly lose interest in searching for new business opportunities due to the complexity of finding clear and concise information to support their industrial processes, thereby precluding potential contributions to Circular Economy.
In response to this situation, this research took the IS-Data and MAESTRI databases as references and analyzed the information associated with the 496 reported IS exchanges contained in them. This process consisted of a systematic structuring and sorting of data, followed by the correction of errors and filling of blanks, as well as the verification of the synergies included in the existing databases. The analysis of this refined database was approached from the perspectives of both the business areas involved and the materials exchanged, as well as their new uses. The main technical conclusions drawn from such an analysis are listed below:
  • There is a strong relationship between metallurgy and the production of cement, whereby slags from the manufacturing of steel are donated to be used as additives in cement.
  • Electricity production is a key sector in the IS exchange network, since it was found to receive combustion gases and provide residual energy in 59 and 45 exchanges, respectively.
  • Agriculture is an important area as a recipient, proving to exploit a variety of different waste types that can perform as fertilizers.
  • Thermal processes highlighted by their frequency and diversity, such that they related to the waste and new uses associated with the highest number of different donor and recipient areas
  • In this vein, the most frequent waste types were slags stemming from thermal processes, which were present in a total of 25 exchanges.
  • When using the 2-digit version of the EWC (European Waste Catalogue) and CPA (Classification of Products by Activity) codes, the most common raw materials were chemical products, which participated in 99 exchanges and were exploited by 23 different recipient areas.
  • A specific analysis of the CPA codes (6 digits) revealed that the most frequent new use assigned to waste was steam and hot water, which was present in 53 exchanges involving 25 different industrial sectors.
  • A synergy simplification process enabled removing 61 exchanges containing exactly the same information as others. Moreover, 150 additional exchanges involving the same waste types and new uses were also discarded, which led to a reduction of the refined database from 496 to 285 exchanges without losing essential information.
Overall, the findings of this analysis are proposed as efficient and understandable knowledge to be exploited by companies interested in participating in IS exchanges whereby they can donate or receive materials, thus obtaining financial benefits and also contributing to safeguarding the environment. Still, the usefulness of this investigation is restricted by its geographical bounds, since the cases analyzed stemmed from European-oriented databases. In addition, the outcomes achieved are also limited due to their genericity, whereby some of the cases reviewed may not completely tailor to the specifics of other exchange opportunities to be developed. Consequently, further research in formal terms should focus on automating the processing of worldwide databases as undertaken in this study through an online platform where users might search for IS opportunities without requiring any desktop program or file. Regarding technical challenges to explore in the future, a flaw was identified in what concerns the CPA code. These digits describe the new use associated with a particular waste; however, the new use does not always represent the end product, but can simply be part of it. In consequence, an improvement of this code to enable filtering the end products used by recipient companies would be very helpful in informing users about what kind of waste could work to meet their ultimate needs.

Author Contributions

Conceptualization, C.R.-P.; Methodology, C.R.-P.; Formal Analysis, D.J.-E. and C.R.-P.; Writing—original draft preparation, D.J.-E.; Writing—review and editing, D.J.-E. and C.R.-P.; Visualization, D.J.-E.; Supervision, C.R.-P.; Project Administration, C.R.-P.; Funding Acquisition, C.R.-P. All authors have read and agreed to the published version of the manuscript.

Funding

This research was funded by the Spanish Ministry of Science, Innovation and Universities, grant number DPI2017-88127-R (AEI/FEDER, UE).

Conflicts of Interest

The authors declare no conflict of interest. The funders had no role in the design of the study; in the collection, analyses, or interpretation of data; in the writing of the manuscript, or in the decision to publish the results.

References

  1. Giusti, L. A review of waste management practices and their impact on human health. Waste Manag. 2009, 29, 2227–2239. [Google Scholar] [CrossRef]
  2. Pajunen, N.; Watkins, G.; Wierink, M.; Heiskanen, K. Drivers and barriers of effective industrial material use. Miner. Eng. 2012, 29, 39–46. [Google Scholar] [CrossRef]
  3. Gravagnuolo, A.; Angrisano, M.; Girard, L.F. Circular economy strategies in eight historic port cities: Criteria and indicators towards a circular city assessment framework. Sustainability 2019, 11, 3512. [Google Scholar] [CrossRef] [Green Version]
  4. Busu, M.; Trica, C.L. Sustainability of circular economy indicators and their impact on economic growth of the European Union. Sustainability 2019, 11, 5481. [Google Scholar] [CrossRef] [Green Version]
  5. Bocken, N.M.P.; de Pauw, I.; Bakker, C.; van der Grinten, B. Product design and business model strategies for a circular economy. J. Ind. Prod. Eng. 2016, 33, 308–320. [Google Scholar] [CrossRef] [Green Version]
  6. Morales, M.E.; Diemer, A. Industrial symbiosis dynamics, a strategy to accomplish complex analysis: The Dunkirk case study. Sustainability 2019, 11, 1971. [Google Scholar] [CrossRef] [Green Version]
  7. Diddi, S.; Yan, R.N. Consumer perceptions related to clothing repair and community mending events: A circular economy perspective. Sustainability 2019, 11, 5306. [Google Scholar] [CrossRef] [Green Version]
  8. Golev, A.; Corder, G.D.; Giurco, D.P. Barriers to Industrial Symbiosis: Insights from the Use of a Maturity Grid. J. Ind. Ecol. 2015, 19, 141–153. [Google Scholar] [CrossRef]
  9. Álvarez, R.; Ruiz-Puente, C. Development of the tool SymbioSyS to support the transition towards a circular economy based on industrial symbiosis strategies. Waste Biomass Valoris. 2017, 8, 1521–1530. [Google Scholar] [CrossRef]
  10. Bacudio, L.R.; Benjamin, M.F.D.; Eusebio, R.C.P.; Holaysan, S.A.K.; Promentilla, M.A.B.; Yu, K.D.S.; Aviso, K.B. Analyzing barriers to implementing industrial symbiosis networks using DEMATEL. Sustain. Prod. Consum. 2016, 7, 57–65. [Google Scholar] [CrossRef]
  11. Pinfield, S.; Salter, J.; Bath, P.A.; Hubbard, B.; Millington, P.; Anders, J.H.S.; Hussain, A. Open-access repositories worldwide, 2005–2012: Past growth, current characteristics, and future possibilities. J. Assoc. Inf. Sci. Technol. 2014, 65, 2404–2421. [Google Scholar] [CrossRef]
  12. Yu, C.; Davis, C.; Dijkema, G.P.J. Understanding the evolution of industrial symbiosis research: A bibliometric and network analysis (1997–2012). J. Ind. Ecol. 2014, 18, 280–293. [Google Scholar] [CrossRef]
  13. Trokanas, N.; Cecelja, F.; Raafat, T. Semantic input/output matching for waste processing in industrial symbiosis. Comput. Chem. Eng. 2014, 66, 259–268. [Google Scholar] [CrossRef] [Green Version]
  14. Lignos, G.; Stancari, S.; Bikos, S.; Kokossis, A. Structural and economic analysis of Industrial Symbiosis networks: A hybrid approach to assess investment opportunities. In Computer Aided Chemical Engineering; Elsevier B.V.: Amsterdam, The Netherlands, 2016; Volume 38, pp. 1617–1622. ISBN 9780444634283. [Google Scholar]
  15. Zheng, K.; Jia, S. Promoting the opportunity identification of industrial symbiosis: Agent-based modeling inspired by innovation diffusion theory. Sustainability 2017, 9, 765. [Google Scholar] [CrossRef] [Green Version]
  16. Yazdanpanah, V.; Yazan, D.M.; Zijm, W.H.M. FISOF: A formal industrial symbiosis opportunity filtering method. Eng. Appl. Artif. Intell. 2019, 81, 247–259. [Google Scholar] [CrossRef]
  17. Shi, X.; Li, X. A symbiosis-based life cycle management approach for sustainable resource flows of industrial ecosystem. J. Clean. Prod. 2019, 226, 324–335. [Google Scholar] [CrossRef]
  18. Cervo, H.; Ferrasse, J.H.; Descales, B.; Van Eetvelde, G. Blueprint: A methodology facilitating data exchanges to enhance the detection of industrial symbiosis opportunities—Application to a refinery. Chem. Eng. Sci. 2020, 211. [Google Scholar] [CrossRef]
  19. Puente, M.C.R.; Arozamena, E.R.; Evans, S. Industrial symbiosis opportunities for small and medium sized enterprises: Preliminary study in the Besaya Region (Cantabria, Northern Spain). J. Clean. Prod. 2015, 87, 357–374. [Google Scholar] [CrossRef]
  20. Low, J.S.C.; Tjandra, T.B.; Yunus, F.; Chung, S.Y.; Tan, D.Z.L.; Raabe, B.; Ting, N.Y.; Yeo, Z.; Bressan, S.; Ramakrishna, S.; et al. A collaboration platform for enabling industrial symbiosis: Application of the database engine for waste-to-resource matching. Proc. CIRP 2018, 69, 849–854. [Google Scholar] [CrossRef]
  21. Domenech, T.; Bleischwitz, R.; Doranova, A.; Panayotopoulos, D.; Roman, L. Mapping industrial symbiosis development in Europe—Typologies of networks, characteristics, performance and contribution to the Circular Economy. Resour. Conserv. Recycl. 2019, 141, 76–98. [Google Scholar] [CrossRef]
  22. Neves, A.; Godina, R.; Azevedo, G.S.; Matias, C.O.J. Current status, emerging challenges, and future prospects of industrial symbiosis in Portugal. Sustainability 2019, 11, 5497. [Google Scholar] [CrossRef] [Green Version]
  23. Kosmol, L. Sharing is caring—Information and knowledge in industrial symbiosis: A systematic review. In Proceedings of the 2019 IEEE 21st Conference on Business Informatics (CBI), Moscow, Russia, 15–17 July 2019; pp. 21–30. [Google Scholar]
  24. Yeo, Z.; Masi, D.; Low, J.S.C.; Ng, Y.T.; Tan, P.S.; Barnes, S. Tools for promoting industrial symbiosis: A systematic review. J. Ind. Ecol. 2019, 23, 1087–1108. [Google Scholar] [CrossRef] [Green Version]
  25. Maqbool, A.S.; Alva, F.M.; Van Eetvelde, G. An assessment of European information technology tools to support industrial symbiosis. Sustainability 2018, 11, 131. [Google Scholar] [CrossRef] [Green Version]
  26. CIRCULATOR. Find a Circular Business Model that Fits. Available online: http://www.circulator.eu/ (accessed on 23 December 2019).
  27. IS DATA. Industrial Symbiosis Data Repository. Available online: http://isdata.org/ (accessed on 23 December 2019).
  28. MAESTRI Project. MAESTRI—A H2020-Project under the SPIRE-PPP Initiative. Available online: https://maestri-spire.eu/ (accessed on 23 December 2019).
  29. International Synergies. SYNERGie® 4.0. Available online: https://www.international-synergies.com/what-we-do/synergie40/ (accessed on 23 December 2019).
  30. Anderson, W.B.; Parkpian, P. Plant availability of an iron waste product utilized as an agricultural fertilizer on calcareous soil. J. Plant Nutr. 1984, 7, 223–233. [Google Scholar] [CrossRef]
  31. Ramos, C.G.; Querol, X.; Dalmora, A.C.; de Jesus Pires, K.C.; Schneider, I.A.H.; Silva, L.F.O.; Kautzmann, R.M. Evaluation of the potential of volcanic rock waste from southern Brazil as a natural soil fertilizer. J. Clean. Prod. 2017, 142, 2700–2706. [Google Scholar] [CrossRef]
  32. Kasongo, R.K.; Verdoodt, A.; Kanyankagote, P.; Baert, G.; Ranst, E. Van Coffee waste as an alternative fertilizer with soil improving properties for sandy soils in humid tropical environments. Soil Use Manag. 2011, 27, 94–102. [Google Scholar] [CrossRef]
  33. Moldes, A.B.; Vázquez, M.; Domínguez, J.M.; Díaz-Fierros, F.; Barral, M.T. Evaluation of mesophilic biodegraded grape marc as soil fertilizer. Appl. Biochem. Biotechnol. 2007, 141, 27–36. [Google Scholar] [CrossRef]
  34. Illera-Vives, M.; Seoane Labandeira, S.; Brito, L.M.; López-Fabal, A.; López-Mosquera, M.E. Evaluation of compost from seaweed and fish waste as a fertilizer for horticultural use. Sci. Hortic. 2015, 186, 101–107. [Google Scholar] [CrossRef]
  35. Rattner, A.S.; Garimella, S. Energy harvesting, reuse and upgrade to reduce primary energy usage in the USA. Energy 2011, 36, 6172–6183. [Google Scholar] [CrossRef]
  36. Moura, W.A.; Gonçalves, J.P.; Lima, M.B.L. Copper slag waste as a supplementary cementing material to concrete. J. Mater. Sci. 2007, 42, 2226–2230. [Google Scholar] [CrossRef]
  37. Alp, I.; Deveci, H.; Süngün, H. Utilization of flotation wastes of copper slag as raw material in cement production. J. Hazard. Mater. 2008, 159, 390–395. [Google Scholar] [CrossRef]
  38. Rai, A.; Prabakar, J.; Raju, C.B.; Morchalle, R.K. Metallurgical slag as a component in blended cement. Constr. Build. Mater. 2002, 16, 489–494. [Google Scholar] [CrossRef]
  39. Shi, C.; Meyer, C.; Behnood, A. Utilization of copper slag in cement and concrete. Resour. Conserv. Recycl. 2008, 52, 1115–1120. [Google Scholar] [CrossRef]
  40. Lin, K.L.; Wang, K.S.; Tzeng, B.Y.; Lin, C.Y. The reuse of municipal solid waste incinerator fly ash slag as a cement substitute. Resour. Conserv. Recycl. 2003, 39, 315–324. [Google Scholar] [CrossRef]
  41. Pomponi, F.; Moncaster, A. Circular economy for the built environment: A research framework. J. Clean. Prod. 2017, 143, 710–718. [Google Scholar] [CrossRef] [Green Version]
  42. Grant, G.B.; Seager, T.P.; Massard, G.; Nies, L. Information and communication technology for industrial symbiosis. J. Ind. Ecol. 2010, 14, 740–753. [Google Scholar] [CrossRef]
  43. Lombardi, D.R.; Laybourn, P. Redefining industrial symbiosis: Crossing academic-practitioner boundaries. J. Ind. Ecol. 2012, 16, 28–37. [Google Scholar] [CrossRef]
  44. Paquin, R.L.; Busch, T.; Tilleman, S.G. Creating economic and environmental value through industrial symbiosis. Long Range Plann. 2015, 48, 95–107. [Google Scholar] [CrossRef]
  45. Bansal, P.; Mcknight, B. Looking forward, pushing back and peering sideways: Analyzing the sustainability of industrial symbiosis. J. Supply Chain Manag. 2009, 45, 26–37. [Google Scholar] [CrossRef]
  46. Madsen, J.K.; Boisen, N.; Nielsen, L.U.; Tackmann, L.H. Industrial symbiosis exchanges: Developing a guideline to companies. Waste Biomass Valoris. 2015, 6, 855–864. [Google Scholar] [CrossRef]
  47. Horváth, G.Á.; Harazin, P. A framework for an industrial ecological decision support system to foster partnerships between businesses and governments for sustainable development. J. Clean. Prod. 2016, 114, 214–223. [Google Scholar] [CrossRef]
Figure 1. Sequential approach of the methodology proposed for processing and analyzing existing Industrial Symbiosis (IS) databases.
Sustainability 12 00952 g001
Figure 2. Workflow process used to carry out the verification of synergies.
Sustainability 12 00952 g002
Figure 3. Relationships between donor and recipient NACE codes (1 digit) in the form of an asymmetric row plot (row—principal coordinates and column—standardized coordinates).
Sustainability 12 00952 g003
Figure 4. Network diagram of the frequency and intensity of the links between donor and recipient NACE codes (2 digits).
Sustainability 12 00952 g004
Figure 5. (a) Number of different recipient areas per donor NACE code (2 digits) (b) Number of different donor areas per recipient NACE code (2 digits).
Sustainability 12 00952 g005
Figure 6. Relationships between donor and recipient EWC and CPA codes (2 digits) in the form of an asymmetric row plot (row principal coordinates and column standardized coordinates).
Sustainability 12 00952 g006
Figure 7. Network diagram of the frequency and intensity of the links between EWC and CPA codes (2 digits).
Sustainability 12 00952 g007
Figure 8. (a) Number of different donors/recipient areas per EWC code (2 digits) (b) Number of different recipient areas per CPA code (2 digits).
Sustainability 12 00952 g008
Table 1. Structure and fields included in the MAESTRI database. NACE: Nomenclature of Economic Activities; CPA: Classification of Products by Activity; EWC: European Waste Catalogue; CAS: Chemical Abstracts Service.
HeaderFields
Exchange identificationIdentifier
Companies involvedDonor: Name/Business/NACE
Recipient: Name/Business/NACE
Exchange descriptionEntrance: Waste description/EWC/CPA/CAS/Hazardous
Treatment: Owner/Description/Company/Business/NACE
Exchange detailsEnd of use of waste/Availability of exchanged materials/Payment
Exchange statusUnder study/Planned/Implemented
Table 2. Summary of the refined database produced after processing the MAESTRI and IS-Data records.
DonorWasteRecipient
Main BusinessNACE CodeWaste DescriptionEWC CodeCPA CodeCPA DescriptionWaste End UseNACE CodeMain Business
Agriculture01.10Wood and paperboard15010302.20.10Raw woodRaw materials16.29Production of pellets and plywood panels
Oil extraction06.10Biomass fuel05019938.11.39Other non-recyclable non-hazardous wasteFuel10.83Production of coffee and milk drinks
Food10.00Various food waste02010210.41.00Oils and fatsOils and fats with 30% triglycerides19.20Refinery
Validated synergies Corrected errors Maestri cases Blanks filled IS-Data cases
Table 3. Statistically significant Phi correlation coefficients between donor and recipient NACE codes (2 digits).
Donor NACERecipient NACE (Correlation Coefficient)
0103 (0.149); 15 (0.219); 16 (0.096); 38 (0.110)
0301 (0.173); 03 (0.143); 32 (0.173); 42 (0.088)
0523 (0.128)
0609 (0.351); 10 (0.132)
0810 (0.214)
0901 (0.100); 24 (0.103)
1001 (0.128); 10 (0.183); 11 (0.174); 38 (0.124)
1110 (0.091); 11 (0.097); 16 (0.126); 46 (0.274); 82 (0.313)
1332 (0.631)
1606 (0.229); 16 (0.196); 37 (0.284)
1720 (0.101); 39 (0.191); 52 (0.098)
1838 (0.145)
1920 (0.100*); 35 (0.123); 82 (0.089); 84 (0.177)
2020 (0.154); 25 (0.178); 35 (0.108)
2103 (0.120)
2222 (0.217)
2318 (0.239); 41 (0.107)
2407 (0.161); 23 (0.225); 30 (0.114); 42 (0.102); 93 (0.114)
2522 (0.174); 38 (0.113); 43 (0.405)
2626 (0.894)
2722 (0.174); 27 (0.329)
2824 (0.146); 38 (0.205)
2922 (0.217)
3101 (0.154)
3220 (0.095)
3519 (0.169)
3601 (0.154)
3738 (0.113)
3816 (0.116); 21 (0.290); 37 (0.175); 42 (0.175)
3917 (0.209)
4242 (0.175); 43 (0.498)
4328 (0.405); 38 (0.113); 42 (0.138)
4731 (1.000)
4942 (0.255)
5619 (0.094); 38 (0.242)
8232 (0.445)
9632 (0.445)
Table 4. Ranking of business areas according to their total and interarea frequency as donors and recipients.
NACE CodeAs a DonorAs a Recipient
FrequencyInterarea FrequencyFrequencyInterarea Frequency
35.1159244517
24.104215206
19.2030132713
10.81211411
17.1113844
20.1213775
20.13125157
24.4212865
20.11117117
38.211191817
10.3210811
06.108833
23.51873811
20.15952716
20.14551710
23.61101127
01.1311116
01.501255
01.101688
35.2144108
Table 5. Statistically significant Phi correlation coefficients between EWC and CPA codes (2 digits).
EWCCPA (Correlation Coefficient)
0105 (0.422); 06 (0.415); 08 (0.117)
0201 (0.172); 03 (0.125); 08 (−0.105); 10 (0.608); 35 (−0.177); 38 (−0.166)
0302 (0.222); 16 (0.267); 17 (0.094)
0438 (0.203)
0506 (0.240); 36 (0.124)
0620 (0.372); 36 (0.130); 38 (−0.104)
0820 (0.090)
1008 (0.229); 20 (−0.175); 24 (0.241); 35 (0.400); 38 (−0.167)
1238 (0.142)
1306 (0.244); 19 (0.197)
1428 (0.706)
1502 (0.183); 13 (0.360); 17 (0.138); 38 (0.178)
1619 (0.327); 26 (0.168); 27 (0.168); 35 (−0.092); 38 (0.090)
1708 (0.118); 23 (0.120); 30 (0.376)
1911 (0.168); 16 (0.172); 20 (0.109)
2010 (0.096); 38 (0.379)
Table 6. Most frequent waste types according to their corresponding number of donors, recipients and new uses.
EWC CodeFrequencyNo. of Donors (4 digits/2 digits)No. of Recipients (4 digits/2 digits)New Uses
100202251/111/62
100118221/115/112
100199182/210/92
020103179/311/76
020499161/112/67
050199132/27/77
100102134/47/52
020399123/210/76
030399113/19/67
06100263/25/24
Table 7. Most frequent new uses according to their corresponding number recipients.
CPA CodeFrequencyNo. of Recipients (4 Digits)
3530115325
0812133613
3600123217
2015802511
3511102213
3832331911
244530189
2011121711
103930148
20121987
Table 8. Most frequent synergies identified in the simplification process of complete repetitions.
Donor NACEEWC CodeCPA CodeRecipient NACENo. of Repetitions
24.1010020208121323.519
35.1110010224453023.514
35.1110011835301119.204
24.1010020208121342.114
Table 9. Most frequent synergies identified in the simplification process of partial repetitions.
EWC CodeCPA CodeNo. of Repetitions
10011835301115
10020208121311
10019935111010
1001022445308

