Article

A Procedure to Support Systematic Selection of Leading Indicators for Sustainability Performance Measurement of Circular Economy Initiatives

by
Mariia Kravchenko
*,
Daniela C. A. Pigosso
and
Tim C. McAloone
Department of Mechanical Engineering, Technical University of Denmark (DTU), Nils Koppels Allé 404, 2800 Kgs Lyngby, Denmark
*
Author to whom correspondence should be addressed.
Sustainability 2020, 12(3), 951; https://doi.org/10.3390/su12030951
Submission received: 8 January 2020 / Revised: 19 January 2020 / Accepted: 22 January 2020 / Published: 28 January 2020

Abstract

:
Circular economy (CE) is considered a vital model to tackle resource scarcity and reduce waste by promoting strategies that redefine production and consumption systems. Industrial actors integrate CE principles in their strategic and operational practices to overcome these challenges, simultaneously aiming at enhancing their sustainability performance. Despite numerous frameworks to guide organizations in innovating towards CE, very few have embedded explicit sustainability considerations to assist practitioners in understanding the potential sustainability performance of the CE initiatives early in the development process. To assist a structured process of measuring sustainability performance, the main goal of this paper is to propose a procedure for a systematic selection of suitable leading performance indicators to support an informed sustainability-oriented decision-making process. To fulfill this aim, a hypothetical-deductive approach has been followed to, firstly, develop the selection procedure, and secondly, evaluate and improve it using a case study approach. The findings reveal that the procedure enables a systematic selection of relevant indicators by taking into account the manifold combinations of CE strategies and business processes, characteristics of the company and its sustainability objective. Different from many other approaches, the novelty lies in relying on a dynamic, as opposed to ‘prescriptive’, indicator selection process to induce learning about sustainability considerations significant for a particular CE initiative and corporate context.

1. Introduction

A challenging and fast-changing global market pushes companies to become proactive by exploring and exploiting new mechanisms to enhance their competitive advantage. Competitive advantage is rooted in a company’s capability to manage tangible and intangible resources [1], constantly responding to global demands and issues, including natural resource constraints, pollution and fair wealth distribution. It is no longer a question of whether the pursuit of an economic activity ought to be done sustainably, rather it is a process of exploring (what), planning (where) and implementing (how) various sustainability strategies. Along the process, manufacturing companies in Europe have shown a significant improvement in reducing their environmental impact per economic output generated [2], however, the challenge is still great, with respect to minimizing the impact, when taking into account upstream (e.g., supply of resources) and downstream activities (e.g., end of life processes). One promising approach to overcome these challenges is seen in a new economic model, circular economy (CE), which implies a radical innovation of production and consumption systems with the goal of decoupling resource consumption from value creation [3]. For the European manufacturing industry, which spends an average of 40% of its costs on raw materials and about 15% on energy and water [4], adopting CE practices focused on resource productivity can positively impact economic and environmental performance. Furthermore, CE entails strategic transformation, by means of which the industries will be able to create new revenue streams and retain the value embedded in their products and assets for longer [5].
Different conceptual and practical frameworks have been proposed to guide companies on how to embed CE principles, often called CE strategies, into their business context [6], with the emphasis on the simultaneous transformation of strategic and operational practices. Acknowledging the complexity of such transformation, numerous studies have developed tools to support business model innovation for CE [7,8], product design for CE [9,10], value chain design and mapping [11,12]. Due to the inherent focus of CE on combining business logic with environmental performance (i.e., reduced burden), many studies refer to CE as one of the most important strategies to achieve sustainable development: [10,13] state that circularity in business models, products and supply chains is a “precondition for sustainable manufacturing and sustainable economy”. Nonetheless, to ensure a CE solution can contribute positively to sustainability, it needs to be planned with sustainability considerations and intentions in mind [14] and assessed on its sustainability performance prior, during and after implementation [15]. So far, studies have concentrated on proposing methods to assess CE performance at a corporate level [16,17], at a product level [18,19] or at a material level [20]. However, due to the intrinsic focus of CE on value and material preservation [21], most of the proposed methods focus on measuring material consumption [22], with recycling being the most dominant CE strategy considered [23]. Additionally, the challenge lies in measuring the social dimension, which remains largely uncovered by the proposed indicators and methodologies [21,23]. To address these limitations, [24] have attempted to understand whether existing leading sustainability-related manufacturing indicators can be employed to measure a wide range of CE strategies from a social, economic and environmental perspective. By being able to retrieve more than 270 indicators and categorize them according to CE strategies ranging from dematerialized and function-oriented strategies through recycling and recovery, the findings revealed that each strategy can be measured by a set of indicators that cover each TBL (triple bottom line) dimension. However, to ensure a meaningful set of indicators is applied anytime a specific CE initiative is being developed, support should be developed. Research on sustainability assessment and indicators [25,26] highlights the importance of a dynamic information selection processes as opposed to ‘prescriptive’ approaches, because, firstly, every project will have different sustainability concerns [25], and, secondly, decision makers will be able to make more informed decisions if they use information they have critically analyzed and prioritized.
The main goal of this paper is, therefore, to advance the assessment of CE by deploying leading sustainability performance indicators. This is done by proposing a step-by-step procedure to support a systematic selection of suitable sustainability-related performance indicators for CE initiative screening. The selected indicators are intended to help in measuring the potential performance of a CE solution in the early stages of its development, thus enabling identification of major areas to introduce improvements to before the implementation. A new approach to procedure development takes into account the complexity of multiple sustainability criteria to be considered whenever a new CE solution is proposed by bringing together elements of different TBL dimensions, thirteen CE strategies, and five business processes. Furthermore, the approach considers specifics of the company (its sector, processes, products, and services) to ensure the assessment process is meaningful for the decision context. Thus, this study contributes to the field of indicator-based sustainability assessment considering the innovative lens of CE, by taking into account the needs and roles of industrial practitioners in the CE transition process.
The paper is structured as follows: Section 2 explains the research method and materials, served to underpin the development of the procedure, Section 3 describes the developed procedure with detailed step-by-step elaborations, Section 4 describes the application of the procedure in the selected companies, Section 5 provides discussions about key findings and contribution of the study, highlighting limitations and considerations for future research.

2. Research Methods

The research method adopted for this study can be described in two parts. Firstly, the research approach, including method and materials employed are detailed, before, secondly, providing an overview of the leading indicator database—previously compiled to assist selection of significant sustainability aspects and corresponding indicators—plus a summary of key recommendations that served as underpinnings for the development of the procedure to be followed, when selecting leading sustainability performance indicators.

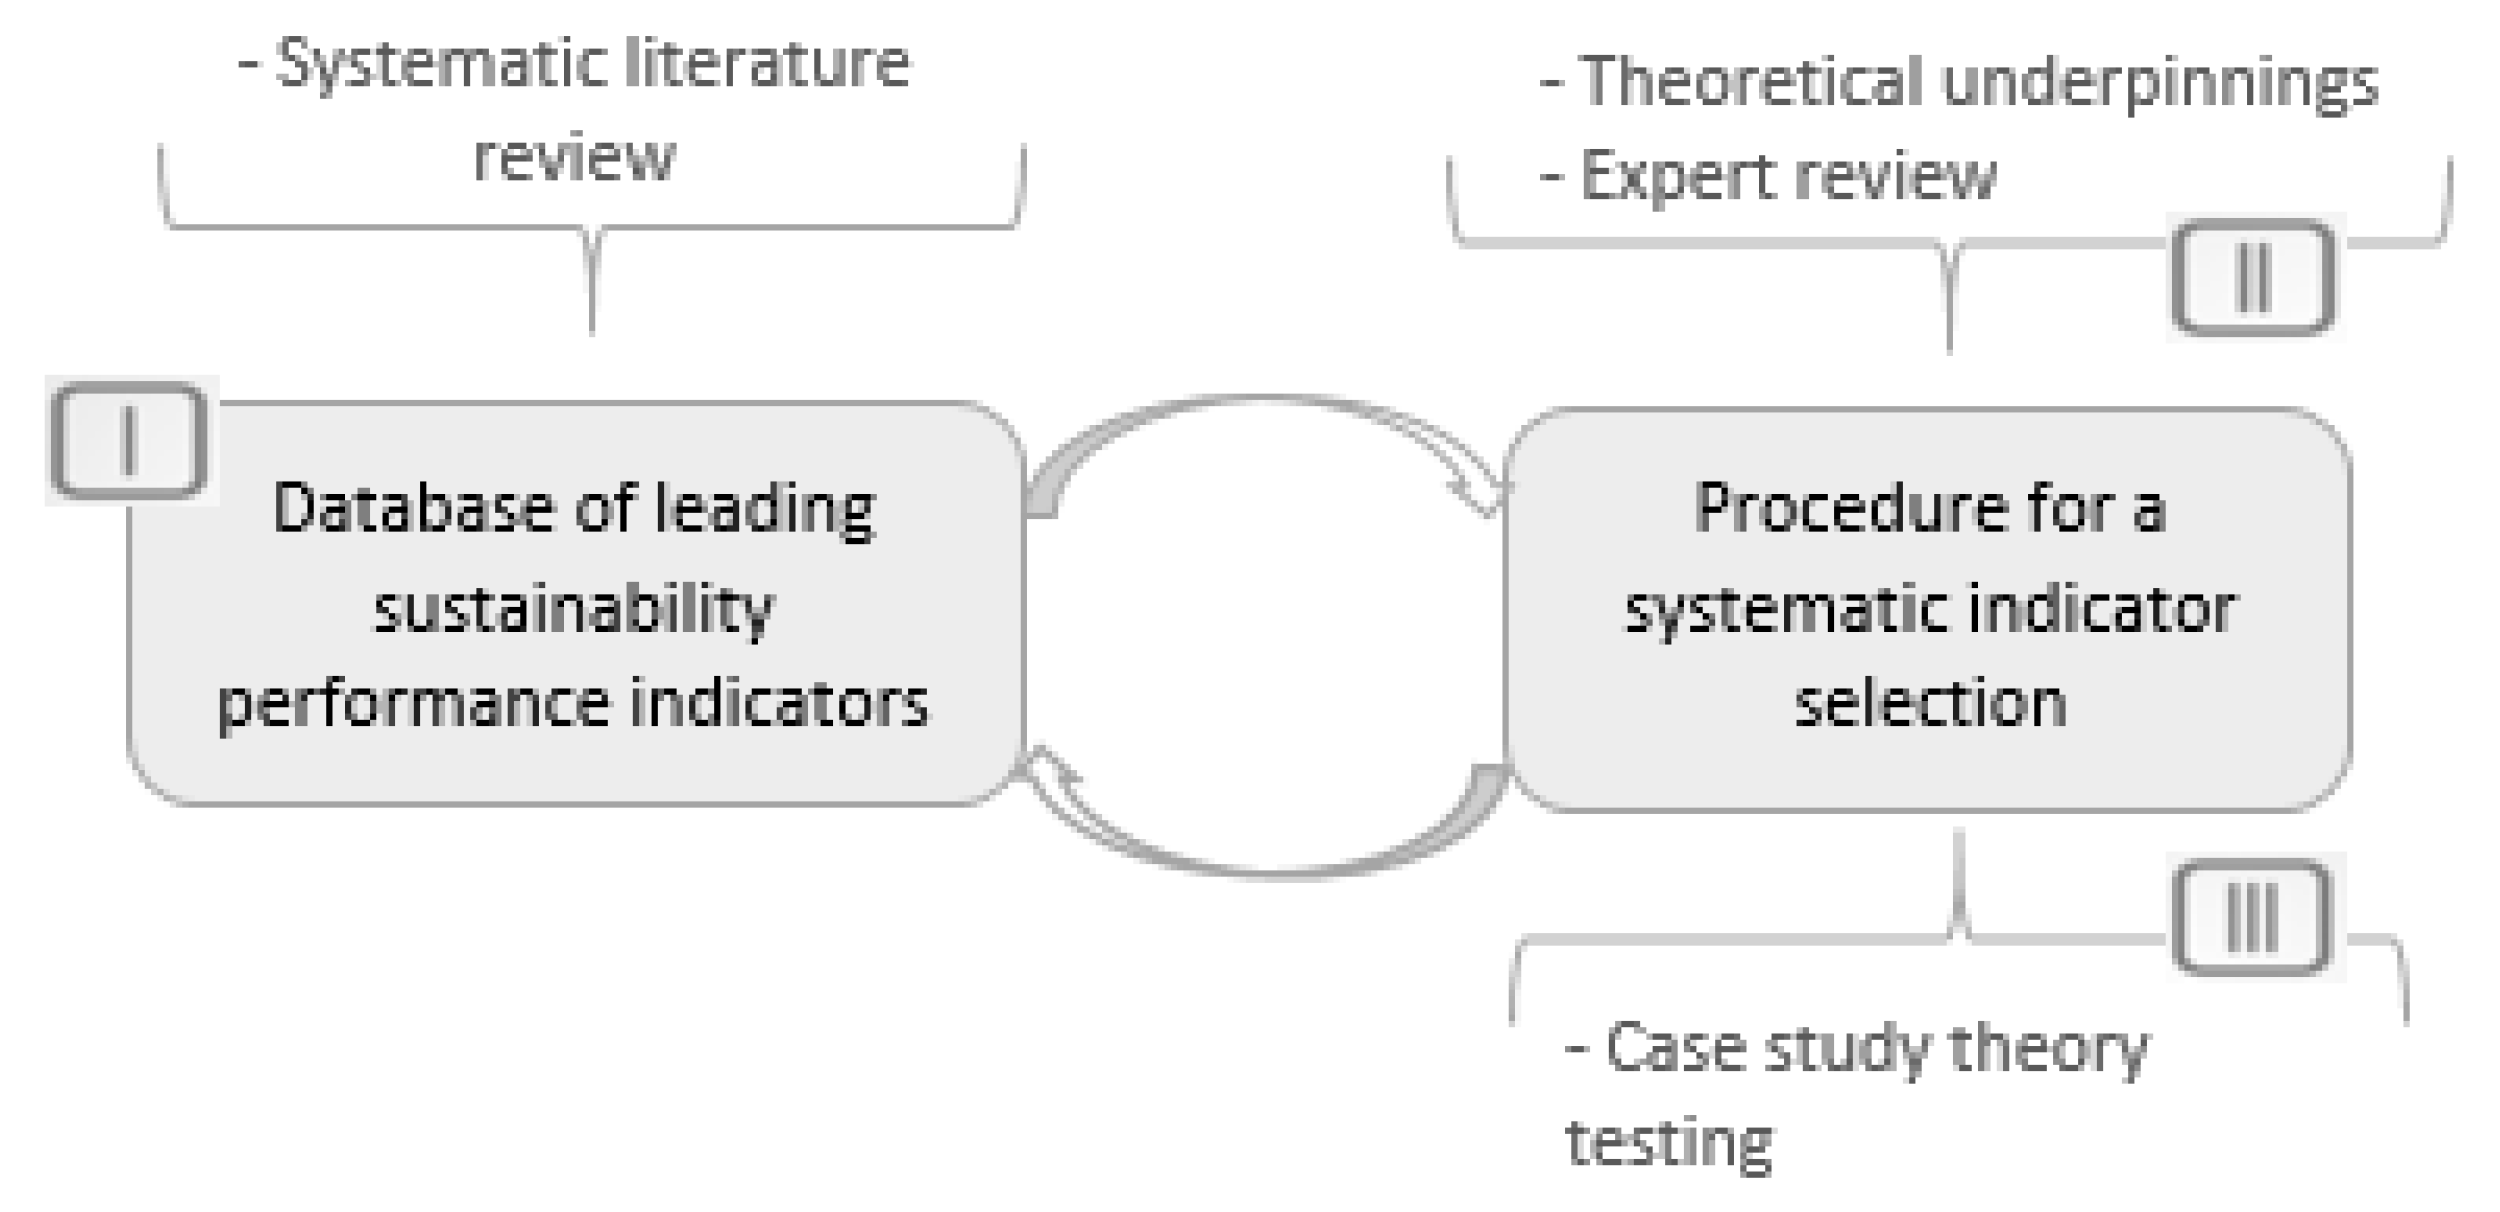
2.1. Research Approach

A hypothetical-deductive approach [27] was followed to develop and evaluate the procedure based on a number of iterations that included a mix of research methods. This approach is used to construct an inquiry-based on existing theories and knowledge (Section 2.2.), proceeding by formulating a hypothesis that is then tested to explore the consequences of the generated inquiry [28]. The theory in this study is the procedure for indicator selection, and the hypothesis to be tested is that “the classification of sustainability-related leading performance indicators according to CE strategies, business processes and TBL aspects and the corresponding procedure can support manufacturing companies in the selection of suitable sustainability indicators for CE initiative assessment”. The sustainability assessment of CE is based on an indicator approach with the foundation on the consolidated database of leading performance indicators, as a deliverable of the research Stage I, published in [24] (Figure 1). The development process, followed to create the procedure, Stage II, was initiated, firstly, by consulting the literature to identify the requirements for the indicator selection approach in the context of sustainability assessment, considering CE and business process perspectives, followed by the development of a procedure ‘prototype’ that was tested with experts and led to the conceptualization of the step-by-step procedure (presented in Section 3), which was tested with the help of case studies and iteratively improved, Stage III (presented in Section 4).

2.1.1. Case Study for Theory Testing

A multiple case study approach has been selected to test the usefulness of the procedure in guiding the selection of suitable indicators. The main objective of the approach was to continuously identify improvement opportunities following the feedback after each application (iterative approach). The final version of the procedure is described in Section 3. The improvement opportunities after the case study application are summarized in Table 2 Section 4.1.
To ensure the case study confirmability, transferability and credibility, the methodology provided by [29,30] has been followed. A case study protocol was developed, documenting the case study design and execution (e.g., criteria for case selection, data sources, data collection methods and period, data analysis).

2.1.2. Case Study Set-Up: Case Selection, Data Collection and Analysis

To qualify as suitable case study candidates, the companies had to satisfy the two main criteria: (i) the company’s core activity is to design, develop and/or manufacture capital and/or consumer goods (i.e., belong to the secondary industry), and (ii) the company has identified one or several CE solutions to be implemented. Finally, the case selection was guided by initial contacts, which ensured the company expressed an interest in understanding the sustainability implications of the selected CE initiatives. As a result, our empirical investigation involved three Nordic manufacturing companies.
Each case study involved identical activities and similar types of data collection. The number of participants differed across cases (mainly due to company size), ranging from 2 to 6. The goal was to form a multidisciplinary team, which included participants who had expertise in the area affected by the selected CE solution (e.g., product designers participated whenever the CE solution concerned product design with circular materials) as well as those who had expertise in working with sustainability-related issues, e.g., environmental managers or sustainability ‘steward’ from the company. Data collection was initiated by using primary and secondary sources, which allowed for triangulation to elicit verification of the theory and the hypothesis [31]. Secondary data were collected by doing desk research to gain insights about the companies and their activities before meetings. Secondary data included companies’ websites, reports, and other publicly available information. Primary data were collected during face-to-face interactions during online meetings and on-site visits, designed as participatory workshops, which focused on applying the selection procedure and recording feedback, as described in detail below.
Participatory workshops were conducted in three steps: (1) initial exploration session for defining the scope for indicator selection (3-h session), (2) Workshop A on indicator selection (6-h session), (3) Workshop B on indicator application and interpretation (6-h session) (Figure A1, Appendix A). The purpose of the initial exploration session was to establish a solid ground for prospective workshops by: (i) aligning CE understanding between participants and researchers, thus ensuring the internal validity of the study [32], and (ii) defining the scope for indicator selection, i.e., elaborating on a prioritized CE initiative by exploring what CE strategies it involves and what business processes it affects. Workshop A aimed to test the procedure for indicator selection, by (i) allowing researchers to demonstrate the step-by-step indicator selection procedure, (ii) creating a room for a dialog about CE and its particularities in the specific corporate context, and (iii) assisting the participants in applying the procedure to select suitable indicators for the defined scope. Accordingly, the researchers benefitted from the participants with different competencies by getting an in-depth understanding of the organizational processes and decision context, as the discussions were held around “what are the concerns of … where do we need the most help … what is under our control …”. The real-life context, despite limiting the researcher’s level of control [33], allows us to frame the picture about beliefs, assumptions and expectations of individuals and company, thus achieving an understanding of the influencing factors on the premises of the study and results [32]. Workshop B focused on: (i) discussion about particularities of data collection and indicator application, and (ii) collection of feedback (provided in Table A1 in Appendix C). All observations and dialogues were recorded in a written form after each interaction. The notes were later sent to the participants for data cross-checking and information accuracy. As a result of empirical investigation, the procedure has been iteratively revised to incorporate the feedback to account for the needs of industrial practitioners.

2.2. Conceptual Framing

2.2.1. Leading Performance Indicator Database

A ‘Leading indicator database’, consolidated as a part of the research Stage I (Figure 1), served as a foundation for developing a procedure for the systematic identification and selection of relevant indicators to measure the sustainability performance of CE solutions. The database contains 270+ leading indicators classified according to CE strategies, business processes, and TBL dimensions and aspects (Figure 2, part (a)), which allows identifying suitable indicators available for various CE initiatives, i.e., the perspective which is required to develop a particular CE initiative (e.g., product design for repair, business model development to offer performance delivery), made up of different combinations of circular strategies and business processes (as shown in Figure 2, part (b)). Relying on leading performance indicators for sustainability measurements is advantageous because leading indicators can be used to ‘lead’ planning and monitoring of proposed actions by providing measurable and understandable information to the planners. Leading performance indicators provide early guidance about potential sustainability performance and warning about areas of concern, thus giving the possibility for companies to adjust and improve the initiative prior to its implementation to prevent any undesired impact [34,35]. The database acts as a medium to store indicators in an organized way, as well as provides clarification for each indicator in terms of its importance, plus a formula to help calculations. An in-depth review of the retrieved indicators and their classification is provided in the study by [24], with the database available in Excel format at the permalink web-address. Figure 2 shows the abstract representation of the database, with the classification criteria (a), and the logic of locating an initial set of suitable TBL indicators (Ni) (b), which works by selecting a CE strategy/ies and a business process, a specific CE initiative involves.

2.2.2. Procedure Development in the Context of Sustainability Assessment

A core consideration for the procedure was to ensure that it can facilitate a structured, yet dynamic and balanced identification of relevant sustainability indicators that can be meaningfully interpreted by the target users (e.g., industrial practitioners). The recommendations for such a process, therefore, were extracted from traditional works on indicator-based sustainability assessment. Contributions by [36,37] were used to construct the procedure to ensure it encourages learning and reflective analysis. To complement the procedure, guiding questions have been developed to assist the process of selection of individual indicators (similar to [38]) as well as indicator sets, as suggested by [26]. The recommendations of manageable indicator numbers have been adopted from [39,40]. These theoretical underpinnings contributed to understanding how to develop a procedure for meaningful indicator selection that facilitates organizational learning and ensures effective and ‘rational’ information use to support the development and improvement of CE initiatives in their early development stages.
Following the theoretical groundworks, the selection procedure ‘prototype’ was developed considering key recommendations (Table 1).
Subsequently, the ‘prototype’ was validated by several CE and sustainability experts with 10+ years of experience in both academia and industry and then tested internally with peers from the research group. Internal validations aimed at providing additional recommendations to the procedure, prior to its application in a case-study setting.
Based on the consolidated recommendations, the prototype of the indicator selection procedure was developed, incorporating three steps: (i) identifying the scope by elaborating on a prioritized CE initiative to understand what CE strategies are considered and what business processes are affected, (ii) deploying the leading indicator database to locate the initial set of indicators, using a set of guiding questions to select the most relevant ones, and (iii) customizing and creating new indicators using a set of guiding questions. These steps were later elaborated on in the final version of the procedure presented below in Section 3, Figure 3.

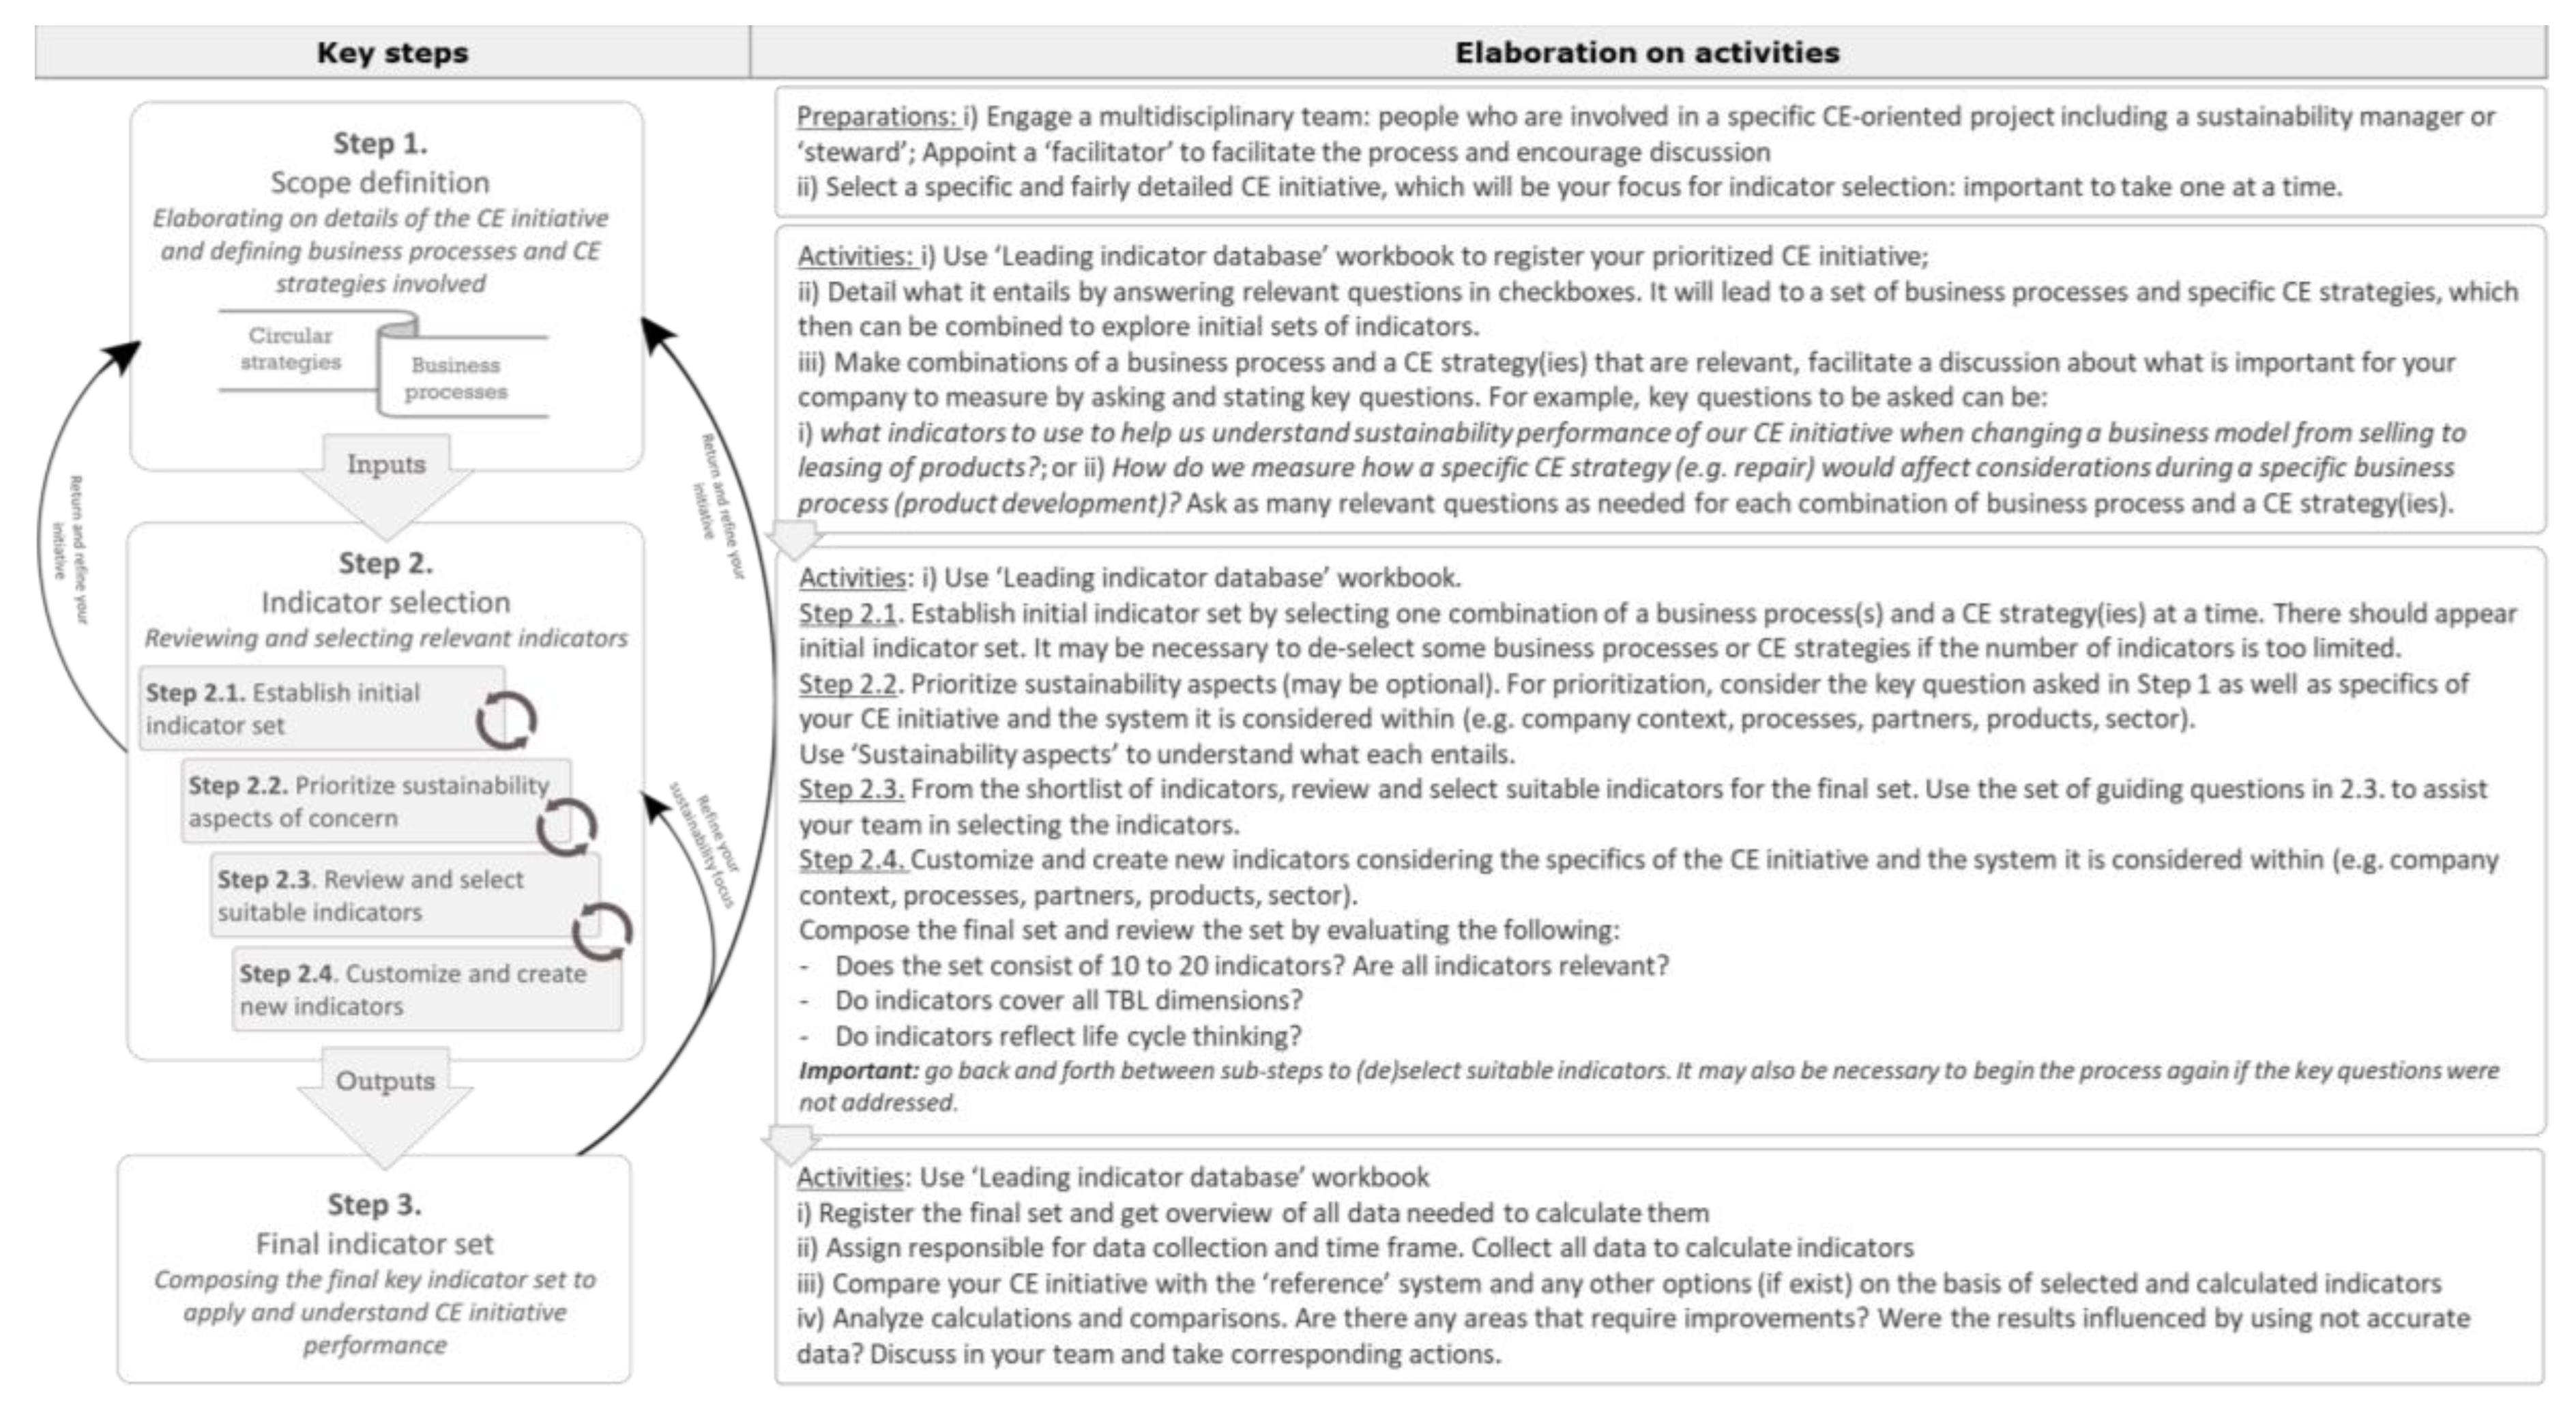
3. Results: A Step-by-Step Procedure for A Systematic Indicator Selection

This section presents the final version of the procedure developed to support a systematic selection of leading performance indicators for CE initiative assessment. The final version of the procedure is shown in Figure 3 and comprises several steps identified through theoretical and empirical investigation. The procedure is intended to support sustainability and environmental managers and project managers in selecting the suitable set of performance indicators to be used for CE to support early sustainability performance assessment, giving a possibility of introducing improvements prior to the implementation. The procedure consists of several steps, which explain activities to be followed before, during and after the selection process. This final version of the procedure is the result of several improvement iterations, during which the initial version, based on the literature and expert review, was improved following recommendations from case study application (Table 2 in Section 4.1).

3.1. Step 1: Scope Definition—Elaborating on a CE Initiative

3.1.1. Overview and Preparations

This step is focused on defining the scope for indicator selection, which requires identification, prioritization, and elaboration on a specific CE initiative to be screened with the help of indicators. Detailing a CE initiative is an important step because it influences the number and type of suitable indicators that will be available for the indicator review later in the process. The current procedure does not directly support the formulation of CE solutions suitable for a specific corporate context, i.e., whether a company should engage in service provision or in remanufacturing. Instead, it requires a set of solutions, including a CE one, be already outlined before the process of indicator selection. Major preparations for this step require, firstly, forming a multidisciplinary team consisting of people, who are involved in CE initiatives planning, including a sustainability manager or ‘steward’, and, secondly, selecting a specific and detailed CE initiative, which will be the scope for the indicator selection. It is important to facilitate a group discussion about what a specific CE initiative aims to achieve, what it specifically entails and what corporate (i.e., strategic, tactical and operational) decisions does it affect. The key question to be asked for this step is: “What should be measured in order to understand and potentially improve sustainability performance of the selected CE initiative?”

3.1.2. Activities

Detailing a prioritized CE initiative should be based on the identification of what CE strategies are involved and what business processes are affected. This activity is facilitated by a set of guiding questions, for instance, such as “Does the initiative involve offering ‘add-on’ service contracts including maintenance, supply of spare parts, buy-back agreement, consultancy?”, “Does the initiative require changing commercial relationships with customers and/or suppliers?”, “Does the initiative require changing or establishing reverse logistics system, and/or corresponding end of life processes and technology (e.g., technology, processes and resources (fuel, energy, water, etc.) needs for the re-processing facilities)?”, etc., which helps to define specific CE strategies and business processes. Once identified, these selections can be used as inputs to Step 2 to explore initial sets of suitable indicators. Before proceeding to Step 2, it is important to formulate key questions for each selection under the prioritized initiative. This helps in creating alignment between the selected indicators (later in the process) and the scope, in that “ … indicators of sustainability will only be effective if they support social learning by providing users with the information they need in a form they can understand and relate to” [41]. For instance, if a company’s initiative is to provide a service for a ‘full life cycle support’ for a product, it could involve offering a product through leasing contract including installation, maintenance and repair, removal at the end of life to be eventually recycled into the same product. Each intervention would require a different perspective, affecting decisions to be taken during various business processes. For instance, key questions can be formulated as: (i) what indicators to use to help understand sustainability performance of the CE initiative, when changing a business model from selling products to leasing?, (ii) what indicators to use to help understand sustainability performance of the CE initiative, when designing a product that is recyclable at the end of life, and (iii) how to measure how a specific CE strategy (e.g., repair) would affect considerations during a specific business process (e.g., product development, after-sales service, etc.)? Asking as many relevant questions as needed for each combination of a business process and a CE strategy(ies) facilitates understanding of what CE actually is, as well as what effort does it require. The reason is that CE solutions do not go in isolation: CE strategies influence each other and influence decisions taken during different business processes, likewise operationalization of certain CE strategies is enabled or constrained by decisions taken during various business processes (e.g., a product-design oriented solution has to fit a company’s business concept and vice-versa).
As an outcome of this step, the identified CE strategies and business processes can be combined to explore relevant indicators, which in turn should help in answering formulated questions.
As a part of this step, it is necessary that for each CE configuration a baseline (‘as-is’) system is defined, thus making it possible to compare a new (‘to-be’) scenario and a baseline (‘as-is’) scenario.

3.2. Step 2: Reviewing and Selecting Relevant Indicators

3.2.1. Overview and Preparations

This step requires applying the knowledge and expertise about the details of the prioritized CE initiative and specifics of the company (e.g., its sustainability priorities, specifics of the sector, facility, process, product). Similarly to Step 1, a multidisciplinary team is engaged together with a sustainability manager or ‘steward’, who can support the selection of indicators that require sustainability expertise.
Indicator review and selection are done through several sub-steps allowing to gradually select the most relevant indicators for each relevant scope (e.g., addressing key questions formulated for a combination of a CE strategy/ies and a business process) (defined in Step 1).

3.2.2. Activities

1 Sub-step 2.1. Establishing initial indicator set
In order to establish the initial indicator set, a combination of filters in the ‘leading performance indicator database’ need to be applied. Explicitly, the filtering is done by setting a ‘selection’ filter for a combination of CE strategies and business processes, which constitute the key question in focus. Filtering allows us to automatically reduce the number of indicators applicable to the selected combinations, thus removing unsuitable indicators for the scope that is in focus. For instance, a combination of CE strategy ‘repair and maintenance’ and a business process ‘after-sales service’ can be selected in the database to address the question ‘how to measure how a repair strategy would affect considerations during after-sales service?’ (discussed in Step 1). This selection would bring the initial set of indicators suitable for the selected combination and questions in focus.
2 Sub-step 2.2. Prioritizing sustainability aspects
Once the initial indicator set appears, it is further possible to refine it by setting a ‘selection’ filter for a sustainability aspect/s of higher interest or concern. Details of the selected CE initiative, industry type, product type, location of business are among factors that impact what sustainability aspects might be prioritized [42]. Furthermore, the key question from Step 1 should be considered to assist the selection of sustainability aspects of concern. For instance, if the selected CE initiative concerns offering products for shared use, cost aspects, product durability and lifetime and resource consumption for and by the product under its use might be considered. Similarly, if a company belongs to the textile sector and is planning to change the process of dyeing, it might prioritize environmental aspects of water consumption and dye consumption, and liquid waste generation [43]. A company producing electronics might prioritize social aspects of supplier and community relationships (e.g., associated with mineral extraction coming from conflict zones) [44] and environmental aspects of energy consumption [45]. Likewise, some of the aspects might be de-selected: if a company regulates social and ethical issues through its code of conduct regularly, social aspects related to employment conditions and supplier relationships can be de-selected. Although the significance of a balanced TBL inclusion, especially for a long-term strategy, it may be beneficial for a company to decide on one dimension (e.g., environmental) at a time [42] when selecting indicators for CE screening. When focusing on one dimension, it is recommended to have indicators covering a broad spectrum of aspects (for instance, energy/waste indicators for a process, material consumption and expected lifetime of a product). These considerations should be discussed in a team to encourage dialogue about sustainability aspects significant for the selected initiative and the company. A short description of each sustainability aspect and related issues are provided in the database to assist their interpretation, which can be very useful for the project team during indicator selection process, considering that most of the companies in EU are SME’s [46] and may not have an environmental or sustainability engineer, whose expertise is essential in facilitating the selection of significant aspects and issues [47].
3 Sub-step 2.3. Reviewing and selecting suitable indicators
Once the initial indicator set is shown and sustainability aspects are prioritized, it is necessary to review the proposed set of indicators. The review and evaluation of indicators is a thorough process that requires operating with and iterating the details and key issues outlined in previous steps. The team should comprise sustainability or environmental managers and other project staff (e.g., product developers if the CE initiative involves product redesign). It is essential that the team has substantial knowledge of its own processes/products and the CE initiative. The involvement of the product and business development team can greatly impact to what extent the solution can be reached [42]. The team can consult the indicator database to understand how each indicator is measured and what data is needed. Furthermore, a set of guiding questions should be used to assist the review and indicator evaluation (with elaboration provided under each guiding question), as follows:
• How relevant is the indicator for your industry or company?
For instance, the environmental indicator available in the initial set for CE strategy ‘Reduce, Restore and Avoid impacts in Raw material and Sourcing’ and a business process ‘product development’, is ‘Pesticide use’. While this indicator is irrelevant for a heavy machinery company, it may be highly relevant for a food producing company. Similarly, the indicator ‘Ozone Depletion Substances in the Product’ is irrelevant for the textile industry, while can be relevant for the industry producing foam blown with chlorofluorocarbons (CFCs) used for thermal protection (e.g., used in aerospace industry) and for industries producing electronic and photographic equipment (e.g., cleaning fluids containing CFCs) [48].
• How relevant is the indicator for the selected CE initiative?
For instance, two of the environmental indicators available in the initial set for the combination of CE strategy ‘Reduce, Restore & Avoid impacts in Raw material and Sourcing’, CE strategy ‘Recycle’ and a business process ‘end of life operations’, are ‘Amount of Restricted Materials (REACH) in products’ and ‘Amount of Prohibited Materials (SVHC) in products’. While these indicators are very important for a company that considers open-loop recycling (i.e., recycling of one product type to obtain material to be used as an input for another), they may be not important to measure if the company intends to do closed-loop recycling (i.e., when recycling own product into the same or similar product), because this information might already be available and used to make a decision to implement a recycling strategy. Furthermore, the importance of this indicator can only be judged by an expert (for instance, environmental, product or production engineer) as opposed, for example, by a non-expert of hazardous substances, like sales or service manager.
  • How much data is required to measure the indicator and how big is the uncertainty of data collection?
  • Does data collection involve significant costs or time?
For instance, to measure the indicator ‘First technological wear-out life’ (i.e., the period, which the product can be used without an upgrade, and is based on external factors, such as technology infrastructure changes and attractiveness compared with competing products (in contrast to internal factors as physical degradation and failure)), the company might need to collect data from the users, which can be time-consuming and costly, especially in the ‘business to consumer’ model. On the other hand, the company may realize that the data is available because the company already collects it as a part of their business practice.
  • Is the indicator easy-to-use and understand?
  • Does the use of the indicator require experts?
It may be challenging for a service manager, for instance, to work with social indicators. This would require involving experts with the knowledge to evaluate the importance of a particular indicator and its application and interpretation.
4 Sub-step 2.4. Customizing and creating new indicators
Along the evaluation process, indicators may need to be customized or created [38] to better address particularities of (i) a prioritized CE initiative and its objectives, (ii) the sector, and (iii) own processes, products, and operations. For instance, the indicator ‘Volume of chemicals and solvents used per product’ can be customized to ‘Volume and number of different chemicals used per product’ to address the company’s objective to understand what types of chemicals are used with the aim to remove them from the product. Furthermore, if the company’s objective is to reduce the maintenance costs of a product, new indicators can be created to address it. Thus, the indicator ‘Volume and number of different chemicals and solvents used for product maintenance’ can be developed, being based on the existing indicator. To complement it, an economic indicator ‘costs associated with the use of chemicals and solvents for product maintenance’ can be formulated.
Sub-steps under Step 2 are iterative steps, which allow the reiteration of key considerations and issues related to a particular CE initiative and its details. Iterations encourage learning about own operations and products and what matters the most for the particular context.

3.3. Step 3: Composing the Final Indicator Set

Once the indicators are refined, customized and created, the final indicator set can be composed of what can be called key performance indicators for the selected scope. The final indicator set should, therefore, reflect the indicators that are prioritized for data collection. It is then important to check the TBL coverage to ensure a balanced indicator set unless the specific dimension has been de-selected on purpose (sub-step 2.2.). The final set should be practical to measure and consist of a manageable number of indicators, normally between 10 and 20, to provide a basis for actions [49]. The checklist below should be used to evaluate the final set on its comprehensiveness by addressing the following:
  • Does the set consist of 10 to 20 indicators?
  • Are all indicators relevant?
  • Do indicators cover all TBL dimensions?
  • Do indicators reflect life cycle thinking?
As the outcome of Step 3, a set of indicators is composed and an overview of the required data is prepared.

Implementing the Final Set of Indicators

In order to understand the performance of the selected CE initiative, it is important to implement the final set of indicators. Indicator application is the most extensive step since each final indicator would require tracking, collecting and managing data. The database provides formulas to compute each indicator, thus easing the task of identifying what data is needed. It is necessary to set a plan for data collection with a time period and responsible for data monitoring and registration. Sustainability or environmental managers, normally, already have an overview of what data the company might be routinely collecting as part of business practice. Moreover, knowledge of the indicators and necessary data allows them to identify the sources of specific data. Data collection processes, however, should ensure reliability, validity and verifiability, and requires a critical technical assessment [50]. Data quality can greatly influence the results of indicator application and compromise the decision-making process. Data can be collected from management, technical or procurement reports, existing management systems, stakeholder meetings, etc. [50]. Moreover, data needs to be collected for as many initiatives as set up in step 1 to ensure that the baseline ‘as-is’ system versus ‘to-be’ system, i.e., a new circular initiative, can be compared. Essentially, the initiatives must only be compared based on the same set of indicators, to enable understanding of sustainability performance of the proposed actions (i.e., decreasing or increasing trend). After comparison, it may be necessary to return to step 2 to select more indicators or to step 1 to refine details of the CE initiative.

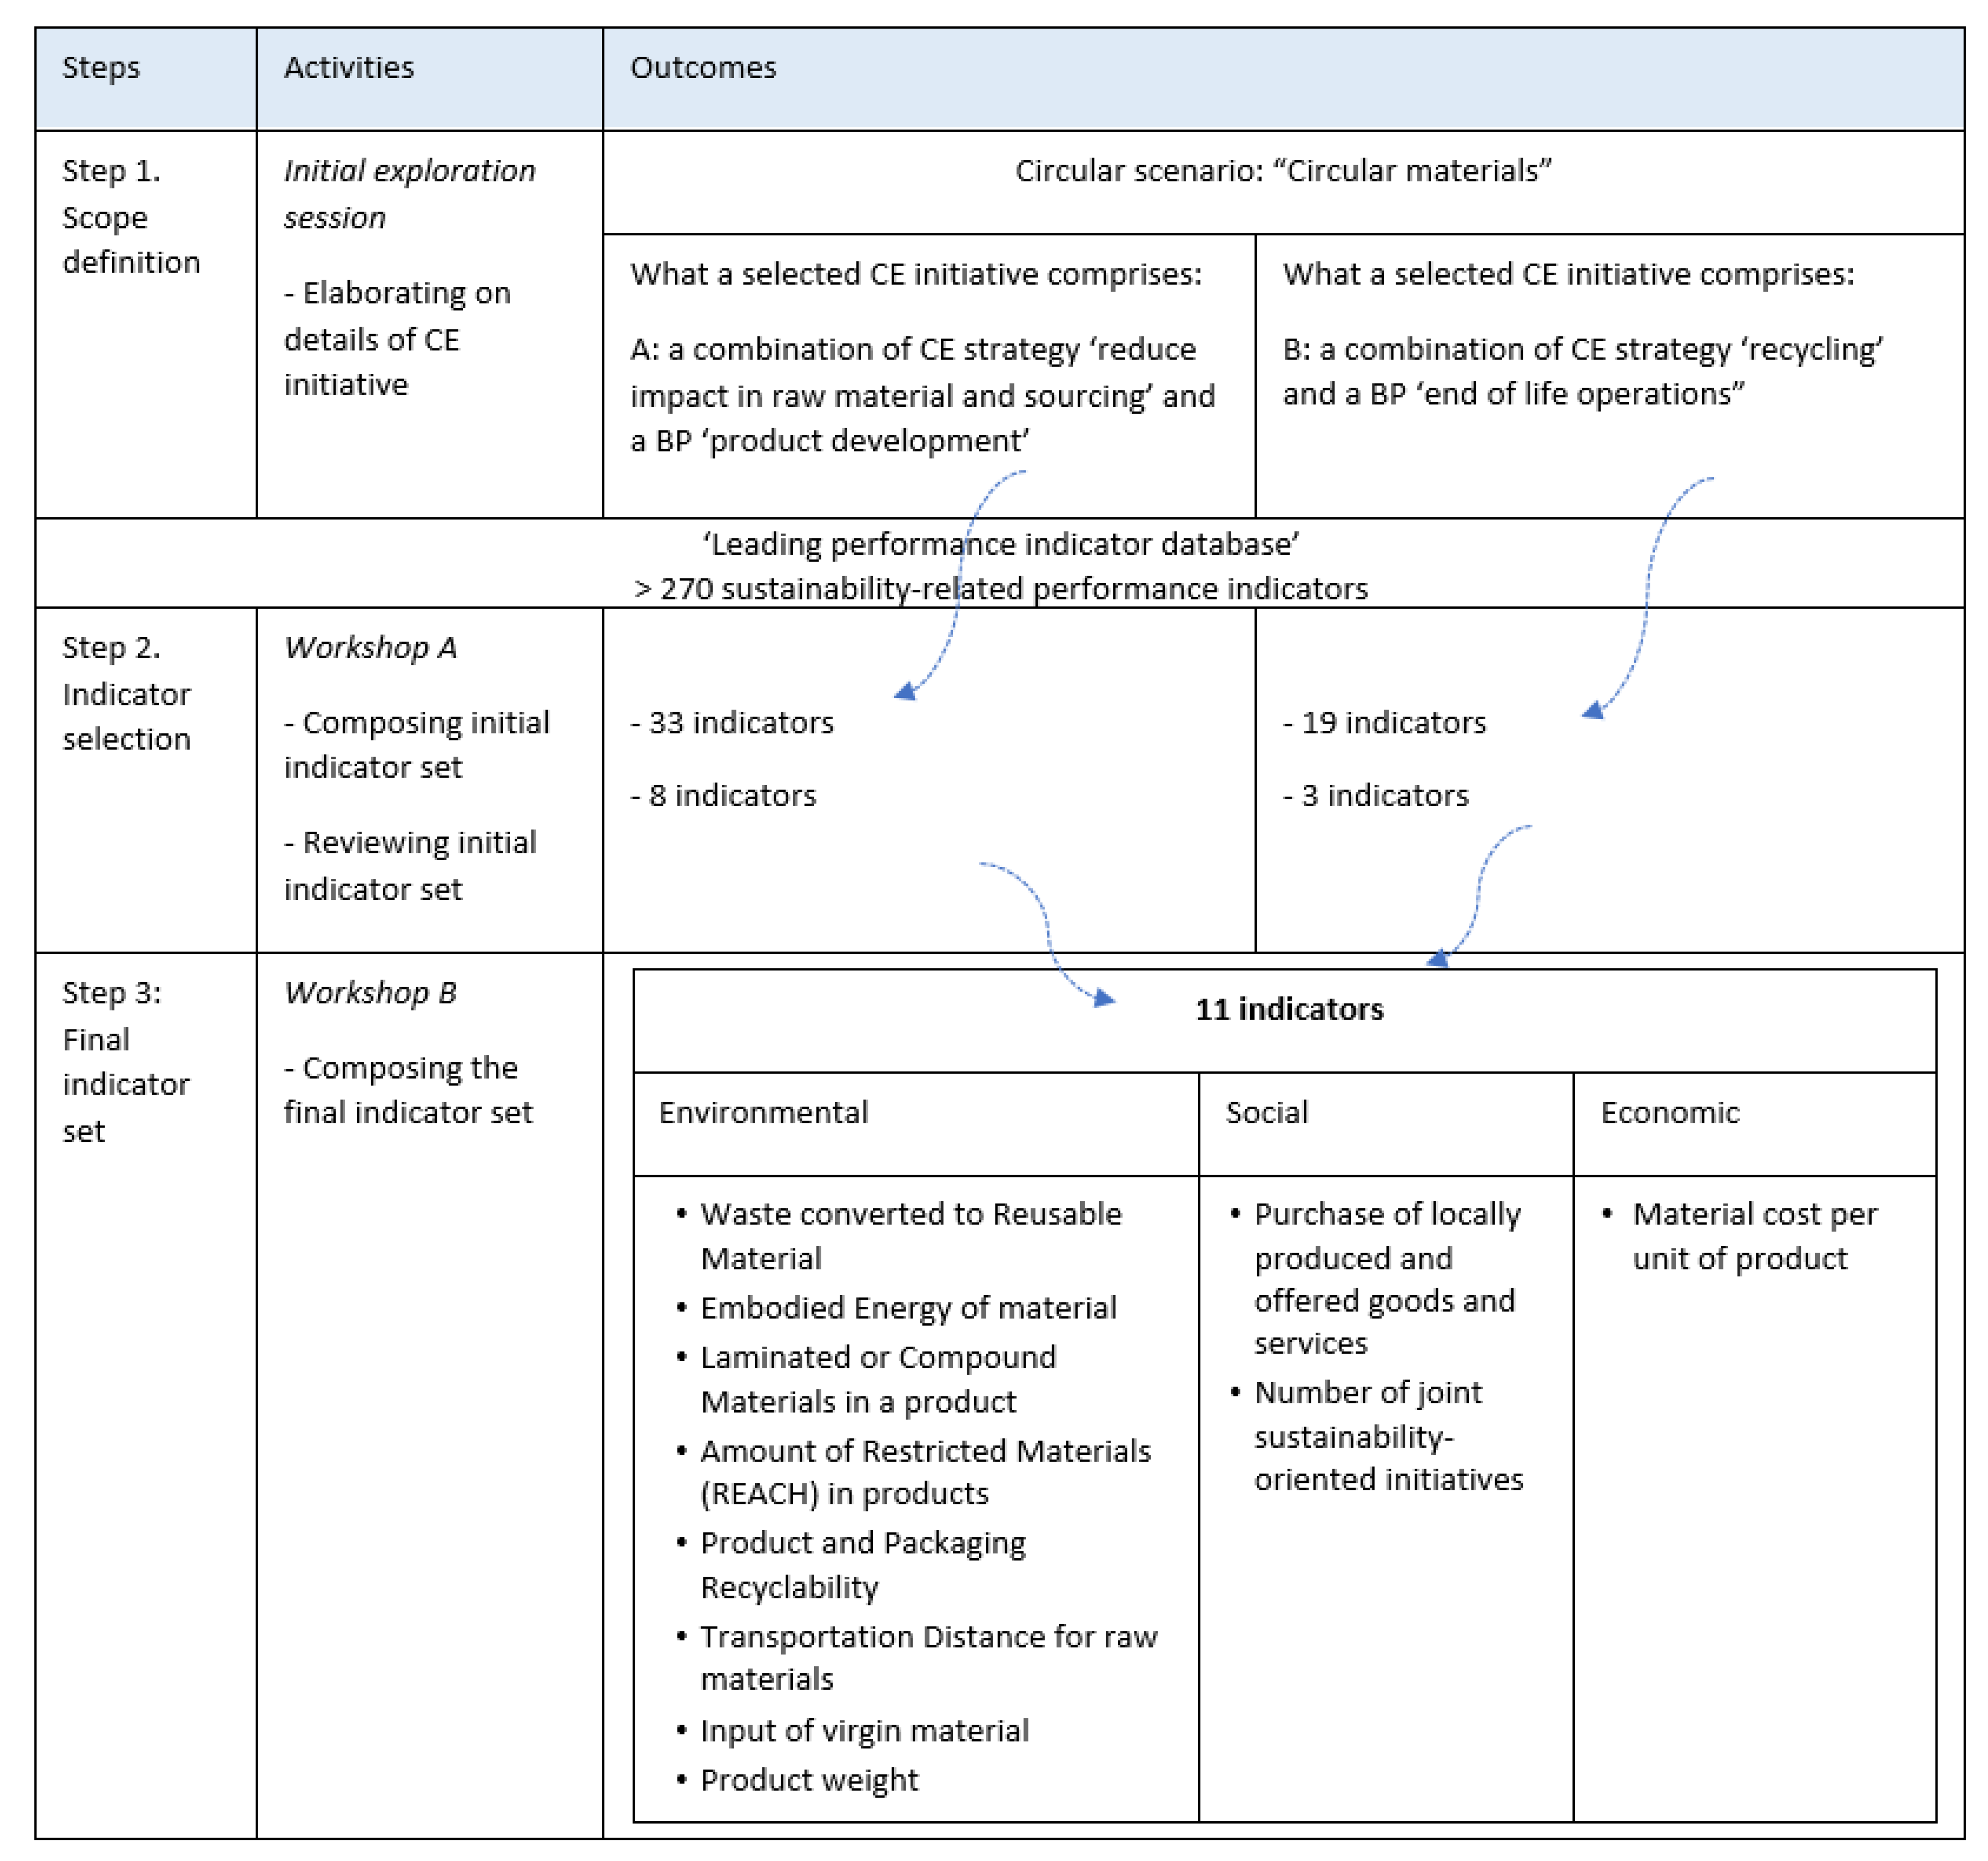
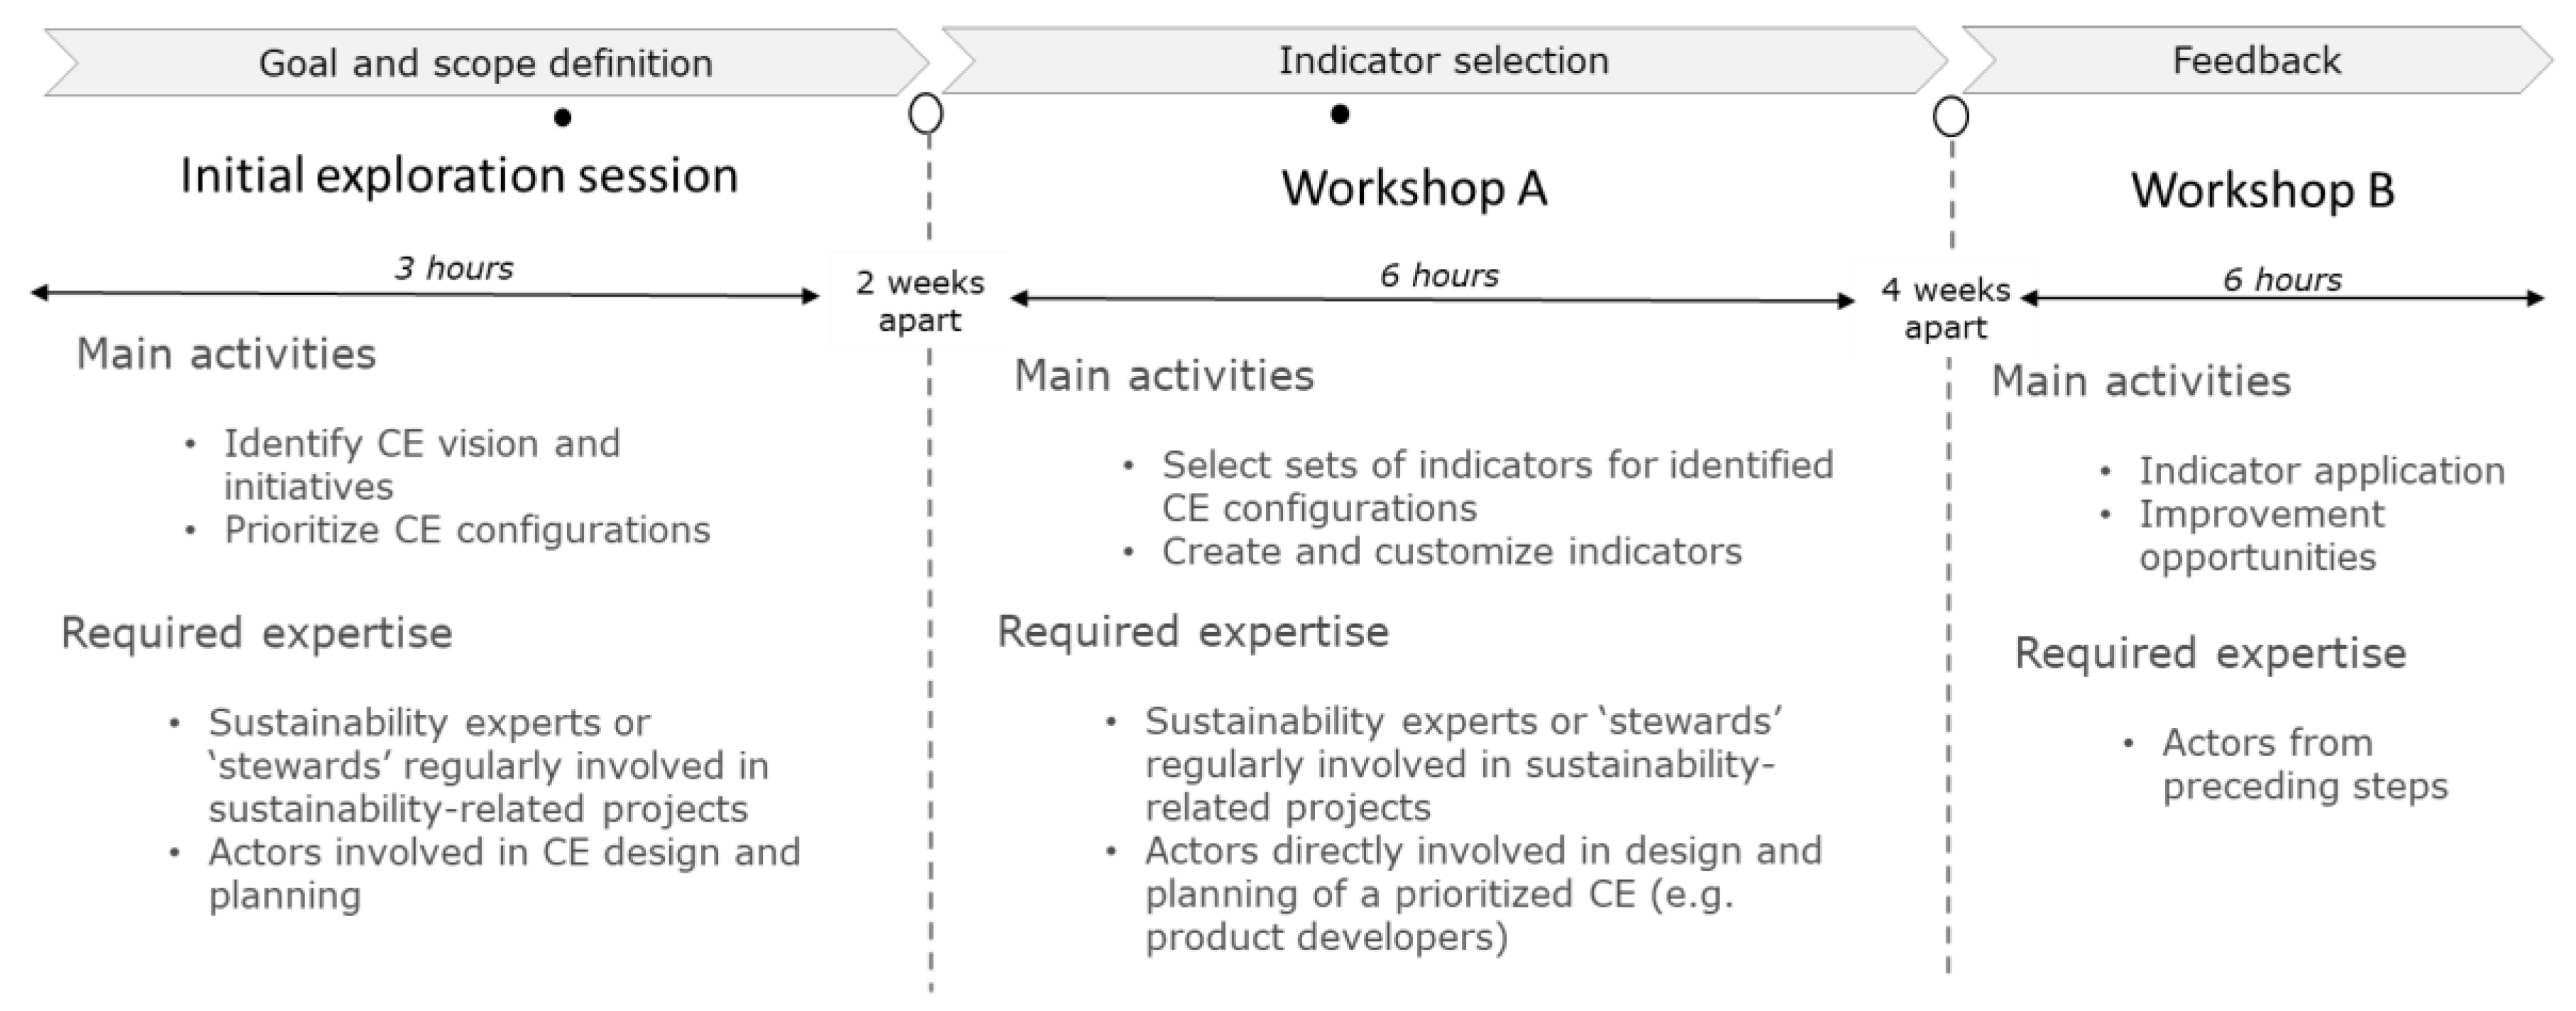
4. Empirical Application in Case Study Settings

Research Step III aimed to test the procedure through case studies, which evaluated the extent to which the procedure could support the selection of suitable performance indicators. Three Nordic manufacturing companies have participated in the evaluation, varying in size (from less than 10 employees to 10000) and sector (company 1—furniture solutions for public and private spaces, company 2—manufacture and service of heavy industrial equipment, company 3—textile sector and home accessories). A detailed description of a procedure application is presented below using a case of Company 1, followed by a summary of learnings from all cases. A detailed description of the procedure application for Company 2 and Company 3 are provided in Appendix B. Condensed feedback from each company is presented in Appendix C in Table A1 with direct quotes and authors’ interpretations.
Company 1 can be classified as a micro-enterprise (<10 employees) with headquarters in one of the Nordic countries. The company designs and provides furniture solutions for public and private spaces. Since its inception around 10 years ago, the corporate strategy and objectives have been formulated around designing furniture systems that are driven by sustainability and individuality principles. Furniture systems are designed with the user in mind, modular and customizable, so to give the users the possibility of building variations of furniture from the same components, thus allowing the user to ‘design’ their own space with no need to buy more. Their strategic vision is formulated around efficient, regenerative and responsible use of resources, enhanced co-operation with local stakeholders and customers, and improving the physical and aesthetic quality of furniture.
Two company representatives participated throughout the engagement workshops: first co-founder, with expertise in sustainable and environmentally conscious product design solutions, and second co-founder, specializing in interior and furniture design. During the initial exploration session, it became clear that the company is considering several circular economy solutions to be implemented. The circular solutions, required, among others, rethinking own business model, establishment of a new value chain partnership, setting a product take-back system. For the indicator selection process, however, the ‘circular material’ initiative, in which the focus was on using the recyclate as a feedstock for a product type A, has been prioritized (Step 1). This decision mirrors the corporate environmental objective of regenerative and responsible use of resources, in that, the ‘circular material’ is to be locally “produced” from collected waste. Another driver mentioned during the session was to create awareness of waste and the ‘value’ stored in it, inspire other industries and create a new market for waste as a resource.
Consequently, the ‘circular material’ initiative was chosen as the scope to proceed with for indicator selection (Step 2). The intention of the company was to see what sustainability considerations to make and what to measure in order to support the decision. Moreover, the company acknowledged that the focus should not be solely on materials, but also on the conversion process of the material, transport, and end of life. This was explained by closer cooperation of the case company with another company responsible for waste recycling and forming of recyclates into new components. Considering this view, the initial scope for indicator selection consisted of a combination of CE strategy ‘reduce impact in raw material and sourcing’ and a business process ‘product development’, with the key question formulated as ‘what indicators to use to help understand sustainability performance of the CE initiative when designing a product with a recycled content instead of virgin material’. After applying the corresponding filters in the ‘Leading performance indicator database’, the initial indicator set comprised of 33 indicators. It was decided not to further refine indicators according to sustainability aspects, but to select the indicators one by one answering the guiding questions under sub-step 2.3. Furthermore, the information registered in the ‘Leading performance indicator database’ was used to understand each indicator and judge it against others. Specifically, the column, which described the importance of measuring an indicator, was found to be helpful in evaluating the importance of a particular indicator. For instance, for the indicator ‘Laminated or compound materials’ the purpose of indicator measurement and the significance of indicator value was stated as ‘Laminated or compound materials have limited potential for recycling. Decrease amount of Laminated or Compound Materials in a product’. As a result of the review process, 8 indicators were selected (Figure 4). During the indicator selection process, the discussion of the team unfolded around the indicator ‘embodied energy’: the participants expressed their uncertainty in how to measure it or how to get the data for it, taking into consideration the novelty of the process of waste recycling and its formation into a desired recyclate.
In addition, as the company indicated their interest in understanding the implications of the waste collection and its recycling process, another round was set up to select more indicators addressing the conversion processes of waste. Consequently, a CE strategy ‘reduce impact in raw material and sourcing’ and CE strategy ‘recycling’ were combined with business process, ‘end of life operations” to understand what should be measured, when recycling waste and converting them to a recyclate for subsequent use in a new product. As a result, the initial set comprised 19 indicators, which were then reviewed using the procedure, resulting in 3 indicators in the final set. Accordingly, the final set consisted of 11 indicators to be implemented for sustainability screening: 8 indicators covering environmental aspects, 2—social and 1 economic (Figure 4).
It can be pointed out, that these selections were performed in an iterative way, in that, the initial scope chosen by the company allowed to navigate the database and gradually (de)select suitable indicators. During the indicator screening process, however, the participants noticed that there is a lack of social indicators, especially under the ‘product development’ process. At the same time, however, the users were overwhelmed by the number of indicators originally available in the database, referring to a challenge that a user might have if working in the database prior to defining the scope. The outcome of a case study was the application of the selected indicators and comparison of the proposed CE solution with the ‘as-is’ system. The company expressed the concern that major data was missing due to the unestablished process (i.e., conversion of waste to the feedstock material), therefore, in order to calculate the selected indicators, the company had either to contact entities, which were performing similar type of recycling and forming process or to collect data from literature. At the end of workshop B, the evaluation session focused on identifying the usefulness of the selection process and selected indicators for decision–making as well as receiving general feedback on how to improve the procedure and usability of the tools. All the comments were consolidated and used to improve the selection procedure, and the database layout.
Some specifics in relation to the first case study application can be pointed out. Firstly, the majority of the selected indicators are product-oriented. This selection can be attributed, firstly, to the selected scope, and secondly, to the expertise, the users from the company had, i.e., expertise in product design. It can be expected that more ‘operational’ indicators, specifically concerning the process of waste recycling, would be selected if people with suitable expertise participated. Nevertheless, the company expressed an interest in engaging value chain partners in the selection process to capture more sustainability aspects. Secondly, since little concrete details and data were available for the circular solution in focus, it was difficult to simulate the results of indicator application to be able to compare the circular and ‘as-is’ scenarios. From the application experience, the users suggested that the procedure for selection should emphasize the importance of corporate sustainability vision, so the final set of indicators can be reflected back onto it. As one of the participants suggested: “The process of indicator selection should start with aligning or defining the organizational sustainability vision and objectives. It is very important to make a company aware of why the selection of indicators is important and what the indicators can be used for. It is important to connect the final set of indicators to the corporate values”. Another suggestion was to adapt the database to smaller companies, with one user commenting: “Make the tool user-friendly for those, who may not have an expertise in sustainability assessments, but have a passion to work with indicators to make improvements”, complementing that “… the procedure requires the facilitator with sustainability expertise to facilitate the team and aid the interpretation of each indicator”, thus making it challenging for (smaller) companies to use the database and select the ‘right’ indicators. On the other hand, the participants highlighted the importance for the user to see and evaluate the initial indicator set, stating: “It is good to have gradual steps in the database to obtain the initial set of indicators and then to select the most suitable indicators for the final set using the guiding questions. It gives a good overview of the whole process of the indicator selection, as well as tracks what indicators have been removed from the final set, but initially comprised the initial set”. The participants also emphasized the usefulness of the list of guiding questions, stating that “… they are very helpful because they “force” the user to think of every single indicator and reflect on it. Also, the indicator evaluation helped to understand the internal processes and what matters the most and what are the gaps”. It was added that, despite the presence of assisting formulas and purpose of measurement for each indicator, the process of indicator selection can be a time-consuming activity, especially for a small company with no sustainability expert that could potentially facilitate the evaluation process.

4.1. Summary of Insights from the Case Studies

The outcome of the procedure application in all the cases was the final set of indicators ready to be used for measuring the potential sustainability performance of the selected CE initiatives and the comparison of different alternatives. While the application procedure has been identified in all the cases, some differences could be observed. Firstly, Company 1 expressed the need to have a support step to assist in the formulation of sustainability strategy and objectives. “As a small company, we think that establishing and being clear about own sustainability goals and strategies is very crucial, also in terms of understanding why working with indicators at all”. Secondly, the participants emphasized the importance of having a facilitator with relevant expertise for the indicator selection procedure. Despite the fact that the participants selected suitable indicators for the final set, the lack of expertise of ‘broader’ sustainability created a challenge along the process, making it more time consuming, when navigating prioritization of significant sustainability aspects. It was suggested to provide more information about each TBL aspect found in the database to assist SMEs in prioritization.
Company 2, on the contrary, was very determined in limiting the scope for the screening as well as in their decision on what type of indicators to focus on. This can be ascribed to the competence and experience within sustainability the participants possessed as well as to the ‘insider-like’ (i.e., internal manufacturing) CE scope selected. Furthermore, the participants, knowledgeable of other sustainability assessment techniques, e.g., LCA, highlighted the importance of addressing trade-offs during indicator selection and, consequently, the decision-making process. Key remarks from Company 2 concerned the usefulness of the database and the procedure in selecting a set of key indicators for each project the company initiates. As emphasized, the key indicator sets can be used across projects to identify improvements and monitor changes. One of the key suggestions was to guide the users in the possibility of limiting the scope to certain key sustainability aspects, to reduce the complexity of operating with too many indicators simultaneously. It was also suggested to state the recommended number of indicators for the final set, so as to assist the user in defining when ‘enough is enough’.
Company 3 recognized the suitability of indicators for the scope selected, however, pointed out the importance of ‘allocating’ indicators to the specific users, who have the competence to evaluate and validate every single indicator. In that, the participants stressed the need to engage experts from several corporate departments, where the sustainability manager would be responsible for identifying the key experts based on the type of CE initiative in focus. Moreover, the participants commented on the usefulness of applying filters to de-select certain sustainability dimensions and aspects. As pointed out, going from a smaller to a larger set by gradually adding more indicators can reduce the complexity of decision-making, when evaluating the importance of each indicator. In addition, key recommendations concerned the conditions of working with the selection procedure, in that, it is critical to define the scope for which the indicators will be selected as well as the baseline, which the new initiative will be compared against. All the comments were consolidated and used to improve the selection procedure, and the database layout and content. Table A1 in Appendix C provides quotes from discussions in case companies. Table 2 presents a summary of key improvement opportunities, labeled as recommendations, which have been identified through the empirical evaluation and incorporated in the final version of the procedure as presented in Section 3.

5. Discussion

The case study evaluation of the procedure and corresponding indicator database presented positive results, indicating their support to companies in the selection of suitable leading indicators to measure the performance of CE initiatives. Furthermore, the empirical settings allowed us to identify opportunities to improve the usefulness of the presented tools. Main learnings from the empirical investigation are as follows:
  • it is essential to set the scope for indicator selection by outlining a CE initiative and elaborating on its details by explicating what corporate decisions it affects (e.g., business process orientation) and what specific CE focus it has (e.g., CE strategy view) prior indicator selection process,
  • it is necessary to set a baseline scenario, upon which a CE initiative scenario can be compared,
  • it is important to involve a multidisciplinary team to support the selection of suitable indicators, including a sustainability ‘steward’ to facilitate the interpretation of indicators and an expert team who is engaged in the development of the CE initiative into focus (e.g., product designers, after-sale managers),
  • availability of indicator attributes, such as formulae, units and purpose of measurement, eases the interpretation of each indicator, which facilitates the selection process. This is important especially for SMEs, which might not have a sustainability manager to support indicator interpretation, similarly, availability of elaborations on sustainability aspects and what they entail facilitates their interpretation and prioritization,
  • it can be beneficial to work with indicators from one sustainability dimension at a time, however, a final set should comprise a balanced number of TBL indicators,
  • the iterative selection procedure seems to help in arriving at suitable indicators, the suitability of which is judged by the users who are to operate with indicators and relate to their results.
The learnings also highlight limitations. Firstly, the procedure and database were tested in a limited number of companies from specific sectors, thus limiting the evaluation of their usefulness for other contexts. Furthermore, testing in more companies could allow us to look into cases, where the scope for indicator selection is expanded to include more combinations of CE strategies and business processes, for instance including those requiring simultaneous changes in business models, product design and operational activities. Secondly, the procedure does not address how to resolve situations, when trade-offs between indicators arise, which is essential in providing assistance in the decision-making process. Therefore, future work should evolve around developing a support tool to guide decisions in trade-off situations. Thirdly, the ‘Leading indicator database’, used to retrieve indicators, contains non-sector-specific indicators. The procedure accounts for this by providing examples of how to customize and create indicators, however, it may be a time-consuming process that could possibly hinder the easiness of the procedure application and indicator selection in the industry. Future research could address the development of indicators that are sector-specific or providing sector-specific guidance for indicator selection. Furthermore, future work could include analysis of relationships between the identified indicators and recognize the most common variables used to calculate the indicators. It would also be beneficial to consider aggregating indicators for simplicity and diffusion in the industry. However, some caution must be taken due to the potential drawbacks of using composite indicators or indices to measure complex phenomena, such as sustainability and CE [37]. It can be pointed out that the indicator database could be enhanced by developing more indicators to cover social aspects and indicators suitable for the business model development process, as discussed in the study by [24].
To indicate the contribution of this study to the context of CE development and indicator-based sustainability assessments, we identify several criteria to provide its comparison against other works. We selected several works that satisfy the following criteria: (i) they provide examples or propose indicators for assessment, (ii) they provide a reasonable categorization of indicators, and (iii) they focus on the early stages of decision-making. The identified works include recent studies on employing indicators to support the development of sustainability-oriented strategies, CE being one of them, and discussed by [38,51,52,53] as presented in Table 3.
Particularly, [51] propose environmental and functional indicators to measure the performance of a product family, considering a wide range of CE strategies. The authors aggregate a set of indicators into several ‘prescribed’ indices to evaluate the circularity of proposed product designs. [52] propose a methodology for designing a sustainable recycling process supported by indicator-based measurements. Their approach is limited to recycling only, although with a three-dimensional sustainability consideration, where four indicators for each dimension are prescribed. Work by [38] provides a procedure to select product-oriented indicators, based on the life cycle orientation and environmental aspect(s) of main concern under the product development process. [53] provide a set of three-dimensional indicators classified according to life cycle stages to be used during product development and manufacturing to evaluate the sustainability performance of products and processes. Whilst they refer to several resource-efficient strategies (e.g., remanufacture), the indicators are not accordingly classified.
Summarizing the above-mentioned studies, it is evident that more research is needed to account for the myriad of perspectives when it comes to the application of leading sustainability performance indicators to support the development of CE solutions. In this sense, current research presents a significant contribution by the fact that it takes into account all dimensions of sustainability, a comprehensive selection of circular economy strategies and a holistic set of business processes (from business modeling, through product development, to end-of-life operations) (Table 3, present research) to allow filtering and pre-selection of classified indicators, to support the development of several CE solutions simultaneously, whilst considering their sustainability performance. Although the study does not have a distinct classification of indicators according to life cycle stages, it takes this perspective into account, when, for instance, presenting indicators selected under the product development process (follow the web address as presented in Section 2.2.). Importantly, the procedure encourages a dynamic selection of indicators, to avoid the prescription of indicators that may be irrelevant for some business contexts. Noteworthy, the approaches that ‘prescribe’ indicators imply that some criteria are more relevant than the others, which seems counterintuitive in such complex and multi-faceted concepts as sustainability and CE [54,55].
A few implications of this study exist. From the theoretical view, firstly, despite a very high level of details provided about each indicator and related sustainability aspect, there is still an assumption that users of the indicators in the industry can interpret indicators and relate them to potential sustainability impacts. To address this, prospective research could focus on establishing a link between leading indicators and related sustainability impacts. Secondly, the database and the procedure do not support supplementary use of CE-specific indicators, i.e., the ones measuring the rate of resource recirculation. The research could advance by developing a procedure to support complementary use of sustainability performance indicators for CE and CE-specific indicators, so as to explicate the link between the implemented CE solutions and the achieved TBL performance, which is currently quantitatively unreported in by industries [56]. From the empirical perspective, the procedure requires a CE initiative to be already planned, thus providing no support on how to approach ideation and development of a specific initiative relevant for a specific corporate context.

6. Conclusions

This research aimed to develop, evaluate and enhance a procedure for a systematic indicator selection to measure the performance of CE strategies from a TBL perspective. The procedure provides guidance for industrial practitioners in selecting a suitable set of performance indicators for measuring the potential sustainability performance of CE strategies prior to their implementation. The procedure was tested with the help of case studies, contributing to its enhancement and consolidation into the final version as presented in previous chapters. The main contribution of this study is the procedure for a systematic indicator selection that is based on the rationale of stipulating a dynamic and flexible selection process. This is to ensure that the selection process accounts for the diversity of CE perspectives and applications and the context they are positioned in (e.g., product, process, sector). The construct of the ’Leading performance indicator database’, which is used as a tool to extract the indicators from, eliminates the complexity in searching for indicators and making judgments of their suitability for the assessment. In that sense, the classification of indicators according to a variety of CE strategies, business processes and TBL dimensions allows us to retrieve an initial indicator set for each possible CE initiative. The initial indicator set is not prescriptive, however, but rather indicative, with procedure encouraging the user to evaluate each indicator, and customize or create new if needed. Although this process might seem challenging, the advantage is to induce learning and engage more profoundly with sustainability considerations during the CE initiative development process, as one of the case participants commented: “Also, the indicator evaluation helped to understand the internal processes and what matters the most and what the gaps are”. From a practical point of view, the procedure intends to reduce the complexity and uncertainty of a decision-making process in companies, which arises from a complex interplay of CE and sustainability domains. Consequently, this minimizes the challenge of operating with too many or too irrelevant performance indicators, contributing to a more structured and informed performance measurement using leading indicators. The procedure should be used in the early stages of CE planning and development, to ensure industrial practitioners use the ‘best’ knowledge of potential sustainability outcomes of their initiatives to make the decisions.
From a theoretical point of view, our aim is to advance theory on CE development support using leading sustainability-related performance indicators. So far, the literature has either proposed newly developed indicators for CE, which mostly measure the intrinsic performance by accounting for the rate of resource recirculation [21] or focus on impact assessments. While being useful, the former do not account for a wide range of aspects related to sustainability (social implications, land use, etc.) [21], while the latter, despite well established and robust methodologies, either cannot assess dematerialized or performance-based CE strategies or provide results that are easily understood by industrial decision-makers [57]. The advantage of leading TBL indicators is in their ability to be understood, hence used, by industries, and to give early warning about potential sustainability impact of CE solutions. The practical contribution of the study is in its support for industrial practitioners in finding boundaries of what sustainability aspects should be considered and in structuring the process of selecting relevant indicators for sustainability performance measurement of CE initiatives.

Author Contributions

Conceptualization, M.K., D.C.A.P. and T.C.M.; expert review, D.C.A.P. and T.C.M.; case study investigation, analysis and data interpretation, M.K.; validation, M.K., D.C.A.P. and T.C.M.; writing first manuscript, M.K.; review and improvement suggestions for first manuscript, D.C.A.P. and T.C.M.; supervision, D.C.A.P. and T.C.M.; funding acquisition and resources, D.C.A.P. and T.C.M. All authors have read and agreed to the published version of the manuscript.

Funding

This research was funded by NordForsk, Nordic Energy Research, and Nordic Innovation under the Nordic Green Growth Research and Innovation Programme, grant number 83144.

Acknowledgments

This article is one of the outcomes of the research project CIRCit (Circular Economy Integration in the Nordic Industry for Enhanced Sustainability and Competitiveness). The authors would like to thank the CIRCit consortium—Research Institutes of Sweden (RISE), Technology Industries Finland, Innovation Center Iceland, Norwegian University of Science and Technology (NTNU) and colleagues from the Technical University of Denmark—for facilitating the engagement with companies and participating in enriching discussions about Circular Economy. Special acknowledgments go to the participating companies and their engaged participation.

Conflicts of Interest

The aforementioned funding institutions had no role in the design of the study; in the collection, analyses, or interpretation of data; in the writing of the manuscript, or in the decision to publish the results.

Appendix A

Figure A1. Case study set up: main activities and actors involved.
Sustainability 12 00951 g0a1

Appendix B Application of Indicator Selection Procedure in Company 2 and Company 3

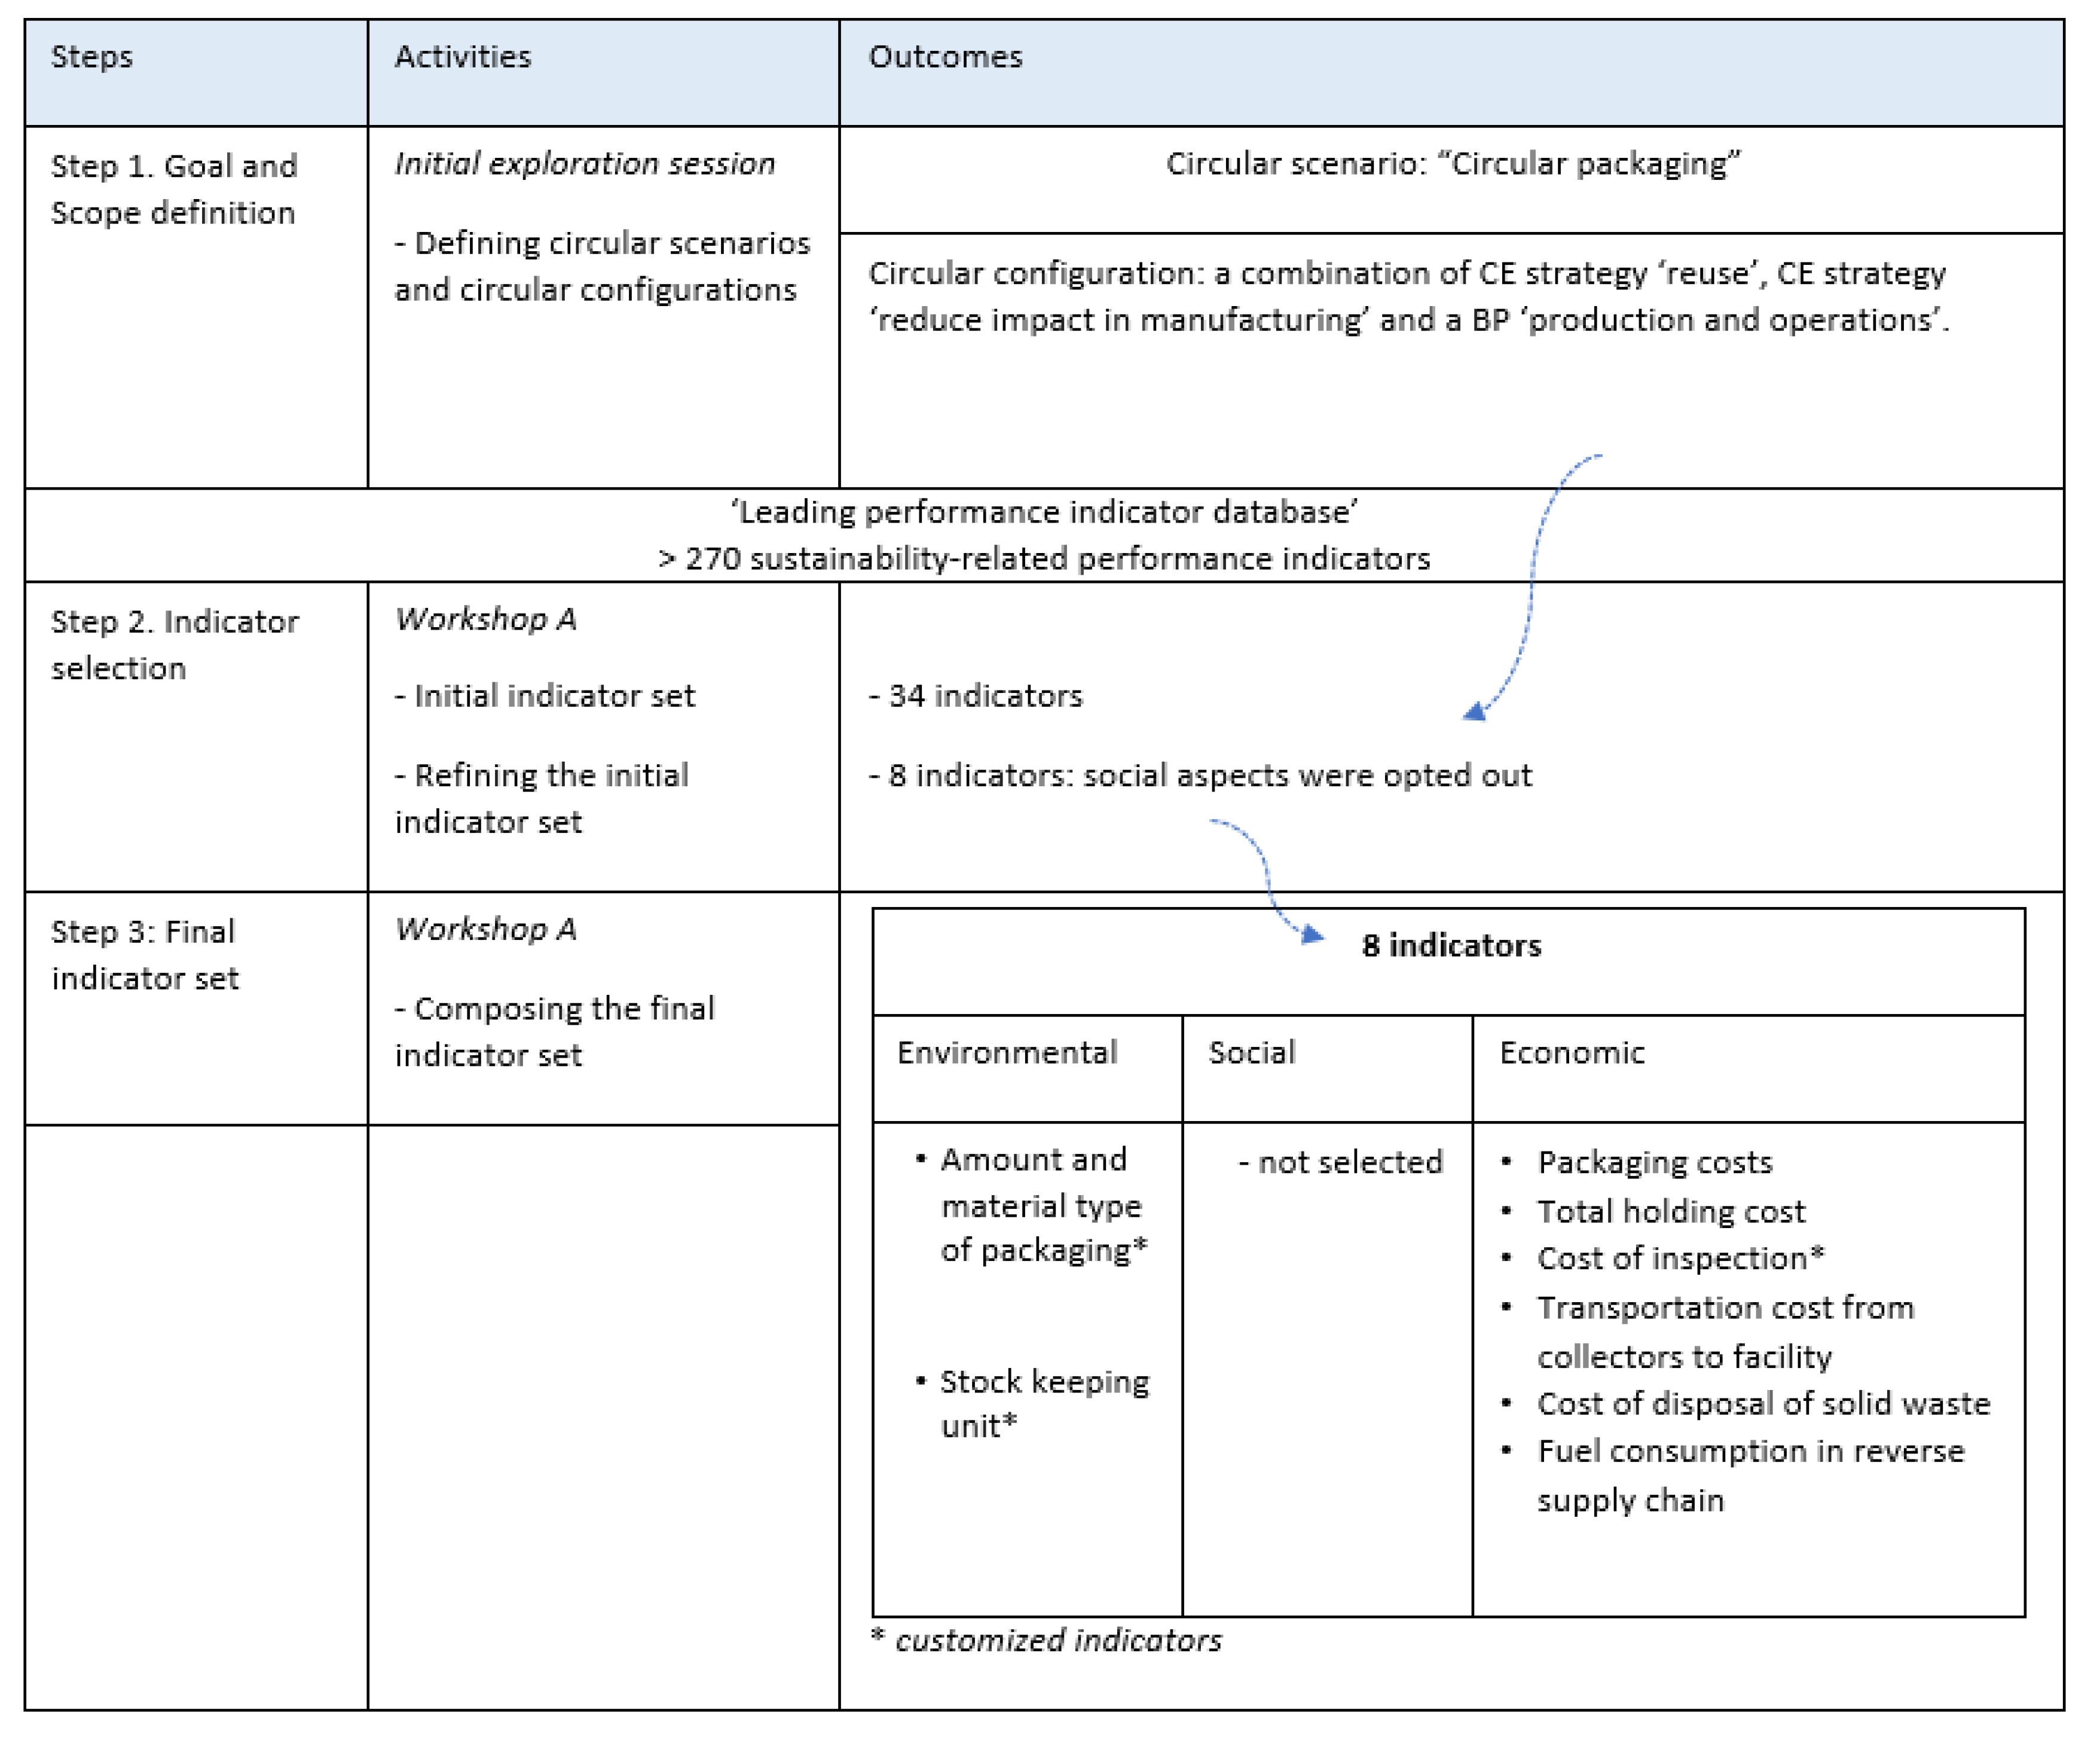
Appendix B.1. Company 2

Company 2 can be classified as a large enterprise with more than 10000 employees worldwide. The company specializes in the manufacture and service of heavy industrial equipment, thus operating in ‘business-to-business’ environments. As a large enterprise, the company has a dedicated sustainability department that specializes in corporate reporting, environmental assessments, standardization, company audits and health, and safety aspects. The company has obtained certifications according to ISO 14401, ISO 9001, and compliance with UN Global Compact, ILO guidelines. Furthermore, the standard practice for product development and operations is based on life cycle thinking and UN sustainable development goals. The company has a very strong focus on sustainability with a commitment to continuous development and improvement, including efficient use of resources and the provision of eco-efficient solutions to customers, offering a safe and interesting work environment, creating value for the stakeholders and society. The company provides a wide range of products and solutions, offering preventive, predictive and corrective maintenance, repair and upgrade service, renting program for parts, reverse engineering solutions, among others. Nevertheless, the company is developing new solutions, many of which have a departure point in CE thinking.
Three company representatives participated throughout the engagement workshops: a CSR and HSE specialist, a head of corporate sustainability department and an environmental specialist. During the initial exploration session, the participants raised concerns over single-use packaging, which was used to pack the parts for transportation between the company’s own facilities. To address the issue, a CE solution is considered where the packaging would be taken back for internal reuse. The packaging unit consisted of a wooden pallet and a plastic material to wrap the parts in. The main objective of the strategy was to fight waste generation and reduce material consumption, simultaneously being a ‘low hanging fruit’ solution in terms of implementation. Thus, the CE solution ‘circular packaging’ was prioritized as a scope to select indicators for in Step 1 (Figure A2). During workshop A (Step 2), the CE configuration for the CE scope consisted of the CE strategies ‘reuse’, ‘reduce impact in manufacturing’ and a BP ‘production and operations’. After applying the corresponding filters in the database, the initial indicator set comprised 34 indicators. Using the guiding questions, the consolidated set of indicators was narrowed down to 13, yet again discussed one-by-one in the group and following the removal of similar indicators, the final set resulted in 8 indicators, of which 3 were customized to better reflect the particularity of the process. The social dimension indicators were opted out by the participants, and the final set comprised of 5 indicators covering economic aspects, 2 covering environmental and 1 being ‘neutral’, i.e., serving the role of a supportive indicator defined by the participants, rather than being a key indicator as others. The participants commented on the final set rather being the one ‘expected’, in that, economic aspects largely dominated by cost aspects (e.g., transport costs). On the other hand, all the participants agreed that “… indicators gave a good overview of data that needs to be collected and registered in their internal database to provide a better overview of the conditions of the current system as well as to introduce and monitor improvements”. Nonetheless, the team also discussed that the scope of circular initiative could be expanded not only to account for take-back routes but also to consider other types of materials for packaging. During Workshop B, the discussion revolved around the data collection process, with participants raising concerns over data acquisition taking into consideration the fact that the transportation aspects of part exchange between factories were being managed by a third-party logistics provider.
Figure A2. Overview of activities and outcomes of the procedure application in Company 2.
Sustainability 12 00951 g0a2
The main feedback from Company 2 was to specify who the users of the procedure and indicators should be. Another feedback concerned the importance of having a circular scenario ready to be used as an input for the selection process, in that “… to make filtering meaningful and to be able further narrow down the set of selected indicators”. The participants also commented on the ‘broadness’ of the sustainability screening framework in comparison to, for instance, life cycle assessment methodology, in that, the screening tool accounts for different business processes and allows them to select indicators that cover all three dimensions of sustainability. All the participants acknowledged that because of the comprehensiveness of the database, “it would interesting to have a set of key indicators for each project we initiate and run. Having that, we can collect data that can be used across projects, but also to monitor changes and introduce improvements over time”. Furthermore, it was emphasized that some indicators can be used to improve existing performance measurement systems, for instance, the environmental management system because the majority of the company’s factories are certified according to ISO 14001. In addition, the participants raised questions about the ‘risks’ associated with operating with a ‘limited’ number of indicators or contradictory indicators, commenting about the importance of having boundaries during the indicator evaluation process, so not to select too many, too few or too ‘biased’ indicators by trying to avoid trade-offs.

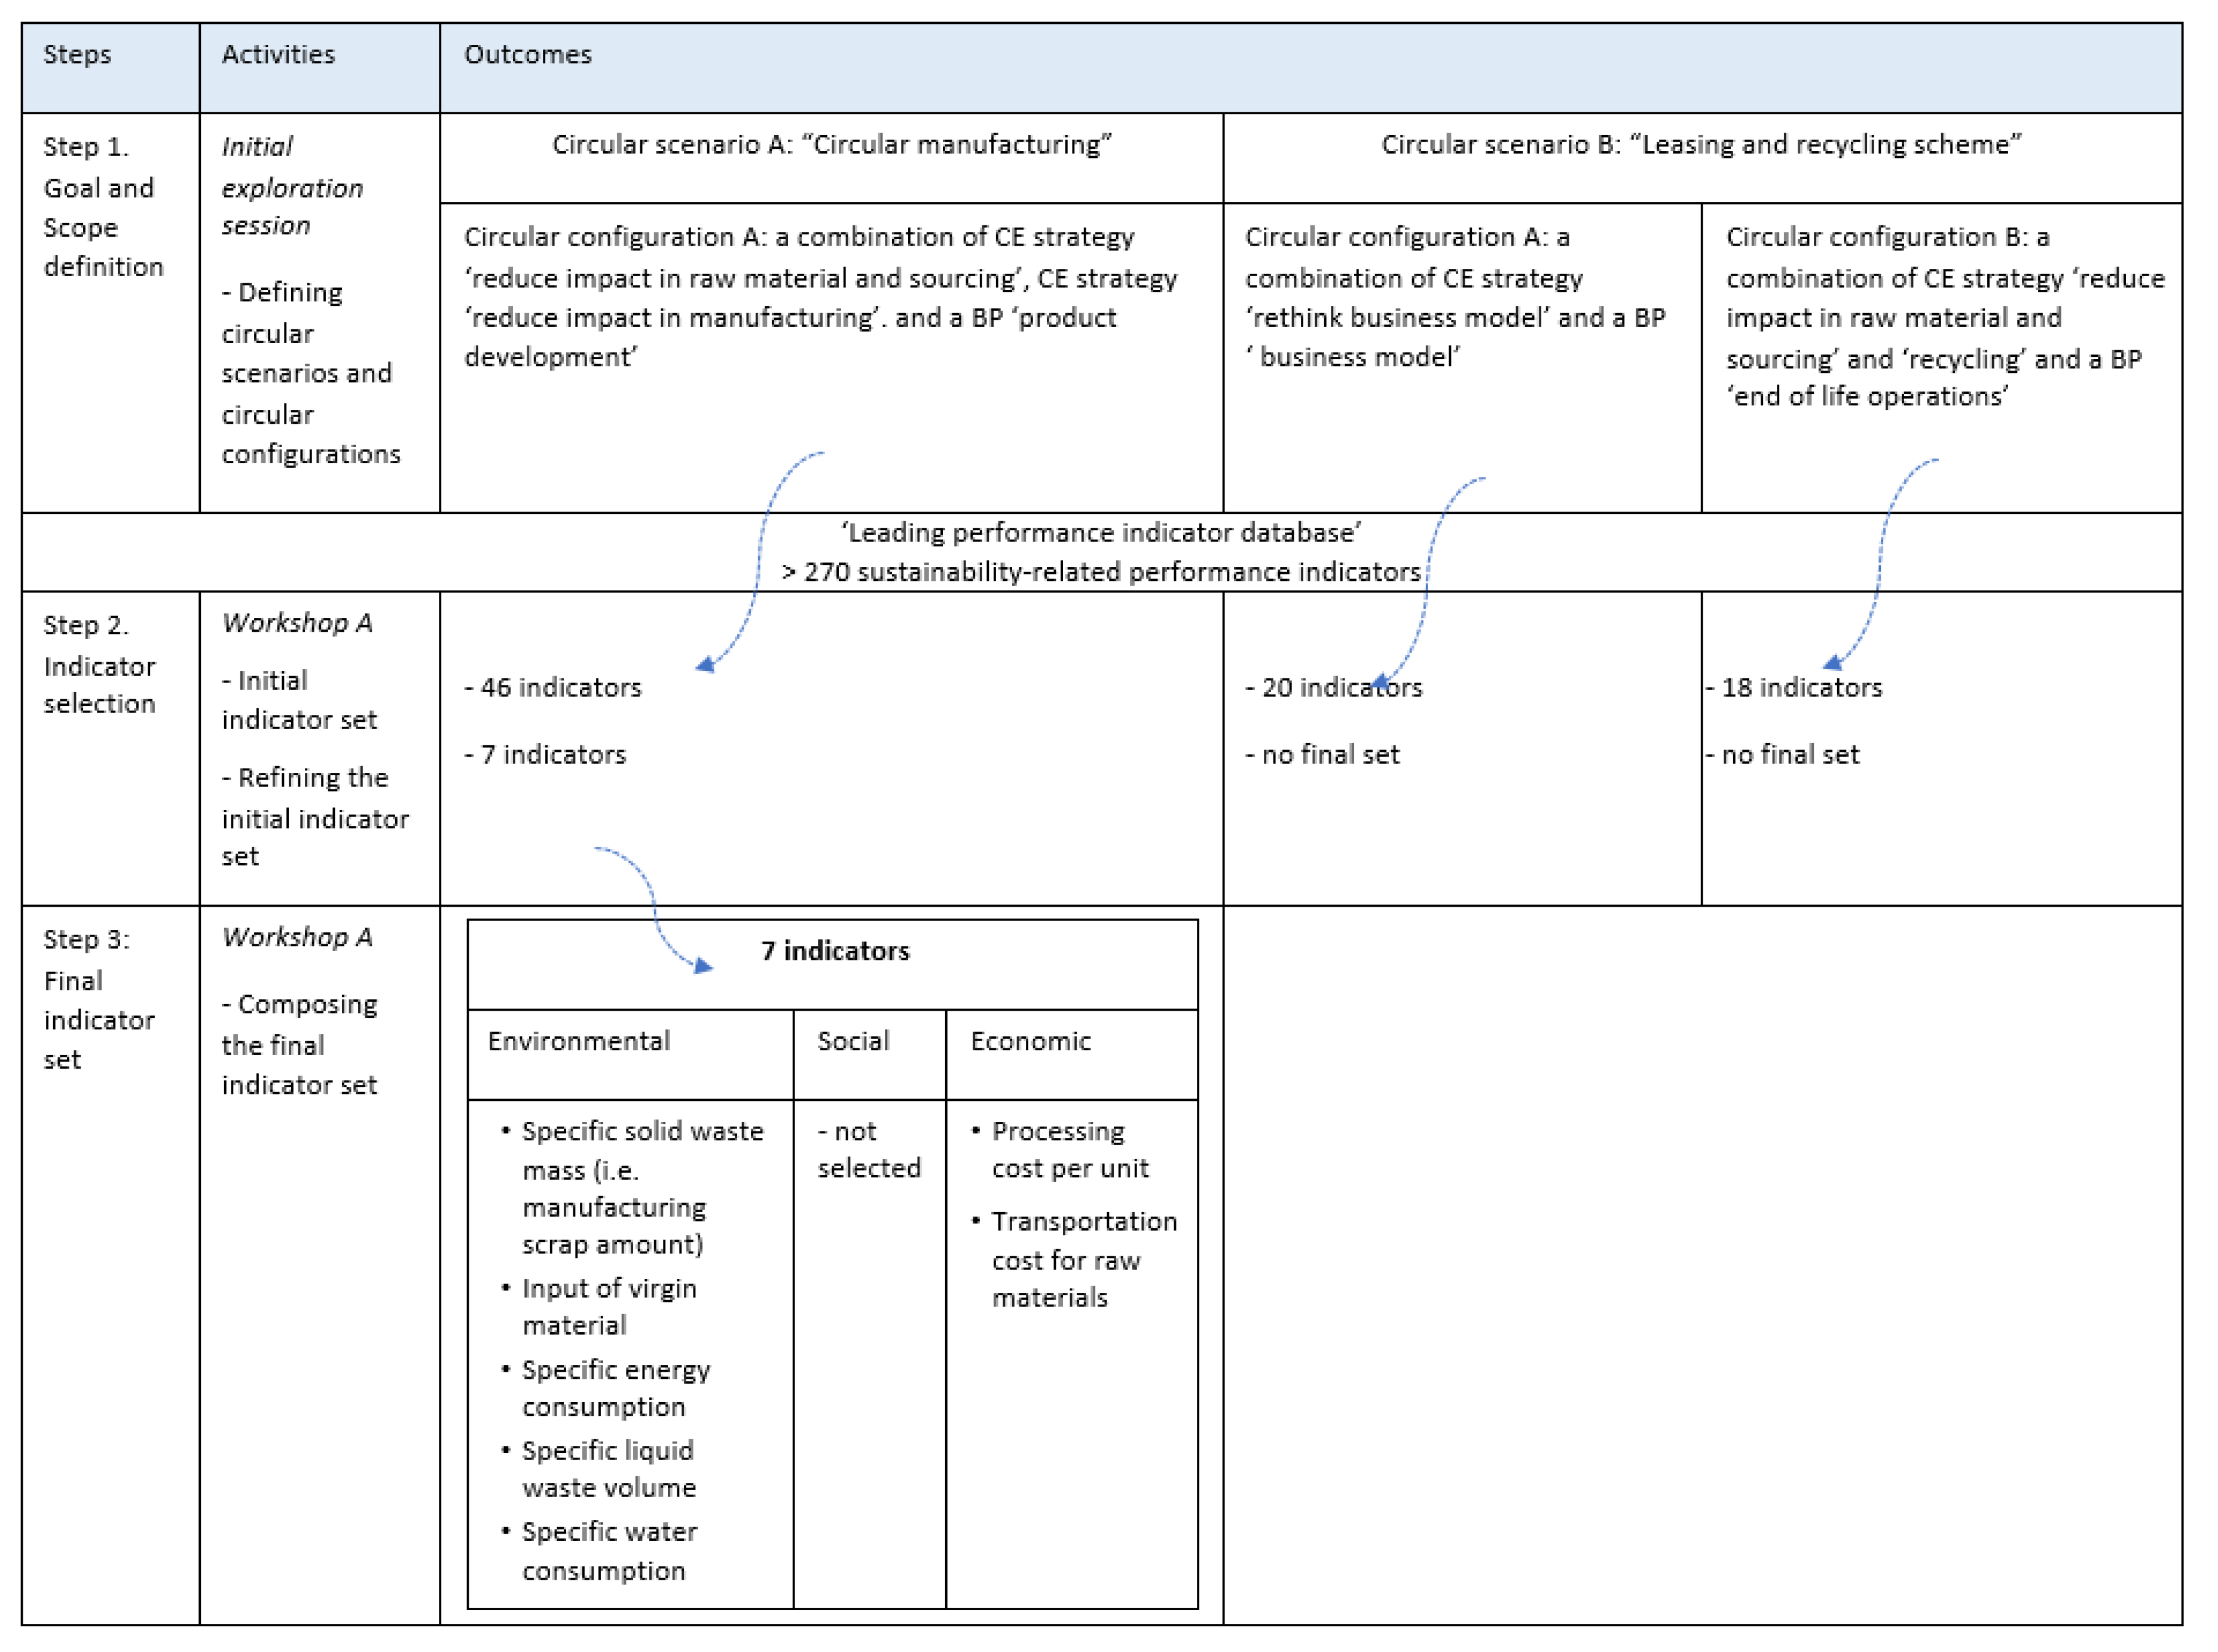
Appendix B.2. Company 3

Company 3 can be classified as a large enterprise with around 500 employees worldwide. The company belongs to the textile sector and specializes in the design of “high-quality textile” for various applications, such as upholsteries, rugs, curtains, home accessories. The customers belong to public, private and commercial segments. The company has a long history of design based on sustainability and life cycle thinking principles. A large number of fabrics are certified according to EU Ecolabel certifications, the headquarter office is certified according to ISO 9001 and ISO 14001 and is operating on ‘green’ electricity. The company is also working with a circular economy and UN sustainable development goals.
Several company representatives participated throughout the engagement workshops: a sustainability manager, a product developer, a head of design management and a director of a subsidiary company. During the initial exploration session, the participants highlighted the corporate strong focus on resource efficiency and the reduction of environmental impacts. One particular objective set to become a zero-waste company, therefore circular economy was in focus. Indeed, the participants confirmed that there are several circular initiatives the company is looking at with a greater focus on products and reduction of their virgin material input. One of the CE solutions proposed was to focus on pre-user recycling of leftovers in manufacturing to be used as a feedstock for the product. Minimization of raw material input and transportation, reduction of chemical and water usage and manufacturing waste were the intentions behind the solution. Consequently, the CE scope (Step 1) was based on the CE solution ‘circular manufacturing’, comprised of the CE configuration ‘reduce impact in raw material and sourcing’ and ‘reduce impact in manufacturing’. To this selection, a business process ‘production and operation’ has been added. This configuration was based on the logic that the closed-loop recycling is to be done internally, i.e., leftovers from the production of a product A would be recycled into product B. Proceeding with the selected CE configuration, the initial set comprised of 46 indicators (Figure A3). The participants then screened the indicators by answering the set of guiding questions (sub-steps under Step 2), selecting 15 indicators to proceed with. Following the discussion in the team, this set has further been refined to contain 7 indicators, 5 of which covered environmental aspects, such as energy, scrap amount, water consumption, while 2 economic indicators addressed the costs of processing and of transport. Likewise, most social and economic indicators were opted out. For instance, the participants stated that for social and ethical issues “… we feel this indicator (the indicator ‘Suppliers that have been screened against labor practices criteria’) is not for each product, but a core value and basic compliance to become one of our suppliers. This is part of our code of conduct, a strategic decision”. Similarly, most of the economic indicators were de-selected, with participants commenting: “We had a hard time understanding the economic indicators as they are out of our expertise, so we got support from a colleague”. For the selected indicator ‘Specific solid waste mass’, measuring manufacturing scrap amount, which is to be recycled into the product B, the participants stated that it was an interesting indicator, which would allow the company to understand the potential of the CE solution. In order to calculate the indicator, the suppliers had to be contacted to provide the data. During the selection process, the discussion around the indicator ‘Product Weight Reduction Ratio’ concerned to what extent can the company reduce the amount of a material in the product. As the product designer stated: “… [this indicator] could be taken into account in new product development, but quality [of the current product] is our first priority”.
After the final set of indicators was obtained, the participants suggested selecting indicators for another CE initiative that the company was interested in operationalizing. Following the discussion about the zero-waste ambition, another CE solution, B, focused on the leasing model that would allow in retrieving the used product for closed-loop recycling at the end of life. For this solution, two CE configurations were defined. CE configuration A, comprising a business model perspective focused on leasing (circular configuration A under scenario B in Figure A3), and CE configuration B comprising a CE strategy ‘reduce impact in raw material and sourcing’ and ‘recycling’ looked from the end of life operations perspective. The initial sets of indicators consisted of 20 indicators for configuration A and 18 indicators for configuration B. It has to be noted that the final indicator set was not selected as this CE initiative was in its ‘raw’ stage with no details around it. However, the outcome of the screening step allowed us to identify the key aspects that have to be considered when developing the initiative further.
Figure A3. Overview of activities and outcomes of the procedure application in Company 3.
Sustainability 12 00951 g0a3
The feedback (Workshop B) included comments on indicator usefulness as well as on improvements the excel database and procedure may need. Firstly, the participants commented on the linkage between the indicator screening process and the competences of the team that screens it. Accurately, the business process view requires a lot of communication between the different departments to understand the ‘value’ each selected indicator can bring. As one participant specifically commented: “looking at the final set, as a product developer, I am already aware of some key performance indicators … and could easily use them without the need for the database. On the other hand, some indicators (e.g., energy-related) can be very difficult to analyze and interpret due to the lack of [my] knowledge of that area”. Furthermore, the participants suggested to consider “what competencies the user should have in order to work in the database” and “when is it appropriate to use the tool, i.e., in what part of the decision-making process does it bring the most value to”. This comment is supported by a statement from the team that “… there is [in the industrial world] a lot of confusion with the circular economy as a concept, therefore, the practitioners need more help in understanding what circular opportunities are there for a specific sector or specific company, … and then to focus on how to create a ‘good’ impact”. Thirdly, to aid the decision-making process, “… it is necessary to visualize the common thread between the selected set of indicators and corporate objectives and goals…”.

Appendix C

Table A1. Consolidation of key discussion points at the case companies.
Company 1
“The process of indicator selection should start with the aligning or defining the organizational sustainability vision and objectives. It is very important to make a company aware of why selection of indicators is important and what indicators can be used for. It is important to connect the final set of indicators to the corporate values”. “Make the tool user-friendly for those, who may not have an expertise in sustainability assessments, but have passion to work with indicators to make good”.
“.. the procedure requires the facilitator with sustainability expertise to facilitate the team and aid the interpretation of each indicator” (authors: thus making it challenging for (smaller) companies to use the database and select the ‘right’ indicators in a time-efficient manner).
“It is good to have gradual steps in the database (different excel sheets) to obtain the initial set of indicators and then to select the most suitable indicators for the final set using the guiding questions. It gives a good overview of the whole process of the indicator selection, as well as tracks what indicators have been removed from the final set, but initially comprised the initial set”.“.. (guiding questions) they are very helpful, because they “force” the user to think of each single indicator and reflect on it. Also, the indicator review step helped to understand the internal processes and what matters the most and what are the gaps”.
Company 2
Important to have a circular scenario ready to be used as an input for the selection process, “… to make filtering meaningful and to be able further narrow down the set of selected indicators”.‘Broadness’ of the indicators in comparison to, for instance, life cycle assessment methodology, in that, the screening tool accounts for different business processes and allows to select indicators that cover all three dimensions of sustainability.“Some indicators can be used to improve existing performance measurement systems, for instance, the environmental management system, because the majority of the company’s factories are certified according to ISO 14001”.Importance of having boundaries during the indicator evaluation process, “so not to select too many, too few or too ‘biased’ indicators by trying to avoid trade-offs” and that “there might be ‘risks’ associated with operating with a ‘limited’ number of indicators or contradictory indicators”.
Company 3
“Looking at the final set, as a product developer, I am already aware of some key performance indicators … and could easily use them without the need for the database. On the other hand, some indicators (e.g., energy related) can be very difficult to analyze and interpret due to the lack of (my) knowledge of that area”.“What competencies the user should have in order to work in the database”.
“When is it appropriate to use the tool, i.e., in what part of the decision-making process does it bring the most value to”.
“… there is (‘in industrial world’ – authors) a lot of confusion with circular economy as a concept, therefore, the practitioners need more help in understanding what circular opportunities are there for a specific sector or specific company; … and then to focus on how to create a ‘good’ impact”.

References

  1. Hart, S.L. A Natural-Resource-Based View of the firm. Acad. Manag. Rev. 1995, 20. [Google Scholar] [CrossRef] [Green Version]
  2. Rademaekers, K.; Asaad, S.S.Z.; Berg, J. Study on the Competitiveness of the European Companies and Resource Efficiency. In Proceedings of the Final Report, Rotterdam, The Netherlands, 6 July 2011. [Google Scholar]
  3. Lieder, M.; Rashid, A. Towards circular economy implementation: A comprehensive review in context of manufacturing industry. J. Clean. Prod. 2016, 115, 36–51. [Google Scholar] [CrossRef]
  4. Contet, P.; Konig, U. Guide to Resource Efficiency in Manufacturing. Greenovade Belgium Energy Regulatory Commission (ERC) (2012). Legal Notice No. 102. Energy Act (No. 12 of 2006). Government of Kenya. Nairobi. Kenya Energy Regulatory Commission (ERC) (2014). Statement on Local Petroleum Pump Prices. Available online: https://erc.go.ke/index.php?option=com_content&view=article&id=21 6:erc-statement-on-local-petroleum-pumpprices&catid=98&Itemid=579 (accessed on 11 November 2019).
  5. Bocken, N.M.P.; de Pauw, I.; Bakker, C.; van der Grinten, B. Product design and business model strategies for a circular economy. J. Ind. Prod. Eng. 2016, 33, 308–320. [Google Scholar] [CrossRef] [Green Version]
  6. Blomsma, F.; Pieroni, M.; Kravchenko, M.; Pigosso, D.; Hildenbrand, J.; Kristinsdottir, A.R.; Kristoffersen, E.; Shabazi, S.; Nielsen, K.D.; Jönbrink, A.-R.; et al. Developing a circular strategies framework for manufacturing companies to support circular economy oriented innovation. J. Clean. Prod. 2019, 241. [Google Scholar] [CrossRef]
  7. Pieroni, M.P.P.; McAloone, T.C.; Pigosso, D.C.A. Configuring new business models for circular economy: From patterns and design options to action. In Proceedings of the 4th International Conference on New Business Models: New Business Models for Sustainable Entrepreneurship, Innovation, and Transformation, Berlin, Germany, 1–3 July 2019; pp. 74–89. [Google Scholar]
  8. Geissdoerfer, M.; Savaget, P.; Evans, S. The Cambridge Business Model Innovation Process. Procedia Manuf. 2017, 8, 262–269. [Google Scholar] [CrossRef]
  9. Moreno, M.; De los Rios, C.; Rowe, Z.; Charnley, F. A conceptual framework for circular design. Sustainability 2016, 8. [Google Scholar] [CrossRef] [Green Version]
  10. Bakker, C.; den Hollander, M.; van Hinte, E.; Zijlstra, Y. Products that Last—Product Design for Circular Business Models; TU Delft Library: Delft, The Netherlands, 2014. [Google Scholar]
  11. Blomsma, F.; Pigosso, D.C.; McAloone, T.C. A Theoretical Foundation for Developing a Prescriptive Method for the Co-Design of Circular Economy Value Chains. Proc. Des. Soc. Int. Conf. Eng. Des. 2019, 1, 3141–3150. [Google Scholar] [CrossRef] [Green Version]
  12. Geissdoerfer, M.; Morioka, S.N.; de Carvalho, M.M.; Evans, S. Business models and supply chains for the circular economy. J. Clean. Prod. 2018, 190, 712–721. [Google Scholar] [CrossRef]
  13. Rashid, A.; Asif, F.M.A.; Krajnik, P.; Nicolescu, C.M. Resource conservative manufacturing: An essential change in business and technology paradigm for sustainable manufacturing. J. Clean. Prod. 2013, 57, 166–177. [Google Scholar] [CrossRef]
  14. Korhonen, J.; Honkasalo, A.; Seppälä, J. Circular Economy: The Concept and its Limitations. Ecol. Econ. 2018. [Google Scholar] [CrossRef]
  15. Potting, J.; Hekkert, M.; Worrell, E.; Hanemaaijer, A. Circular Economy: Measuring Innovation in the Product Chain—Policy Report; PBL Netherlands Environ Assess Agency: AV Den Haag, The Netherlands, 2017; p. 42. [Google Scholar]
  16. Azevedo, S.; Godina, R.; Matias, J. Proposal of a Sustainable Circular Index for Manufacturing Companies. Resources 2017, 6, 63. [Google Scholar] [CrossRef] [Green Version]
  17. EMF. Circularity Indicators: An Approach to Measuring Circularity. Ellen MacArthur Found 2015, 12. [Google Scholar] [CrossRef]
  18. Saidani, M.; Yannou, B.; Leroy, Y.; Cluzel, F. How to Assess Product Performance in the Circular Economy? Proposed Requirements for the Design of a Circularity Measurement Framework. Recycling 2017, 2, 6. [Google Scholar] [CrossRef] [Green Version]
  19. Asif, F.M.A.; Lieder, M.; Rashid, A. Multi-method simulation based tool to evaluate economic and environmental performance of circular product systems. J. Clean. Prod. 2016, 139, 1261–1281. [Google Scholar] [CrossRef]
  20. Di Maio, F.; Rem, P.C. A Robust Indicator for Promoting Circular Economy through Recycling. J. Environ. Prot. (Irvine Calif.) 2015, 6, 1095–1104. [Google Scholar] [CrossRef] [Green Version]
  21. Saidani, M.; Yannou, B.; Leroy, Y.; Cluzel, F.; Kendall, A. A taxonomy of circular economy indicators. J. Clean. Prod. 2019, 207, 542–559. [Google Scholar] [CrossRef] [Green Version]
  22. Sassanelli, C.; Rosa, P.; Rocca, R.; Terzi, S. Circular economy performance assessment methods: A systematic literature review. J. Clean. Prod. 2019, 229, 440–453. [Google Scholar] [CrossRef]
  23. Moraga, G.; Huysveld, S.; Mathieux, F.; Blengini, G.A.; Alaerts, L.; Van Acker, K.; Meester, S.; Dewulf, J. Circular economy indicators: What do they measure? Resour. Conserv. Recycl. 2019, 146, 452–461. [Google Scholar] [CrossRef]
  24. Kravchenko, M.; Pigosso, D.C.A.; McAloone, T.C. Towards the ex-ante sustainability screening of Circular Economy initiatives in manufacturing companies: Consolidation of leading. J. Clean. Prod. 2019, 118318. [Google Scholar] [CrossRef]
  25. Waas, T.; Hugé, J.; Block, T.; Wright, T.; Benitez-Capistros, F.; Verbruggen, A. Sustainability assessment and indicators: Tools in a decision-making strategy for sustainable development. Sustainability 2014, 6, 5512–5534. [Google Scholar] [CrossRef] [Green Version]
  26. Keeble, J.J.; Topiol, S.; Berkeley, S. Using Indicators to Measure Sustainability Performance at a corporate and Project Level. J Bus. Ethics 2003, 44, 149–158. [Google Scholar] [CrossRef]
  27. Shareef, R. Want better business theories? Maybe karl popper has the answer. Acad. Manag. Learn. Educ. 2007, 6, 272–280. [Google Scholar] [CrossRef]
  28. Minnameier, G. The Logicality of Abduction, Deduction and Induction. In Ideas in Action: Proceedings of the Applying Peirce Conference; Nordic Pragmatism Network: Helsinki, Finland, 2010; pp. 239–251. [Google Scholar]
  29. Zaidah, Z. Case study as a research method. J. Kemanus. 2007, 9, 1–6. [Google Scholar]
  30. Yin, R.K. Case Study Research—Design and Methods. Clin. Res. 2006, 2, 8–13. [Google Scholar] [CrossRef]
  31. Eisenhardt, K.M. Building Theories from Case Study Research. Acad. Manag. Rev. 1989, 14, 532–550. [Google Scholar] [CrossRef]
  32. Shenton, A.K. Strategies for ensuring trustworthiness in qualitative research projects. Educ. Inf. 2004, 22, 63–75. [Google Scholar] [CrossRef] [Green Version]
  33. Baxter, P.; Jack, S. Qualitative Case Study Methodology: Study Design and Implementation for Novice Researchers. Qual. Rep. 2008, 13, 544–559. [Google Scholar]
  34. Pojasek, R.B. Using Leading Indicators to Drive Sustainability Performance. Environ. Qual. Manag. 2009. [Google Scholar] [CrossRef]
  35. Pavlov, A.; Bourne, M. Explaining the effects of performance measurement on performance: An organizational routines perspective. Int. J. Oper. Prod. Manag. 2011, 31, 101–122. [Google Scholar] [CrossRef]
  36. Azapagic, A.; Perdan, S. An integrated sustainability decision-support framework Part I: Problem structuring. Int. J. Sustain. Dev. World Ecol. 2005, 12, 98–111. [Google Scholar] [CrossRef]
  37. Gibson, R.B. Sustainability. In Tools, Technology Approaches Sustainanbility; Sheate, W.R., Ed.; World Scientific Publishing: Singapore, 2010; pp. 389–410. [Google Scholar]
  38. Issa, I.I.; Pigosso, D.C.A.; McAloone, T.C.; Rozenfeld, H. Leading product-related environmental performance indicators: A selection guide and database. J. Clean. Prod. 2015, 108, 321–330. [Google Scholar] [CrossRef]
  39. Rahdari, A.H.; Anvary Rostamy, A.A. Designing a general set of sustainability indicators at the corporate level. J. Clean. Prod. 2015, 108, 757–771. [Google Scholar] [CrossRef]
  40. Veleva, V.; Ellenbecker, M. Indicators of sustainable production: Framework and methodology. J. Clean. Prod. 2001, 9. [Google Scholar] [CrossRef]
  41. Shields, D.J.; Šolar, S.V.; Martin, W.E. The role of values and objectives in communicating indicators of sustainability. Ecol. Indic. 2002, 2, 149–160. [Google Scholar] [CrossRef]
  42. Arena, M.; Ciceri, N.D.; Terzi, S.; Bengo, I.; Azzone, G.; Garetti, M. A state-of-the-art of industrial sustainability: Definitions, tools and metrics. Int. J. Prod. Lifecycle Manag. 2009, 4, 207. [Google Scholar] [CrossRef]
  43. Muthu, S.S. Handbook of Sustainable Apparel Production; CRC Press: Boca Raton, FL, USA, 2015. [Google Scholar]
  44. O’Connor, M.P.; Zimmerman, J.B.; Anastas, P.T.; Plata, D.L. A strategy for material supply chain sustainability: Enabling a circular economy in the electronics industry through green engineering. ACS Sustain. Chem. Eng. 2016, 4, 5879–5888. [Google Scholar] [CrossRef]
  45. Fernandes, P.T.; Canciglieri Júnior, O.; Sant’Anna, Â.M.O. Method for integrated product development oriented to sustainability. Clean Technol. Environ. Policy 2017, 19, 775–793. [Google Scholar] [CrossRef]
  46. EC. Internal Market, Industry, Entrepreneurship and SMEs. Eur. Comm. 2019. Available online: https://ec.europa.eu/growth/smes/business-friendly-environment/sme-definition_en (accessed on 11 November 2019).
  47. McAloone, T.C. Industry Experiences of Environmentally Conscious Design Integration: An Exploratory Study. Ph.D. Thesis, Cranfield University, Bedford, England. Academic Year 1998.
  48. EC. Regulation (EC) No. 2037/2000 of the European Parliament and of the Council of 29 June 2000 on Substances that Deplete the Ozone Layer; European Parliament: Brussels, Belgium, 2000; pp. 1–24. [Google Scholar]
  49. Veleva, V.; Hart, M.; Greiner, T.; Crumbley, C. Indicators of sustainable production. Clean. Prod. 2001, 9, 447–452. [Google Scholar] [CrossRef]
  50. ISO 14033. Environmental Management—Quantitative Environmental Information—Guidelines and Examples; ISO: Geneva, Switzerland, 2019. [Google Scholar]
  51. Mesa, J.; Esparragoza, I.; Maury, H. Developing a set of sustainability indicators for product families based on the circular economy model. J. Clean. Prod. 2018, 196, 1429–1442. [Google Scholar] [CrossRef]
  52. Grimaud, G.; Perry, N.; Laratte, B. Decision Support Methodology for Designing Sustainable Recycling Process Based on ETV Standards. Procedia Manuf. 2017, 7, 72–78. [Google Scholar] [CrossRef]
  53. Badurdeen, F.; Shuaib, M.A.; Lu, T.; Jawahir, I.S. Sustainable Value Creation in Manufacturing at Product and Process Levels: A Metrics-Based Evaluation. In Handbook of Manufacturing Engineering and Technology; Springer: London, UK, 2015; pp. 3343–3375. [Google Scholar] [CrossRef]
  54. Gibson, R.B.; Hassan, S.; Holtz, S.; Tansey, J.; Whitelaw, G. Sustainability Assessment: Criteria, Processes and Applications; Earthscan: London, UK, 2005. [Google Scholar]
  55. Cayzer, S.; Griffiths, P.; Beghetto, V. Design of indicators for measuring product performance in the circular economy. Int. J. Sustain. Eng. 2017, 10, 289–298. [Google Scholar] [CrossRef] [Green Version]
  56. Stewart, R.; Niero, M. Circular economy in corporate sustainability strategies: A review of corporate sustainability reports in the fast-moving consumer goods sector. Bus. Strateg. Environ. 2018, 27, 1005–1022. [Google Scholar] [CrossRef] [Green Version]
  57. Elia, V.; Gnoni, M.G.; Tornese, F. Measuring circular economy strategies through index methods: A critical analysis. J. Clean. Prod. 2017, 142, 2741–2751. [Google Scholar] [CrossRef]
Figure 1. Conceptual framing of the procedure development process.
Sustainability 12 00951 g001
Figure 2. The abstract representation of the ‘Leading performance indicator database’ layout (a) and indicator pre-selection logic (b).
Sustainability 12 00951 g002
Figure 3. The final version of the indicator selection procedure—enhanced after empirical application, with key steps and elaborated activities.
Sustainability 12 00951 g003
Figure 4. Overview of activities and outcomes of the procedure application in Company 1.
Sustainability 12 00951 g004
Table 1. List of recommendations as identified in the literature and how they were translated into specific features during the development process of the procedure.
RecommendationsReferencesExplanationAdopted Feature
Reduce uncertainty of what has be measured[25]Establish a pool of indicators suitable for the exact assessment scopeThe procedure entails application of the ‘Leading performance indicator database’, where each indicator is classified according to various circular economy strategies, business processes and TBL aspects
Dynamic and reflective process[26,37,38]Support dynamic and open-ended selection process, focusing on the process rather than on resultsThe procedure encourages the user to work with indicator selection in an iterative way, by encouraging to define a scope, select indicators, review indicators, and align the selection with the scope
Support review of indicators [38]Provide guidance for the review of individual indicators The guiding questions have been developed to support the procedure of indicator review, evaluation, creation and customization
Indicator number[39,40]Ensure indicator set is manageable yet provides a solid basis for decision-makingThe procedure leads the user to defining the final set of indicators that is relevant for the screening scope yet limited to the key indicators that can support decisions
Indicator application[36]Ensure the information about indicator is sufficient to apply and interpret itThe procedure entails application of the ‘Leading performance indicator database’, where each indicator has a formula, units and purpose of measurement registered
Table 2. Summary of the key recommendations to improve the procedure based on the empirical application.
RecommendationsCase Company ExplanationAdopted Feature
C1C2C3
Strategic consideration Ensure alignment of lower level performance indicators with corporate sustainability objectivesNot adopted in the current procedure
Scope definition Ensure the scope is defined before proceeding to the indicator selectionIntroduction to the procedure highlights the importance of having a defined CE initiative prior indicator selection process. Furthermore, practical examples on how to construct CE configurations for selected CE initiatives are given in Step 1
Baseline identificationEnsure identification and explanation of a baseline scenarioThe recommendation to define the baseline scenario in order to encourage scenario comparison on the basis of the selected indicators is given is Step 1
Multidisciplinary team Ensure the experts with relevant expertise are involved in the indicator selection and evaluation processIntroduction to the procedure highlights involvement of actors with relevant expertise for indicator selection, evaluation and customization process
Triple bottom line aspect navigationSupport flexible (de)selection of relevant triple bottom line aspects to reduce complexityThe recommendation in Step 2 was introduced to allow for prioritization of sustainability aspects, thus reducing the complexity by simultaneously operating with too many indicators and sustainability aspects
Indicator numberProvide a recommendation about the number of indicators in the final setStep 3 indicates the recommended number of indicators to be included in the final set
Account trade-offs Provide a recommendation about how to address trade-offs between indicatorsNot adopted in the current procedure
Table 3. Comparison of present research with similar works based on a range of criteria.
ReferenceConsiders all dimensions of sustainabilityConsiders a variety of circular economy strategiesConsiders a variety of business processesConsiders a life cycle perspectiveEncourages a dynamic indicator selection processPresents a practical application in industry
Present research- *
[51]-
Only environmental
-
Only product development
--
[52]-
Limited to recycling
-
Only end of life process
---
[38]-
Only environmental
--
Only product development
[53]--
Only product development and manufacturing process
-

