Article

Spatial Evolution and Critical Factors of Urban Innovation: Evidence from Shanghai, China

1
Department of Urban Planning, College of Architecture and Urban Planning, Tongji University, Shanghai 200092, China
2
Senseable City Lab, Massachusetts Institute of Technology, Cambridge, MA 02139, USA
*
Author to whom correspondence should be addressed.
Sustainability 2020, 12(3), 938; https://doi.org/10.3390/su12030938
Submission received: 2 January 2020 / Revised: 21 January 2020 / Accepted: 23 January 2020 / Published: 27 January 2020

Abstract

:
The critical role of urban innovation in sustaining urban economic resilience has been widely acknowledged by scholars. Yet there is far from a full spectrum of understanding about how innovation performs, despite China’s innovation outputs having far outweighed most countries’. The perennial concern regarding the spatial patterns of innovation has been biased towards the macroscale, and long-standing efforts to explore the determinants of innovative vitality are focused on internal factors (e.g., research and development activities, and firm size). Considering these inadequacies, this research investigates how innovative activities are spatially distributed and how the pattern evolves in cities at the microscale, and examines influencing factors of the external environment. The patent data from 2000 to 2015 in Shanghai are geocoded and mapped into 1 km2 hexagon grids to identify local clustering. Gini coefficient is computed to show the high concentration of innovation activities across space. The hot spot analysis based on the Getis–Ord (Gi*) statistic shows that innovation exhibits a strong concentration propensity at the microscale and gradually moves toward a polycentric pattern. However, the extent of concentration decreases over the study period. Firms dictate innovation activities, and individuals and universities also play a role in downtown innovation growth. The regression using random effect model shows heterogeneous effects on different innovation actors. The overall urban innovation output, dominated by firms, is significantly influenced by public budget expenditures and green space areas. The science and technology grant has a positive impact on authorities but not university and research institutes. This research not only contributes to a methodological innovation for measuring and visualizing an innovation pattern but also enriches our understanding of spatial evolution and critical factors of innovation activities in urban China.

1. Introduction

In the post-crisis era, there has been a paradigm shift from sustainability to resilience discourse given that the latter provides a better fit for an imbalanced world. Due to the very fast changes and flexibility in contemporary “liquid” society, cities are unambiguously unpredictable and complicated systems that neither the laws of economics nor mechanics alone can well explain [1,2,3]. Numerous updated studies suggest that innovation performance is critical to complex urban economic resilience, which determines the city’s potential to cope with “disturbance” in financial tsunamis [4,5,6]. Yet, while China’s innovation outputs have far outweighed most countries, there is far from a full spectrum of understanding about how innovation spatially evolves and what factors determine such evolution in Chinese cities. The perennial concern regarding spatial characteristics has been biased towards the macroscale. By contrast, innovation spatial patterns at the microscale (e.g., within cities) remains unclear. The long-standing effort around the determinants of innovative vitality is focused on exploring internal research and development (R&D) activities, firm size, structure and management capability [7,8], with insufficient attention to the importance of the external environment.
Innovation is a complex process that involves the interactions of multiple actors. Industry or technology classification has offered considerable evidence in studies on innovative activities [9,10,11]. However, the manner in which various actors perform in innovation production, particularly in developing countries, is not well understood [12,13]. Firms are important in industrial upgrading and innovation production [14]. Nevertheless, such recognition ‘downplays the influence of non-firm actors, institutions and public policy in creating and/or renewing industrial development paths in a region’ [15]. Simmie argues that in addition to firms, ‘knowledgeable pioneering individuals, universities, companies and/or governments’ will all participate in the creation of a new path [16]. Thus, only an actor-based approach can enrich a firm-centred research perspective. As subcategories of innovative actors, firms, individuals, universities and authorities are highlighted in the current study.
As an emerging global market that endeavours to consolidate innovation strength, China has issued numerous innovation policies that have produced far-reaching impacts on the local innovation trajectory for the past decades [17]. The shift from a pure science and technology (S&T) innovation strategy to a coordinated and innovation-oriented technology initiative has expanded the domain of the sector’s innovation. In addition, China’s medium- and long-term plans for the development of S&T (2006–2020) and its policy package have prioritised large cities in the innovation race [18]. Against this backdrop, the current work deciphers the spatial heterogeneity and influential factors of Shanghai’s innovation using patents as proxy. Noteworthy, patents are incapable of representing all-type innovation given that patents are frequently viewed as output of high-tech industries, e.g., IT, medicine, biotechnology and aerospace. It maps the spatiotemporal evolution of the innovation landscape from 2000 to 2015. Moreover, it aims to identify places with a high intensity of innovation activities through the Getis–Ord (Gi*) statistic. Furthermore, regression analysis is conducted to test the impact of various social, economic, environmental and institutional factors on the innovation process.

2. Literature Review

2.1. Spatial Characteristics of Urban Innovation

The spatial characteristics of the geographical concentration of industrial activities have long been a focus in the literature on economic geography [9,10]. Polarization and agglomeration as two types of spatial process result from cumulative growth and explain the concentration of industrial activities in certain areas. Based on the “High Development Theory” and the existence of increasing returns to scale in industry, “polarization” [19,20] considers concentration from the perspective of economic development while “agglomeration” [21], with a closer relation to new economic geography, views concentration more from a spatial perspective. Scholars have universally acknowledged that the degrees of such geographic clustering may vary among different types of industrial activities [22]. With the advent of the knowledge-based economy, the spatial characteristics of innovative activities have elicited the interest of researchers, who naturally turn to traditional industrial activities for comparison. As a research premise rather than a research question, the concentration of innovative activities can be measured from two contrasting perspectives [23]. From an input perspective, venture capitalists act as crucial Schumpeterian financiers who connect new process innovations with division of labour, enabling the measurement of the geographical variation of commercially relevant innovations [24,25]. Capitals circulate between a discrete set of regions (e.g., from hot money pouring into New York to technology-advanced Silicon Valley) and are network-based to support the localisation of financialisation [26]. From an output perspective, patents that conjoin the underlying ‘technological infrastructure’ and actual ‘knowledge production’ have been acknowledged as valid data for measuring the capability of local R&D [27,28]. Benefitting from the availability and integrality of data sources, patent data are widely applied to existing studies [11,29,30,31,32,33]. The Herfindahl–Hirschman index, Gini coefficients and Ellison–Glaeser index are frequently estimated to measure the concentration levels of patents [10,11]. These nonspatial methods can quantify the relative strength of knowledge and technology flows. Patents represent the capability to produce new inventions, and thus innovative activities measured through patents primarily refer to high-tech industries with intensive R&D activities; these industries differ from knowledge-intensive business service (KIBS) industries [34].
Evidence from studies on advanced economies indicates that innovative activities measured through patents are considerably more clustered than other types of industrial activities [35]. A possible explanation acknowledged by a number of researchers is that tacit knowledge, which is the key to innovation production, is confined to informal face-to-face communication and cannot travel long distances [36,37]. Thus, while knowledge spillover is capable of inducing the diffusion of innovative activities, it has geographic limits and a skewed spatial concentration because the unbalanced growth of innovative activities is unavoidable. In reality, this scenario is reflected in the concentration of innovative activities in populated and industrially advanced megacity regions for easy access to global networks, innovative talents and knowledge flows [32,38,39,40]. Notably, these studies have focused on innovative spatial patterns at the continental [31,32], national [11,30,33] or regional [29] scales, with only a few enquiring into how innovative activities are distributed within a city. This constraint results from the limits of data accuracy and the issues of spatial unit selection in statistics. That is, researchers have not yet obtained a full spectrum of the urban-scale characteristics of innovative activities using patent data. This inadequacy should be addressed because cities are arguably the ultimate enabler of innovation, entrepreneurship and growth at present, wherein a place is used to substitute corporations, becoming the key organising units in the modern-day knowledge economy [41].
The preceding studies have indicated that innovation is clustered at the macro level. However, the uncertainties and randomness of innovative activities [42] result in a complex spatial distribution at the micro level. In general, high-tech innovative firms have a different spatial preference from KIBS firms, i.e., the latter favours city centres, particularly central business districts [43,44]. By contrast, the former are prone to locate in suburbs or even rural areas [25,45]. Nevertheless, discernible trends in several advanced economies have shown that KIBS firms have moved outward to suburban centres, called ‘concentrated decentralisation’ [26,27,28,29,30,31,32,33,34,35,36,37,38,39,40,41,42,43,44,45,46,47,48], and R&D-intensive high-tech firms have started to return downtown in the post-crisis era, giving rise to the ‘innovative district’ [49,50]. Moreover, the significant role of spatial proximity in innovation production has been questioned in recent years. On the one hand, several scholars believe that with the improvement of transportation and information and communications technology, knowledge flows will be less sensitive to distance, labeled as ‘death of distance’ [51]. On the other hand, over-proximity can potentially ‘fossilise’ and lock innovation in path dependency [52].
In brief, if innovative activities are measured through patents, do they exhibit similar strong concentration propensity within a city? Where are they located and how do they spatially evolve? If doubts about spatial proximity are sensible, then can we reasonably assume that decentralisation innovation overwhelms the concentration trend at the urban scale? These unclear issues in the extant literature have motivated us to raise the first research question as follows:
RQ1. How are innovative activities spatially distributed and how do they evolve within a city?
Sub-RQ1.1. Do innovative activities tend to concentrate over time? How?
Sub-RQ1.2. Where do they concentrate: In the city centre or the suburb area?
Sub-RQ1.3. What are the spatiotemporal patterns of innovative activities promoted by different actors (firm, individual, university and authority)?

2.2. Influential Factors of Urban Innovation

Innovation not only is an academic research and industrial practice but has also cropped up as an important concept in public policy domain [53]. Almost every type of public policy has either direct or indirect impact on innovative activities [54]. Therefore innovation is not solely achieved through internal R&D activities influenced by firm size, structure and management capability. It is also facilitated by the external environment, such as economic strength, talent mobility, human capital and institutions [13,55,56]. As cities and regions become the key units in organising the innovation activities of a diverse array of firms, individuals, universities and authorities, the influences of urban and regional development on innovative vitality should be explored. Indicators that can measure urban and regional development are multidimensional, and their interrelation with innovation has been extensively discussed.
Population is the primary source of human capital, and the composition of the regional talent base is closely associated with individual innovative activities in North America and Europe [57,58]. Innovative vitality is related to population diversity and can be advanced by immigration [59,60]; that is, the openness of an area to outsiders is essential for innovative production. The recognition of the close connection between innovation and economic growth can date back to the early 1900s [61,62]. Scholars have widely endorsed the economic growth and technical advancement that are central to innovation, are disruptive to evolution and are mutually reinforcing in bursts and cycles [63]. Innovation also has a positive impact on economic growth, through lifting up productivity across the economy [53]. In the current study, we propose that public budget expenditure should represent economic development because, in growth-oriented countries, particularly China, public budget expenditure reflects the government’s investment in social development, which is essentially linked to economic performance [64]. Public budget expenditure is a non-market investment, including fixed asset investment and diverse subsidies to firms. This notion is important because economic development is becoming increasingly socially related at present. Industrial structure and output can also be related to innovative opportunities [65]. Institutions and public policies play important roles in creating new paths towards innovation in recent years [14,15]. This phenomenon is highly evident in developing countries wherein bureaus spare no effort to invest in S&T. While green aesthetics through decorating cities with plants or grasses has been widely used by professional designers and architects to boost creativity and encourage innovation of urban talents, whether and how green environment contribute to innovative vitality remain inadequately understood. The popular concept “green innovation” means more energy-saving, pollution-prevention, waste recycling, green product designs or corporate environmental management by innovation [66], but rarely showcases to what extent environment matters in innovation. Engaging environmental dimensions thus is required and can provide an enhanced understanding of innovation–urban relations. Accordingly, the second research question is proposed as follows:
RQ2. How do urban innovation activities interrelate with urban development in China, particularly population, migrants, public budget expenditure, industrial output, green space and local investment in S&T?

3. Data and Methods

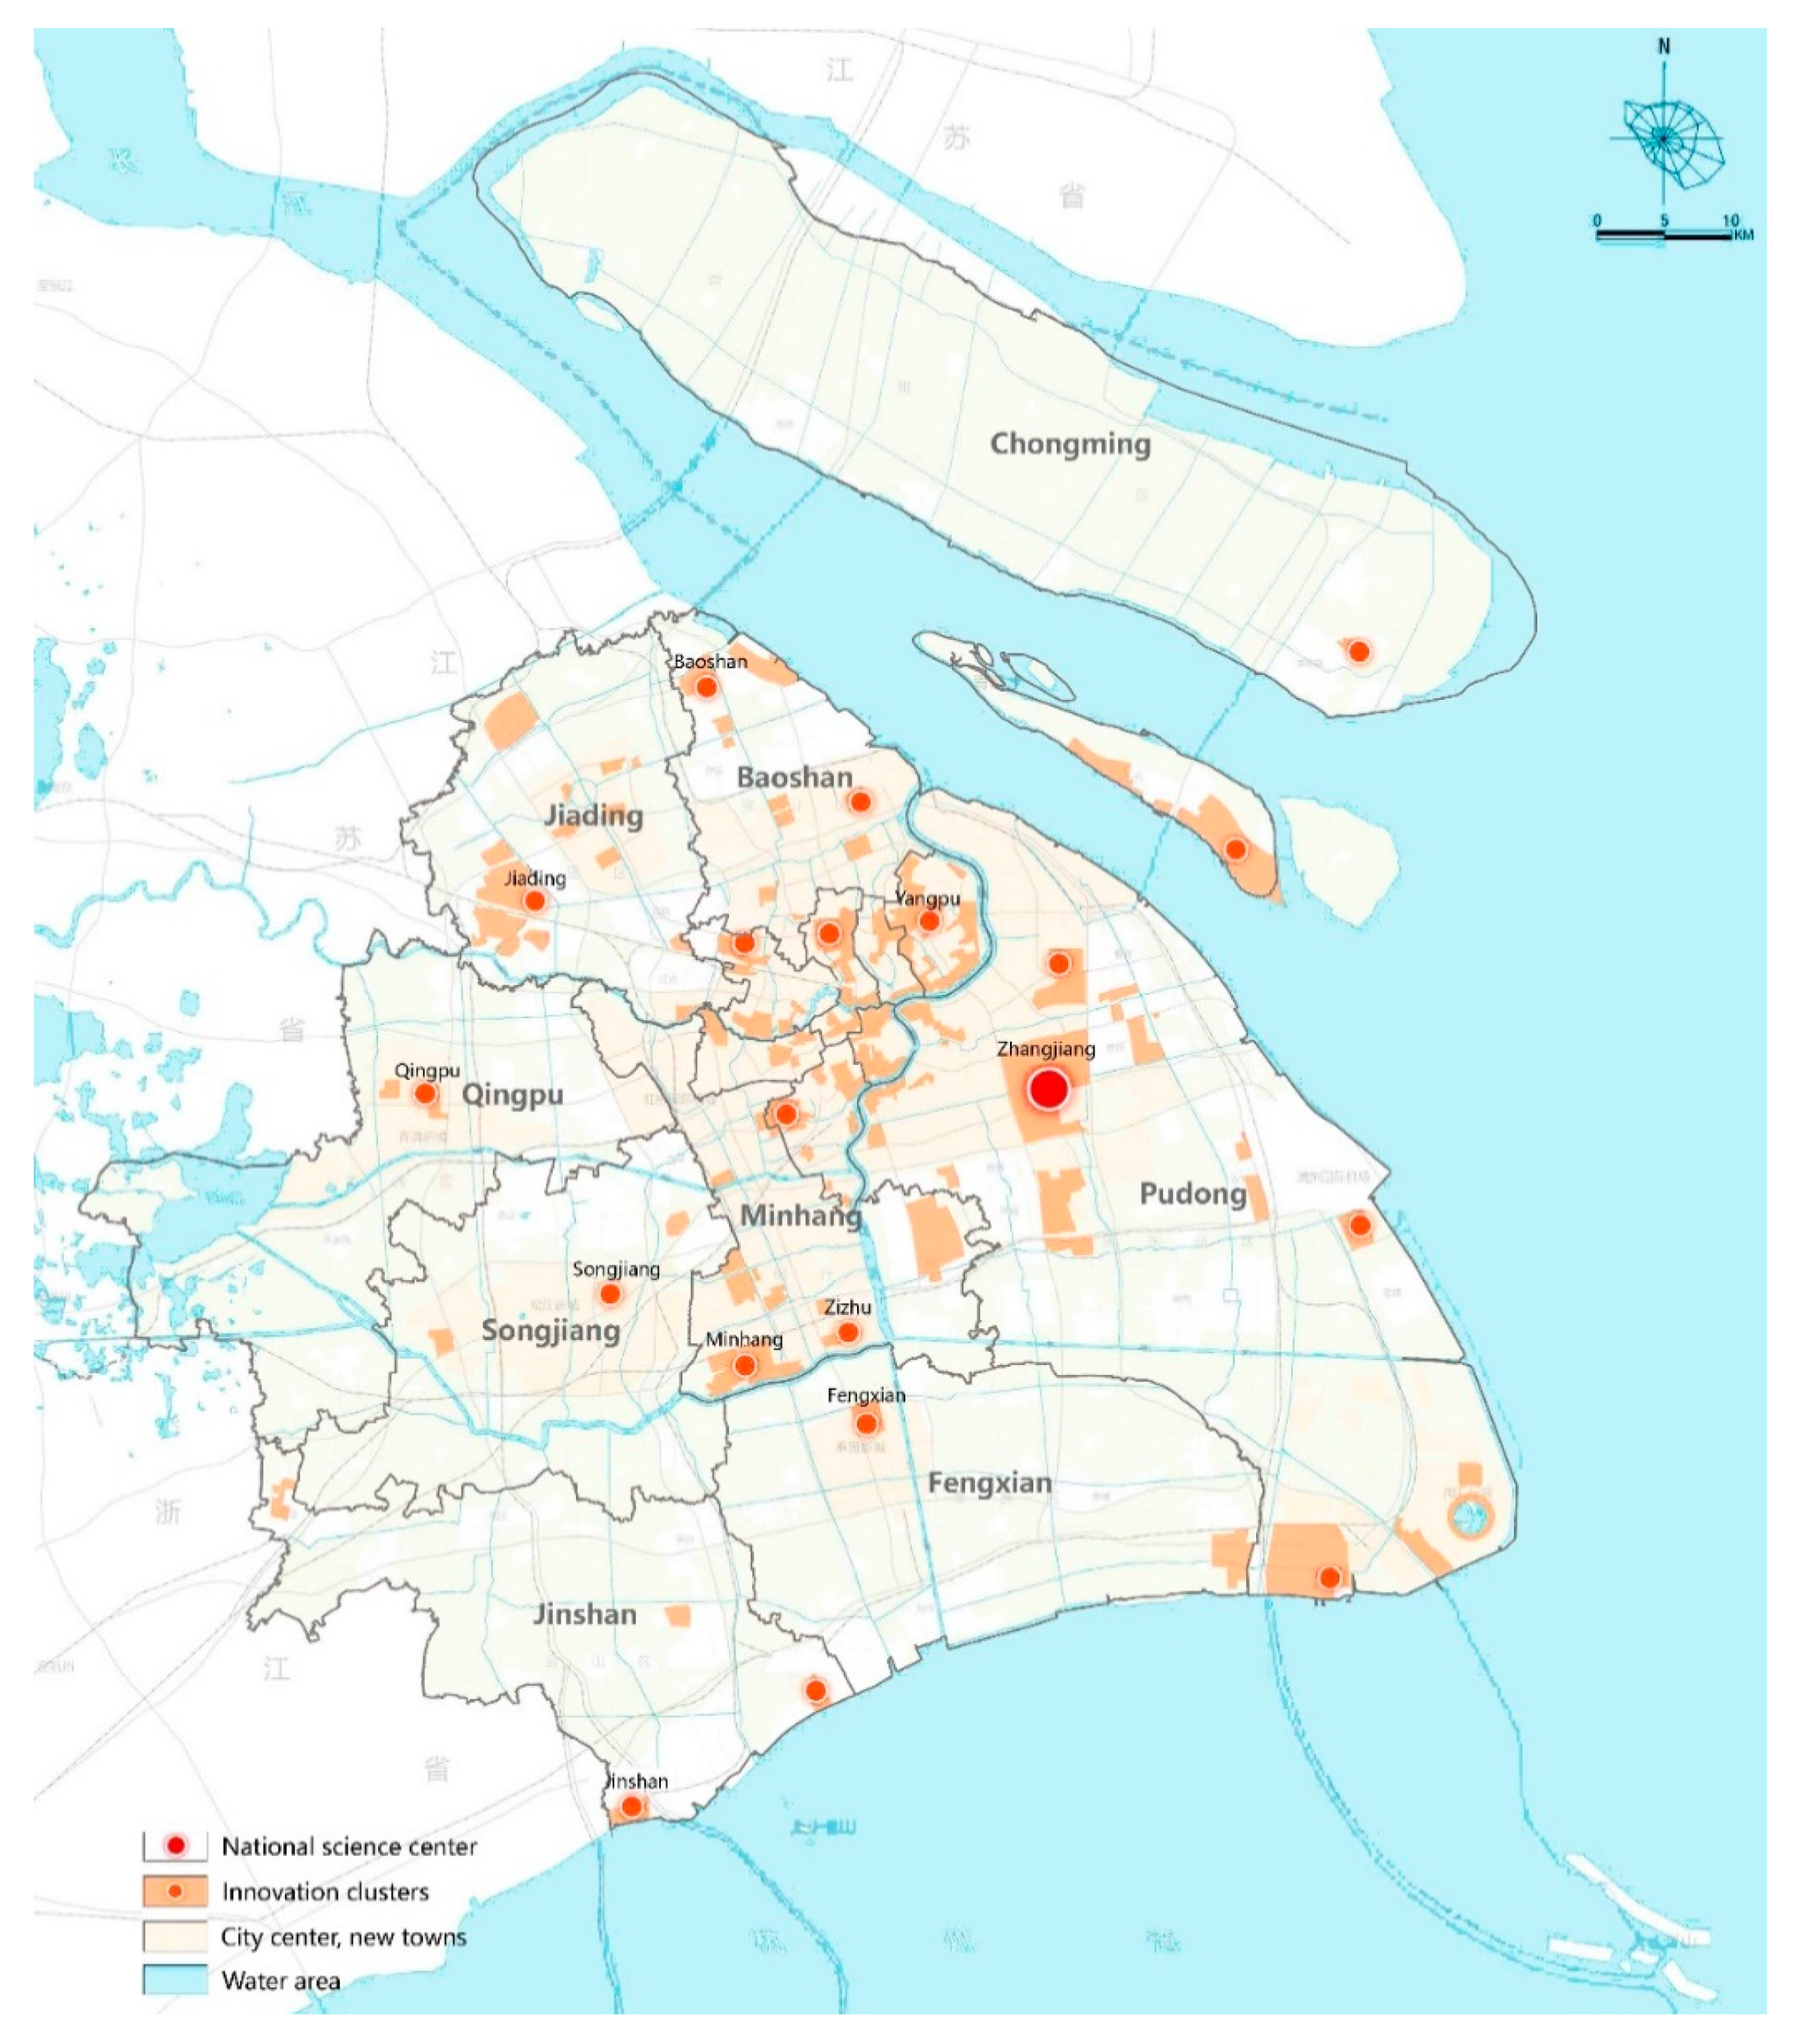
3.1. Study Area and Data

This study selects Shanghai, one of the fast-growing dense cities in China, as the study area to identify micro-level clustering and the innovation mechanism. As a rising global city, Shanghai is the location of diverse multinational research centres and has been witness to vibrant innovation fostered by the central embrace of ‘indigenous innovation capacities’, the local articulation of ‘global science and technological innovation centres’ and the global spillover of R&D [17] (Figure 1). To examine how innovative activities perform within Shanghai, we conduct an analysis in two scales: (1) A sub-city mesoscale across 16 districts to reflect administrative division-based patterns and (2) an intra-city microscale using 1 km2 hexagon grids to identify micro-clustering characteristics. We use the patent data from the State Intellectual Property Office with application addresses in Shanghai to focus on high-tech firms with intensive R&D (Figure 2). The number of annual patent applications surged from approximately 9000 in 2000 to more than 90,000 in 2015. Firms are the major sources of patents and account for more than 60% of the total number, followed by university and research institutes, which contribute 10% to 20%. Individuals account for considerably less, with the proportion reduced from over 15% to less than 5%. Authorities refer to non-research-oriented public entities, such as governments, public schools and the military. Their contributions are minimal in recent years.
Our preliminary observation at the mesoscale indicates an uneven innovation growth pace for the past 16 years (Figure 3). Jinshan, Songjiang, Chongming and Fengxian, located on the outskirts, have increased over 35 times. Pudong, Jiading, Qingpu and Minhang, located in the inner suburbs, have grown more than 20 times. By contrast, the growth in the central city districts is less than seven times. The distribution of innovative activities across urban districts is also unbalanced. Pudong and Minhang, the two leading industrially developed districts, have ranked as the top two in terms of the total number of submitted patent applications. Xuhui and Yangpu, the two knowledge-intensive districts in the central city, have more than 70,000 records, and are ranked third and fourth, respectively. With top universities and research institutes, Xuhui and Yangpu illustrate how university–industry ties play a role in the development of micro-innovative clusters (e.g., Caohejing Hi-Tech Park). They considerably outweigh other districts in terms of innovation output per capita and per km2. In Xuhui, Shanghai Jiaotong University, East China University of Science and Technology and University of Shanghai for Science and Technology have expanded industry–university–research cooperation either by establishing an industrial base in nearby development zones or building strategic partnerships with competitive R&D firms. Yangpu’s innovation vibrancy owes much to its well-known knowledge circle, providing talent from universities (e.g., Fudan, Tongji, Shanghai University of Finance and Economics), hackerspaces and innovation platforms. Benefitting from university towns and industrial parks, Songjiang ranked fifth and has outstanding innovation output per billion gross domestic product (GDP), followed by Baoshan, Jiading and Qingpu. Overall, a preponderance of patent applications exists in the suburbs. Chongming, traditional Luwan, Jin’an and Hongkou are bottomlands of innovation but exhibit high potential. Apart from patents, we also use data from the Shanghai Municipal Statistical Bureau (Shanghai Statistical Yearbook 2004–2018) and the Shanghai Science and Technology Committee (Shanghai S&T Statistics Yearbook) to complement the analysis.

3.2. Research Methods

3.2.1. Spatial Analysis of Innovation Characteristics

The applicants’ addresses were geocoded using Baidu’s Map Geocoding API. The derived coordinates were then mapped onto a hexagon grid for analysis and visualisation. Each hexagon covers 1 km2; hence, the density of each grid is equal to its patent number.
(1) Average annual growth rate
To calculate the average annual growth rate of urban innovation in Shanghai since 2000, a log-linear least squares regression was applied to mitigate the sensitivity of the difference between the first and last years. Let y0 denote the total patent applications of the initial year and r denote the mean annual growth rate. The total number of patent applications in the ith year yi is as follows:
y i = y 0 ( 1 + r ) i
The logarithms of both sides is considered, i.e.,
ln y i = ln y 0 + i ln ( 1 + r )
Then, we perform linear regression with ln(yi) as the dependent variable and i as the independent variable. We obtain β as the coefficient of i. Then, the annual growth annual rate is as follows:
r = e β 1
.
(2) Gini coefficient
To determine the extent of the spatial concentration and dispersion of the innovation output, we calculate the annual Gini coefficient from 2000 to 2015 on the basis of the patent applications in each hexagon grid. The Gini index is originally used in economics to measure wealth inequality and is extended to measure the spatial distribution of economic activities [67]. It is denoted by
Gini = i j | x i x j | 2 n i x i
where n represents the number of hexagon grids. Gini ranges from 0 to 1, with 0 indicating a complete dispersion of patent activities and 1 denoting complete concentration. The higher the value, the more concentrated the innovative activities, and vice versa.
(3) Getis–Ord (Gi*) statistic
To identify innovation clustering intensity during urban development, we calculate the hot and cold spots of innovation spaces using the Getis–Ord (Gi*) statistic. Another commonly used method for cluster analysis is the local Moran’s I statistic proposed by Anselin [68]. Local Moran’s I statistic is able to distinguish spatial clusters (high or low values of concentrations) or outliers (a high value surrounded by low values or a low value surrounded by high values). This local statistic can reveal positive and negative spatial clusters when the values are categorized to the four quadrants in a Moran scatter plot. This work attempts to delineate spatial concentrations of innovation activities. Compared with local Moran’s I statistic, we think the Gi* statistic better serves our purpose in the hot spot analysis. A hot spot represents an identifiable location or a small area that displays a clustering of high values. By contrast, a cold spot refers to a clustering of low values. The patent applications in each geographic location are aggregated. However, a high- or low-value cluster is not necessarily a statistically significant hot or cold spot. To validate statistical significance, we perform a hot spot, i.e., Getis–Ord (Gi*) analysis. The general principle is to compare the local average with the global average. If a location exhibits a high value, along with the high values of its neighbours, then it will be considered a hot spot. The Gi* statistic evaluates the statistical significance of locations by comparing the local average of the location and its neighbours to the global average, yielding a Z score [69,70,71]. We map the hot spots of patent activities in Shanghai’s metropolitan area. The standardised Gi* statistic is calculated as
G i * = j ω ij x j x ¯ W s ( n j ω ij 2 W 2 ) n 1
where xi is the value of location i; x ¯ and s denote the sample mean and standard deviation, respectively; ωij = to 1 if i and j are neighbours and W = j ω ij . The Gi* statistic is a Z score. When the Gi* statistic is positive, the larger the value, the more intense the clustering of high values will be. When it is negative, the smaller the value, the more intense the clustering of low values will be. Thus, a clustering of the highest Gi* statistic is identified as an innovation centre.

3.2.2. Regression Analysis of Innovation–Urban Development Relations

Regression is used to analyse how urban development influences innovation. Several indicators, such as independent variables, are collected from yearbooks to represent the social, environmental and economic development in each district of Shanghai. To test their effects on innovation, patent records are aggregated for each district every year and used as dependent variables. After we construct the panel data or pooled cross-sectional time series data from 2005 to 2015, a random effect model (REM) is adopted to control for unobserved time-invariant district heterogeneity. REM assists in controlling for unobserved heterogeneity, which means, in our case, the spatial effect is partially captured by REM. Besides, compared with the fixed effect model, REM is found to better handle temporal autocorrelation and heteroscedasticity [72].
(1) Dependent and independent variables (shown in Table 1)
Innovation output from four types of actors, namely, firms, individuals, universities and authorities, is distinguished as dependent variables to offer a nuanced understanding of innovation in Table 1. Moreover, seven key factors are summarised as independent variables to capture the impact of urban development on the innovation process. The resident population is used to reflect human capital foundation, and migrants represent human capital flow. The general public expenditure is used as a surrogate for socioeconomic development, which exerts a positive effect on innovation. Gross industrial output is an important indicator of industrial economic scale. Green space, which is beneficial for physical and psychological health, is an indicator of urban construction level and environment quality. Green space is included to test the environmental effects. The area of green spaces is calculated in urban built-up areas, excluding woodland and cultivated land. Technology funding from S&T commissions and local authorities are also considered.
(2) Regression equation
As shown in the equation below, REM is adopted to examine the effects of various factors on the innovation process.
yi,t = b0 + bixi,t + ai + ei,t
The dependent variable, yi,t, represents the level of innovation output of district i at year t. xi,t represents all the independent variables explained in the last subsection. ai is a district-dependent variable that is used to capture unobserved heterogeneity, and ei,t is the error term.

4. Results and Discussion

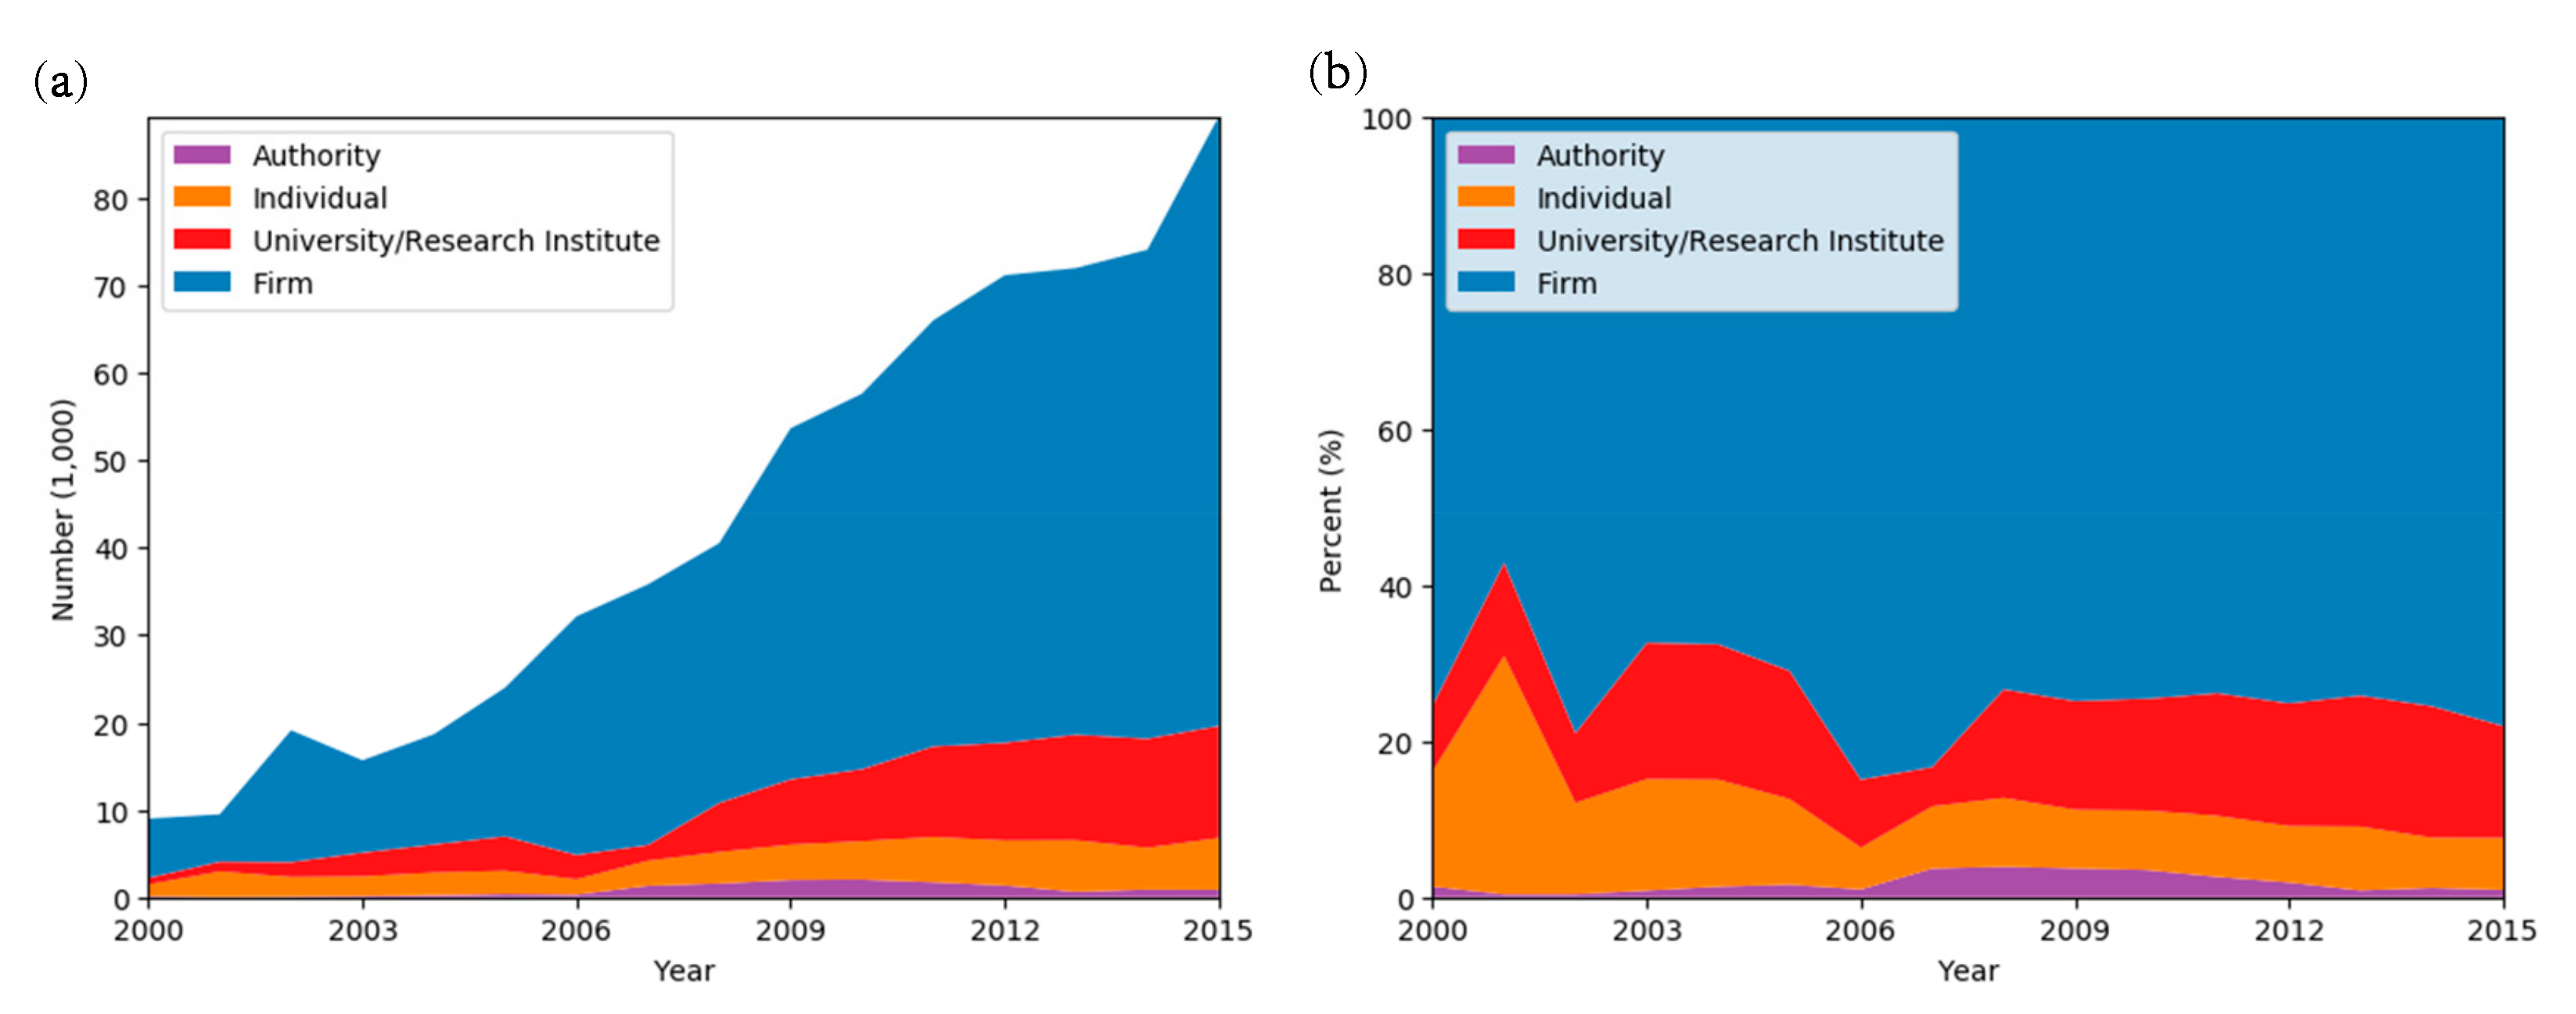
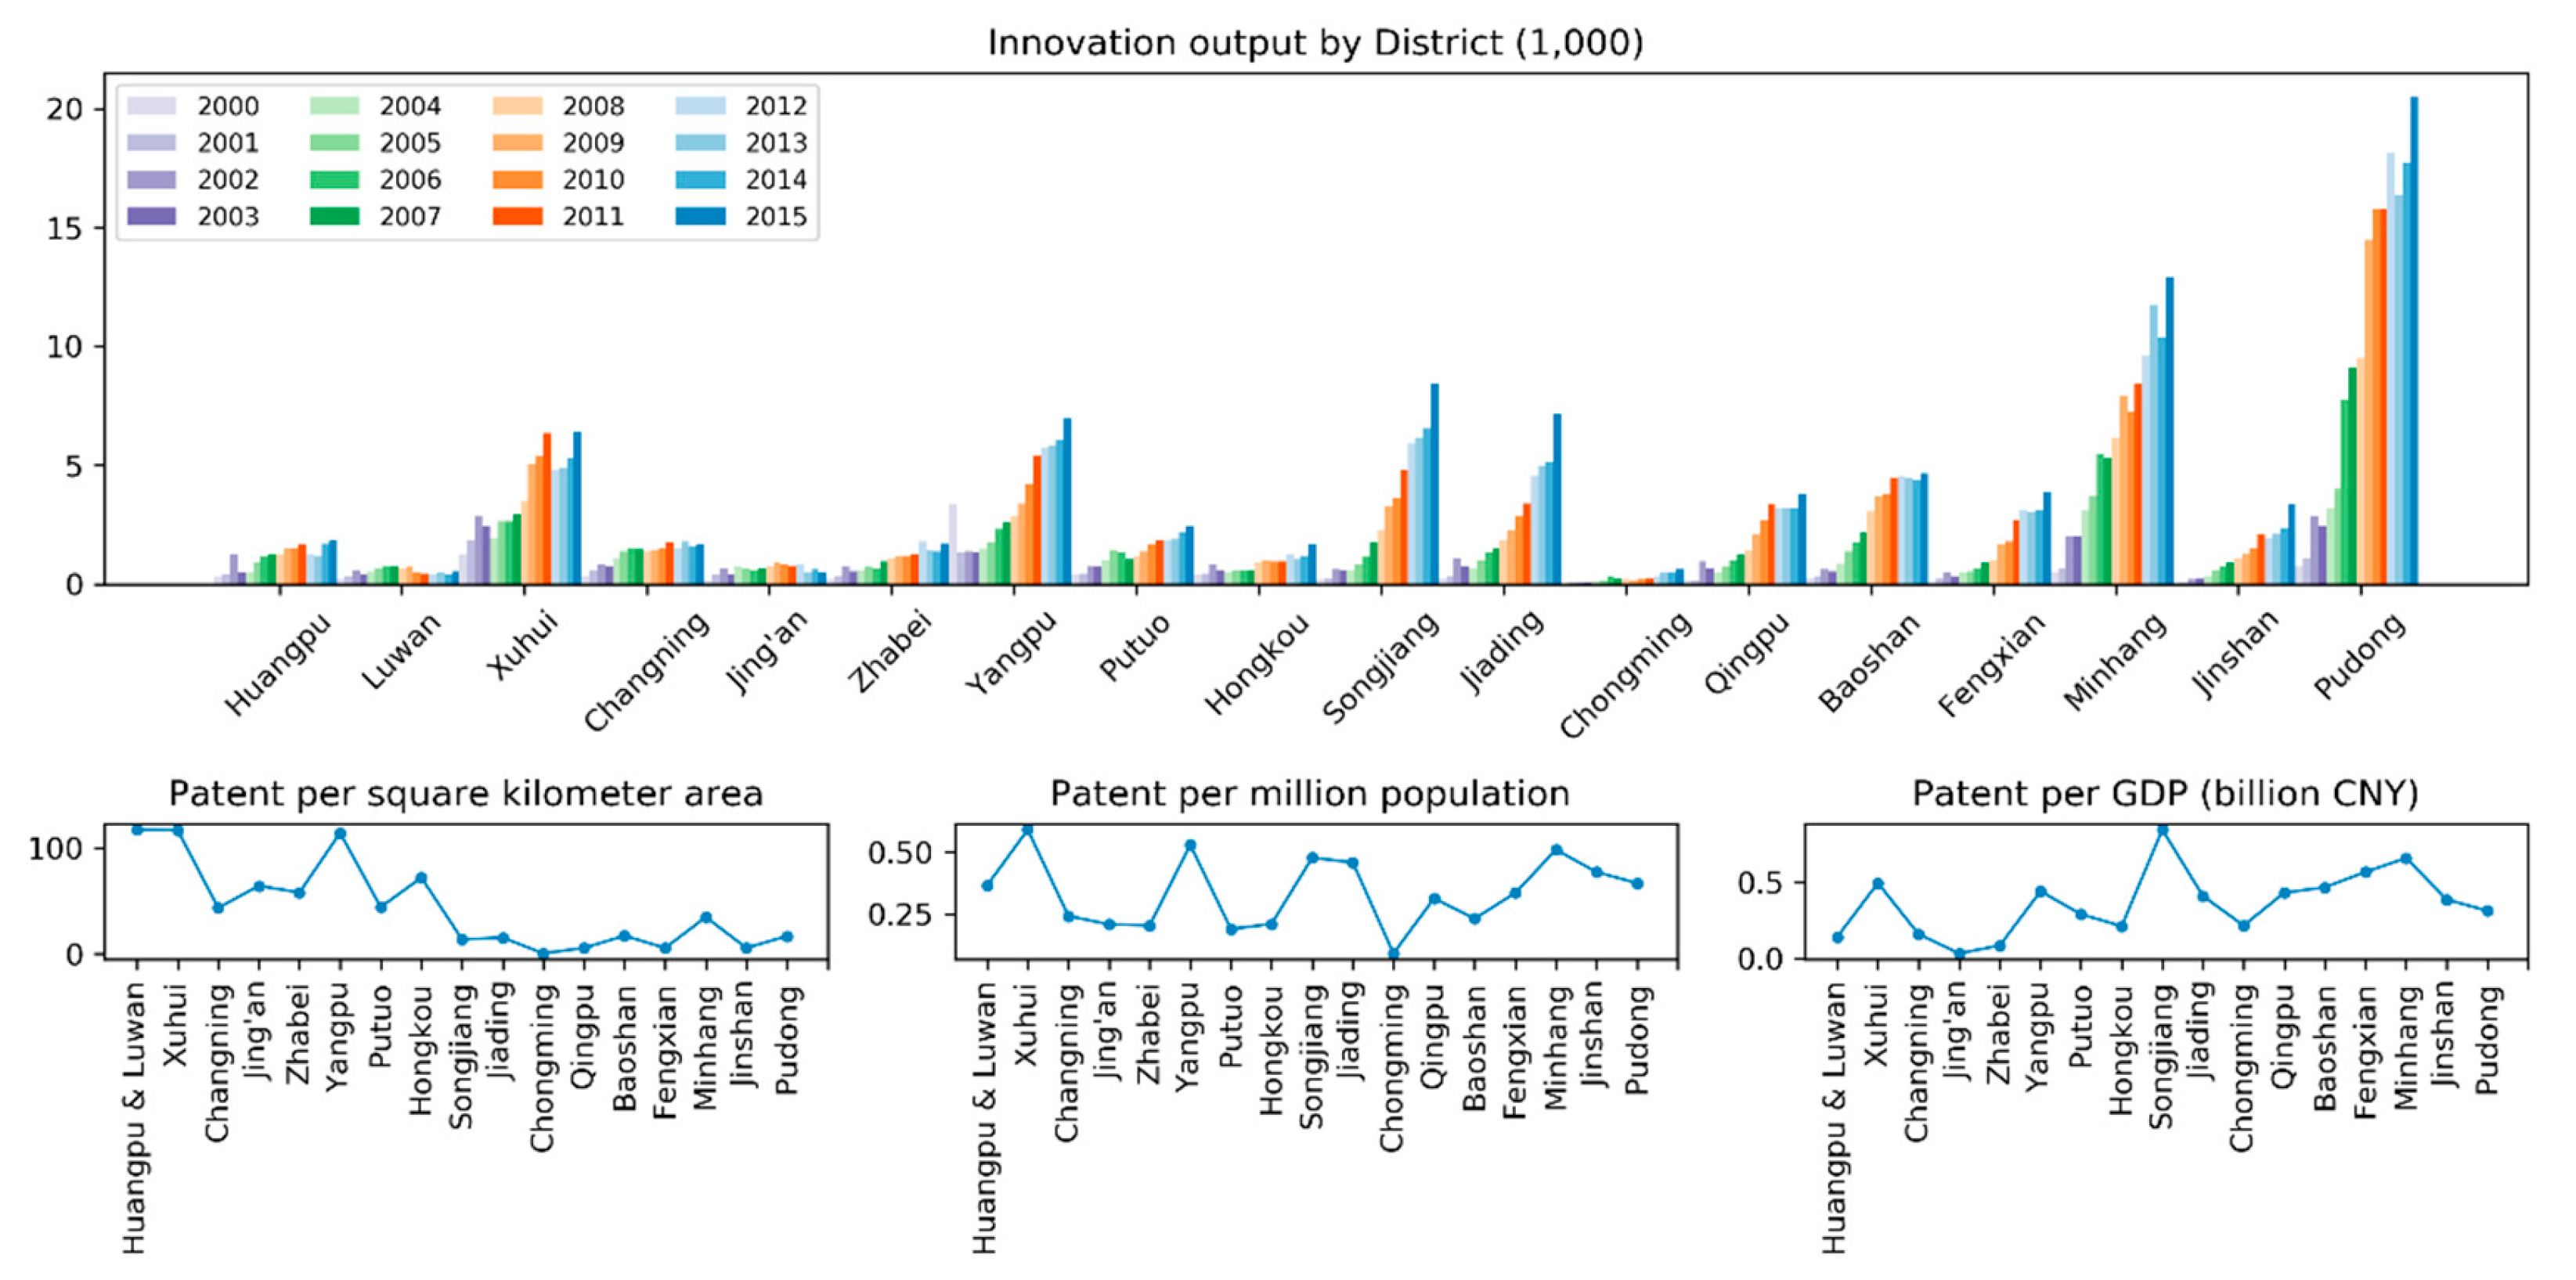
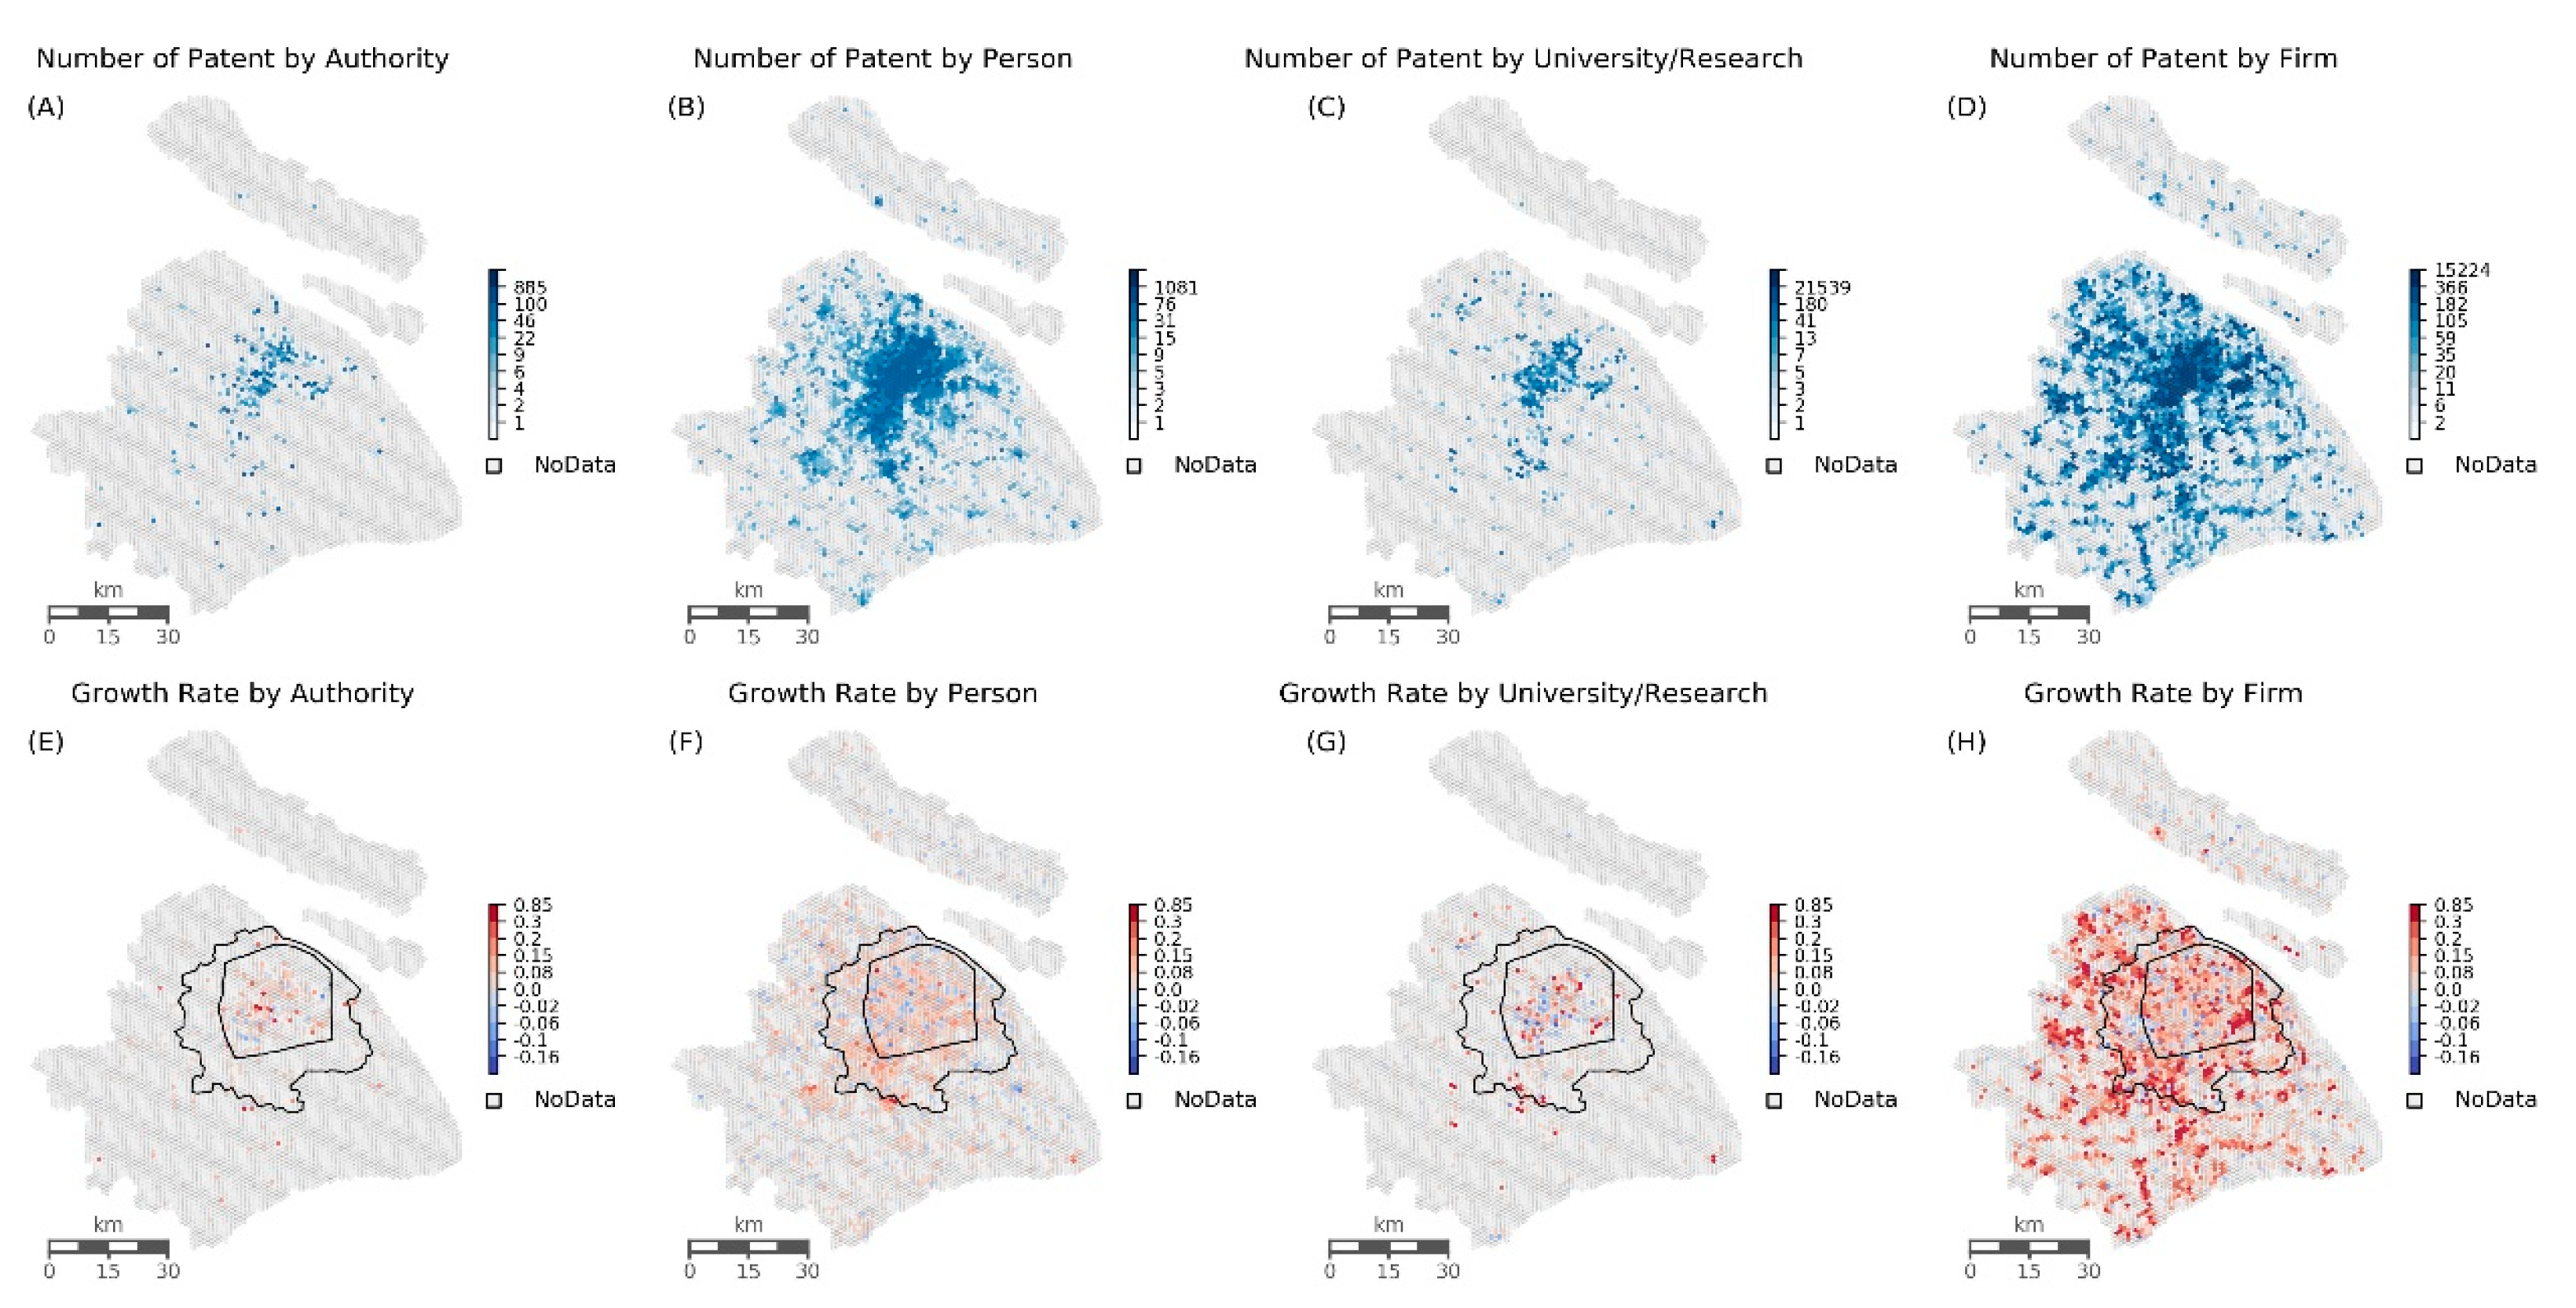
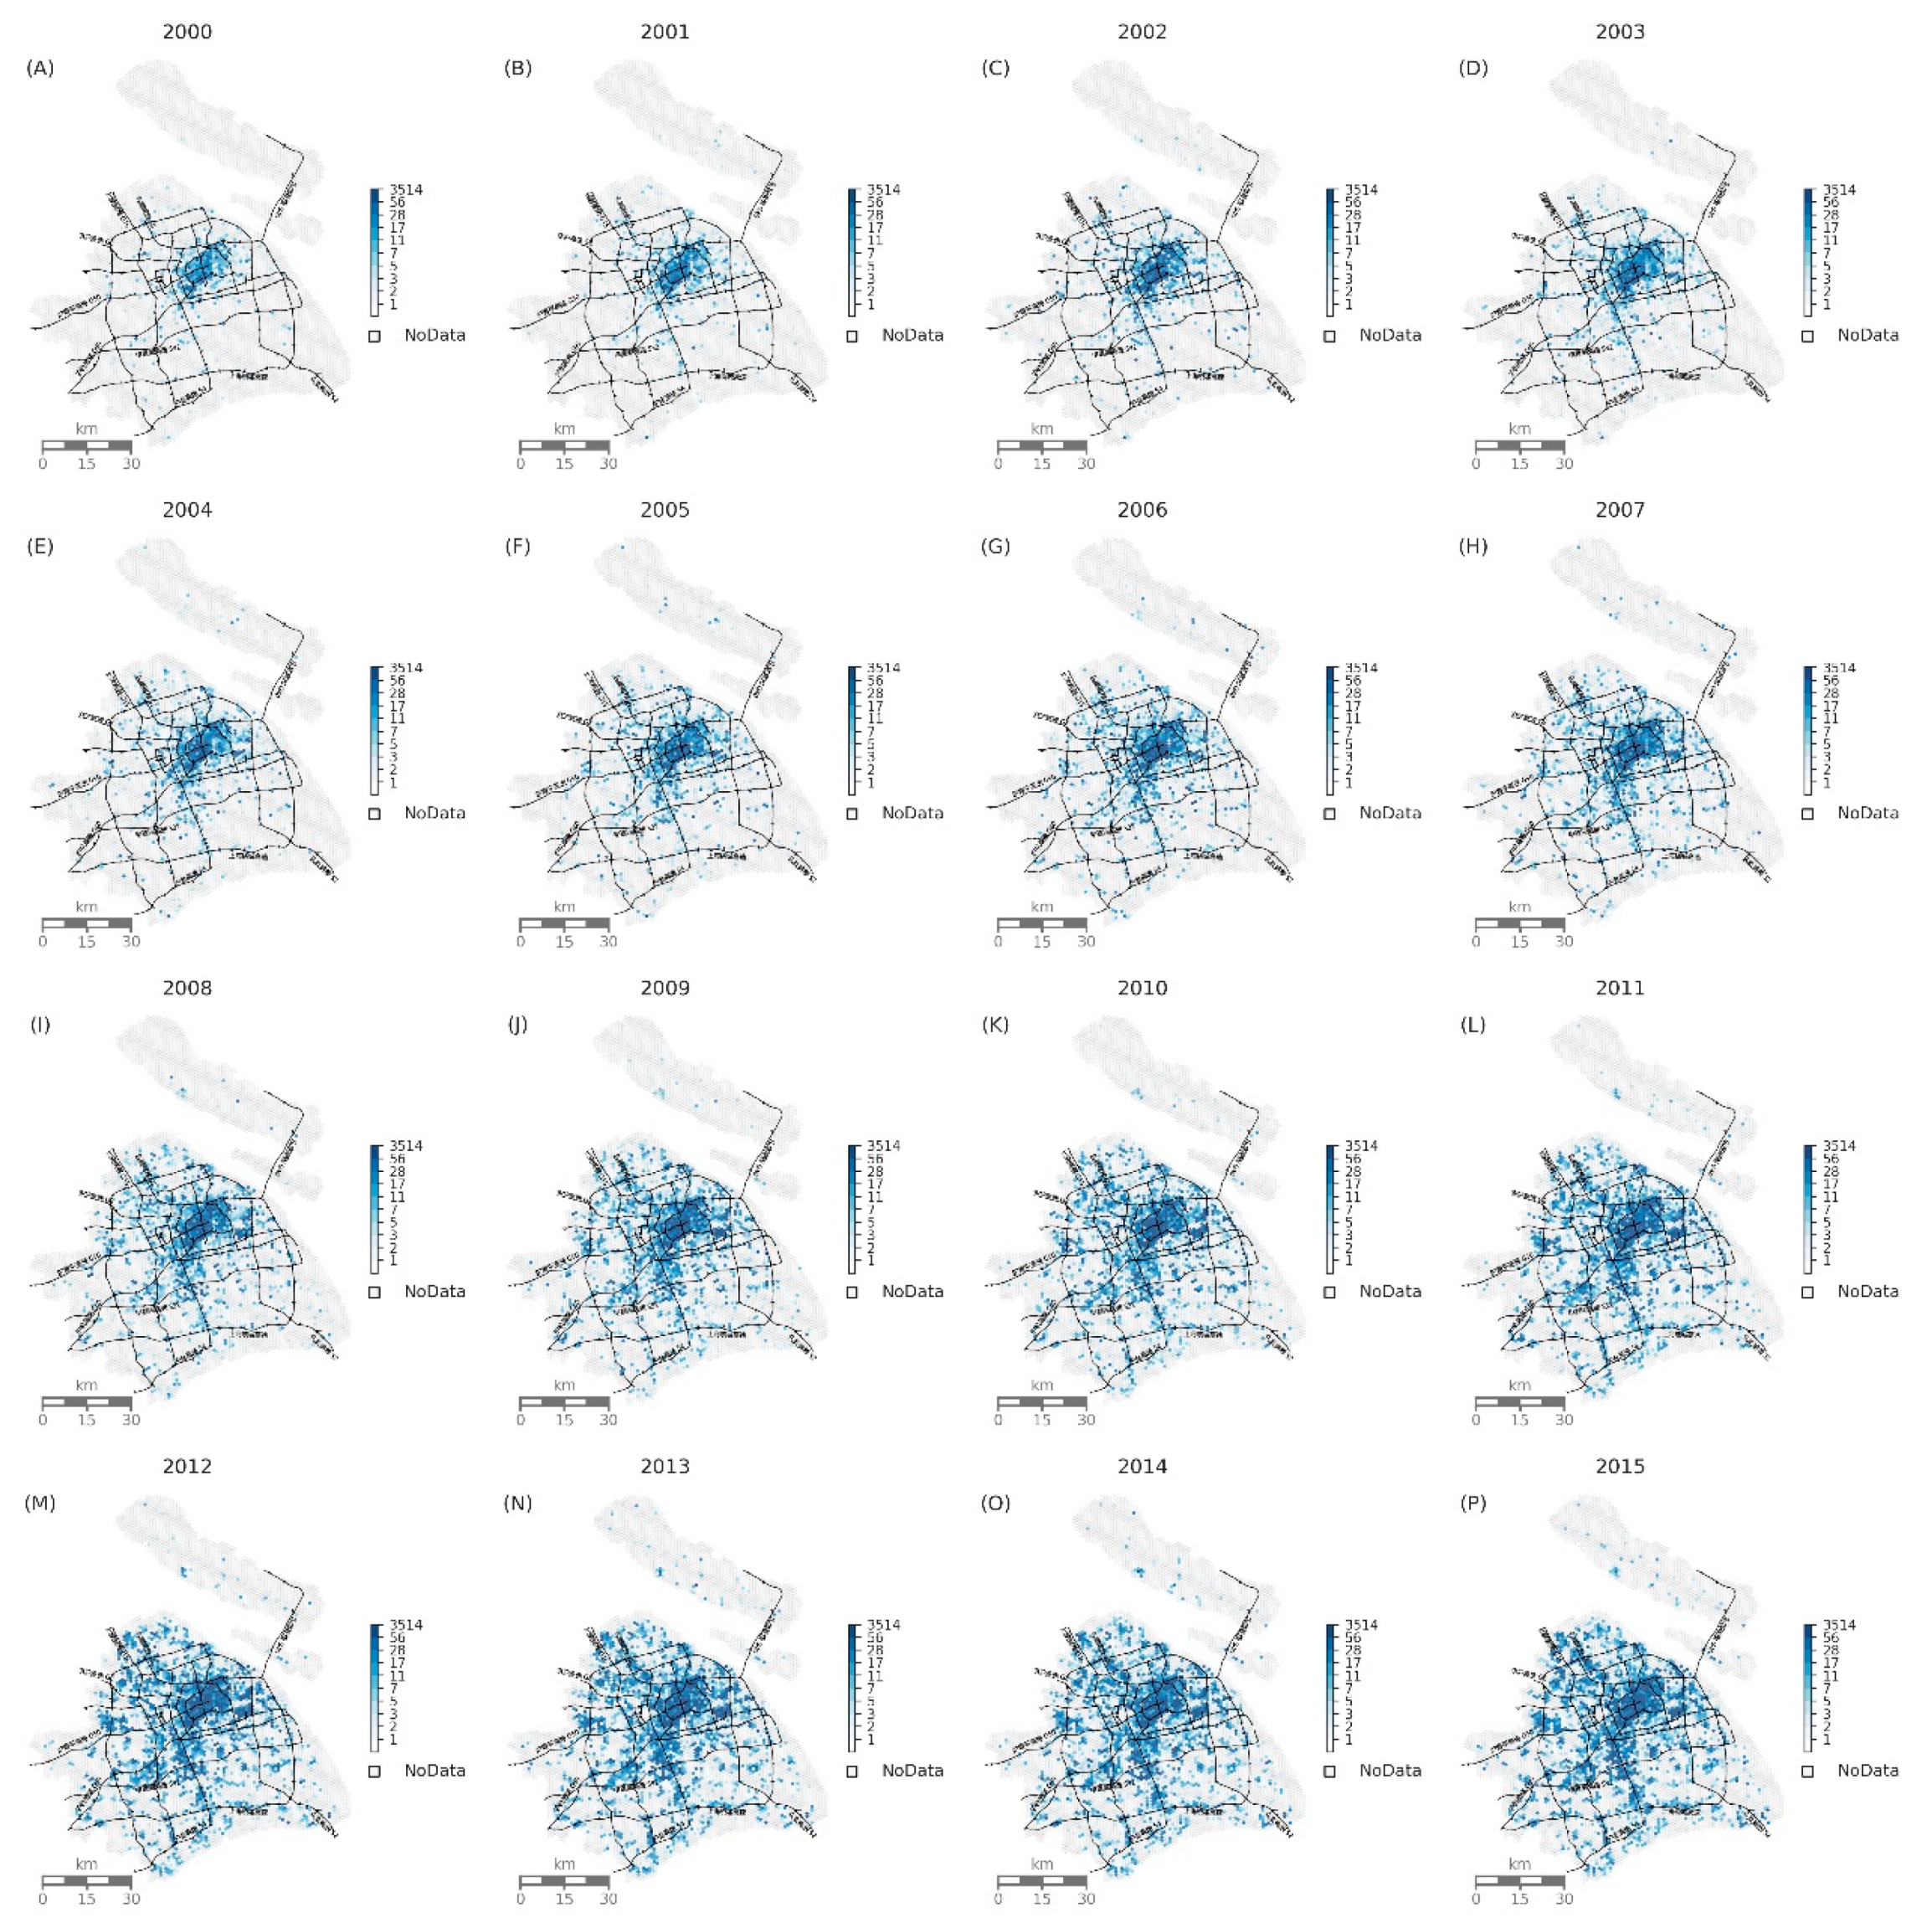
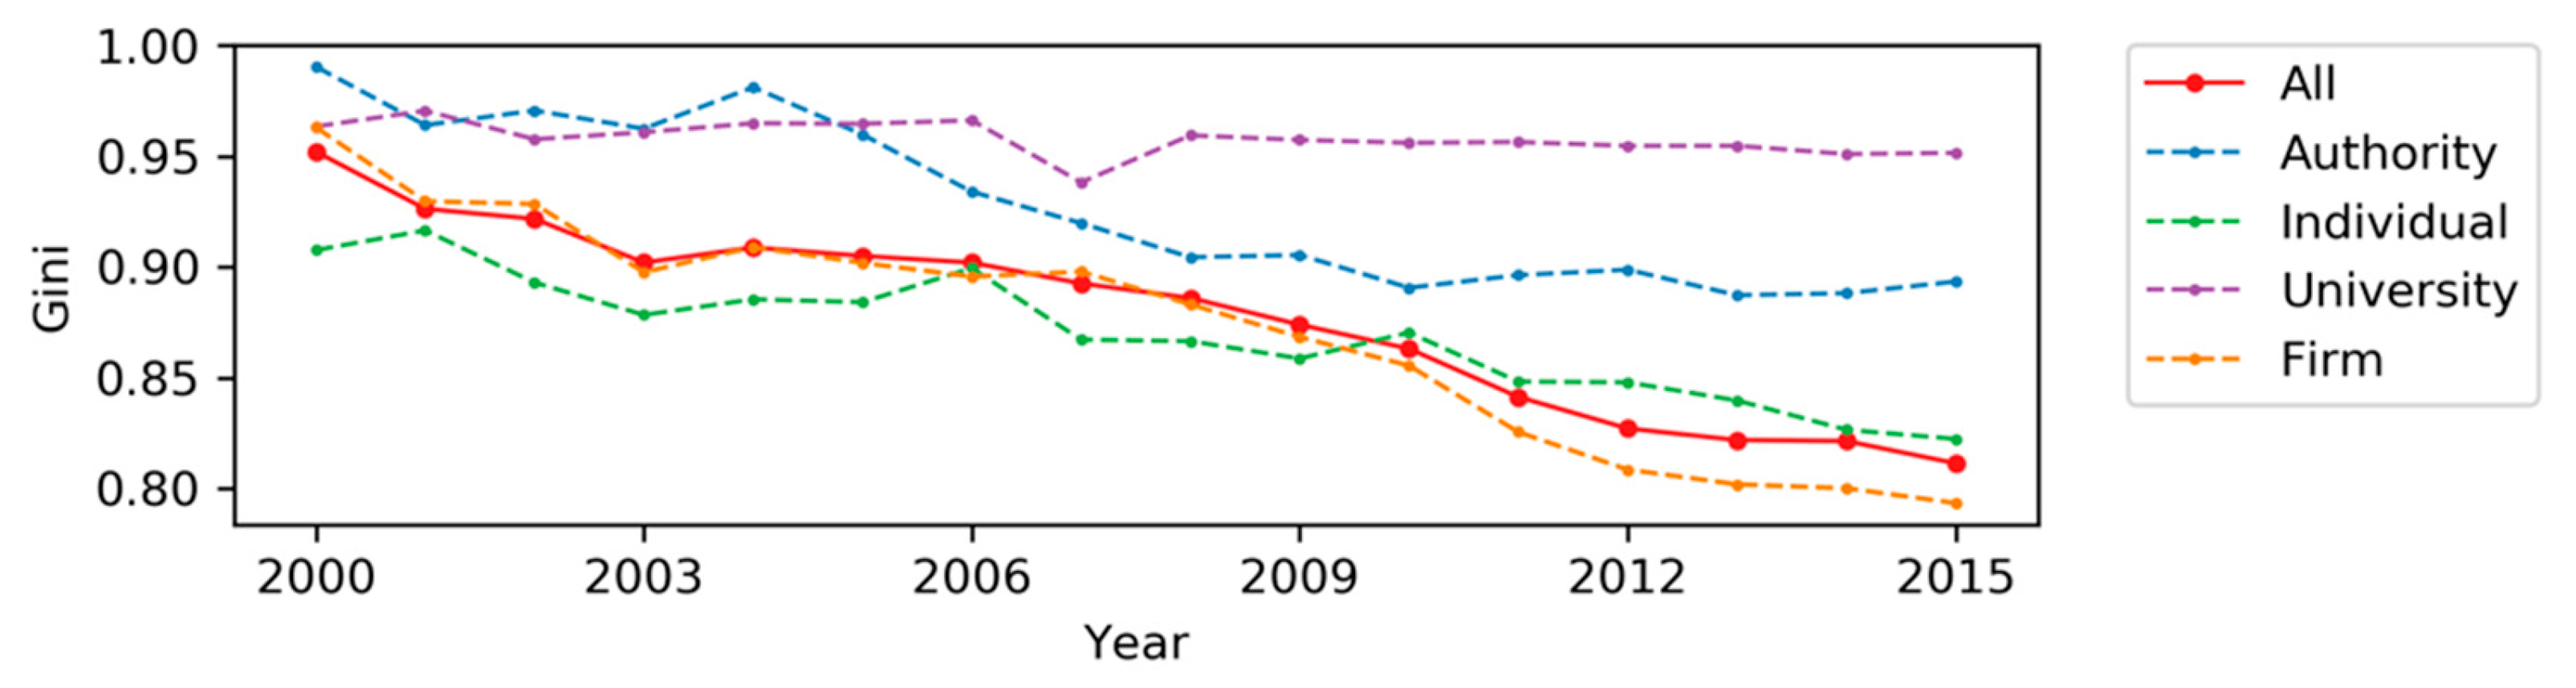
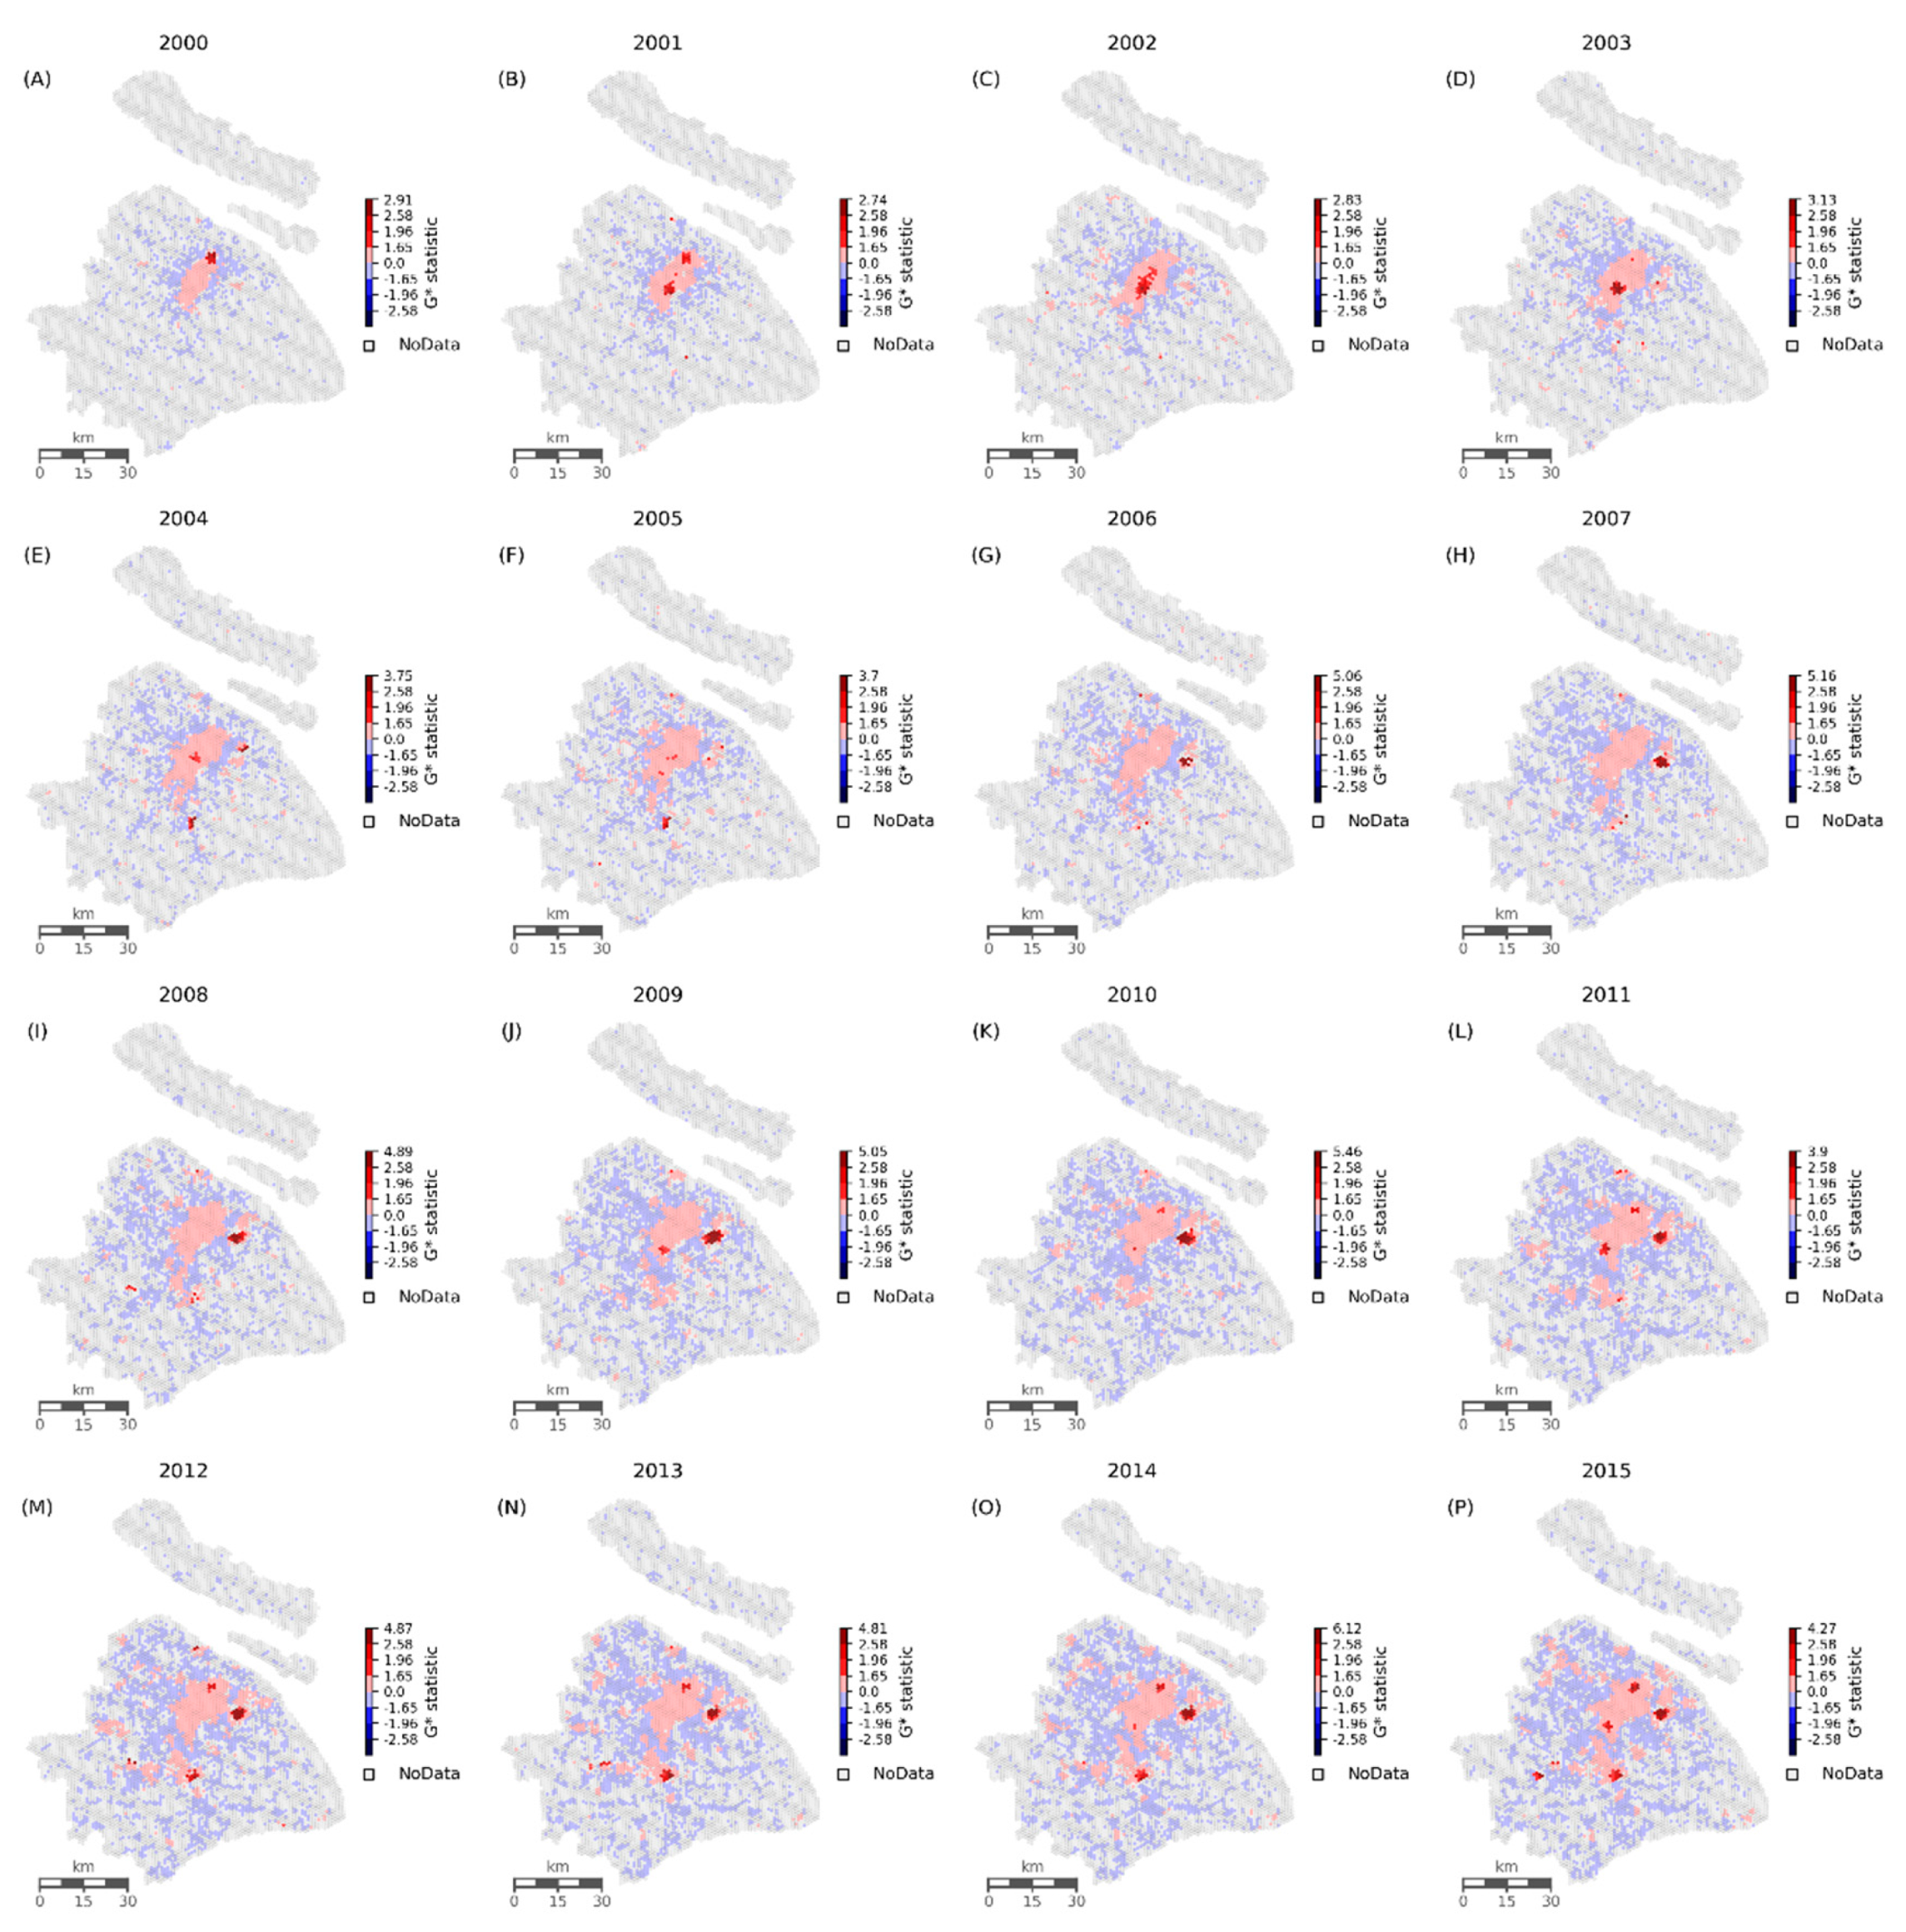
4.1. Characterising Innovation in Urban Space: Towards a Decentralised and Polycentric Pattern

We first examine RQ1 by exploring the spatial distribution and temporal evolution of innovative activities in Shanghai. The result at the microscale generally indicates a strong spatial concentration of patents in the city centre and near the suburbs. However, the temporal evolution exhibits a distinct transportation-oriented spillover (along highways, such as S4, S5, G15, G60 and G50) dominated by firms (Figure 4 and Figure 5).
A stratified spatial pattern is formed. Log-linear least squares regression analysis indicates that the annual growth rate of patent applications in the central city is 12.4%, which is considerably less than that in the inner suburbs (22.2%) and outer suburbs (26.3%). Patent density is spatially dispersed from the central city (630 patents/km2) and the inner suburbs (177 patents/km2) to the outer suburbs (145 patents/km2). Patents from individuals have decreased, concentrating in the downtown area and inner suburbs, indicating a high sensitivity to transportation accessibility and location. Patent applications are active from universities and research institutes but inactive from authorities. Both are distributed in the downtown area.
Patents are visibly concentrated in the downtown area, but the annual Gini coefficient indicates a ‘concentrated decentralisation’ of all the four innovative actors (Figure 6). Firm and individual patents are the most decentralised (the Gini coefficient dropped 17.6% and 10.3%, respectively), followed by patents from authorities (the Gini coefficient dropped 9.8%). By contrast, university patents are relatively stable (the Gini coefficient dropped 1.2%). Overall, the concentrations of innovation activities have remained high (the Gini coefficient is higher than 0.8 in all the years). However, the extent has decreased, with the Gini coefficient decreasing from 0.95 in 2000 to 0.82 in 2015.
The Getis–Ord (Gi*) statistic discerns a polycentric structure of innovative activities that evolve from a monocentric structure. Our mapping (Figure 7), which is based on a 1 km2 hexagon grid, identifies hot and cold spots based on how the intensity of patent activities deviates from the global mean score. Evidently, the patent clusters in the early 2000s emerged in university-intensive Yangpu and Xuhui. From 2004 to 2007, the significance of high-tech industrial bases increased, with new patent clusters appearing along S4 around the Minhang Zizhu S&T Industrial Park and the Pudong Zhangjiang High-Tech Industrial Development Zone. The early monocentric patent spatial structure has evolved into a polycentric structure since 2008, and an additional cluster around Songjing University Town, along the G60 S&T corridor, has emerged. Nevertheless, the nascent polycentric structure remains uncertain. The Gi* statistic was higher in Hongqiao, Minhang and Songjiang than in the rest of the area in 2009, regaining a high value in Yangpu in 2010. A clearer structure may take years to form. Patent clusters in Zhangjiang, Hongqiao, Yangpu, Minhang and Songjiang became discernible in 2015. Firms and individuals play significant roles in the formation of a polycentric structure, although their roles are different. Individual patent centres identified by the Gi* statistic moved from the Tongji–Fudan area, city centre (People’s Square), Shanghai Indoor Stadium and Wuning Road before 2012 to Minhang University Town after 2012, i.e., close to either university campuses or easily accessible downtown areas. This movement is in stark contrast to those of firm patent centres that initially appeared in the northeastern city centre (Tongji–Fudan area) and then emerged in Pudong Zhangjiang (2004), central Baoshan, Hongqiao (2011) and Songjiang (2013, 2015) thereafter. While the hot spots of patents from universities and authorities are hardly discernible, the former is essential for the Minhang patent centre whilst the latter sustains the city centre’s patent cluster. Undoubtedly, the site selection of these institutes largely determines the structure of innovation space.
To better understand how spatial characteristics of the innovation outputs cope with urban industrial development, Figure 8 maps the overall spatial layout of industry positioning of Shanghai’s key regions. It can be observed that the actual innovative activities are somewhat mismatched from the planned industrial clusters. At the municipal level, the government strategically prioritized suburban area in industrial development, but innovation outputs in central area remains far outweighed those in outskirts. Shanghai’s urban innovation system still has a long way to go to become mature but is promising, given that innovative activities remain unbalanced between the central city area (including its nearby suburbs) and the outskirts and also that innovative activities have grown quickly in the suburbs in recent years.

4.2. Searching for Influential Factors of Innovation: Dominance of Socioeconomic Development and Urban Greening

We then examine RQ2 to determine how innovative activities have been influenced by Shanghai’s urban development. The REM results are provided in Table 2. We have computed Durbin–Watson (DW) statistics to test serial correlations. Except for the university case, most models do not observe significant effects of serial correlations. Besides, we have conducted Breusch--Pagan’s LM tests for cross sectional dependence. The REM models do not have significant cross sectional dependence issues in our cases. In general, the performance of Yi (the number of patent application records) is significantly interrelated with public budget expenditure and green space area with both having p-values of less than 0.001. The two factors are also significantly interrelated with resident population. The results indicate that an increase in public budget expenditure and green space area can improve the performance of urban innovation output. The urban population scale also plays a positive role. This result implies that innovation output performance has been considerably improved during post-World Trade Organisation urban development in Shanghai.
The interplay or mutual enhancement of economy and innovation has long been noted in many studies [73,74,75,76]. Our regression result supports the view that innovation output, particularly firm innovation, is positively associated with public budget expense. On the one hand, the public budget expenditure of Shanghai is growth-oriented and indirectly represents economic development. This finding is derived from the synchronisation of Shanghai’s GDP growth and public budget expenditure from 2000 to 2015. Shanghai’s GDP increased from 481.2 billion to 2565.9 billion, alongside its public budget expenditure, which surged from 62.3 billion to 619.2 billion. Thus, we can reasonably argue that improved economic performance increases innovation output. On the other hand, public budget expenditure indicates how the government is financing social development, such as general public service, public security, education, social security, employment, health care and family planning, and urban–rural communities (these items are derived from the official definition of the Shanghai Statistical Bureau). Thus, a high social development level may improve the performance of innovation output. Moreover, education is crucial for innovation because, amongst the aforementioned budget items, expenditure on education nearly accounts for the highest proportion each year.
Green spaces exert significantly positive effects on innovation output. The result indicates that firms are more sensitive to green spaces than the other actors when engaged in innovative activities. Urban greening can indirectly influence urban innovation in at least two aspects. Firstly, as an indicator that reflects the urban construction level, urban greening can frequently identify a newly planned and well-designed area that is capable of attracting firms and people. The attracted actors are the major sources of innovation. Secondly, as an indicator of urban environment quality, urban greening can frequently identify large open spaces, low urban density and less crowded areas, which are often situated away from the city centre and can offer ample space for R&D and production. However, these areas may lack mature supporting facilities to attract individuals, explaining why firm innovation is positively related to green spaces but individual innovation is not.
While not as significant as public budget expenditure and green space, resident population also contributes to urban innovation output. Human capital has been cited as an important factor that influences innovation output performance in several studies [77,78,79]. The larger the population base, the more innovative talents and labour resources firms will gain. REM indicates that an increase in migrants increases innovation output from universities and individuals, indicating that higher education institutions with a steady stream of new talents is more likely to innovate.
While not significantly correlated with the total amount of innovation, other variables also interrelate with subtypes of innovation output. For example, REM indicates that the growth of the industrial output value improves the performance of firm innovation; that is, innovation from firms exhibits a close relation with industrial activities. However, a similar growth reduces university and individual innovation output. An increase in technology investment from S&T commissions is positively associated with authority and individual innovation performance; thus, S&T commissions should aim to support these actors. An increase in local technology investment leads to the growth of university innovation, i.e., innovation from higher education institutions receives considerable gains from the financial support of local governments.

5. Conclusions

This study provides a microscopic view of urban innovation outputs, which are critical for urban economic resilience to cope with “disturbance” in financial tsunamis. This study demonstrates that innovative outputs, when measured through patents at the micro level, exhibit strong concentration propensity within a city. Innovation activities agglomerate in the city centre and near suburbs, particularly in Puxi. The Getis–Ord (Gi*) statistic accurately identifies patent concentration areas, which are knowledge/resource-intensive. However, overall concentration decreases when quantified by the Gini coefficient because patents are decentralised, cluster around the major rapid transportation corridors (S4, G15, G60, G50 and S5) and expand into the surrounding neighbourhoods (Figure 4 and Figure 5). This evolution differs from the recent high-technologisation of inner cities in London or New York (Foord, 2013, Katz and Wagner, 2014). However, the process is similar to the ‘concentrated decentralisation’ of KIBS firms in several advanced economies. This phenomenon requires further research. Moreover, the sensitivity of patent clusters to transportation accessibility in Shanghai refutes the ‘distance death’ argument, implying that spatial proximity remains important to knowledge spillover at the microscale. While firms contribute the most and dictate the innovation landscape, individuals and universities are indispensable to patent growth, particularly in the city centre. Gi* mapping shows how an initial monocentric innovation space structure has evolved into a polycentric structure around Zhangjiang, Yangpu, Hongqiao, Minhang and Songjiang. In the early 2000s, innovative activities were knowledge-driven and clustered in the Yangpu knowledge circle and in Xuhui (near universities, such as Shanghai Jiaotong, and high-tech industrial parks). Policy support for industrial parks has nurtured technology-driven innovation centres in Minhang, Songjiang and Zhangjiang. Coping with suburban spatial policies, industrial parks, as significant carriers of innovation activities, have thrived and assisted the formation of a polycentric innovation space structure. A time lag exists between innovation clusters fostered by innovation policies and spontaneously developed clusters (e.g., knowledge-driven innovation centres). Spatial differences between individual and firm innovations are also notable. Individual innovation is more sensitive to location than other types of innovation activities. By contrast, firm innovation relies more on policy support.
We determine that public budget expenditure and green space significantly influence urban innovation output. On the one hand, the findings support the long-standing view that innovation, as a creative destruction of the economy (Schumpeter, 1934), is considerably influenced by economic growth. On the other hand, the findings can enrich the extant literature on green innovation vibrancy. The REM result confirms that population leads to individual innovation output similar to that in North America and Europe (Roberts, 1991, Sternberg, 2009); however, only REM demonstrates a significant correlation between university/individual innovative vitality and immigration (Froschauer, 2001, Lee et al., 2004). We believe that immigrants’ quality, instead of quantity, is significant in Shanghai’s path towards being a world-class innovation centre, leaving considerable room for improvement. Institutional factors, such as government’s input for innovation, are sensible. However, they are more important in innovation from authority and university than in other actors.
The current study has several limitations that require further effort to improve. Firstly, we exclusively use patent data to represent innovation output. Juxtaposing these data with complementary information from other data related to innovation, such as scientific publications and creative products, may produce a complete picture of innovation across a metropolis. Secondly, this study examines innovation from an output perspective. Investigating innovation activity from an input perspective is equally important because innovation productivity is sensitive to government investment in R&D and cash flow from the venture capital industry. Understanding how investment impacts output will help assess policy implications of the innovation strategy. Thirdly, this study is a city-based analysis that further research can ‘open the box’ to scrutinise multi-level spatial patterns of innovation. Nevertheless, these limitations do not undermine the significance of this study because it is the first to provide details of the evolving trajectory and influential factors of innovation from a microscopic view. It also contributes to a methodological innovation for statistically measuring and spatially visualising innovation concentrations. The analytic framework is not only effective in depicting the spatial process of innovation development, but is also helpful in evaluating strategic investments and policy making in innovation programmes.

Author Contributions

Conceptualization, L.L.; Data curation, X.Z.; Formal analysis, L.L. and X.Z.; Funding acquisition, L.L.; Investigation, L.L. & and X.Z.; Methodology, X.Z.; Project administration, L.L.; Resources, L.L.; Software, X.Z.; Validation, X.Z.; Visualization, L.L. and X.Z.; Writing—original draft, L.L.; Writing—review and editing, X.Z. All authors have read and agreed to the published version of the manuscript.

Funding

This research was funded by the National Natural Science Foundation of China [Grant No. 51808391] and Open Projects Fund of Key Laboratory of Shanghai Urban Renewal and Spatial Optimization Technology [Grant No. 2019020202].

Conflicts of Interest

The authors declare no conflict of interest.

References

  1. Portugali, J. What Makes Cities Complex? In Complexity, Cognition, Urban Planning and Design; Portugali, J., Stolk, E., Eds.; Springer: Berlin, Germany, 2016; pp. 3–19. [Google Scholar]
  2. Lotto, D. Flexibility Priciples for Contemporary Cities. In Changing Shanghai—From Expo’s after Use to New Green Towns; Zheng, S., Bugatti, A., Eds.; Officina Edizioni: Roma, Italy, 2011. [Google Scholar]
  3. Morelli, C. Complex, adaptive and ethero-organized urban development: The paradigm of flexible city. In Proceedings of the IMCIC Conference, Orlando, FL, USA, 10–14 March 2015; Volume 1. [Google Scholar]
  4. Fastenrath, S.; Coenen, L.; Davidson, K. Urban Resilience in Action: The Resilient Melbourne Strategy as Transformative Urban Innovation Policy? Sustainability 2019, 11, 693. [Google Scholar] [CrossRef] [Green Version]
  5. Mai, X.; Chan, R.C.K.; Zhan, C. Which Sectors Really Matter for a Resilient Chinese Economy? A Structural Decomposition Analysis. Sustainability 2019, 11, 6333. [Google Scholar] [CrossRef] [Green Version]
  6. Ribeiro, P.; Goncalves, L. Urban resilience: A conceptual framework. Sustain. Cities Soc. 2019, 50, 101625. [Google Scholar] [CrossRef]
  7. Romijn, H.A.H.; Albaladejo, M. Determinants of innovation capability in small electronics and software firms in southeast England. Res. Policy 2002, 31, 1053–1067. [Google Scholar] [CrossRef]
  8. Bhattacharya, M.; Bloch, H. Determinants of Innovation. Small Bus. Econ. 2004, 22, 155–162. [Google Scholar] [CrossRef]
  9. Fornahl, D.; Brenner, T. Geographic concentration of innovative activities in Germany. Struct. Chang. Econ. Dyn. 2009, 20, 163–182. [Google Scholar] [CrossRef]
  10. Huallachain, B.O. Inventive Megaregions of the United States: Technological Composition and Location. Econ. Geogr. 2012, 88, 165–195. [Google Scholar] [CrossRef]
  11. Choi, H.S.; Sohn, S.Y.; Yeom, H.J. Technological composition of US metropolitan statistical areas with high-impact patents. Technol. Forecast. Soc. Chang. 2018, 134, 72–83. [Google Scholar] [CrossRef]
  12. Zeng, S.X.; Xie, X.M.; Tam, C.M. Relationship between cooperation networks and innovation performance of SMEs. Technovation 2010, 30, 181–194. [Google Scholar] [CrossRef]
  13. Wang, C.C.; Lin, G.C.S. Geography of knowledge sourcing, heterogeneity of knowledge carriers and innovation of clustering firms: Evidence from China’s software enterprises. Habitat Int. 2018, 71, 60–69. [Google Scholar] [CrossRef]
  14. Isaksen, A.; Jakobsen, S. New path development between innovation systems and individual actors. Eur. Plan. Stud. 2017, 25, 355–370. [Google Scholar] [CrossRef] [Green Version]
  15. Binz, C.; Truffer, B.; Coenen, L. Path creation as a process of resource alignment and anchoring: Industry formation for on-site water recycling in Beijing. Econ. Geogr. 2016, 92, 172–200. [Google Scholar] [CrossRef] [Green Version]
  16. Simmie, J. Path Dependence and New Technological Path Creation in the Danish Wind Power Industry. Eur. Plan. Stud. 2012, 20, 753–772. [Google Scholar] [CrossRef]
  17. Zhang, F.; Wu, F. Rethinking the city and innovation: A political economic view from China’s biotech. Cities 2018, 85, 150–155. [Google Scholar] [CrossRef]
  18. Liu, F.C.; Simon, D.F.; Sun, Y.T.; Cao, C. China’s innovation policies: Evolution, institutional structure, and trajectory. Res. Policy 2011, 40, 917–931. [Google Scholar] [CrossRef]
  19. Kaldor, N. The role of increasing returns, technical progress and cumulative causation in the theory of international trade and economic growth. Econ. Appl. 1981, 34, 593–617. [Google Scholar]
  20. Thirlwall, A. The Mobilization of Savings for Growth and Development in Developing Countries. IUP J. Appl. Econ. 2002, 7–30. [Google Scholar]
  21. Krugman, P. Development, Geography, and Economic Theory; MIT Press: Cambridge, UK, 1995. [Google Scholar]
  22. Ellison, G.; Glaeser, E.L. Geographic Concentration in U.S. Manufacturing Industries: A Dartboard Approach. J. Polit. Econ. 1994, 105, 889–927. [Google Scholar] [CrossRef] [Green Version]
  23. Shearmur, R. Are cities the font of innovation? A critical review of the literature on cities and innovation. Cities 2012, 29, S9–S18. [Google Scholar] [CrossRef]
  24. Saxenian, A.; Sabel, C. Roepke lecture in economic geography venture capital in the “periphery”: The new argonauts, global search, and local institution building. Econ. Geogr. 2008, 84, 379–394. [Google Scholar] [CrossRef]
  25. Adler, P.; Florida, R.; King, K.; Mellander, C. The city and high-tech startups: The spatial organization of Schumpeterian entrepreneurship. Cities 2019, 87, 121–130. [Google Scholar] [CrossRef]
  26. Powell, W.W.; Koput, K.W.; Bowie, J.I.; Smith-Doerr, L. The spatial clustering of science and capital: Accounting for biotech firm-venture capital relationships. Reg. Stud. 2002, 36, 291–305. [Google Scholar] [CrossRef] [Green Version]
  27. Acs, Z.J.; Audretsch, D.B. Patents as a Measure of Innovative Activity. Kyklos 1989, 42, 171–180. [Google Scholar] [CrossRef]
  28. Feldman, M.P.; Florida, R. The geographic sources of innovation: Technological infrastructure and product innovation in the United States. Ann. Assoc. Am. Geogr. 1994, 84, 210–229. [Google Scholar] [CrossRef]
  29. Acs, Z.J.; Anselin, L.; Varga, A. Patents and innovation counts as measures of regional production of new knowledge. Res. Policy 2002, 31, 1069–1085. [Google Scholar] [CrossRef]
  30. Lim, U. The spatial distribution of innovative activity in U.S. metropolitan areas: Evidence from patent data. J. Reg. Anal. Policy 2003, 33. [Google Scholar]
  31. Maggioni, M.A.; Nosvelli, M.; Uberti, T.E. Space Vs. Networks in the Geography of Innovation: A European Analysis. Pap. Reg. Sci. 2007, 86, 471–493. [Google Scholar] [CrossRef]
  32. Acosta, M.; Coronado, D.; Leon, M.D.; Martinez, M.A. Production of University Technological Knowledge in European Regions: Evidence from Patent Data. Reg. Stud. 2009, 43, 1167–1181. [Google Scholar] [CrossRef]
  33. Goncalves, E.; De Almeida, E.S. Innovation and Spatial Knowledge Spillovers: Evidence from Brazilian Patent Data. Reg. Stud. 2009, 43, 513–528. [Google Scholar] [CrossRef]
  34. Wood, P. Knowledge-intensive Services and Urban Innovativeness. Urban Stud. 2002, 39, 993–1002. [Google Scholar] [CrossRef]
  35. Richard, F. The Rise of the Creative Class: And How It’s Transforming Work, Leisure, Community and Everyday Life; Basic: New York, NY, USA, 2002. [Google Scholar]
  36. Feldman, M.P.; Kogler, D.F. Stylized facts in the geography of innovation. Handb. Econ. Innov. 2010, 1, 381–410. [Google Scholar]
  37. Sengupta, J.K. Theory of Innovation: A New Paradigm of Growth; Springer: London, UK, 2013. [Google Scholar]
  38. Sassen, S. The Global City: New York, London, Tokyo, 2nd ed.; Princeton University Press: Princeton, NJ, USA, 2001. [Google Scholar]
  39. Liu, F.; Sun, Y. A comparison of the spatial distribution of innovative activities in China and the U.S. Technol. Forecast. Soc. Chang. 2009, 76, 797–805. [Google Scholar] [CrossRef]
  40. Shearmur, R. The Geography of Intrametropolitan KIBS Innovation: Distinguishing Agglomeration Economies from Innovation Dynamics. Urban Stud. 2012, 49, 2331–2356. [Google Scholar] [CrossRef]
  41. Florida, R.; Adler, P.; Mellander, C. The city as innovation machine. Reg. Stud. 2017, 51, 86–96. [Google Scholar] [CrossRef]
  42. Carayannis, E.G.; Von Zedtwitz, M. Architecting gloCal (global–local), real-virtual incubator networks (G-RVINs) as catalysts and accelerators of entrepreneurship in transitioning and developing economies: Lessons learned and best practices from current development and business incubation practices. Technovation 2005, 25, 95–110. [Google Scholar]
  43. Birch, E.L. Downtown in the “new American city”. Ann. Am. Acad. Polit. Soc. Sci. 2009, 626, 134–153. [Google Scholar] [CrossRef]
  44. Méndez, R.; Moral, S.S. Spanish cities in the knowledge economy: Theoretical debates and empirical evidence. Eur. Urban Reg. Stud. 2011, 18, 136–155. [Google Scholar] [CrossRef]
  45. Halbert, L. Collaborative and collective: Reflexive co-ordination and the dynamics of open innovation in the digital industry clusters of the Paris region. Urban Stud. 2012, 49, 2357–2376. [Google Scholar] [CrossRef]
  46. Coffey, W.J.; Shearmur, R. Agglomeration and Dispersion of High-order Service Employment in the Montreal Metropolitan Region, 1981-96. Urban Stud. 2002, 39, 359–378. [Google Scholar] [CrossRef]
  47. Garcialopez, M.; Muniz, I. Employment Decentralisation: Polycentricity or Scatteration? The Case of Barcelona. Urban Stud. 2010, 47, 3035–3056. [Google Scholar] [CrossRef]
  48. Veneri, P. The Identification of Sub-centres in Two Italian Metropolitan Areas: A Functional Approach. Cities 2013, 31, 177–185. [Google Scholar] [CrossRef] [Green Version]
  49. Foord, J. The new boomtown? Creative city to Tech City in east London. Cities 2013, 33, 51–60. [Google Scholar] [CrossRef]
  50. Katz, B.; Wagner, J. The Rise of Innovation Districts: A New Geography of Innovation in America; The Brookings Institution: Washington, DC, USA, 2014. [Google Scholar]
  51. Cairncross, F. The Death of Distance: How the Communications Revolution Will Change Our Lives; Harvard Business Press: Brighton, MA, USA, 2001. [Google Scholar]
  52. Bentivegna, T. Innovation Network Functionality: The Identification and Categorization of Multiple Innovation Networks; Springer Fachmedien Wiesbaden: Wiesbaden, Germany, 2014. [Google Scholar]
  53. Bogers, M.; Chesbrough, H.; Moedas, C. Open Innovation: Research, Practices, and Policies. Calif. Manag. Rev. 2018, 60, 5–16. [Google Scholar] [CrossRef]
  54. Jaumotte, F.; Pain, N. An Overview of Public Policies to Support Innovation, OECD Economics Department Working Papers, No. 456; OECD Publishing: Paris, France, 2005. [Google Scholar]
  55. Trippl, M.; Todtling, F.; Lengauer, L. Knowledge Sourcing Beyond Buzz and Pipelines: Evidence from the Vienna Software Sector. Econ. Geogr. 2009, 85, 443–462. [Google Scholar] [CrossRef]
  56. He, S.; Du, D.; Jiao, M.; Lin, Y. Spatial-Temporal Characteristics of Urban Innovation Capability and Impact Factors Analysis in China. Sci. Geogr. Sin. 2017, 1014–1022. [Google Scholar]
  57. Roberts, E.B. Entrepreneurs in High Technology: Lessons from MIT and Beyond; Oxford University Press: Oxford, UK, 1991. [Google Scholar]
  58. Sternberg, R. Regional Dimensions of Entrepreneurship. Soc. Sci. Electron. Publish. 2009, 5, 211–340. [Google Scholar] [CrossRef] [Green Version]
  59. Froschauer, K. East Asian and European entrepreneur immigrants in British Columbia, Canada: Post-migration conduct and pre-migration context. J. Ethn. Migr. Stud. 2001, 27, 225–240. [Google Scholar] [CrossRef]
  60. Lee, S.Y.; Florida, R.; Acs, Z. Creativity and Entrepreneurship: A Regional Analysis of New Firm Formation. Reg. Stud. 2004, 38, 879–891. [Google Scholar] [CrossRef] [Green Version]
  61. Marx, K. Das Kapital: A Critique of Political Economy; Regnery: New York, NY, USA, 1867/2012.
  62. Schumpeter, J.A. The Theory of Economic Development: An Inquiry into Profits, Capital, Credit, Interest, and the Business Cycle; Harvard University Press: Cambridge, MA, USA, 1934. [Google Scholar]
  63. Rosenberg, N. Was Schumpeter a Marxist? Ind. Corp. Chang. 2011, 20, 1215–1222. [Google Scholar] [CrossRef]
  64. Liou, K.T. Public budgeting and finance reforms in China: Introduction. J. Public Budg. Account. Financ. Manag. 2011, 23, 535–543. [Google Scholar] [CrossRef]
  65. Glaeser, E.L. Entrepreneurship and the City (No. w13551); National Bureau of Economic Research (NBER): Cambridge, MA, USA, 2007. [Google Scholar]
  66. Schiederig, T.; Tietze, F.; Herstatt, C. What is Green Innovation?—A Quantitative Literature Review. In Proceedings of the XXII ISPIM Conference, Hamburg, Germany, 12–15 June 2011. [Google Scholar]
  67. Combes, P.; Overman, H. The spatial distribution of economic activities in the European Union. In Handbook of Regional and Urban Economics: Cities and Geography; Henderson, V., Thisse, J., Eds.; Elsevier: Amsterdam, The Netherlands, 2004; p. 4. [Google Scholar]
  68. Anselin, L. Local indicators of spatial association—LISA. Geogr. Anal. 1995, 27, 93–115. [Google Scholar] [CrossRef]
  69. Ord, J.K.; Getis, A. Local spatial autocorrelation statistics: Distributional issues and an application. Geogr. Anal. 1995, 27, 286–306. [Google Scholar] [CrossRef]
  70. Getis, A.; Aldstadt, J. Constructing the spatial weights matrix using a local statistic. Geogr. Anal. 2004, 36, 90–104. [Google Scholar] [CrossRef]
  71. Prasannakumar, V.; Vijith, H.; Charutha, R.; Geetha, N. Spatio-temporal clustering of road accidents: GIS based analysis and assessment. Procedia-Soc. Behav. Sci. 2011, 21, 317–325. [Google Scholar] [CrossRef] [Green Version]
  72. Bell, A.; Jones, K. Explaining fixed effects: Random effects modeling of time-series cross-sectional and panel data. Polit. Sci. Res. Methods 2015, 3, 133–153. [Google Scholar] [CrossRef] [Green Version]
  73. Lambooy, J.G. Knowledge and Urban Economic Development: An Evolutionary Perspective. Urban Stud. 2002, 39, 1019–1035. [Google Scholar] [CrossRef]
  74. Feldman, M.; Desrochers, P. Research Universities and Local Economic Development: Lessons from the History of the Johns Hopkins University. Ind. Innov. 2003, 10, 5–24. [Google Scholar] [CrossRef]
  75. Fromhold-Eisebith, M. Space(s) of Innovation: Regional Knowledge Economies. In Milieus of Creativity: An Interdisciplinary Approach to Spatiality of Creativity; Meusburger, P., Funke, J., Wunder, E., Eds.; Springer: Dordrecht, The Netherlands, 2009; pp. 201–218. [Google Scholar]
  76. Hájková, V.; Hájek, P. Efficiency of knowledge bases in urban population and economic growth—Evidence from European cities. Cities 2014, 40, 11–22. [Google Scholar] [CrossRef]
  77. Lu, L.; Huang, R. Urban hierarchy of innovation capability and inter-city linkages of knowledge in post-reform China. Chin. Geogr. Sci. 2012, 22, 602–616. [Google Scholar] [CrossRef]
  78. Florida, R. The Rise of the Creative Class--Revisited: Revised and Expanded; Basic Books (AZ): New York, NY, USA, 2014. [Google Scholar]
  79. Guo, S. Spatial-Temporal Characteristics and Determinants of Innovation Output in China. Mod. Econ. 2019, 10, 12–28. [Google Scholar] [CrossRef] [Green Version]
Figure 1. Shanghai metropolis and master plan for innovation (2017–2035).
Sustainability 12 00938 g001
Figure 2. Patent applications by authorities, individuals, universities/research institutes and firms (2000–2015). (a) Number of patent applications by authorities, individuals, universities/research institutes and firms (2000–2015). (b) Ratio of patent applications by authorities, individuals, universities/research institutes and firms (2000–2015).
Sustainability 12 00938 g002
Figure 3. Innovation output (thousands) and density (2015) in administrative districts of Shanghai.
Sustainability 12 00938 g003
Figure 4. Number and growth rates of patents in Shanghai (2000–2015). The black solid lines show the boundaries of the central city, inner suburbs and outer suburbs.
Sustainability 12 00938 g004
Figure 5. Spatial evolution of patent applications in Shanghai (2000–2015).
Sustainability 12 00938 g005
Figure 6. Gini coefficients of patent applications in Shanghai by actors (2000–2015).
Sustainability 12 00938 g006
Figure 7. Hot spot of patent applications in Shanghai (2000–2015); the statistical values of 1.65, 1.96 and 2.58 stand for confidence intervals of 90%, 95% and 99%, respectively.
Sustainability 12 00938 g007
Figure 8. Overall spatial layout of industry positioning map of Shanghai’s key regions (2018); source: Shanghai Industrial Development Research and Evaluation Center; compiled by authors.
Sustainability 12 00938 g008
Table 1. Dependent and independent variables.
DescriptionUnitObs.MinMaxMedianMeanSE
dependent variables - innovation output
allTotal number of patents 160476204782121.53628.64297.14
firmsNo. of patents by firm 1603391829816092770.04252.22
authorityNo. of patents by government authority 160035445.577.586.23
universityNo. of patents by university and institutes 16003478140518.8460.80
individualNo. of patents by individuals 160151479201.5262.1919.31
Independent variables
populationResident population1000016023.69547.49108.47131.748.18
migrantMigrant population100001602.91235.6527.7547.873.86
public expenditureGeneral public expenditure10 billion RMB1604.21592.0210.4213.901.06
industry outputGross industrial output10 billion RMB1601.045929.2996.68166.4516.80
green spaceGreen space area1 km216077.4927200.131373.824797.18479.83
S&T grantTechnology grant by municipal commission of S&T 10,000 RMB16001015.1532.8107.0015.11
local investmentTechnology grant by local government10,000 RMB16004073.44355.95555.2456.55
Table 2. Regression results between urban development and innovation output in Shanghai.
AllFirmsAuthoritiesUniversitiesIndividuals
betas.e.betas.e.betas.e.betas.e.betas.e.
population9.787 *4.3658.639 **2.7540.3370.305−0.5862.6480.8480.533
migrant8.4957.483−4.4114.917−1.0180.54111.968 **4.2183.630 ***0.999
public expense107.119 ***21.496101.178 ***14.9691.9651.628−5.76710.7166.0693.237
industry output0.2131.4012.245 *0.9390.0330.103−1.463 *0.739−0.562 **0.193
green space0.108 ***0.0320.130 ***0.0220.0040.002−0.0170.016−0.015 **0.005
S&T grant0.3270.3850.1970.2700.086 **0.029−0.0090.1910.125 *0.059
local investment0.3790.413−0.0120.286−0.0210.0310.458 *0.2080.0340.061
DW statistic1.266 1.671 1.335 0.726 1.512
Adj. R20.845 0.901 0.071 0.260 0.502
Note: * p < 0.05, ** p < 0.01, *** p < 0.001.

