1. Introduction
The main methodology for the identification of dangerous locations, commonly named black spots, relies on the use of crash databases [
1,
2,
3,
4,
5,
6,
7,
8]. Statistical and analytical methodologies applied to crash databases allow us to establish a connection between the causes (roads) and effects (accidents) and allow the extraction of useful information for road safety improvement. These procedures, unfortunately, cannot be used to perform better planning of new roads or to perform a detailed evaluation of possible modifications of the road infrastructure. Moreover, the physical process, which would explain the relationship between causes and effects, is not established and stays hidden behind the statistical modelling.
For these reasons, an alternative procedure was developed at the end of the 1960s. The concept is that of using traffic conflict data instead of crash data. Traffic conflicts are events in which crashes are more likely since drivers are driving close to each other. In 1987, Hydén [
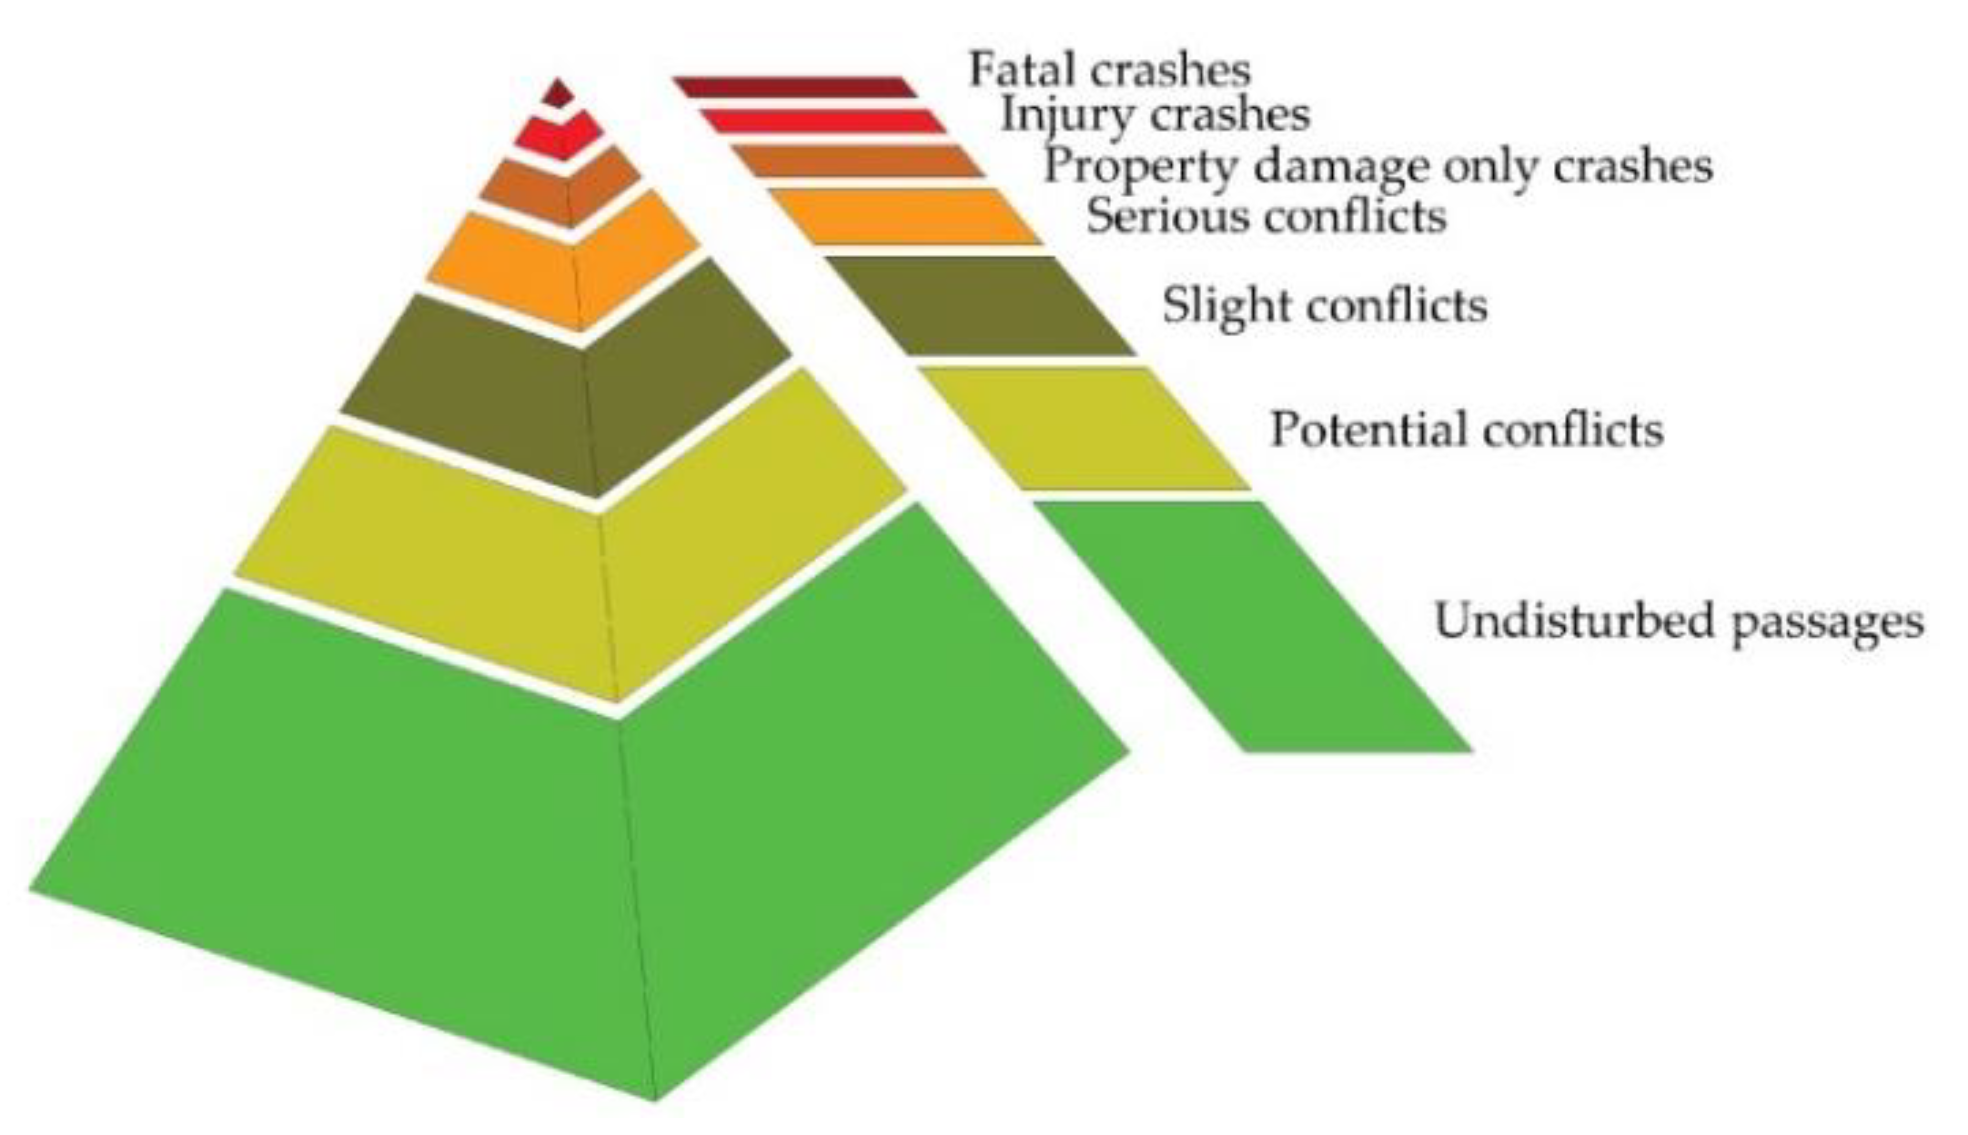
9] developed the concept of a “safety pyramid, or Hydén pyramid” (
Figure 1) thanks to which it is possible to take into account all the possible interaction events that are inevitably created within any vehicular flow. According to this research, there is a connection between the severity of the event and the probability that it will occur. According to this approach, the most probable events are less serious ones, while less probable events are the most serious.
The prerequisite to applying this kind of procedure is that of using vehicle trajectories to assess safety levels by evaluating the number or the severity of dangerous situations that can occur on certain road infrastructure. All the studies carried out on this subject are based on the identification of so-called “surrogate safety indicators”, which seek to evaluate the potentially dangerous interactions between vehicles and to determine which of these may lead to dangerous—or, in any case, anomalous—events.
Among these surrogate safety indicators, the best known are Time to Collision (TTC) and Post-Encroachment Time (PET). In 1971, Hayward [
10] introduced the use of TTC (
Figure 2), which is the time in which two vehicles would collide if they continued travelling on the same trajectory with their speeds unchanged.
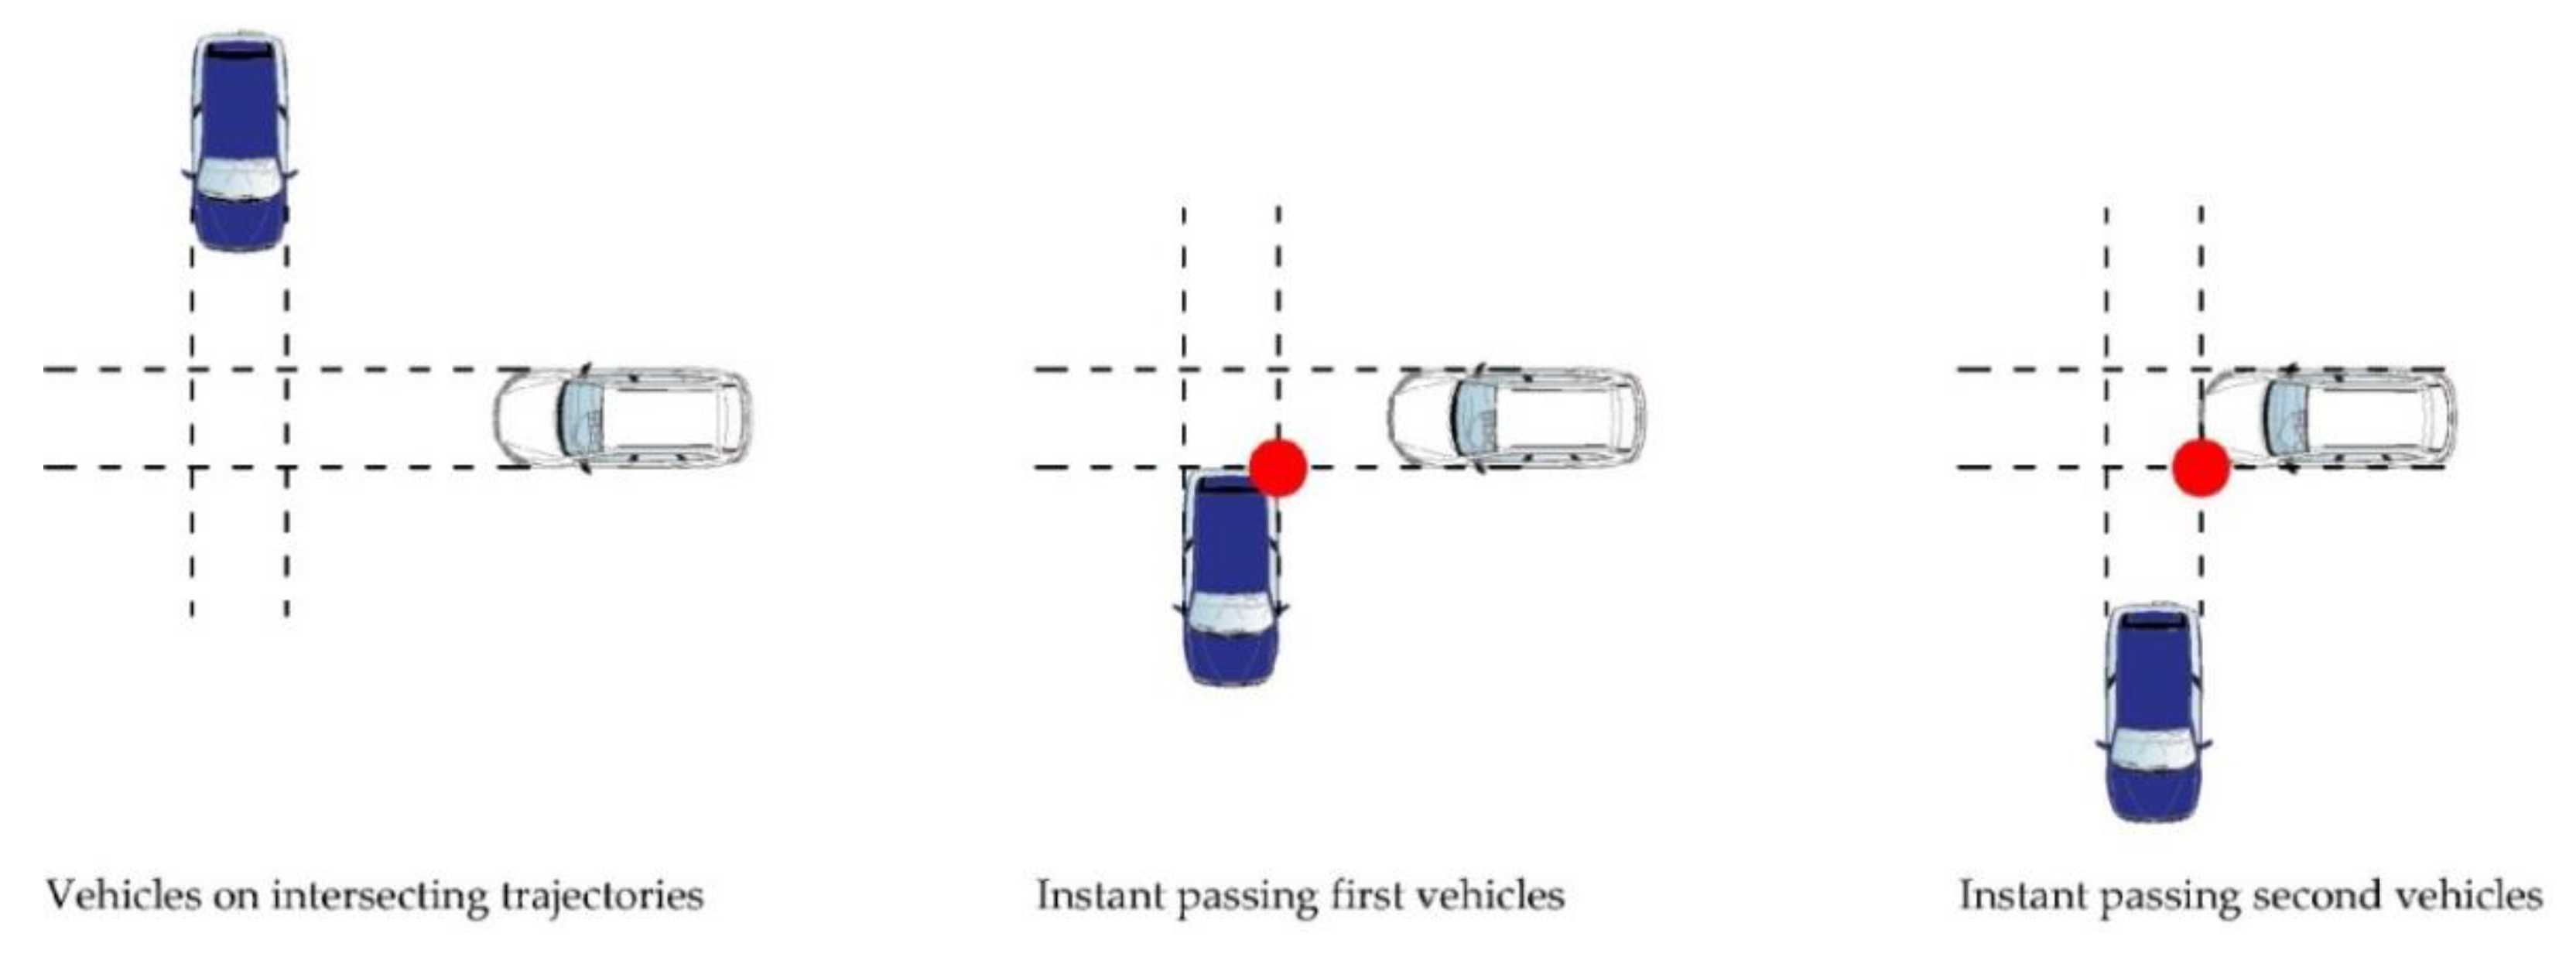
The PET time (
Figure 3) was applied for the first time in the field of road safety assessment in 1978 by Allen et al. [
11]. Considering vehicles on intersecting trajectories, the PET time is calculated from the moment in which the first vehicle passes at the intersection point until the moment when the second vehicle also passes.
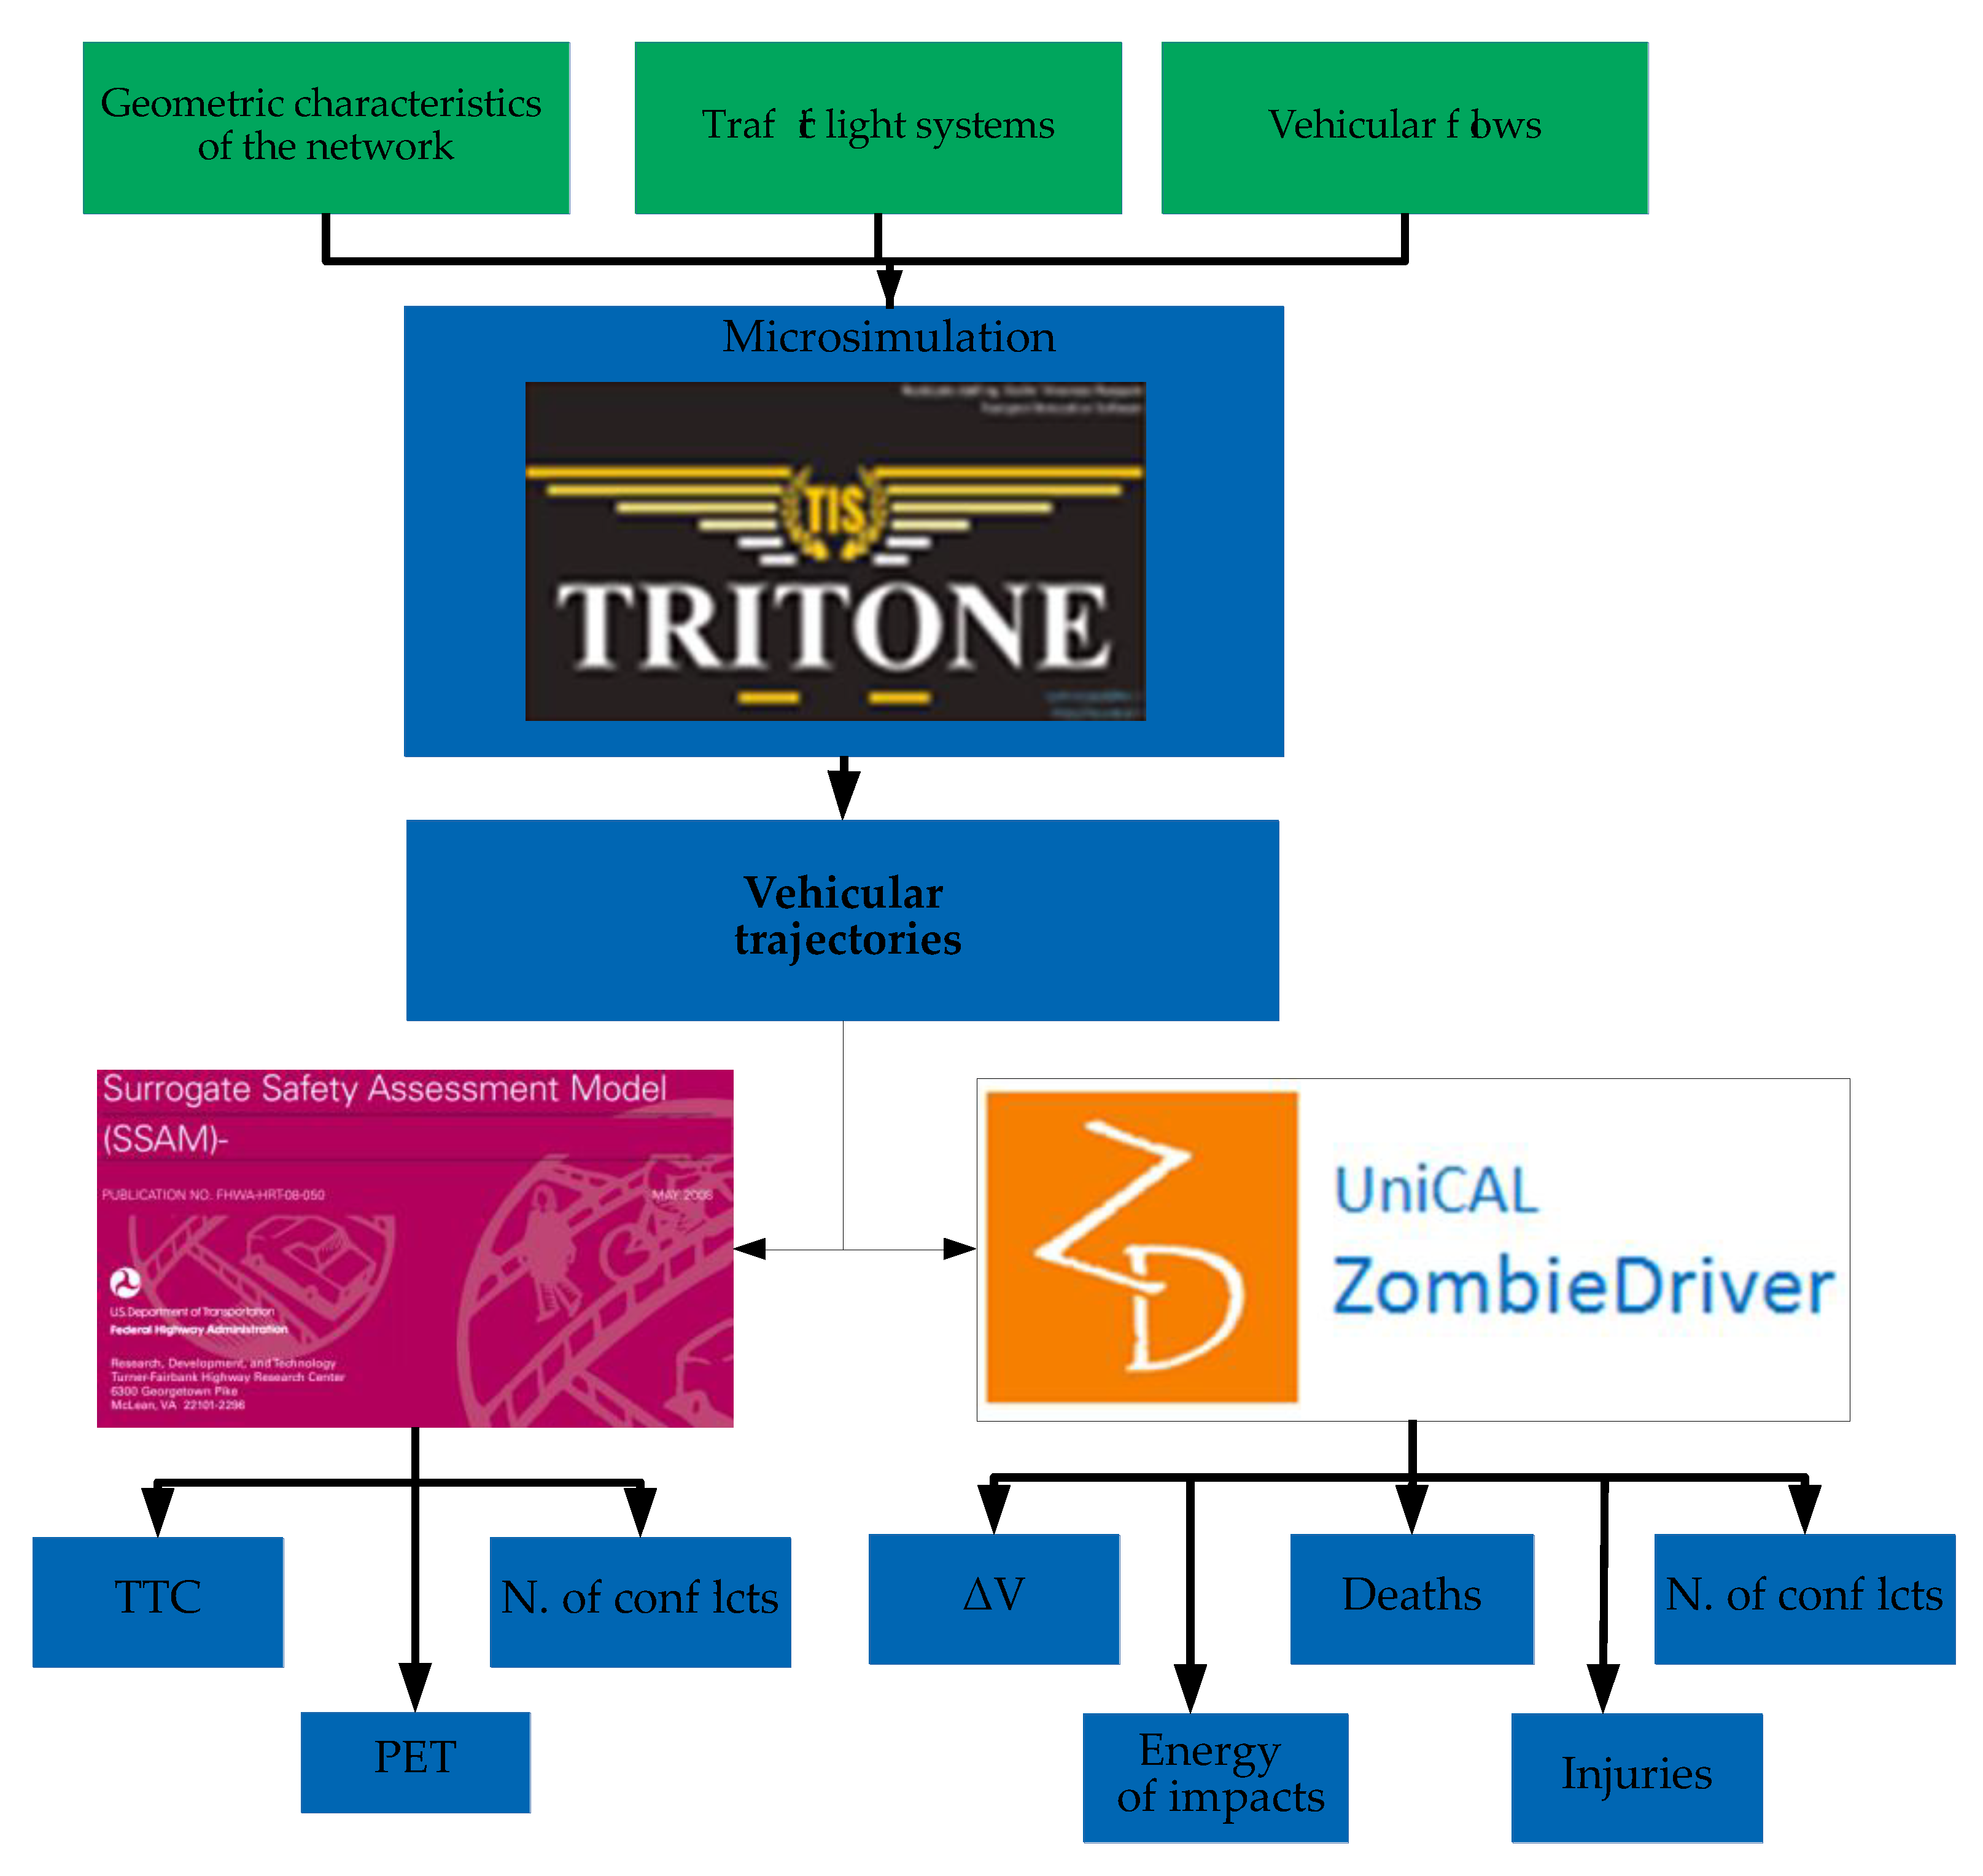
The first implementations of surrogate safety indicators were applied to real trajectories (especially at intersections). Trajectories can also be generated by microsimulation. With the idea of evaluating traffic safety levels in a microsimulation environment, the Software Surrogate Safety Assessment Model (SSAM) [
12] was developed in 2008. SSAM is able to identify, classify and evaluate the various conflicts that can be generated between different vehicles in a network in an automatic way (generally, the Software considers the possibility of a conflict occurring in the event that TTC ≤ 1.5 s or PET ≤ 5 s). SSAM analyses the trajectories extracted from some of the most well-known microsimulation software—including AIMSUN [
13], VISSIM [
14], Paramics [
15] and TEXAS [
16]—and identifies and catalogs every possible conflict. In addition, for each conflict, SSAM establishes the values of TTC, PET, etc.
Recently, three meticulously compiled papers present a state of the art on traffic conflicts, road safety simulation modelling and on the use of surrogate safety measures [
17,
18,
19]. All these three works indicate some of the limitations of using microsimulation and surrogate safety measures.
Young et al. [
18] recognize the potential for simulation to become a useful tool for road traffic safety, yet they also state that further research is needed since driver behaviours that may generate an accident have not been considered holistically in simulation. Moreover, they affirm that “The theory behind driver behaviour in crashes” and the presence of heavy vehicles are not commonly taken into account.
Zheng et al. [
19] point out that common traffic safety indicators consider only the occurrence of conflicts without taking into consideration the real consequences of a potential crash: “proximity measure can only reflect the risk of collision but not the severity of crashes, which is typically differentiated based on consequences of the crash, not proximity.”
Furthermore, Laureshyn et al. [
20] explain that commonly used surrogate safety performance measures convey “proximity” to a crash and overlook the potential severity of the consequences of a crash. The consequences need to be taken into account in some way [
21].
Crash severity is an extremely important measure [
22] and, strangely, the severity of potential crashes was only introduced in surrogate safety indicators in 2017, with the Extended Delta-V method [
20]. Delta-V commonly means the variation of the speed vector V of a vehicle after an accident. This value can describe the magnitude of the impact, taking into consideration vehicle dynamics and physical dimensions; in fact, if you consider, for example, the impact between a very small vehicle with one of large dimension, it will occur that the first vehicle will bounce while the second will continue its motion almost unaffected.
Moreover, the elephant in the room for the current application of these methodologies lies in the important, easily observable fact that not all accidents are caused by vehicles travelling on conflicting trajectories. According to statistics, collisions between isolated vehicles and fixed objects are extremely important in road safety [
23,
24,
25], and account of more than 40% of all fatal accidents (not involving pedestrians or bicycles).
In other words, all previously introduced road traffic safety indicators are incomplete in their use since they are based on conflict techniques that do not take into account roadside obstacles and barriers.
Traditionally in transportation engineering, quantitative approaches have been applied to solve congestion problems with attempts to shift demand on transit systems [
26] and to implement better road traffic control by adopting tools such as traffic simulation [
18,
27,
28,
29,
30,
31] dynamic network loading equilibrium, dynamic models [
32,
33,
34,
35] and methodologies attempting to affect user route choice [
36,
37,
38,
39,
40]. Quantitative approaches involving network modelling have seldom been applied to Traffic Safety evaluation.
The above-indicated limitations are possibly among the reasons why simulation was never used to find out black spots and to evaluate safety levels in current engineering practices.
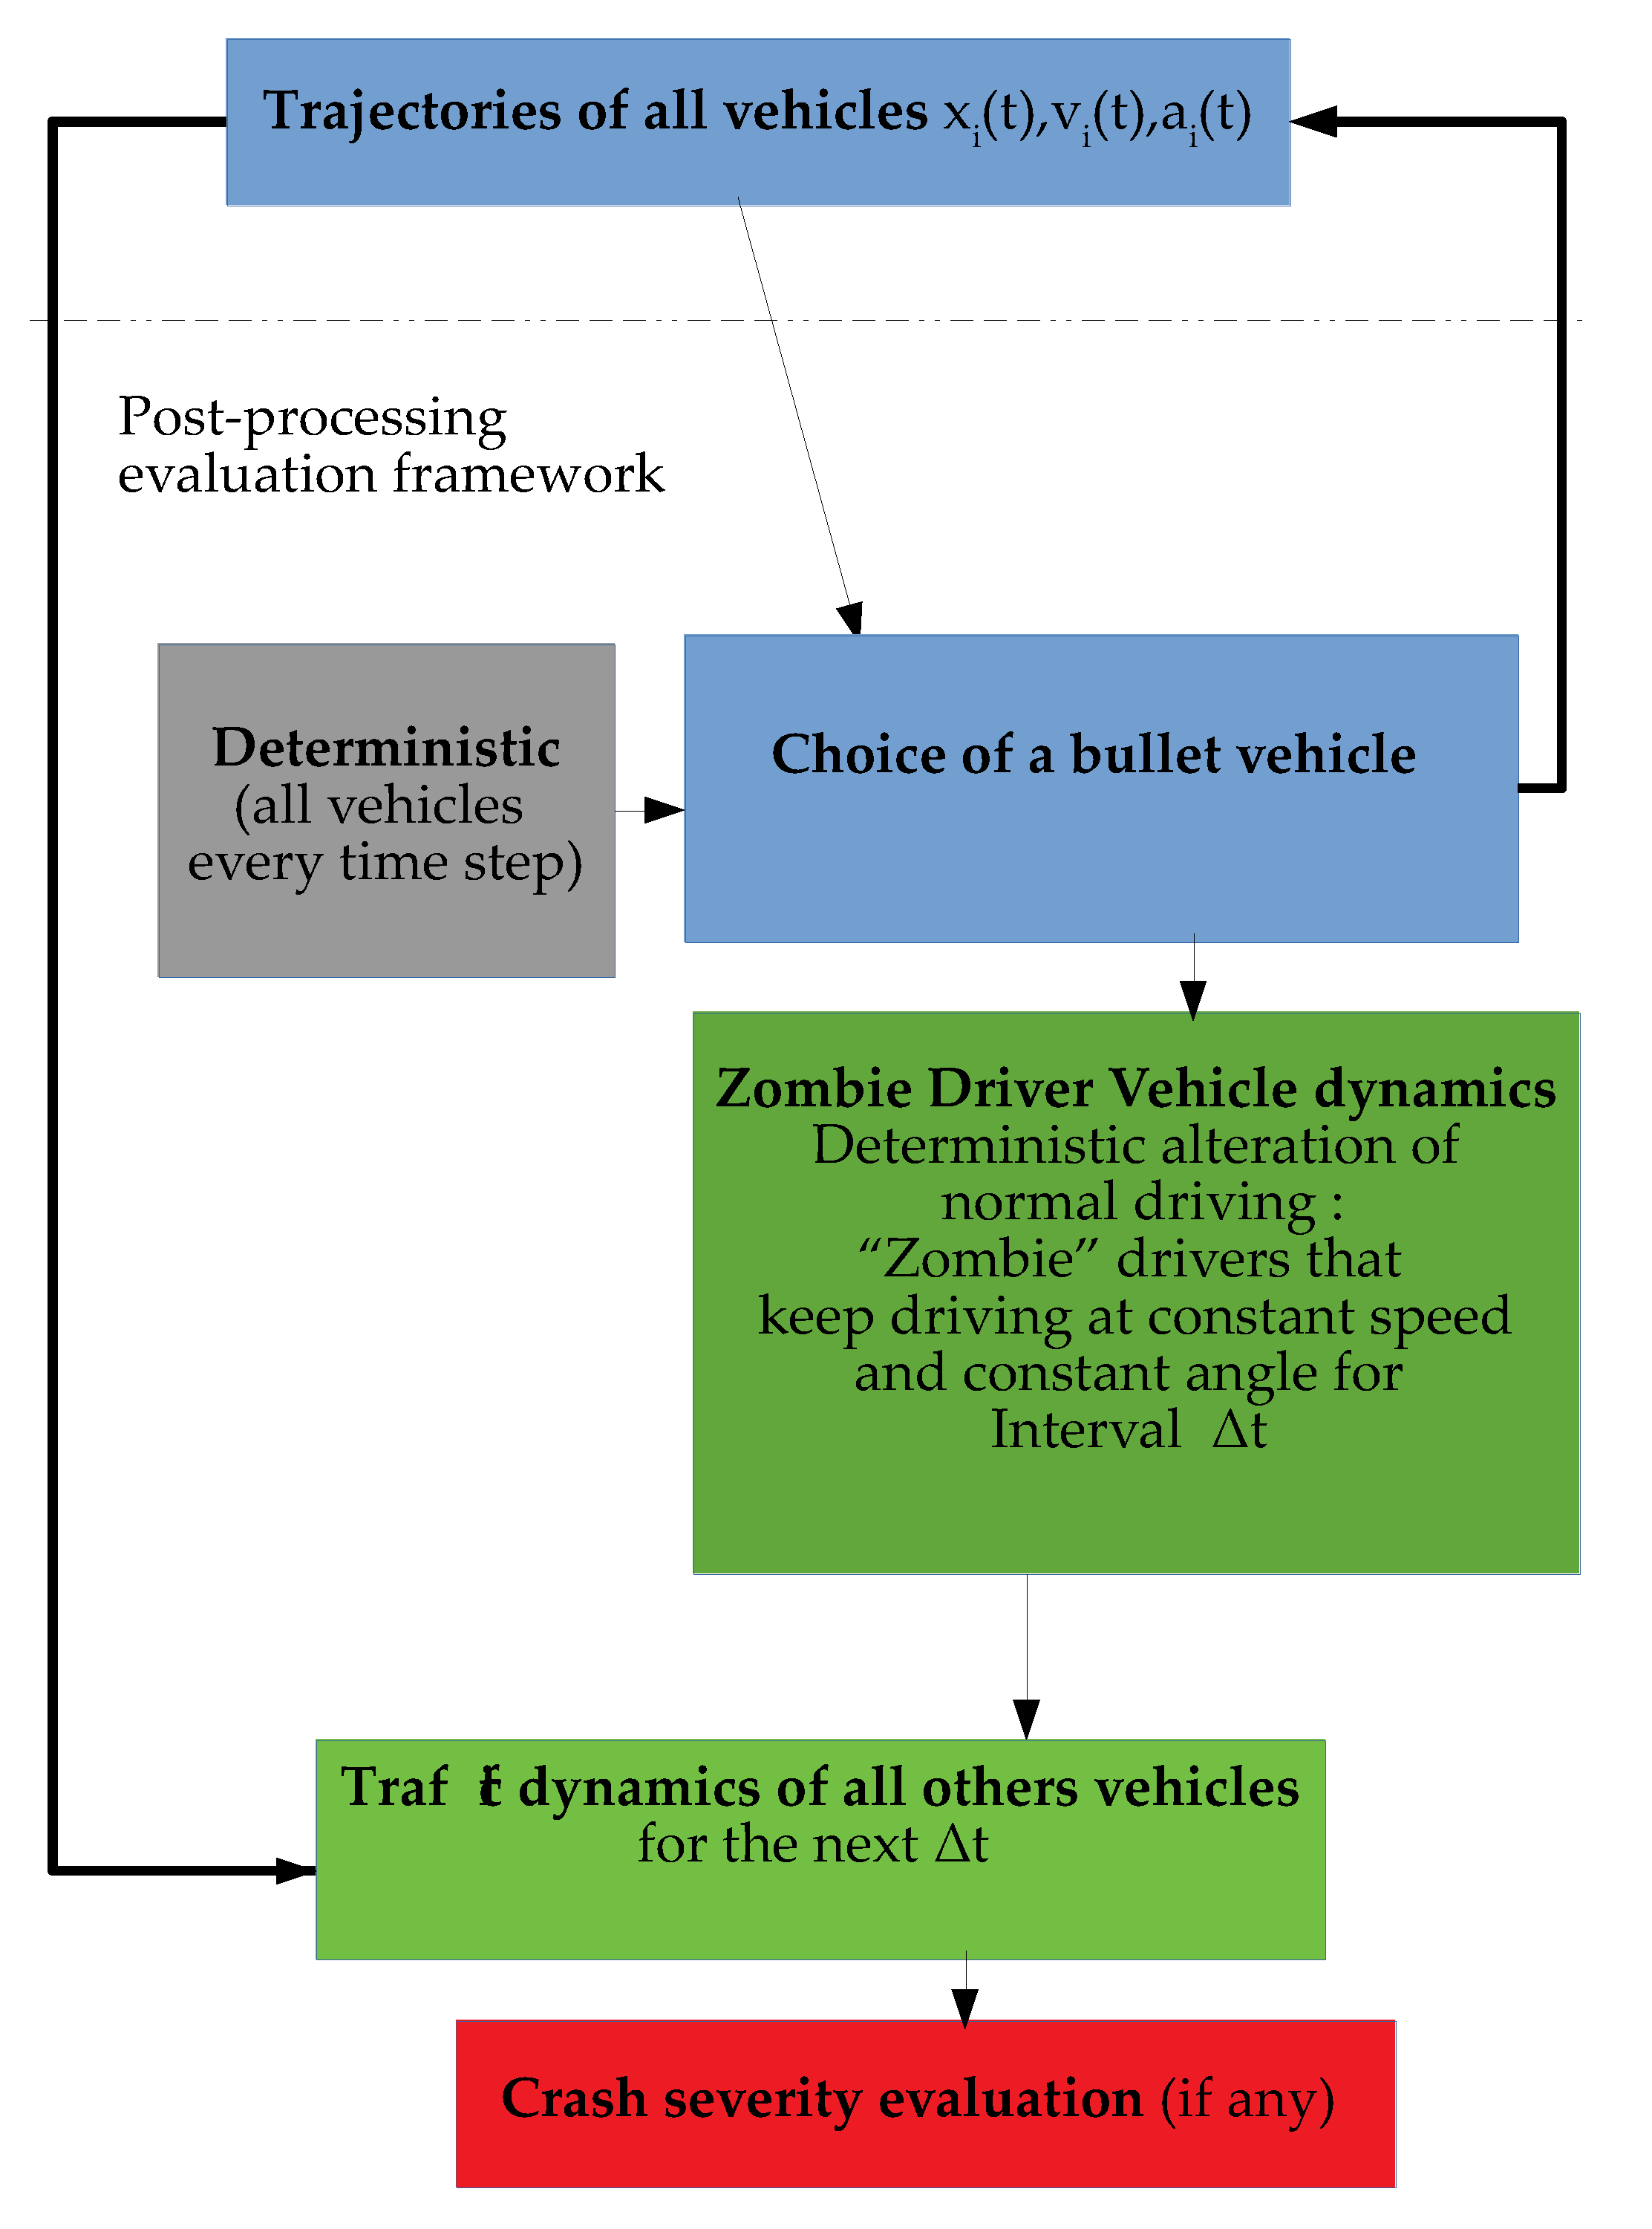
To address these problems and to boost the use of microsimulation for the assessment of traffic safety levels in 2018, in the Department of Civil Engineering of the University of Calabria, the Zombie Driver (ZD) methodology was developed [
29]. The methodology follows the traditional approach of conflict based indicators and can be applied to real vehicular trajectories or simulated trajectories derived from microsimulation environments such as AIMSUN [
13], VISSIM [
14] and Tritone [
28,
41]. This methodology can encompass all the aspects described, and also introduces the human factor (the possible distraction of the users) as a trigger for accident events.
The objective of this document will, therefore, be the validation of the latter methodology and, a comparison with other previously introduced surrogate safety indicators. Results of the analysis carried out show a better correlation between the newly proposed indicator and real crash data than other more commonly used classic indicators.
4. Discussion
The first statistical analysis that was conducted with Spearman and Pearson methodologies was able to establish the best indicators according to the given data.
The results of the proposed methodology show a good correlation between simulated parameters and the real crash data with both the Pearson [
46] and the Spearman [
47] index. The results are noticeably better than those obtained with other classical conflict-based indicators extracted from SSAM software such as TTC and PET.
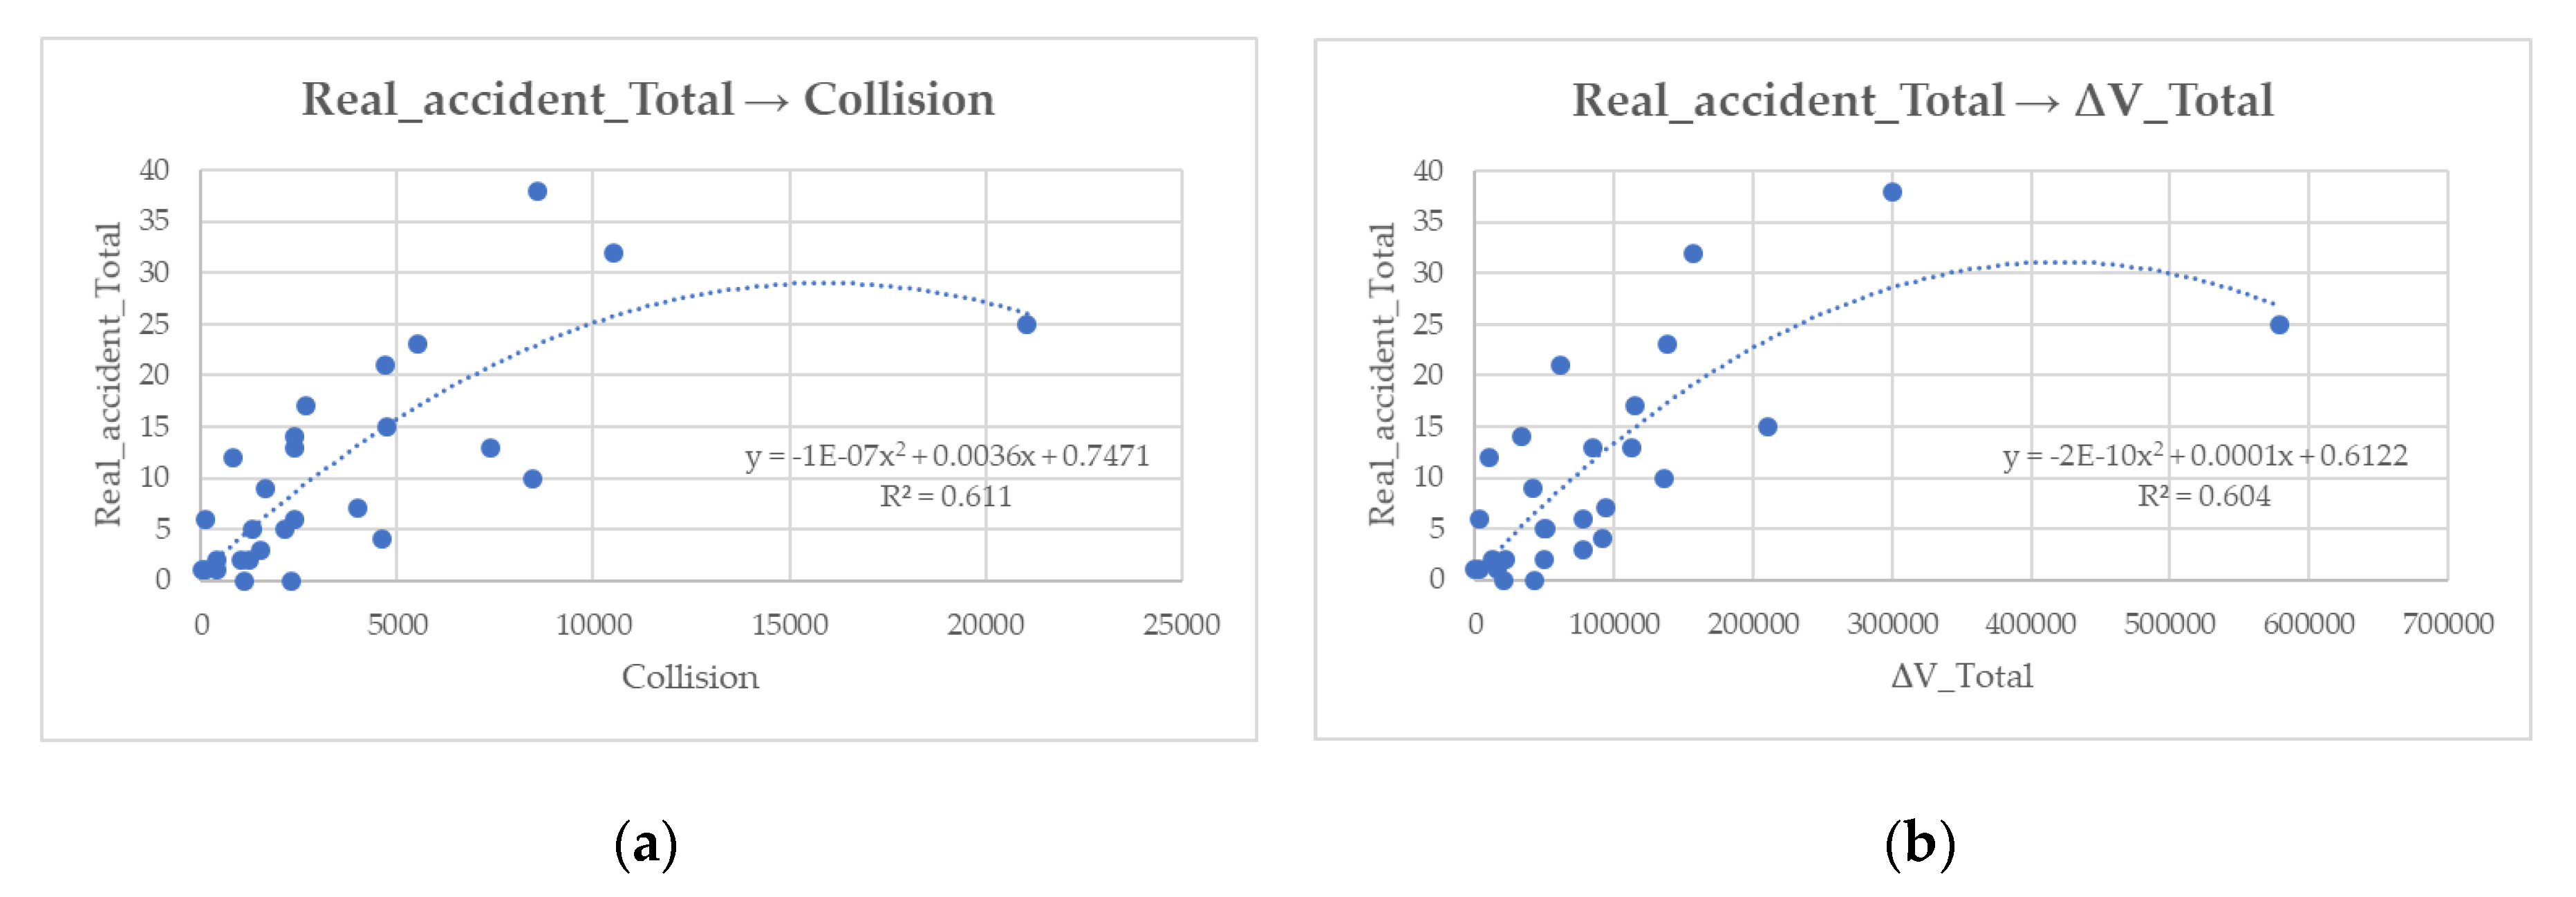
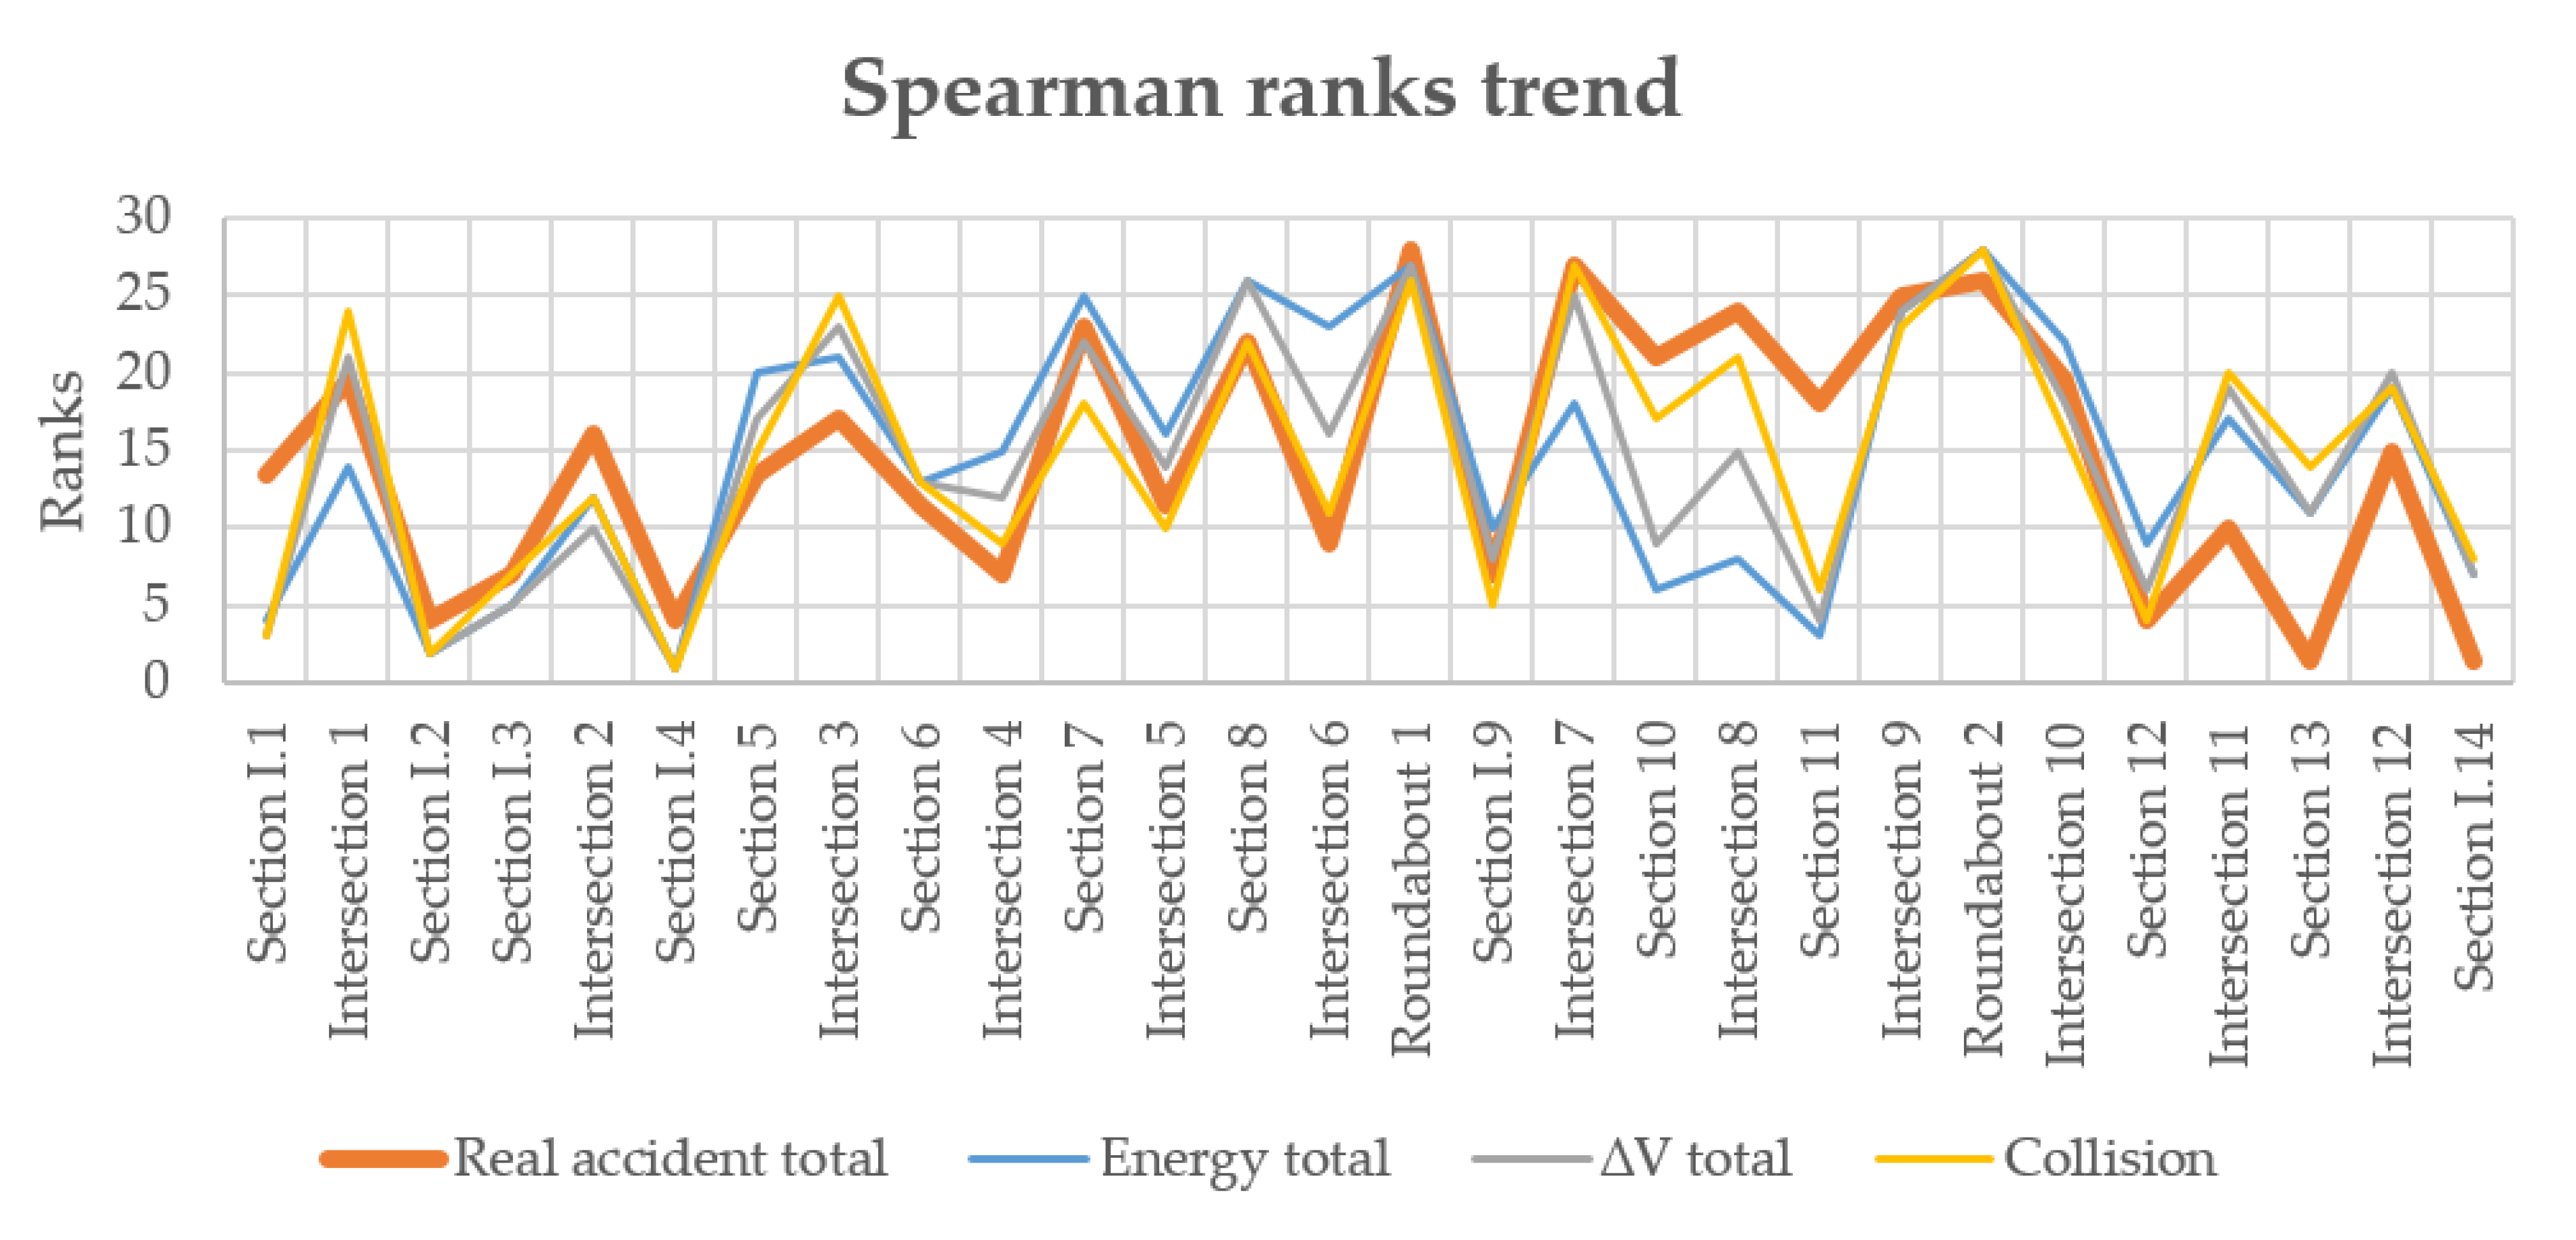
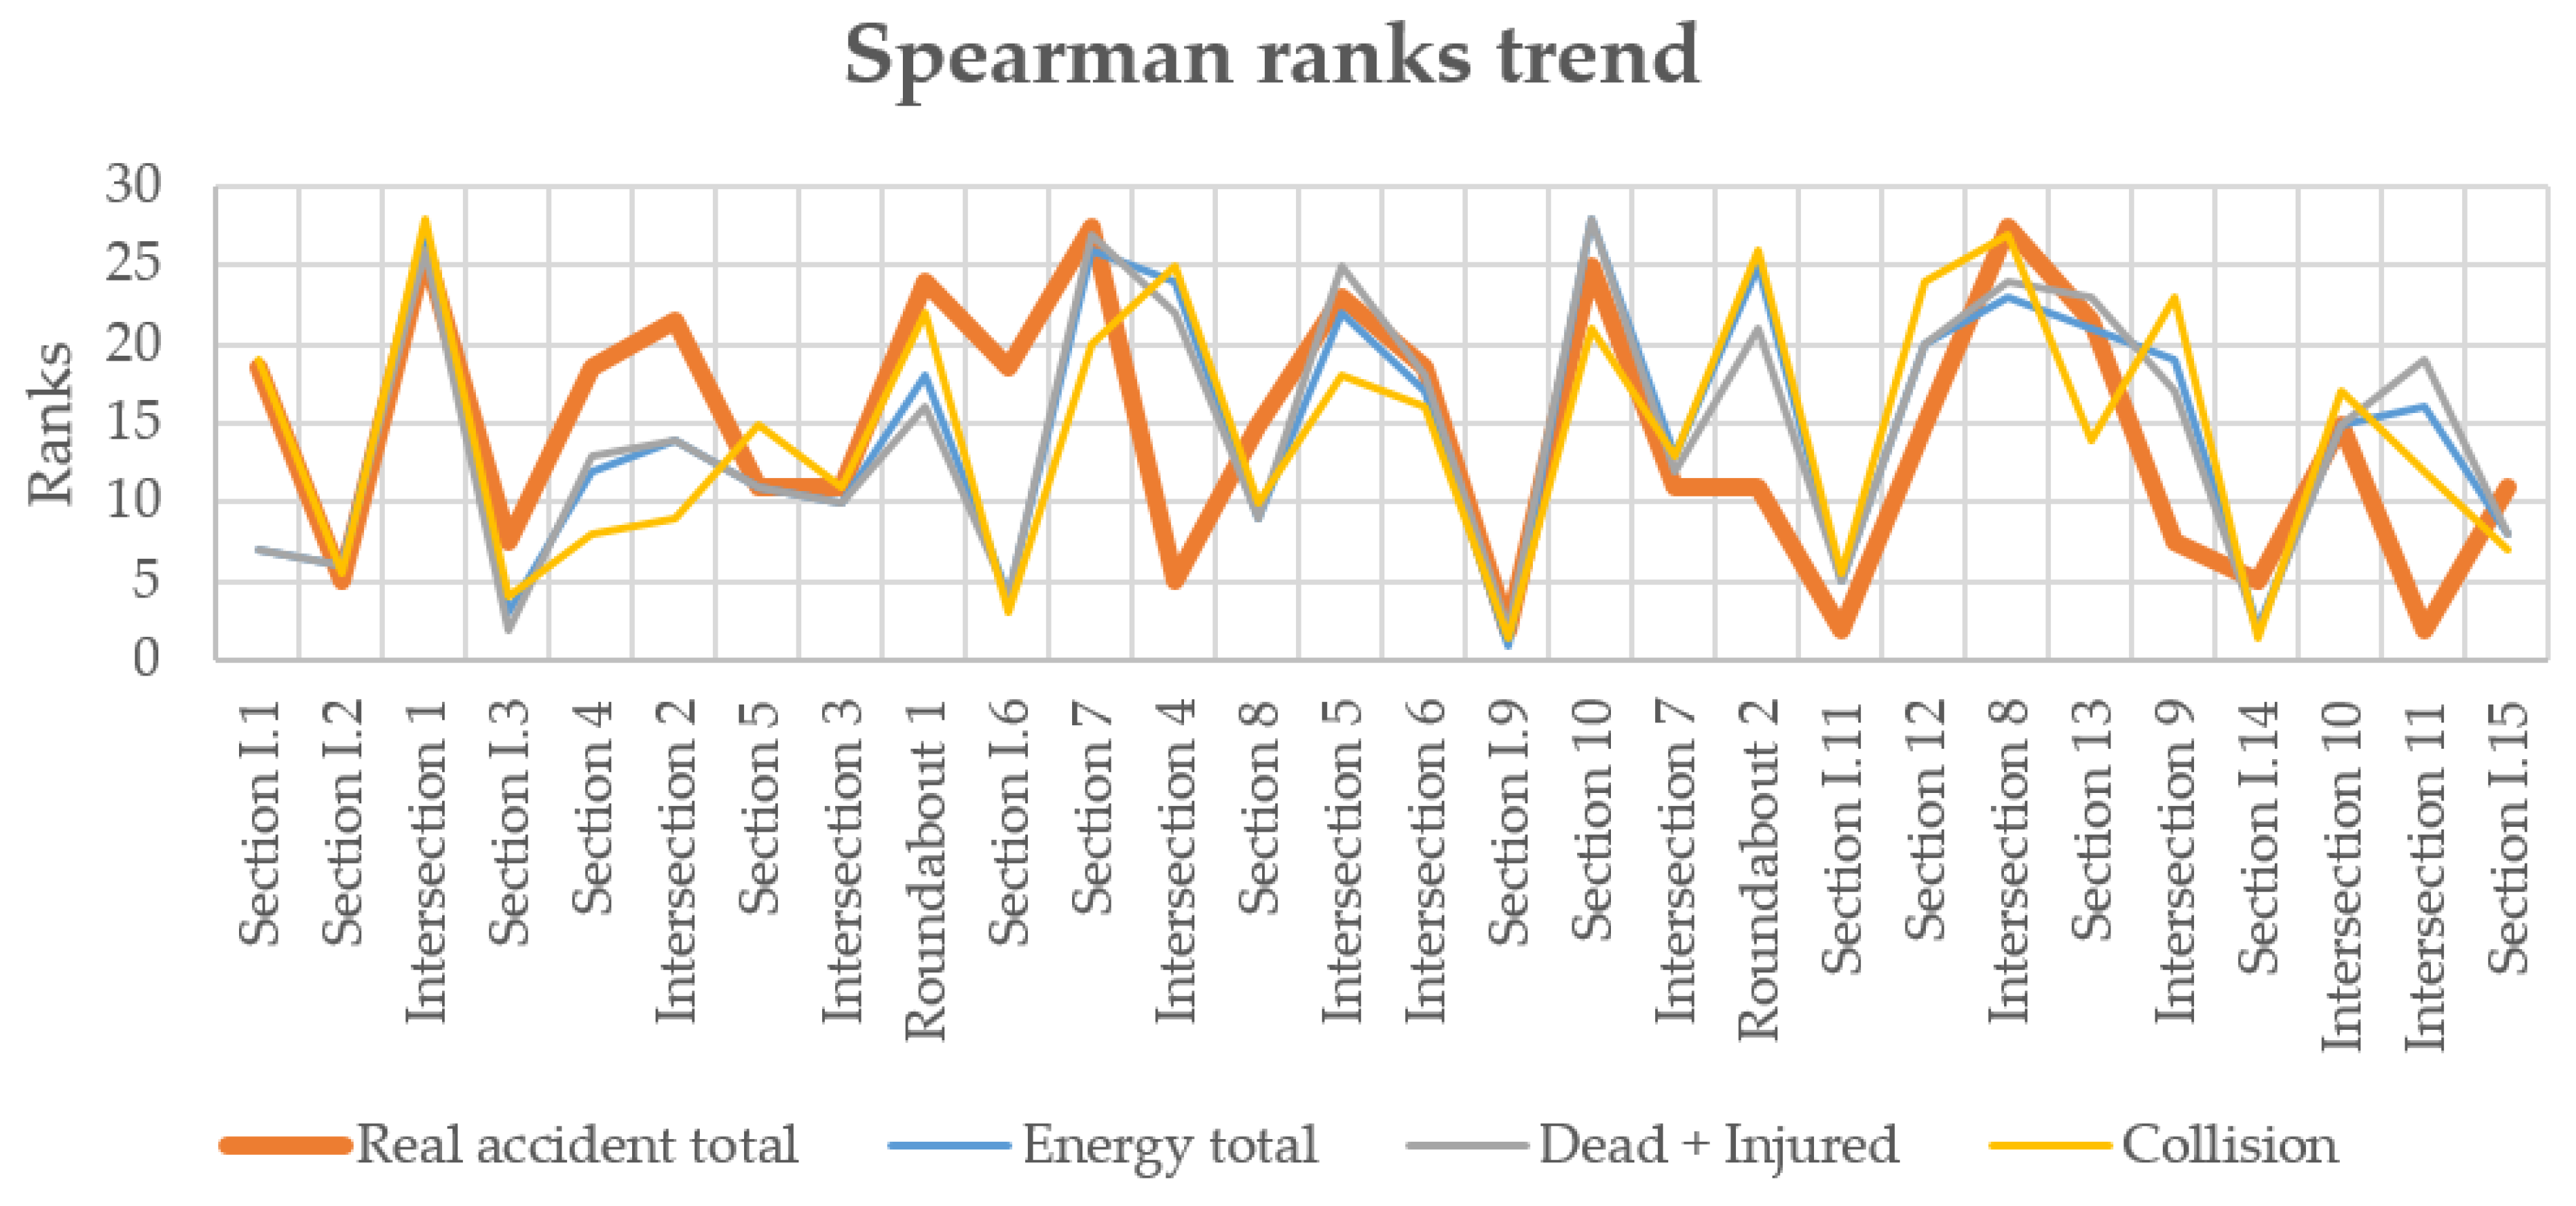
In case study 1, the parameters that showed better correlation (both of Pearson [
20] and of Spearman [
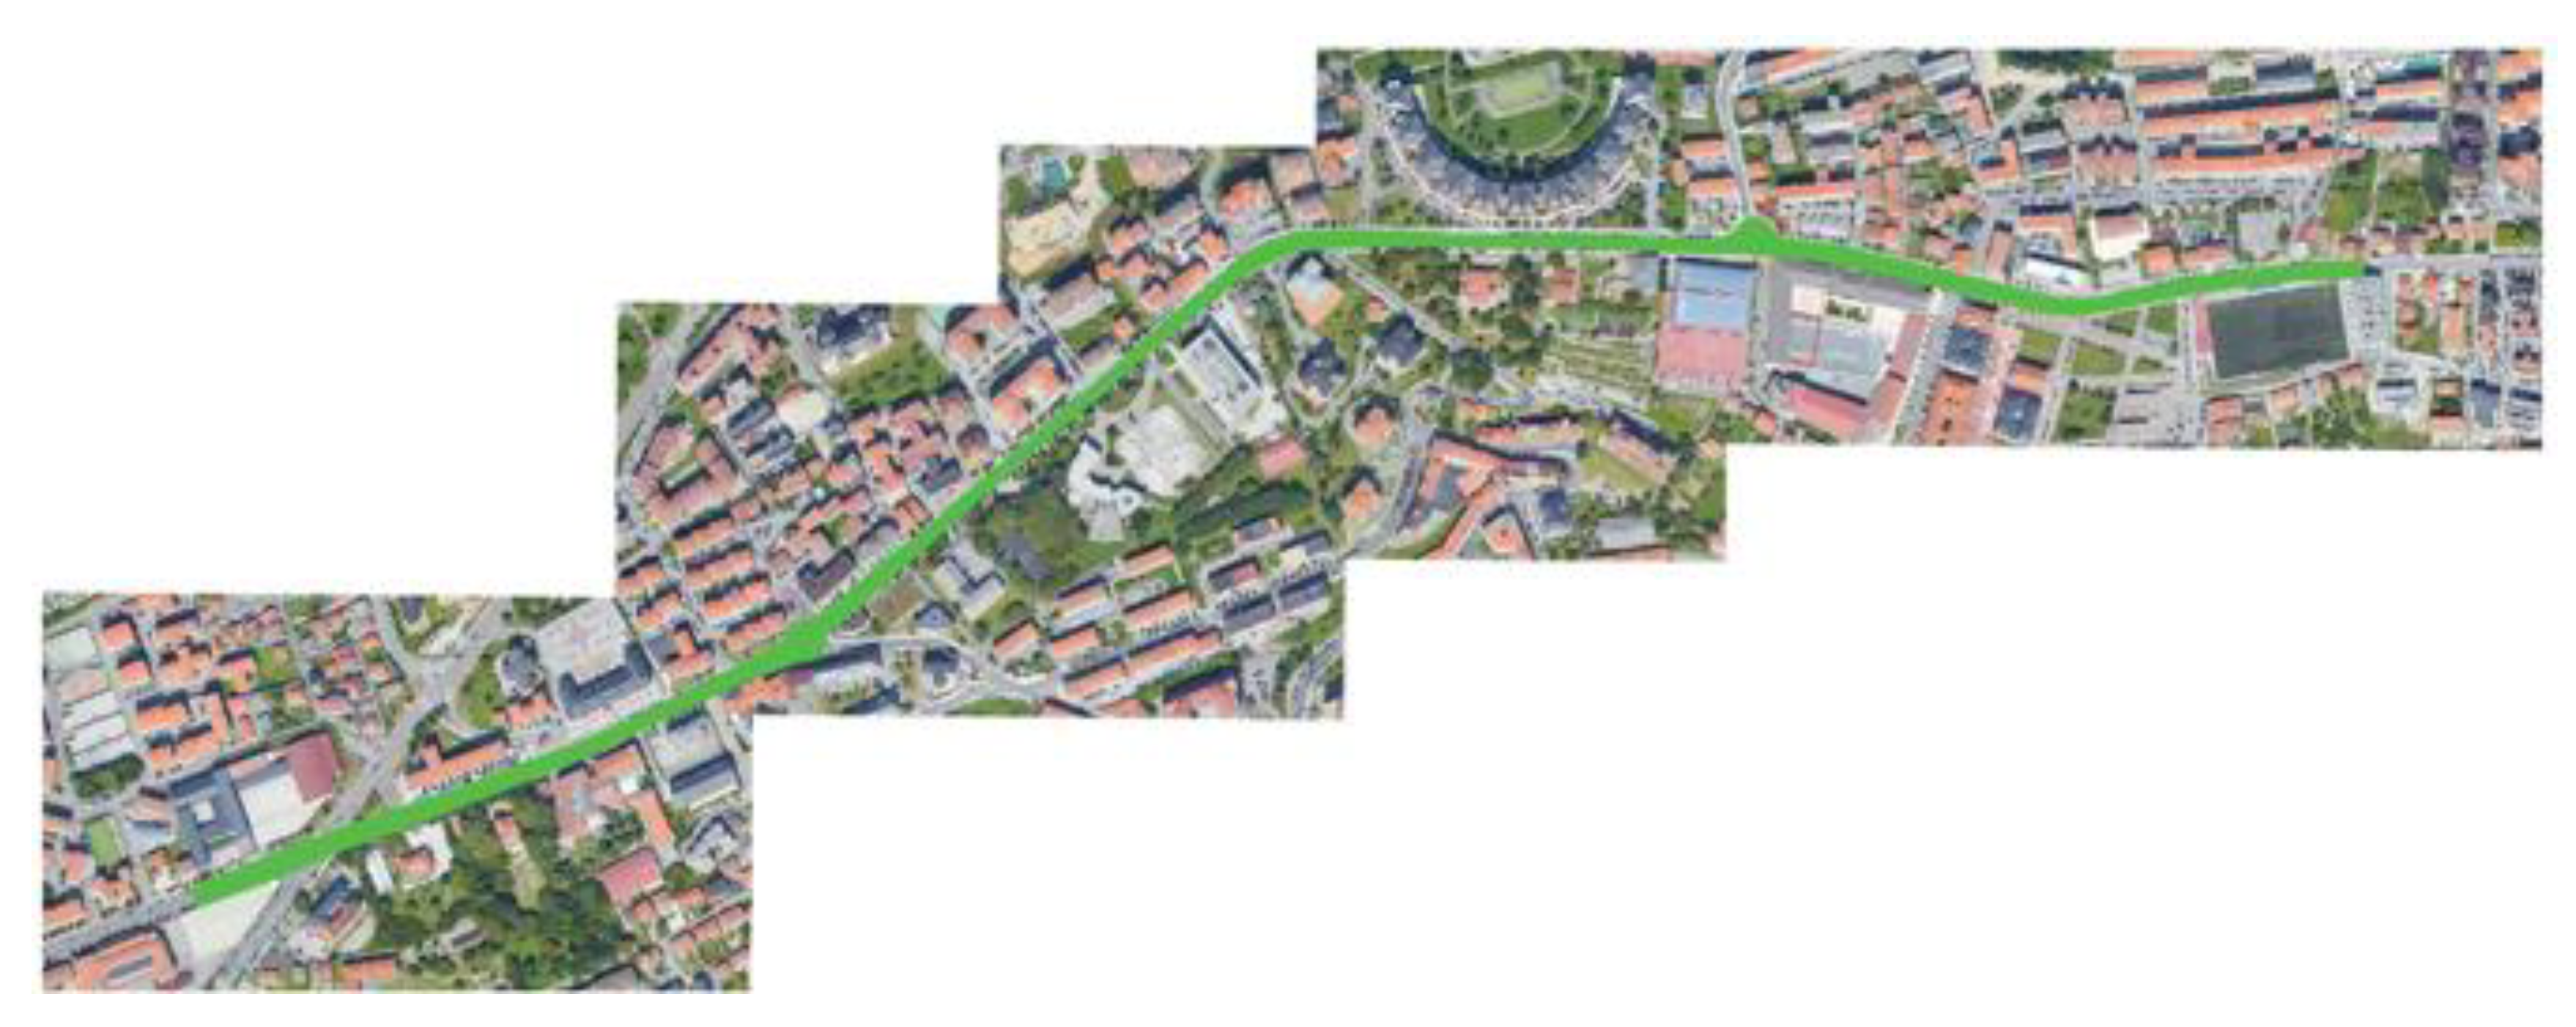
47]) turn out to be ∆V total and collision; instead, in case study 2, the parameters that are best correlated to the real data are those related to the number of deaths and the number of injuries. This stems from the fact that the area of Paseo de Pereda is an urban area where vehicles are very close to each other. This condition favours the onset of probable conflicts as they are determined precisely by the distance (spatial and temporal) between vehicles. Contrastingly, the area of Paseo del General Dávila, being a more peripheral and less busy area, leads to vehicles achieving higher speeds, and this is evidenced by the fact that all the parameters that showed the best correlations are all derived from ∆V.
The study discussed in this document was carried out on two different areas of study in order to differentiate the analysis of accidents as much as possible and to obtain a validation of the method on more than one scenario. This work also applied a multiple linear regression, which allowed us to derive the Equations (18) and (19)—useful for the estimation of accidents.
It is possible to notice how the series of the simulated parameters follows the trend of the series of the real data in the two cases well; therefore, the Zombie Driver methodology shows a moderate correlation to the real observed data for both networks. This correlation is much better than what has been obtained with the classical indicators calculated with the SSAM methodology.
The poor correlation between the three indicators calculated with the SSAM methodology is noticeable in this work, and possibly evidences a conceptual limit of currently used surrogate safety performance indicators. The classical theory of conflicts does consider the existence of a conflict, though only when two vehicles are driving on conflicting trajectories. Vehicles that are travelling in opposite directions on a two-way single carriageway do not generate any conflict. In our network, there were many lanes for direction and intense traffic. Despite this dangerous layout that actually produced many accidents, there were many road areas (sections) in which there was not even one conflict according to SSAM methodology.
This result is the most important result of this paper, and—if confirmed by other works conducted on the same road network or similar road networks (where many parallel lanes share a two-way single carriageway)—it may suggest a restriction for the field of applicability of indicators such as TTC.
Regarding the presented Zombie Driver methodology, the ∆V parameter has a good ranking in terms of correlation in both case studies, despite the different conditions that exist on the two networks. It can be stated that the ∆V parameter represents the most reliable surrogate safety indicator according to this work. This result is in accordance with recent studies that have proposed an evolution from traditional traffic safety indicators that can be obtained from SSAM software [
20]. This new direction of research suggests, in fact, the use of indicators that consider the severity of potential crashes.
The results of this paper are based on two simple networks for a total simulated distance of 3.6 km. The results are not sufficient to draw out a definitive conclusion on classical surrogate safety indicators. More research efforts can be devoted to confirm the presented results and better calibrate the Zombie Driver procedure (or any other procedure that introduces random deviation in vehicle trajectories). Despite the limitations of this work, we can conclude, that the presented results for decision-makers imply that there is a need to apply (with great caution) microsimulation and classical surrogate safety indicators for situations where an economical assessment of different road sections is requested.
Microsimulation can be a great tool for helping in decisions on exactly what safety requalification interventions can be programmed, but more research is yet to be carried out before this becomes an established methodology.
