Article

Lost Material Stock in Buildings due to Sea Level Rise from Global Warming: The Case of Fiji Islands

1
Material Flow Management and Resource Economy, Institute IWAR, Technische Universität Darmstadt, Franziska-Braun-Strasse 7, 64287 Darmstadt, Germany
2
Graduate School of Environmental Studies, Nagoya University, Furo-cho, Chikusa-ku, Nagoya 464-8601, Japan
3
School of Forestry & Environmental Studies, Yale University, 195 Prospect Street, New Haven, CT 06511, USA
*
Author to whom correspondence should be addressed.
Sustainability 2020, 12(3), 834; https://doi.org/10.3390/su12030834
Submission received: 6 December 2019 / Revised: 16 January 2020 / Accepted: 19 January 2020 / Published: 22 January 2020
(This article belongs to the Special Issue The Metabolism of Islands)

Abstract

:
This study developed a methodology to estimate the amount of construction material in coastal buildings which are lost due to climate change-induced sea level rise. The Republic of Fiji was chosen as a case study; sea level rise is based on predictions by the Intergovernmental Panel on Climate Change for the years 2050 and 2100. This study combines the concept of a geographic information system based digital inundation analysis with the concept of a material stock analysis. The findings show that about 4.5% of all existing buildings on Fiji will be inundated by 2050 because of an expected global sea level rise of 0.22 m (scenario 1) and 6.2% by 2100 for a sea level rise of 0.63 m (scenario 2). The number of buildings inundated by 2050 is equivalent to 40% of the average number of new constructed buildings in Fiji Islands in a single year. Overall, the amount of materials present in buildings which will be inundated by 2050 is 900,000 metric tons (815,650 metric tons of concrete, 52,100 metric tons of timber, and 31,680 metric tons of steel). By 2100, this amount is expected to grow to 1,151,000 metric tons (1,130,160 metric tons of concrete, 69,760 metric tons of timber, and 51,320 metric tons of steel). The results shall contribute in enhancing urban planning, climate change adaptation strategies, and the estimation of future demolition flows in small island developing states.

1. Introduction

Anthropogenic activities have changed the Earth’s temperature by approximately 1 °C between the period of 1850–1900 and the year of 2017 [1]. This has led to an average global sea level rise (SLR) of 3.20 mm/year. It is expected with 67% confidence that by 2100, the global average sea level will rise by 0.28 m to 0.98 m relative to the mean sea level of the years 1986–2005 [2].
The effects of SLR include the salinization of coastal agricultural areas and water storages, the destruction of coastal eco-systems, the erosion of shorelines, and the destruction of buildings and infrastructure [1]. SLR affects coastal countries all over the world, such as China, the Netherlands, Nigeria and the United Kingdom [3]. Some of the most impacted regions are the islands located in the Caribbean Sea and in the South Pacific, the so-called Small Island Developing States, as well as southern and eastern parts of Asia [4]. The Intergovernmental Panel on Climate Change (IPCC) developed four Representative Concentration Pathways (RCPs). They refer to four different pathways of Greenhouse Gas (GHG) emissions and atmospheric concentrations, air pollutant emissions and land use. While RCP 4.5 and RCP 6.0 refer to intermediate scenarios, RCP 2.6 refers to very low GHG emissions keeping global warming likely below 2 °C. RCP 8.5 refers to a very high GHG emissions pathway [5]. Kulp and Strauss [6] estimated that a global warming of 2 °C in relation to RCP 4.5 results in an increase of 40 million additional people to live permanently below the high tide line until 2050 and an increase of 90 million people until 2100.
In particular, Small Island Developing States are affected by this since their geomorphology is often characterized by low-elevation islands with population concentrated along their coasts [7]. In addition, Small Island Developing States heavily depend on the functioning of coastal ecosystems, and their economies are highly sensitive to slight changes [7,8]. Furthermore, they are more vulnerable to the effects of SLR because most of them lack institutional, financial and technical structures to adapt to it [7].
Vulnerability assessment studies for Small Island Developing States have been carried out within various states, such as islands in the Caribbean Sea [9,10], in South-East Asia [11,12] and in the Southern Pacific [13,14]. In 2008, Gravelle and Mimura [13] conducted a vulnerability assessment for the Republic of Fiji aiming to point out areas that are threatened by the SLR for different SLR scenarios. This study illustrated that most urban centers will face partial inundation within this century and that a proportional increase between the SLR and the total inundated area can be observed. Other vulnerability assessments estimated the total flooded area of specific regions [15], the number of inundated households and buildings being inhabitable within a certain area [16], the length of affected roads by the SLR [17] as well as the financial value of lost built structure [18].
Based on such vulnerability assessments, adaptation measurements incorporating SLR are being developed on the city, region or country level [7,19,20,21]. These include direct protection actions, such as the construction of barriers in the sea, and preventive actions, such as the relocation of houses or entire villages [21]. Relocations are fairly drastic solutions and generally require large economic and human resources. Moreover, they tend to destroy social structures, cultural traditions, as well as causing emotional stress [22]. Forced demolitions of coastal buildings and infrastructure result in large amounts of construction and demolition waste, which cause environmental stress. On top of this environmental pressure, the new facilities being built to replace the demolished ones will require new materials for the reconstruction. Nevertheless, information on the demolition waste streams from inundated coastal buildings is crucial for Small Island Developing States in two aspects: first, waste management is demanding due to limited land availability, remoteness, and high costs [23,24]; second, possibility of reuse of materials enables waste mitigation and contributes to the overcoming of resource shortages on Small Island Developing States [25,26].
However, while the effects of the SLR on the number of buildings inundated have already been studied by vulnerability assessment studies [16], these studies have not estimated demolition waste streams and materials required for reconstructions caused by SLR. The information on demolition waste streams and materials required for reconstructions can be extracted by the concept of material stock analysis (MSA). MSA is a method developed in the field of Industrial Ecology that allows the estimation of the amount of materials in use in the socio-economic sphere of our societies [27,28]. This tool has been used for estimating the mass of materials lost during the Great East Japan Earthquake [28]; waste flows coming from demolitions [29,30]; or the potential for urban mining [31]. To date, the concept of MSA has yet to be combined with vulnerability assessments that focus on SLR.
This study develops a novel methodology for an estimation of construction material amounts through a hybrid combination of geospatial analysis and material stock analysis, applying and evaluating it to the case study of the Republic of Fiji. This novel methodology can be applied to small islands/coastal regions for the estimation of lost material stock (MS) caused by the SLR. The Republic of Fiji was chosen as a case study area because it represents a typical Small Island Developing State due to a relatively high population density living along the coast, as well as the country’s limited climate adaptation capacity. In the following section (Materials and Methods), data sources and an introduction to the case study area, as well as a detailed explanation of the methodology are provided. In Section 3 (Results), the results of the spatial analysis are provided, along with a quantification of the construction materials (number of buildings and total mass) that will be permanently inundated. The results are separated by province in rural and urban dwellings. Additionally, high risk areas were identified. Section 4 (Discussion) provides insights and considerations on the findings. Section 5 (Conclusions) draws conclusions, discusses the limits of this methodology and points out future research steps.

2. Materials and Methods

This study’s research approach consists of two parts: firstly, a Geographic Information System-Digital Inundation Analysis Model (GIS-DIAMs) to calculate the number of flooded buildings and secondly an MSA to estimate the construction material stocked in those. Figure 1 represents a conceptualization of how the models were combined, while data sources are listed in Table 1.
The GIS-DIAM analysis enabled the identification of the number and location of buildings, subdivided per province and into rural and urban areas, subjected to inundation due to SLR. Using this result, the percentage of buildings inundated was estimated in comparison to the total number of buildings per province, also subdivided into rural and urban areas. The MSA was then conducted by assigning for each inundated building a construction typology, which carries information on the typical material intensities per m2. This information was then crossed with data on building size to estimate the amount of the materials concrete, steel and timber potentially lost due to SLR.

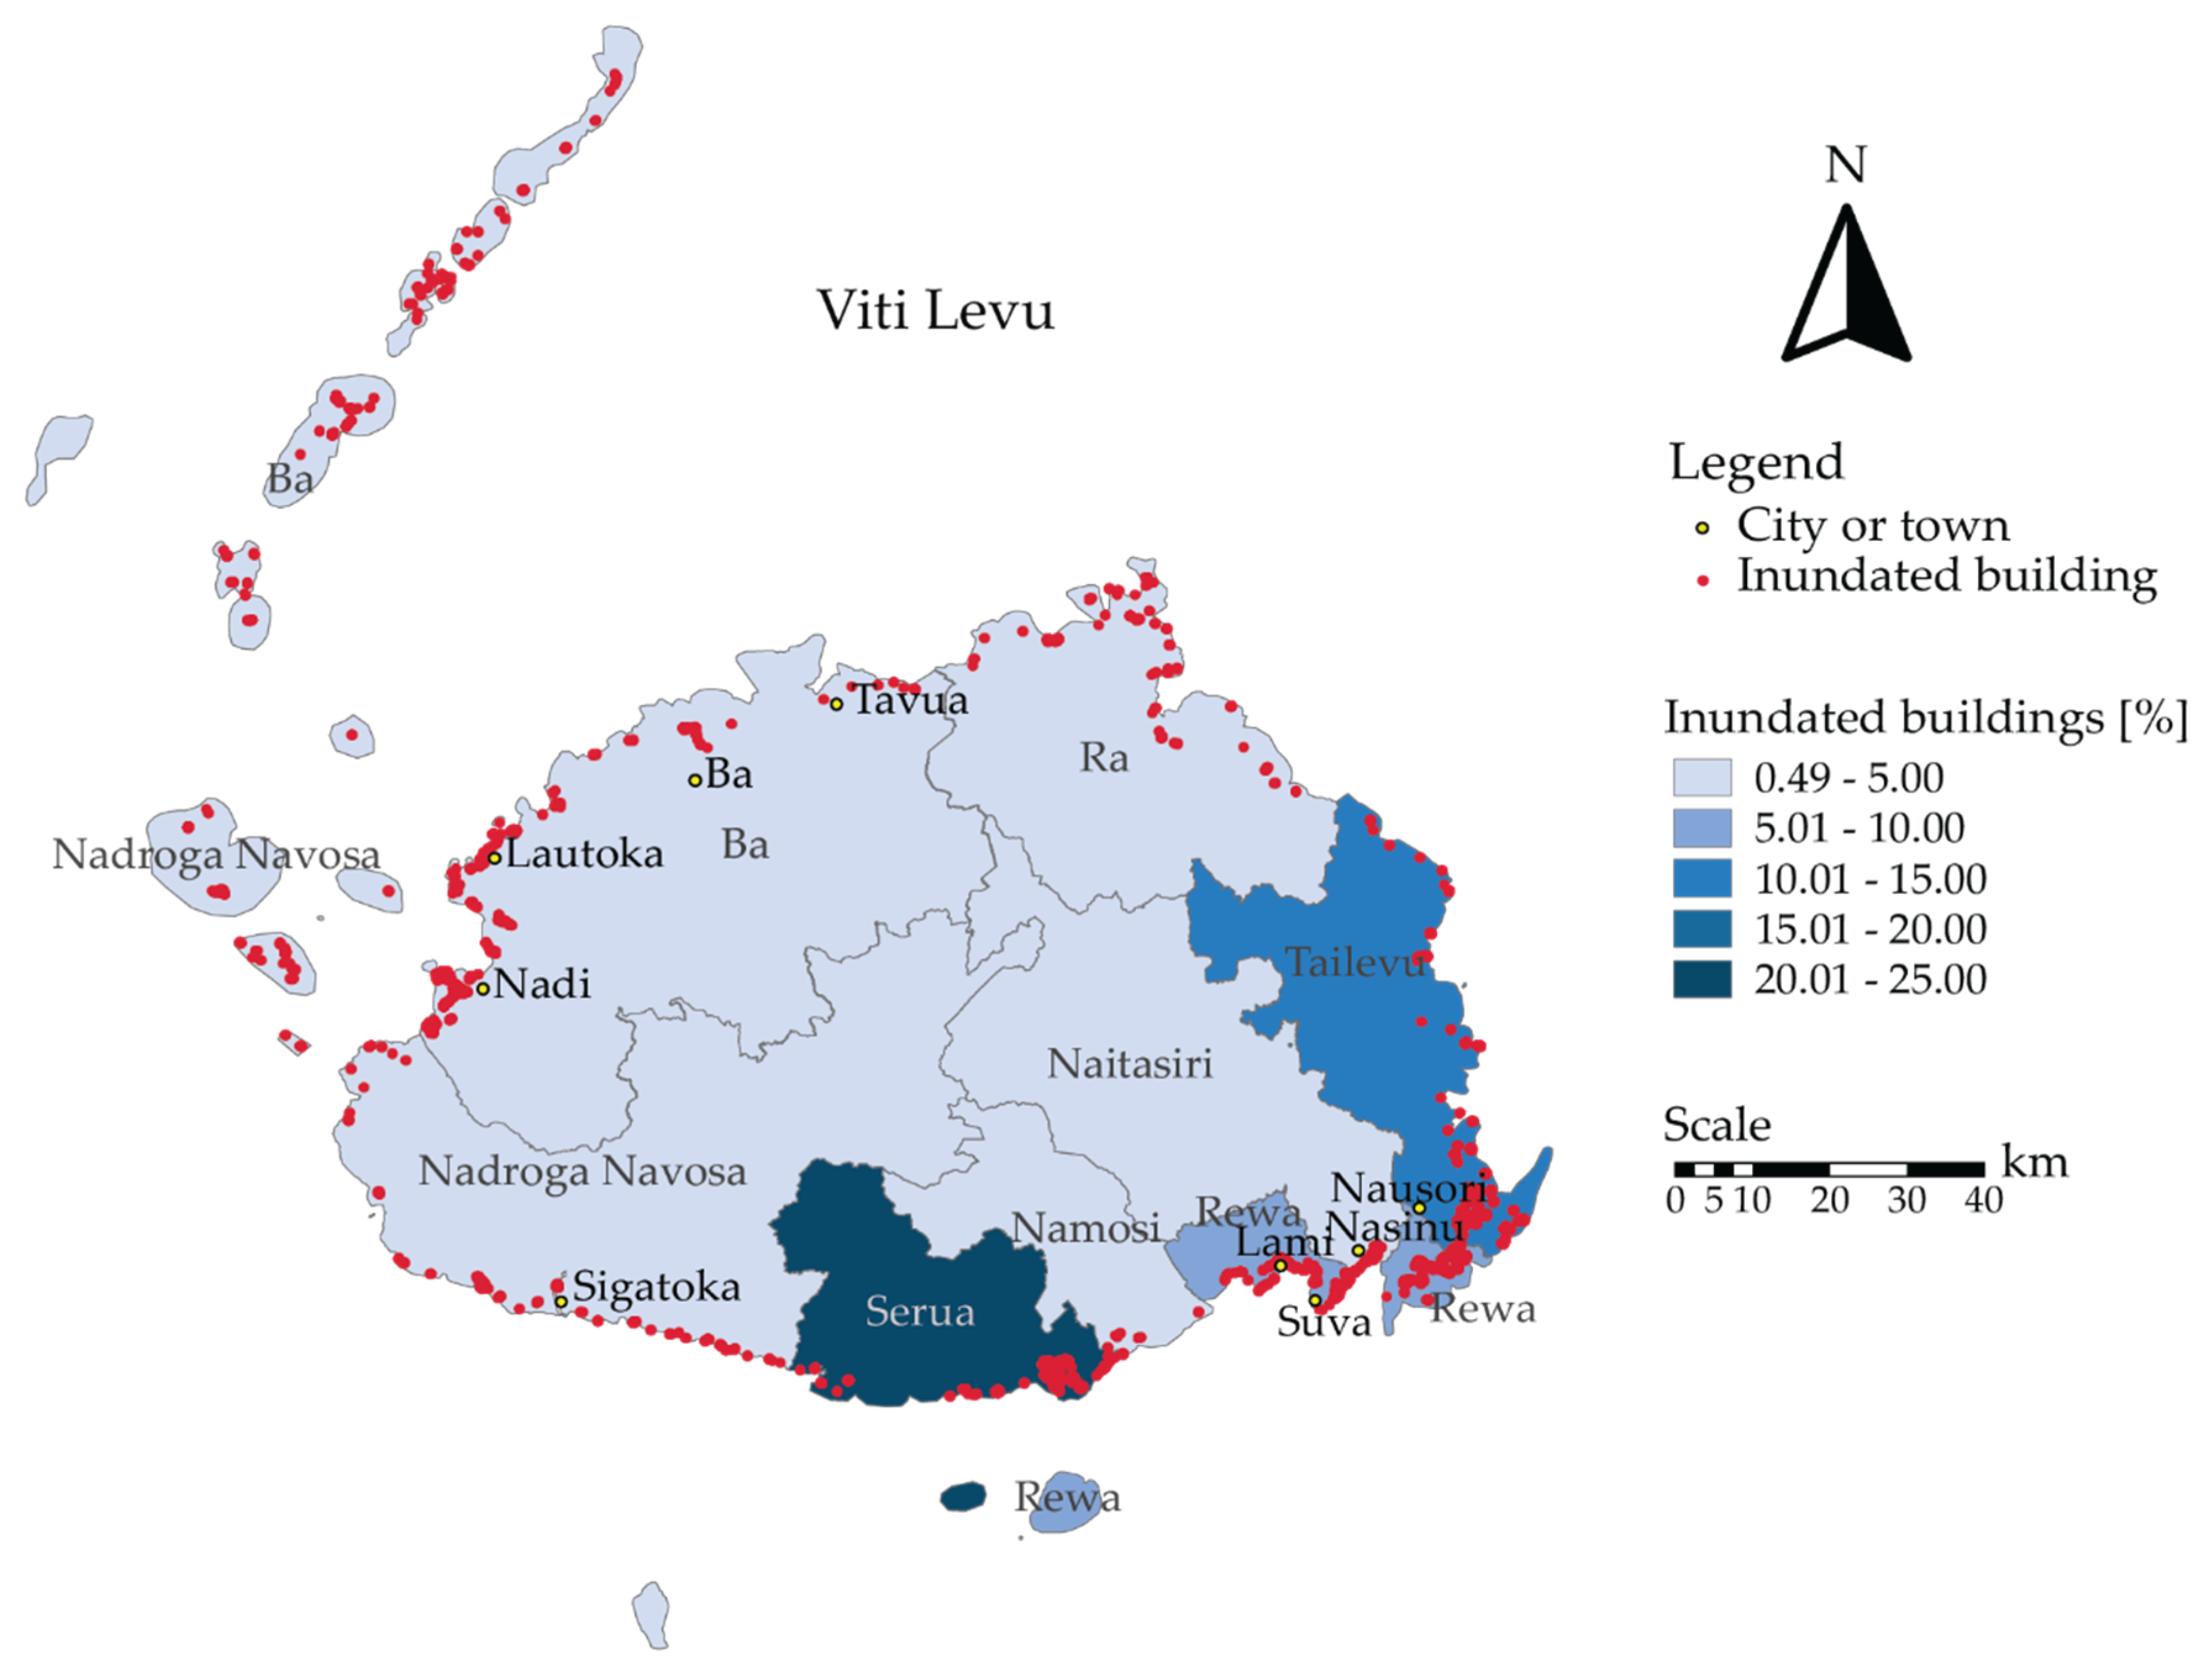
2.1. Case Study Area

The Republic of Fiji is a group of islands located in the South Pacific. Its population accounts for 881,000 people living on 18,000 km², subdivided on 300 islands, of which 100 are inhabited [45]. Fiji’s coastline measures around 1130 km [45] where 90% of the population lives and where the biggest urban regions, Lautoka, Nadi, Labasa and the capital Suva, are located [46]. This study focuses on the two main islands of Fiji, Viti Levu and Vanua Levu, where 96% of the population lives [33].
In 2017 and 2018, on average, 626 buildings valued US$73.63 million were constructed each year [36,37]. In 2014, the village of Vunidogoloa, located in the Republic of Fiji, had to be relocated due to coastal erosion and storm surges caused by climate change induced SLR [22,47]. It cost approximately US$500,000 to relocate the residents 2 km inwards from the coast [22]. It is predicted that until 2050, with reference of a SLR of 0.26 m relative to the years 1986–2005, 30,000 Fijians occupy land vulnerable to the SLR. Until 2100, with a predicted SLR of 0.59 m relative to the years 1986–2005, 80,000 Fijians occupy land vulnerable to SLR [6].
In 2017, the government of Fiji began planning adaptation actions to counter the effects of SLR. Highly affected areas were identified and the relocation of several settlements was forecast. The government additionally plans to secure funds, to focus on better management of natural resources and to increase their human capital by investing in the education of engineers and by training existing technical stuff [21]. Moreover, it plans to increase resilience in communities by identifying the most vulnerable villages [14] and by protecting urban coastlines from the effects of SLR [19]. According to The World Bank [14], the Fijian government foresees the relocation of settlements where storms are happening in a frequency that makes the settlements unable to live in on a long-term view. The government further plans on improving the current Digital Elevation Model of Fiji using LiDAR (Light Detection And Ranging) data, which will enable more detailed and accurate inundation analyses [14].

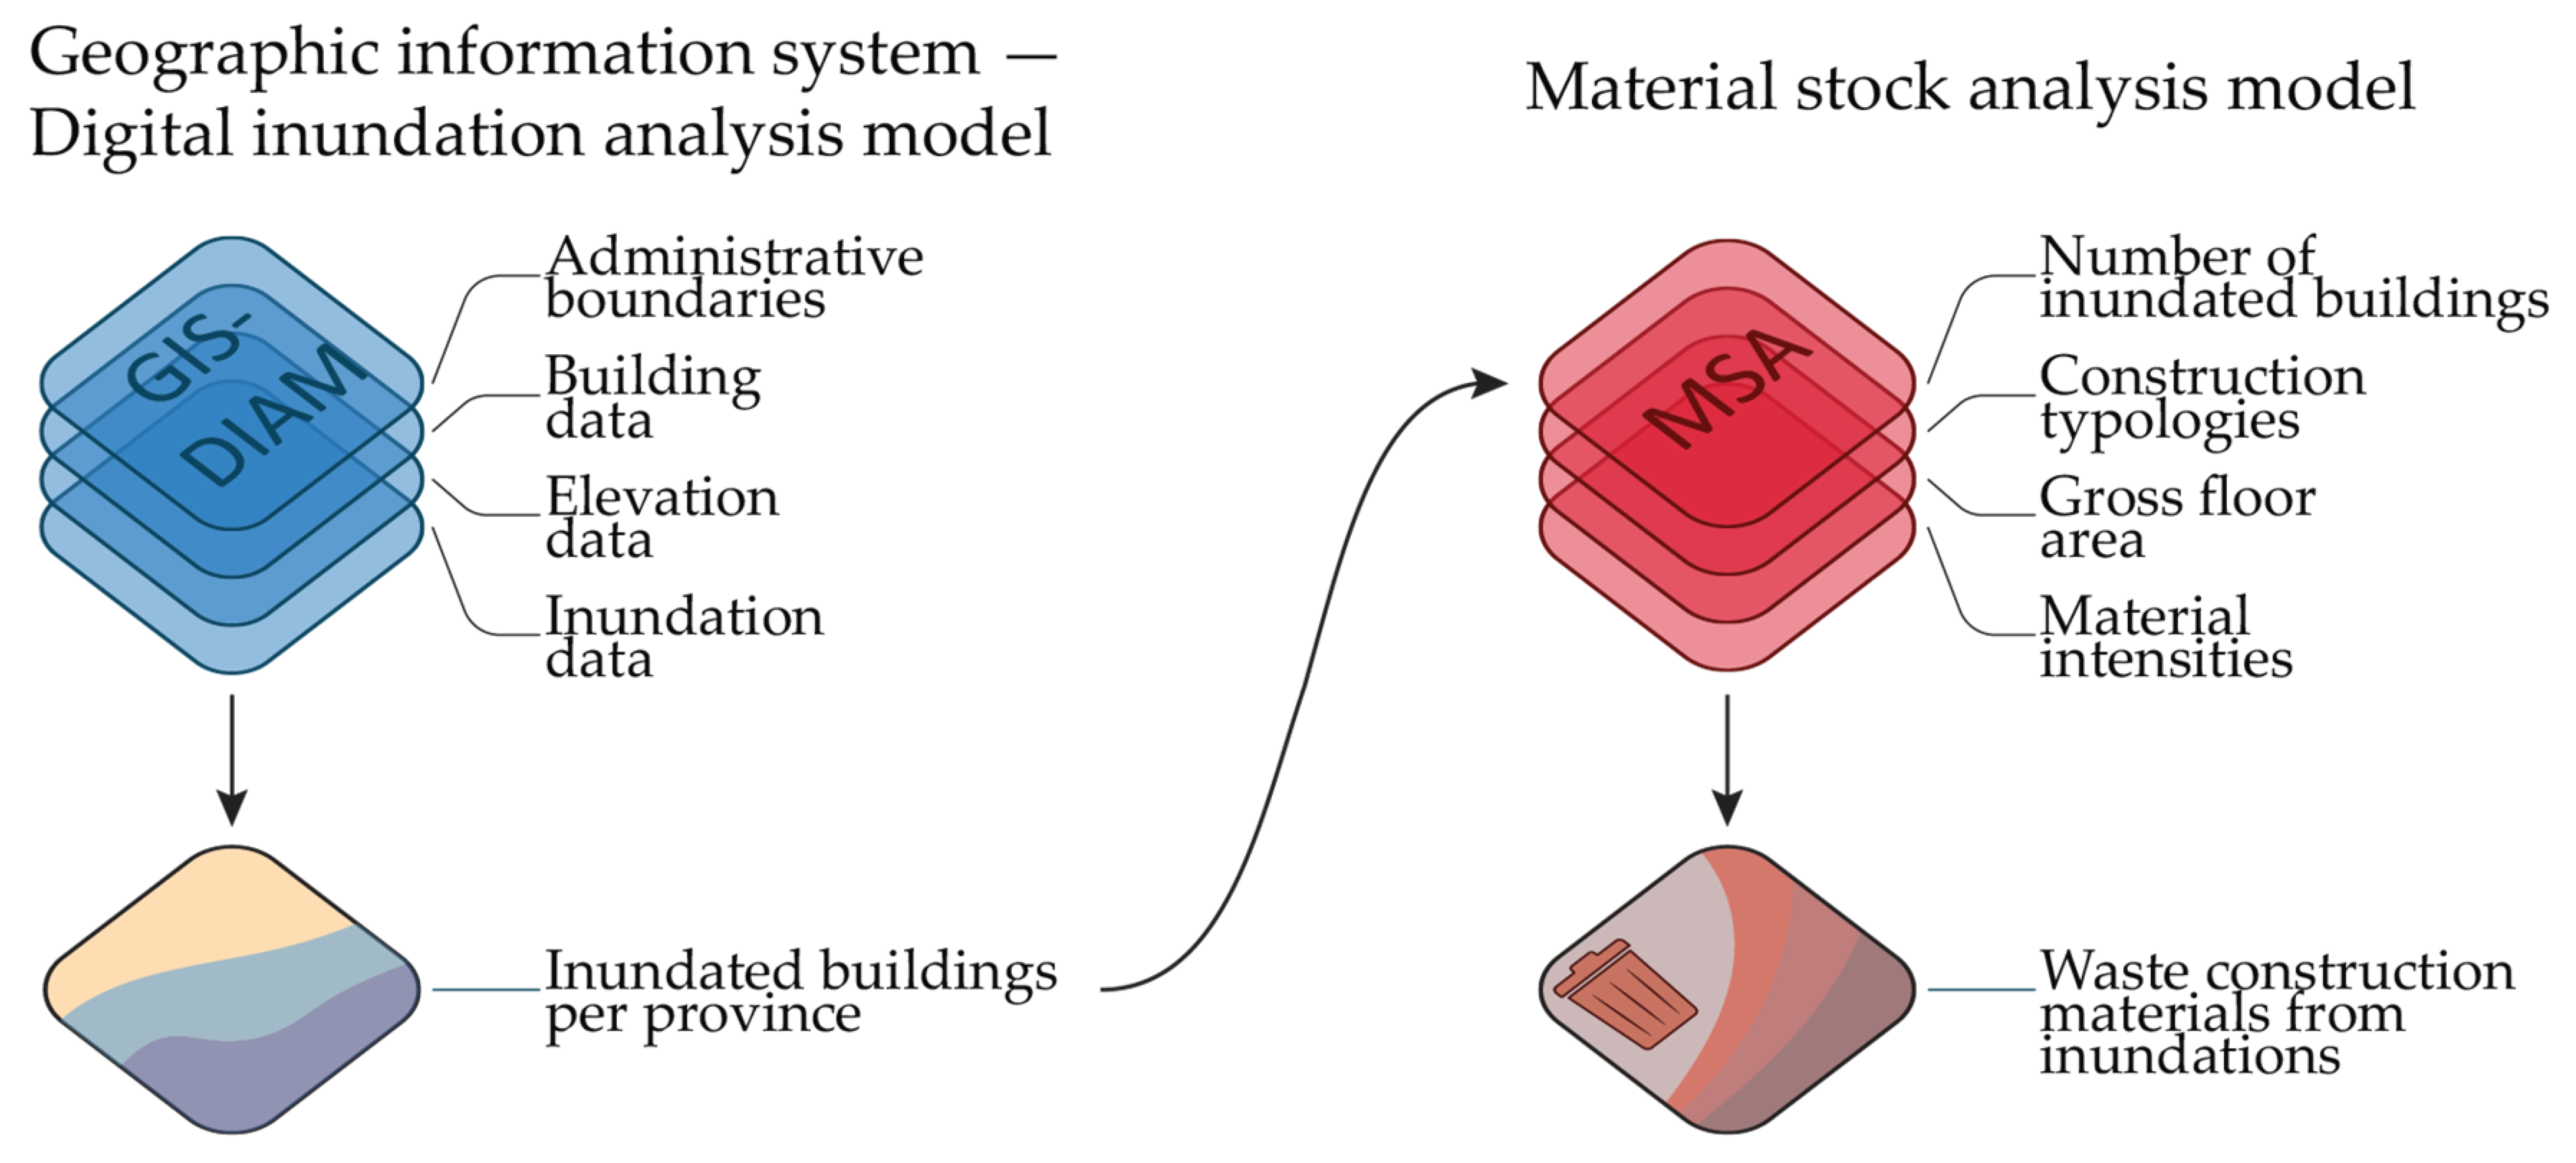
2.2. GIS-Based Digital Inundation Analysis Model (GIS-DIAM)

A digital elevation model of the two main islands of Fiji was taken as primary data. This model carries orographic information of the islands. Further data include a detailed 2D representation of the existing buildings. Moreover, metadata on the administrative boundaries of the region was used. Using ArcGIS, a popular software for GIS analyses, a simulation of the inundation areas due to SLR was conducted. Predictions on SLR are based on predictions by the IPCC [2]. Results are calculated for the years 2050 (scenario 1) and 2100 (scenario 2). This simulation generated two GIS-DIAMs which highlighted the number of inundated buildings per province, further discerned in rural and urban areas.

2.2.1. Elevation Data

Height information to was directly provided by the Geospatial Division of the Ministry of Lands & Mineral Resources Fiji [38]. The data’s spatial resolution is not reported in the document, and, when inquired, the Ministry did not provide an answer. To overcome this limitation, we assumed that this data is generally based on satellite data displaying surface elevation rather than terrain height. This is due to a constantly displayed height difference when comparing densely forested areas with open spaces located in close proximity. Additionally, the Fijian DEM was compared regarding its accuracy to elevation data by the United States Geological Survey, Shuttle Radar Topography Mission (SRTM) data [48] and to data by the Japan Aerospace Exploration Agency, Advanced Land Observing Satellite (ALOS) data [49].

2.2.2. Inundation Data

Inundation is predicted for the years 2050 (scenario 1) and 2100 (scenario 2). The dates were chosen to provide an overview on two different epochs in future time, one happening relatively soon and one relevant for long-term planning. Maximum tide inundation, including storm surges, were not incorporated in this study, because it is unable to accurately predict for which inundation interval a building is unusable. For the inundation data, only the permanent SLR is incorporated into the GIS-DIAM, which means that it does not take into consideration tidal effects.
This permanent SLR is based on the global SLR predictions by the IPCC’s Fifth Assessment Report. SLR was chosen on a global scale, relative to the period 1986–2005. It was chosen in reference to RCP 2.6 and RCP 8.5. The likelihood of the SLR refers to a ‘likely range’ as referred to by the IPCC, meaning a probability of 66%–100% [2].
The IPCC [2] predicts, for the period 2046–2065, a minimum SLR of 0.17 m (RCP 2.6) and a maximum SLR of 0.38 m (RCP 8.5). As the report does not provide tabular data for the year 2050, the authors assumed an SLR of 0.22 m for the year 2050 (scenario 1). The value for 2100 was determined as the average of the lowest value predicted for RCP 2.6 (SLR of 0.28 m) and the highest value predicted for RCP 8.5 (SLR of 0.98 m). Thus, an SLR of 0.63 m is expected on average [2].

2.2.3. Administrative Boundaries and the Spatial Localization of Buildings

The Fiji are divided into 15 provinces and 1602 enumeration areas. Data on administrative boundaries were downloaded from the PopGIS 2.0 platform which is managed by the Fiji Bureau of Statistics, based on the 2007 Census [32]. GIS data locating 89,628 Fijian buildings were taken from the Geofabrik platform, which retrieves data from Open Street Maps [34]. The data were then tested for their accuracy using satellite imagery by Esri et al. [35]. It was evident that Open Street Maps data do not cover all the buildings on Fiji’s coastline. Therefore, an additional 6979 buildings were manually drawn as points in ArcGIS based on the satellite imagery by Esri et al. [35].

2.2.4. Separation between Urban and Rural Areas

The number of inundated buildings was calculated according to the province a building is constructed, subdivided in urban and rural areas. In this study, an area was classified as urban when it is listed as 1st category urban area in the 2007 Census of Population and Housing [33]. The government defines cities and towns by their urban attributes, their economic activity and their population size [50]. In the 2007 census, twelve areas are listed as 1st category urban area. The enumeration areas which are located within urban zones were subsequently manually assigned using the satellite imagery by Esri et al. [35].

2.3. MSA-Based Construction Material Stocked Model

To calculate the materials stocked in buildings subject to inundation, an MSA was conducted for characterizing the structural materials typically used for buildings on Fiji: concrete, steel, and timber. Using the ‘Select By Location’ tool by ArcGIS, a building was referred to as inundated if its polygon or point was within the features of the inundation layer. To proceed, an equation first described by Tanikawa et al. [28] was modified as in the following Equation (1):
M S K = j = 1 4 ( M I K , J · i = 1 n ( G F A i , j ) )
where MSk is the stocked amount of a specific construction material k, MIk,j is the material intensity of the construction type j and material k , and G F A j , n is the gross floor area of the i -th building per construction type j . Note that the index j goes from 1 to 4 as there are 4 building typologies, while i goes up to n as there is a variable number of buildings for each typology.

2.3.1. Construction Types

Buildings in Fiji can be classified into 4 building typologies, depending on the material used for their walls: cement block masonry, timber frame cladded by timber panels, timber frame cladded by steel panels [39], and reinforced concrete [44]. Traditionally, Fijian buildings have one story, concrete foundations and steel based sheets as roof [39]. While cement block masonry, timber cladded and iron cladded buildings appear in both rural and urban areas, buildings based on reinforced concrete are only constructed in cities where houses typically have more than one story. This includes the city of Suva (three floors) as well as the cities Nadi, Labasa, Ba and Lautoka (all with two floors). See Supplementary Materials §1 for a list of the data sources used to determine the number of floors per city.
The Fiji Bureau of Statistics provides the average distribution of construction typologies used in each one of the 1602 enumeration areas [32]. This served as a basis for allocating to each province the share of each construction type, separated in rural and urban areas. As it is impossible to know exactly the actual construction type for a specific building from an aerial photo, we assumed the typologies of inundated buildings as proportional to the share of typologies in a certain enumerated area. Please see Supplementary Materials §2 for more information on the distribution of construction typologies per province.

2.3.2. Material Intensities

Table 2 shows the material intensities used for the MSA. To date, no typical material intensities for the construction types defined have been published, for Fiji nor for any other region in the world. Thus, material intensities were calculated by the authors manually. The material intensities of buildings with walls based on cement block masonry, timber sheets and steel based corrugated iron sheets were based on a housing construction manual provided by the Habitat for Humanity [40] in combination with baseline data on local building structure and materials published by Caimi et al. [39]. Details on calculations can be retrieved in Supplementary Materials §3.
Information that helps with calculating the material intensity of multi-storied reinforced concrete buildings is not reported in Habitat for Humanity [40], nor in Caimi et al. [39]. It was assumed that multi-storied reinforced concrete buildings on Fiji are built in a similar way as they are in other regions of the world. Therefore, data was retrieved from research previously conducted by Cheng et al. [31] for buildings in Taipei, Taiwan. Here, Cheng and colleagues cite research by Chang [41]. Subsequently, all material intensities were compared to the values published by Tanikawa et al. [28], which lists material intensities by Nagaoka et al. [42] and Tanikawa and Hashimoto [43].

2.3.3. Gross Floor Area (GFA)

The total gross floor area of inundated buildings was not directly retrievable from the GIS data, as we identified over 7000 buildings that were not mapped. For this reason, a probabilistic approach had to be implemented.
The estimation of the total footprint of inundated buildings is reported in Equations (2) and (3):
F P t o t a l , u r b a n , p = F P a v g , u r b a n , p · n u r b a n , p
F P t o t a l , r u r a l , p = F P a v g , r u r a l , p · n r u r a l , p
where F P t o t a l ,   u r b a n ,   p indicates the total building footprint (expressed as m2) of inundated buildings located in urban areas of the province p ; F P a v g , u r b a n , p reports the average footprint (expressed in m2) of an inundated building in urban areas of the province p ; and n u r b a n , p is the number of buildings that are inundated in urban areas of the province p . Equation (3) is identical to Equation (2), the only difference being that it refers to rural areas rather than urban ones.
The average area of a building was estimated based on the average area of those buildings that were withdrawn as polygons from Geofabrik GmbH and OpenStreetMap Contributors [34]. Please see Supplementary Materials §2 for a list of the average area of a building per province.
The calculation of the total gross floor area of inundated buildings in a certain province is shown in Equation (4):
G F A t o t a l , p = F P t o t a l , u r b a n , p · F l o o r s u r b a n + F P t o t a l , r u r a l , p
where G F A t o t a l , p is the total floor area which is going to be inundated in the province p ; and F l o o r s u r b a n indicates the average number of floors present in buildings in the urban area of the province p . Note that there is not a term floors for the rural area, as buildings in rural areas are always limited to a single story.
The total gross area of a province is then discerned into typologies as per Equation (5):
G F A j , p = G F A t o t a l , p · v j , p
where G F A j , p is the gross floor area of the construction type j in province p ; and ν j , p is the ratio of building having type j in province p , as calculated in Equation (6).
v j , p = n j , p n t o t a l , p
where ν j , p is calculated as the fraction between the number of buildings having type j in the province p ( n j , p ) over the total number of buildings in the province p ( n t o t a l , p ).
The overall gross floor area is the calculated as in Equation (7):
G F A j = p = 1 15 G F A j , p
where G F A j is the overall gross floor area for the construction type j . Note that p goes from 1 to 15, as there are 15 provinces in this case study.

3. Results

The following Section 3.1 illustrates the results of the spatial analysis of the sea level rise, while Section 3.2 displays the results of the material stock analysis. A machine-readable Supplementary Data File with the values used to plot Figure 2, Figure 3, and Figure 8 is provided.

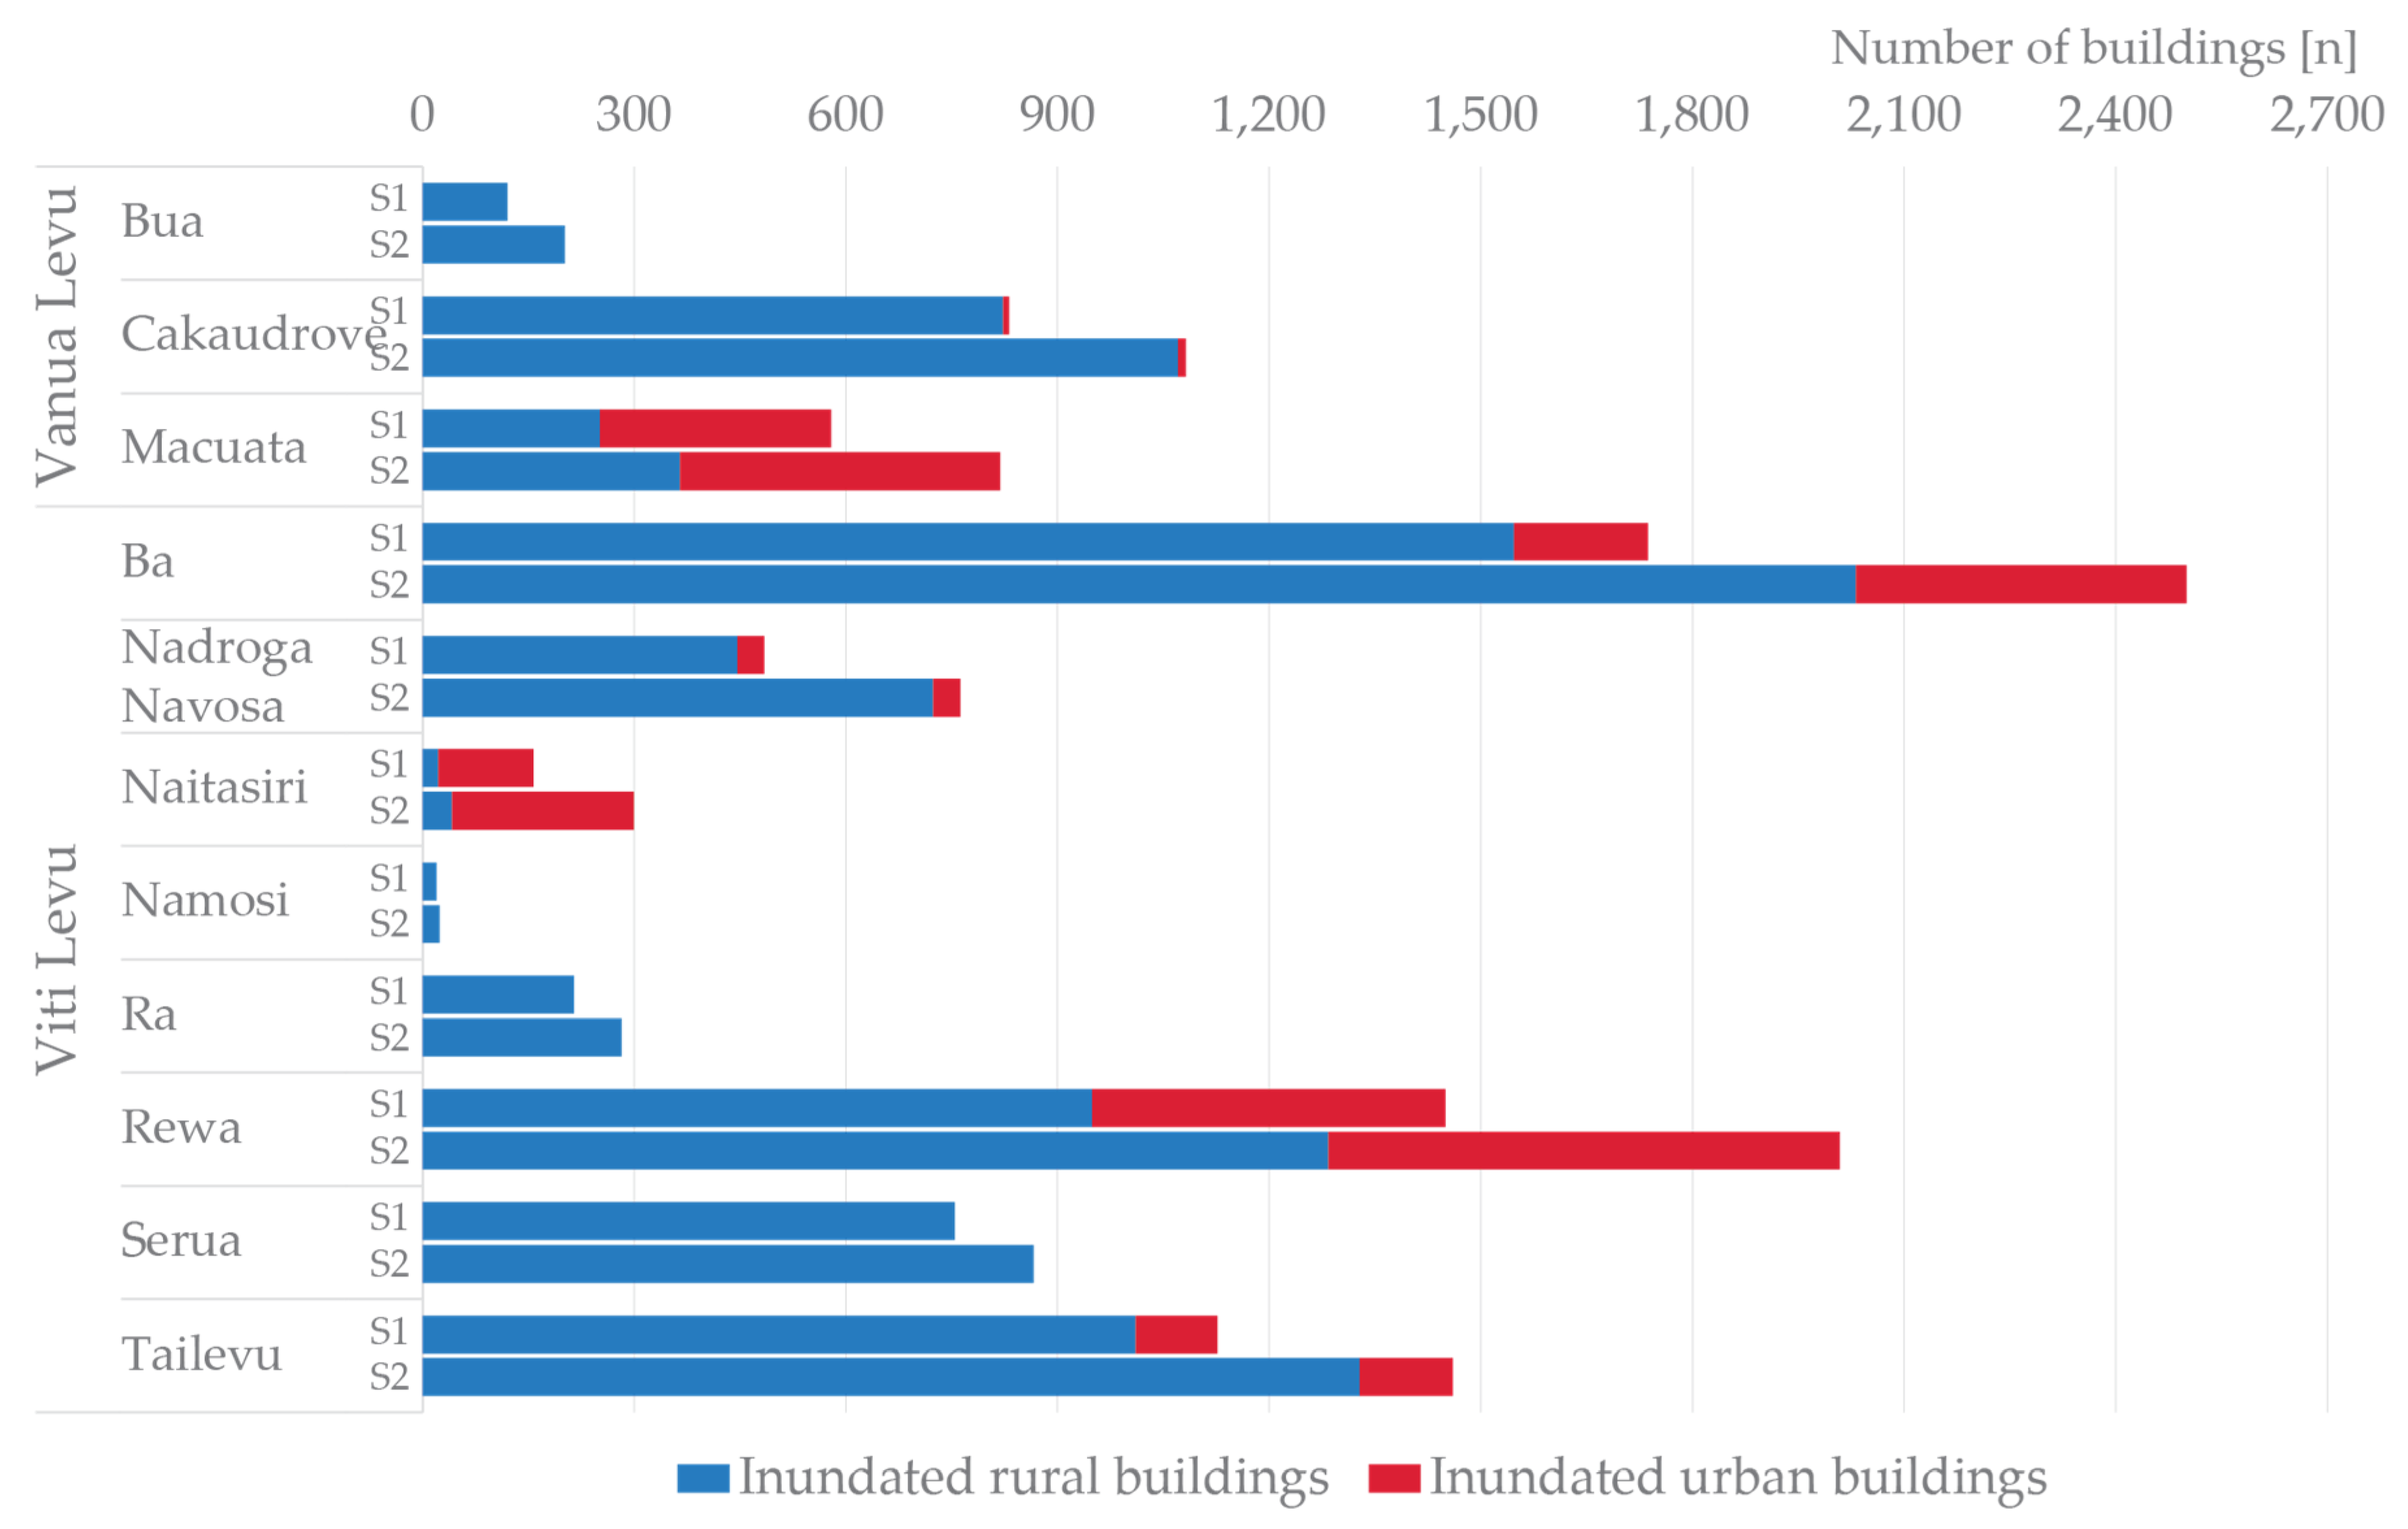
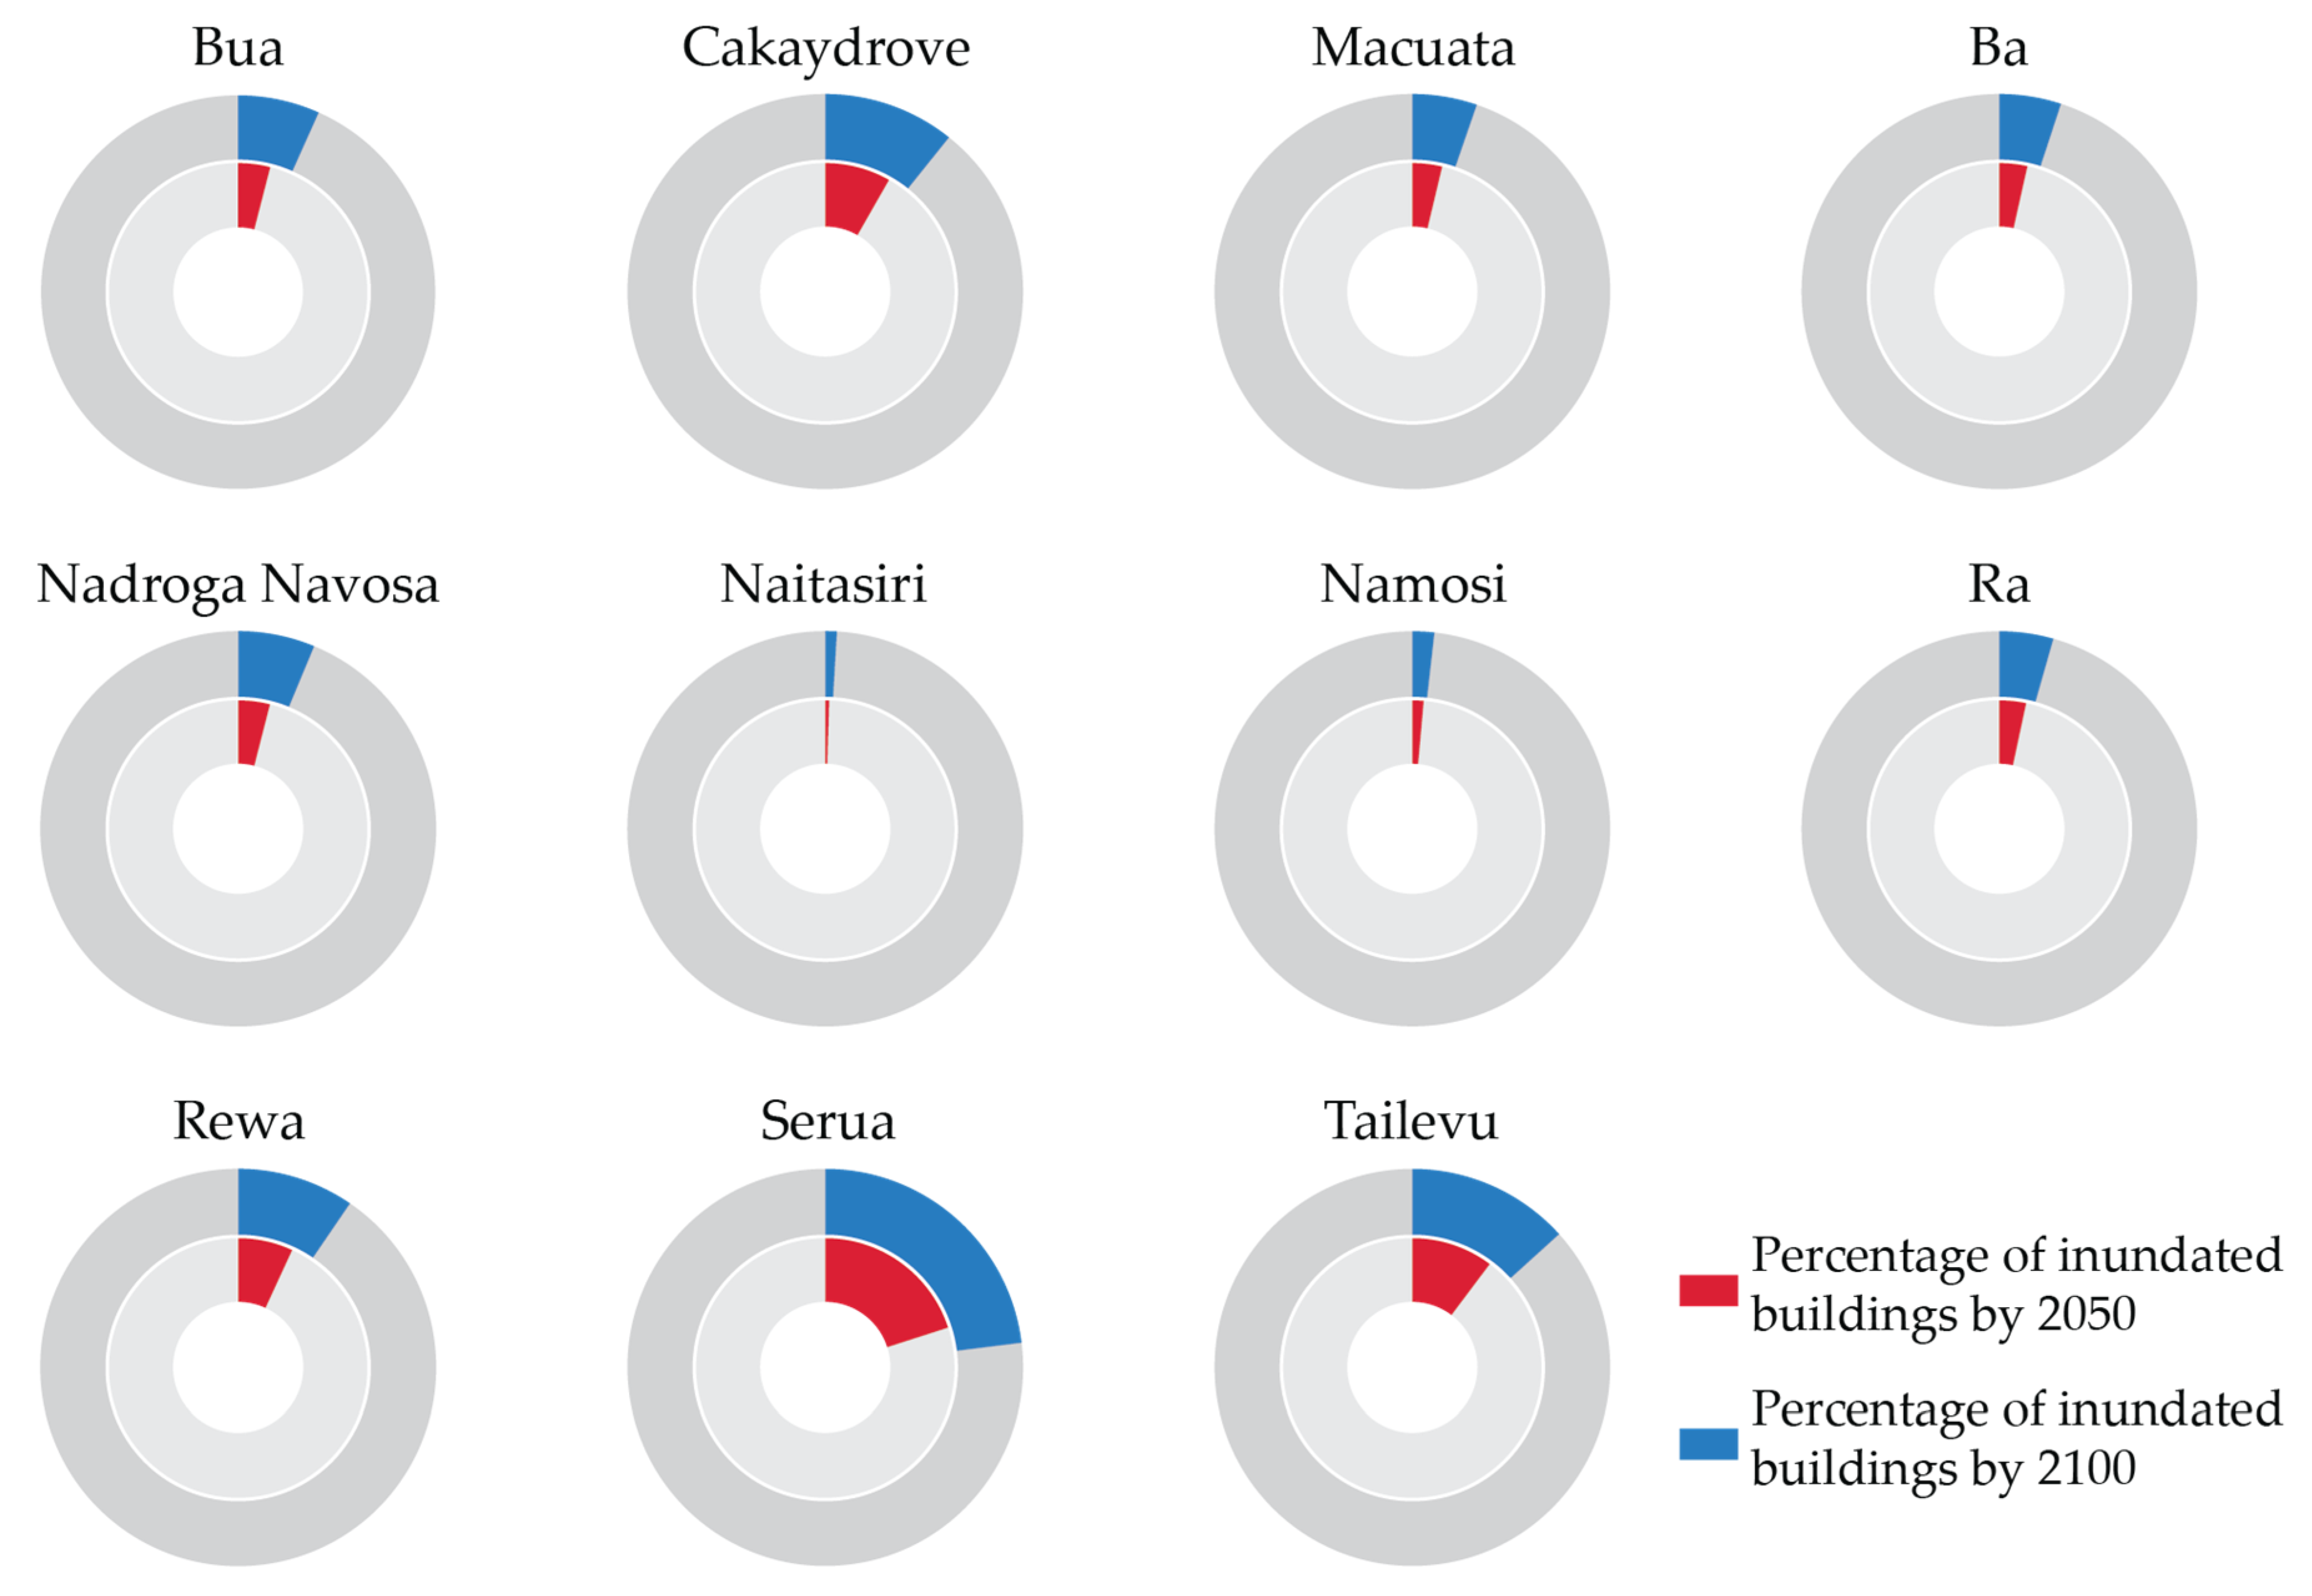
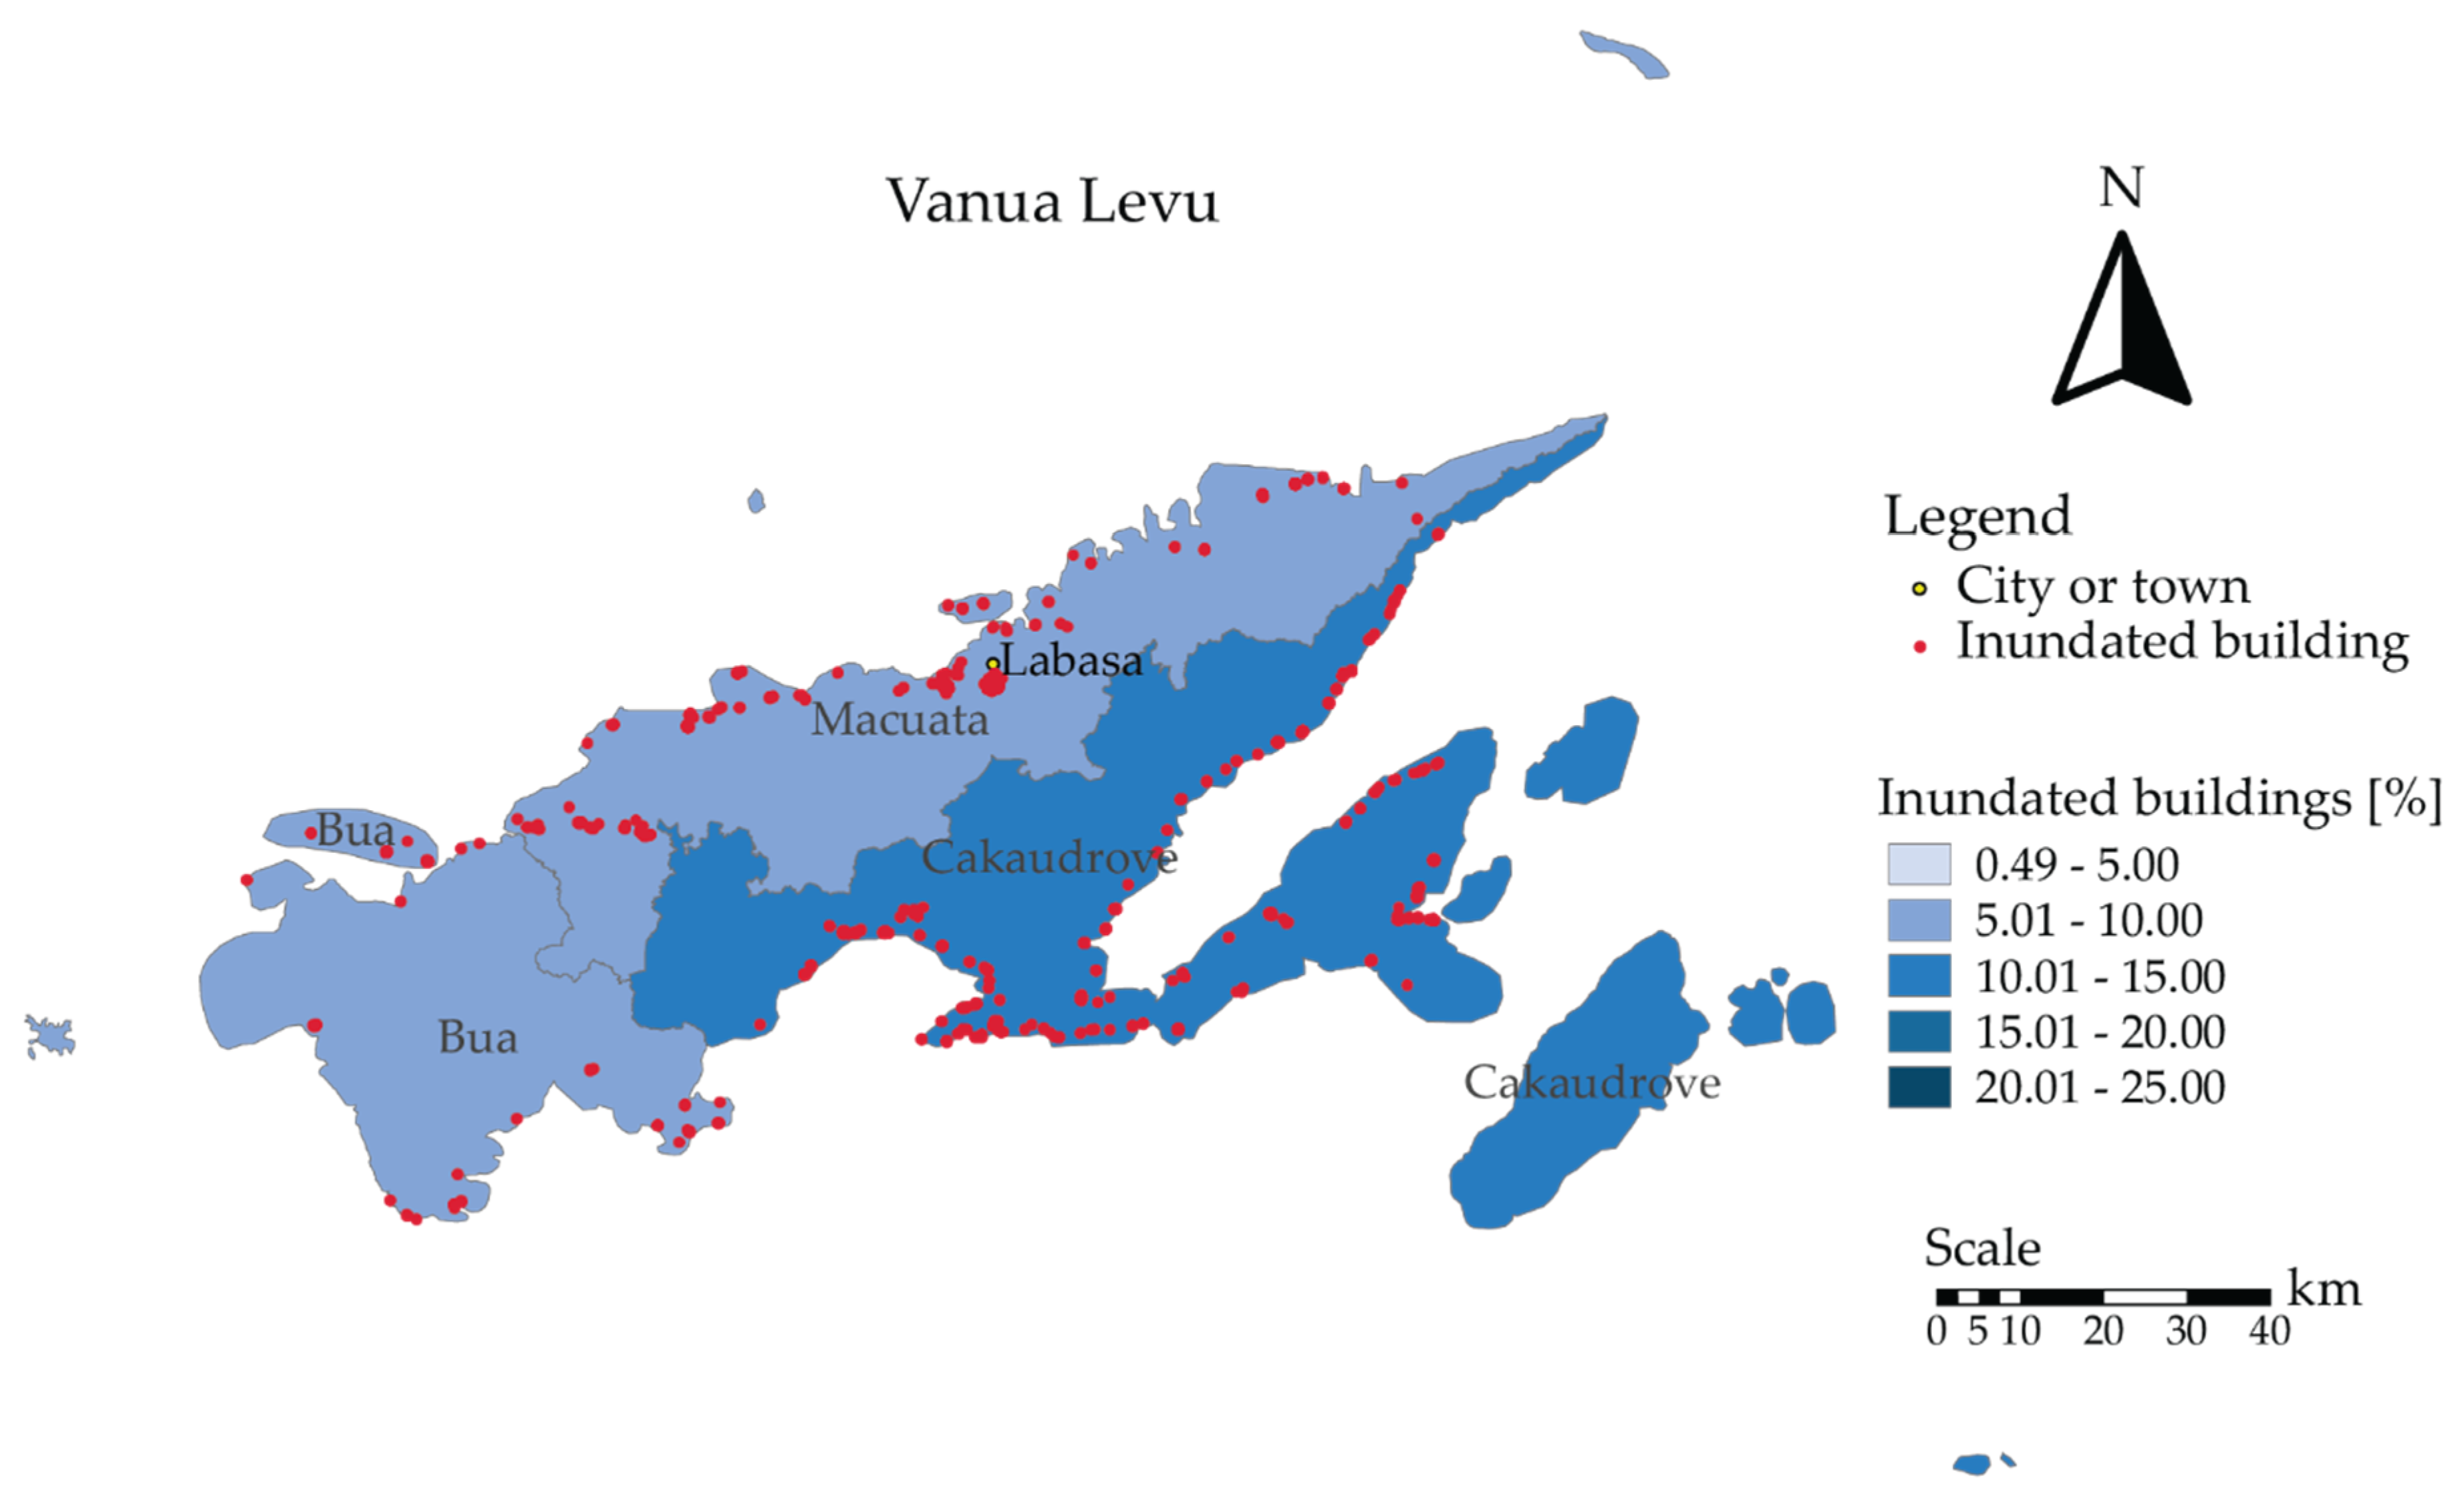
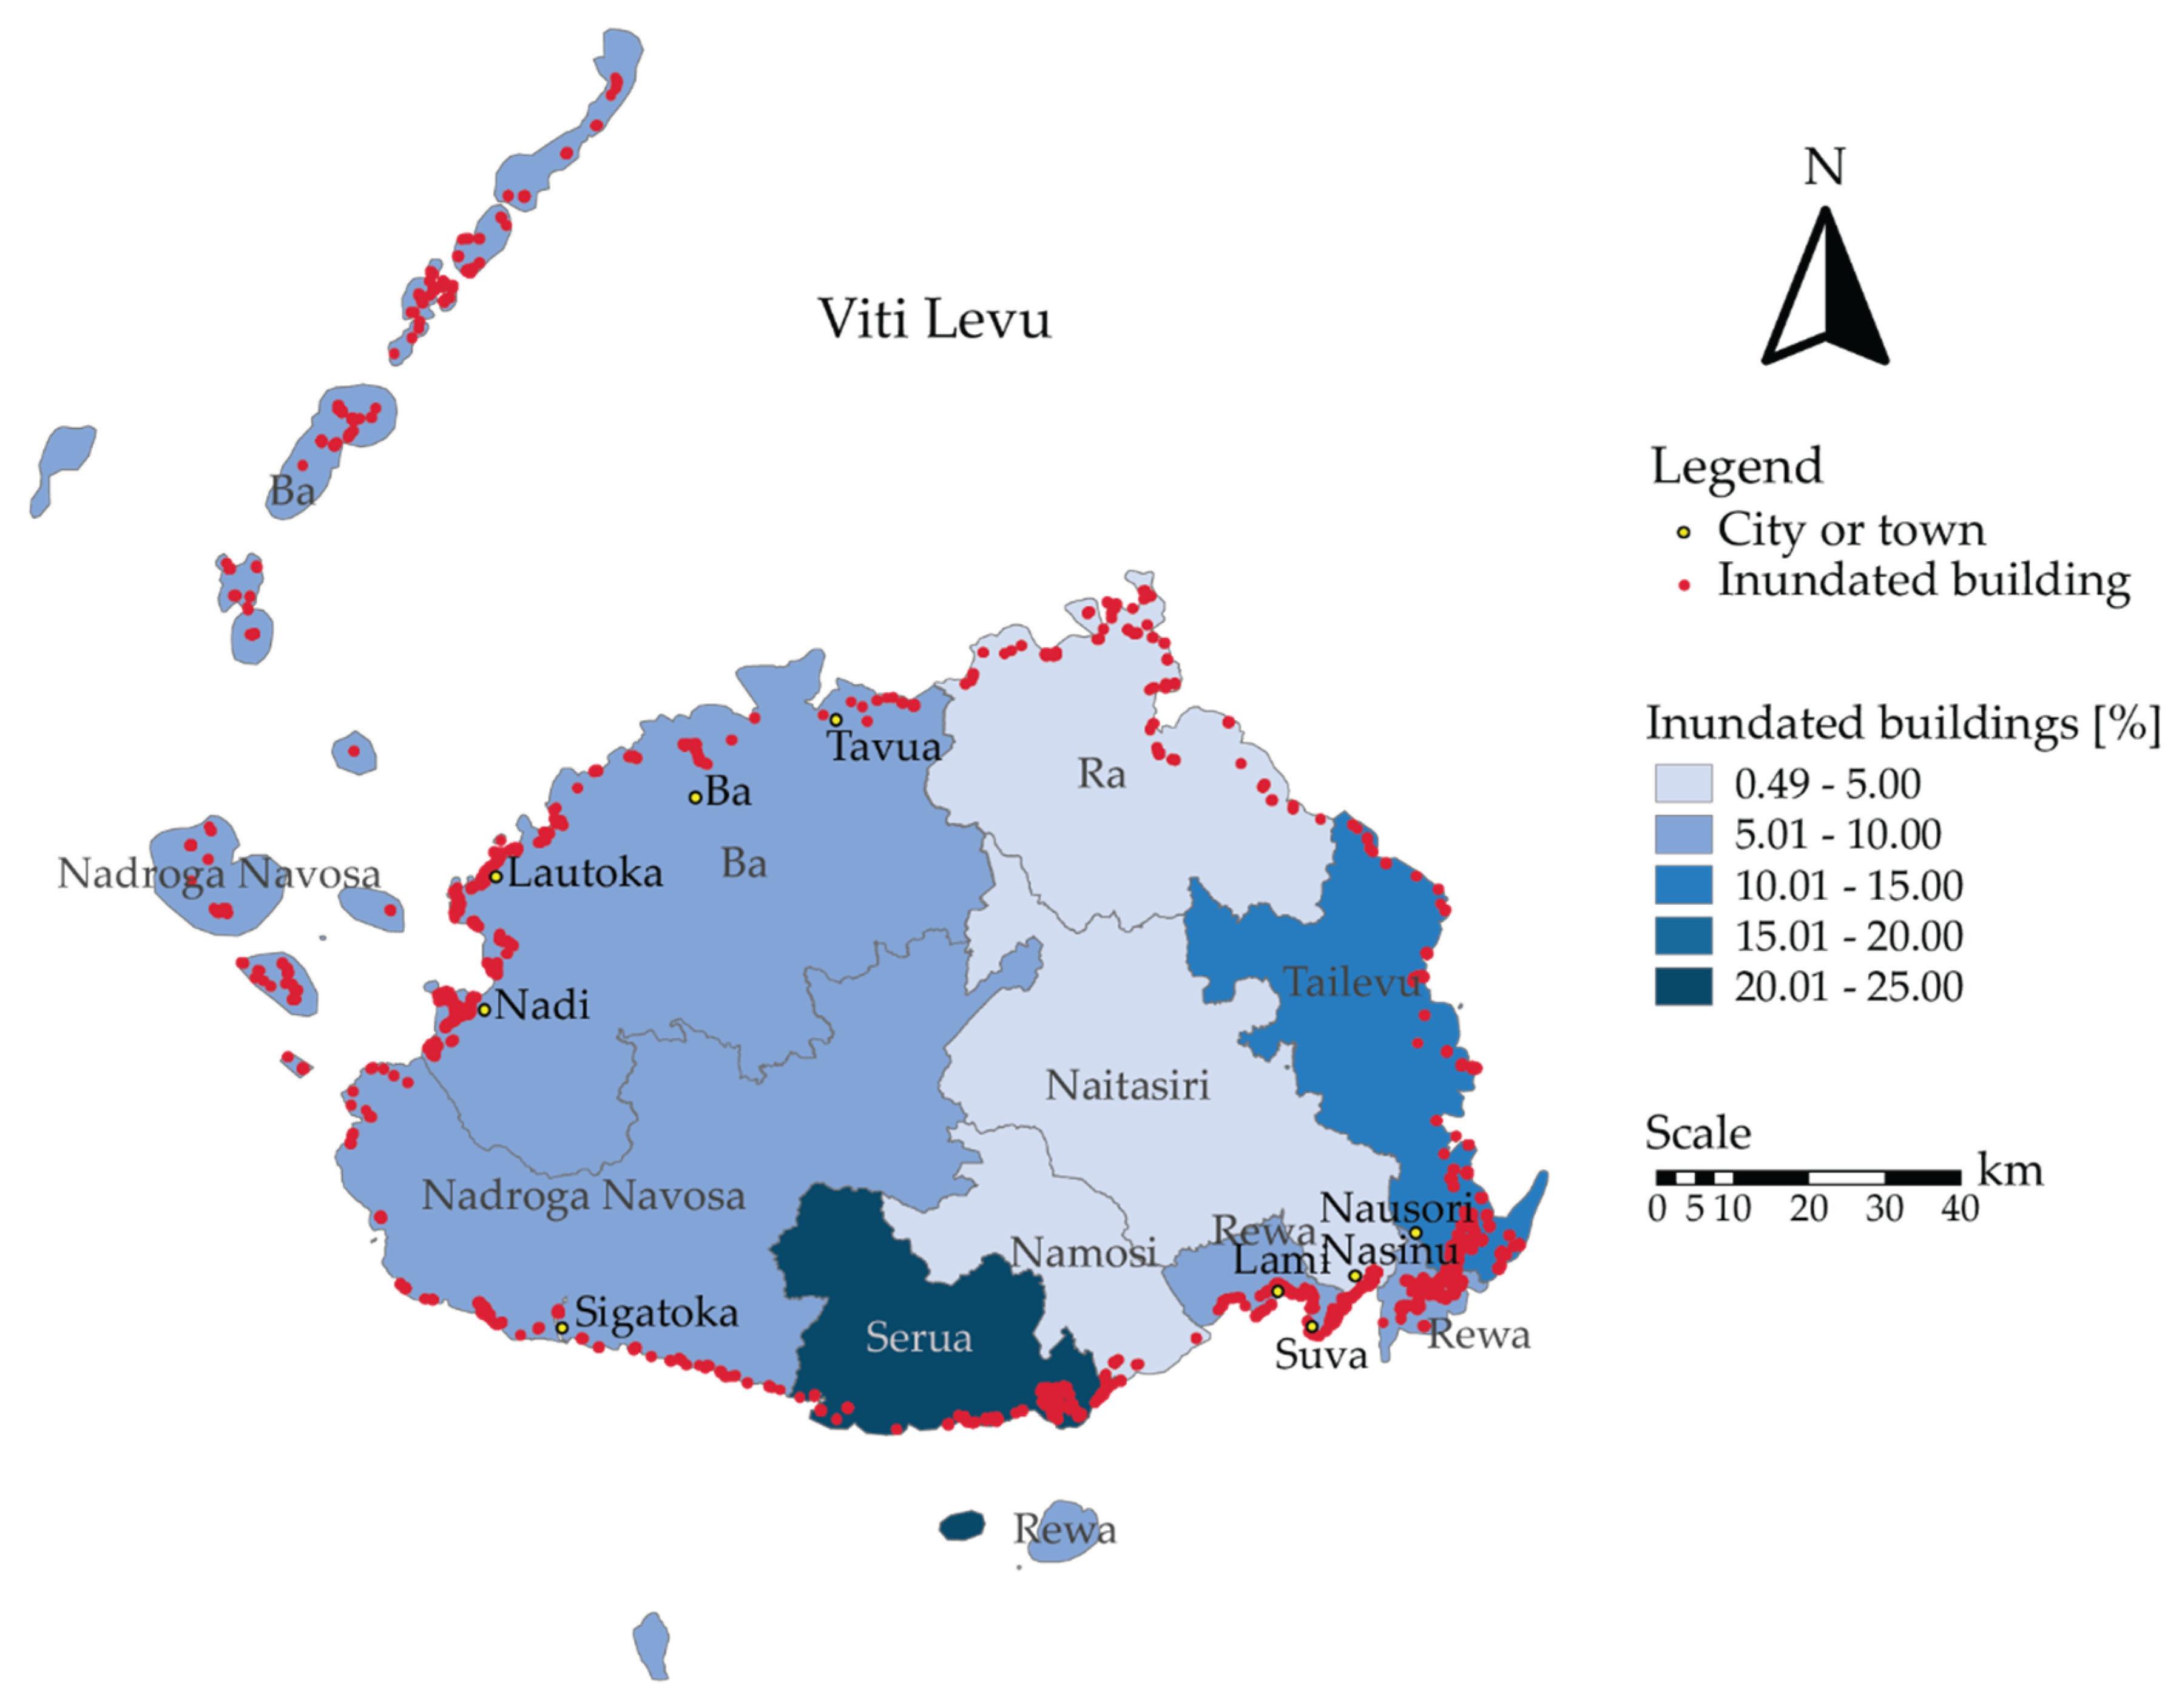
3.1. Results of the GIS-DIAM

Figure 2 displays the number of inundated buildings per province in both scenarios, separated in rural and urban areas, while Figure 3 indicates the percentage of all existing buildings that will be lost in scenarios 1 and 2. The results illustrate that buildings along coastlines will be affected and that every province will suffer losses, albeit to different extents. In total, 7472 buildings will be inundated by 2050 and 10,304 by 2100. This is equivalent to 4.5% of the overall number of currently existing buildings in scenario 1 and 6.2% in scenario 2. Until 2050, the average number of inundated buildings per year will be 241. After that, the rate decreases 57 buildings per year on average.
The rural proportion accounts for about 80% in both scenarios. Nevertheless, Fiji’s major urban areas Suva, Lautoka, Lami, Labasa, Nasinu and the suburban region in Nadi will be heavily affected. Of all the inundated buildings in Serua, Cakaudrove, Nadroga Navosa, Namosi, Ra, and Tailevu, over 90% is located in rural areas. Conversely, the provinces of Naitasiri and Macuata are expected to experience the majority of their inundated buildings in urban areas.
The spatial distribution of the inundated buildings in 2050 is plotted in Figure 4 (Vanua Levu) and Figure 5 (Viti Levu). The total number of inundated buildings is the highest in Ba (1737 buildings), Rewa (1450 buildings), and Tailevu (1127 buildings). Yet, the percentage of buildings inundated in comparison to the total number of buildings is the highest in Serua (20%), with one out of five buildings flooded. It is remarkable that less than 2% of the buildings in Naitsairi and in Namosi will be directly affected.
Areas with many buildings being inundated in a relatively small spatial frame can be identified in the town centers of Lami and Labasa, as well as in the peri-urban areas of Nadi, Nasinu, and Lautoka, including industrial and touristic locations. Additionally, the south eastern part of Viti Levu, which is broadly and relatively densely settled, is expected to face large inundations.
The spatial distribution of the submerged buildings for 2100 is plotted in Figure 6 and Figure 7. There is a relatively low difference in regard to the amount of buildings predicted to be inundated in 2050 and 2100: compared to a SLR difference of 182% between the two, the number of inundated buildings increases by only 38%. Nevertheless, the rise of inundated buildings in urban areas increases by 58%, with Ba (146%) and Naitasiri (90%) being affected the most. Naitasiri, and furthermore, Bua and Nadroga Navosa also show a relatively high rise regarding the additional inundation of rural buildings in 2100.
The province with the highest number of inundated buildings is still Ba (2500 buildings), followed by Rewa (2009 buildings) and Tailevu (1460 buildings). Serua remains the most affected province, with 23% of its currently standing buildings expected to be permanently underwater by 2100.

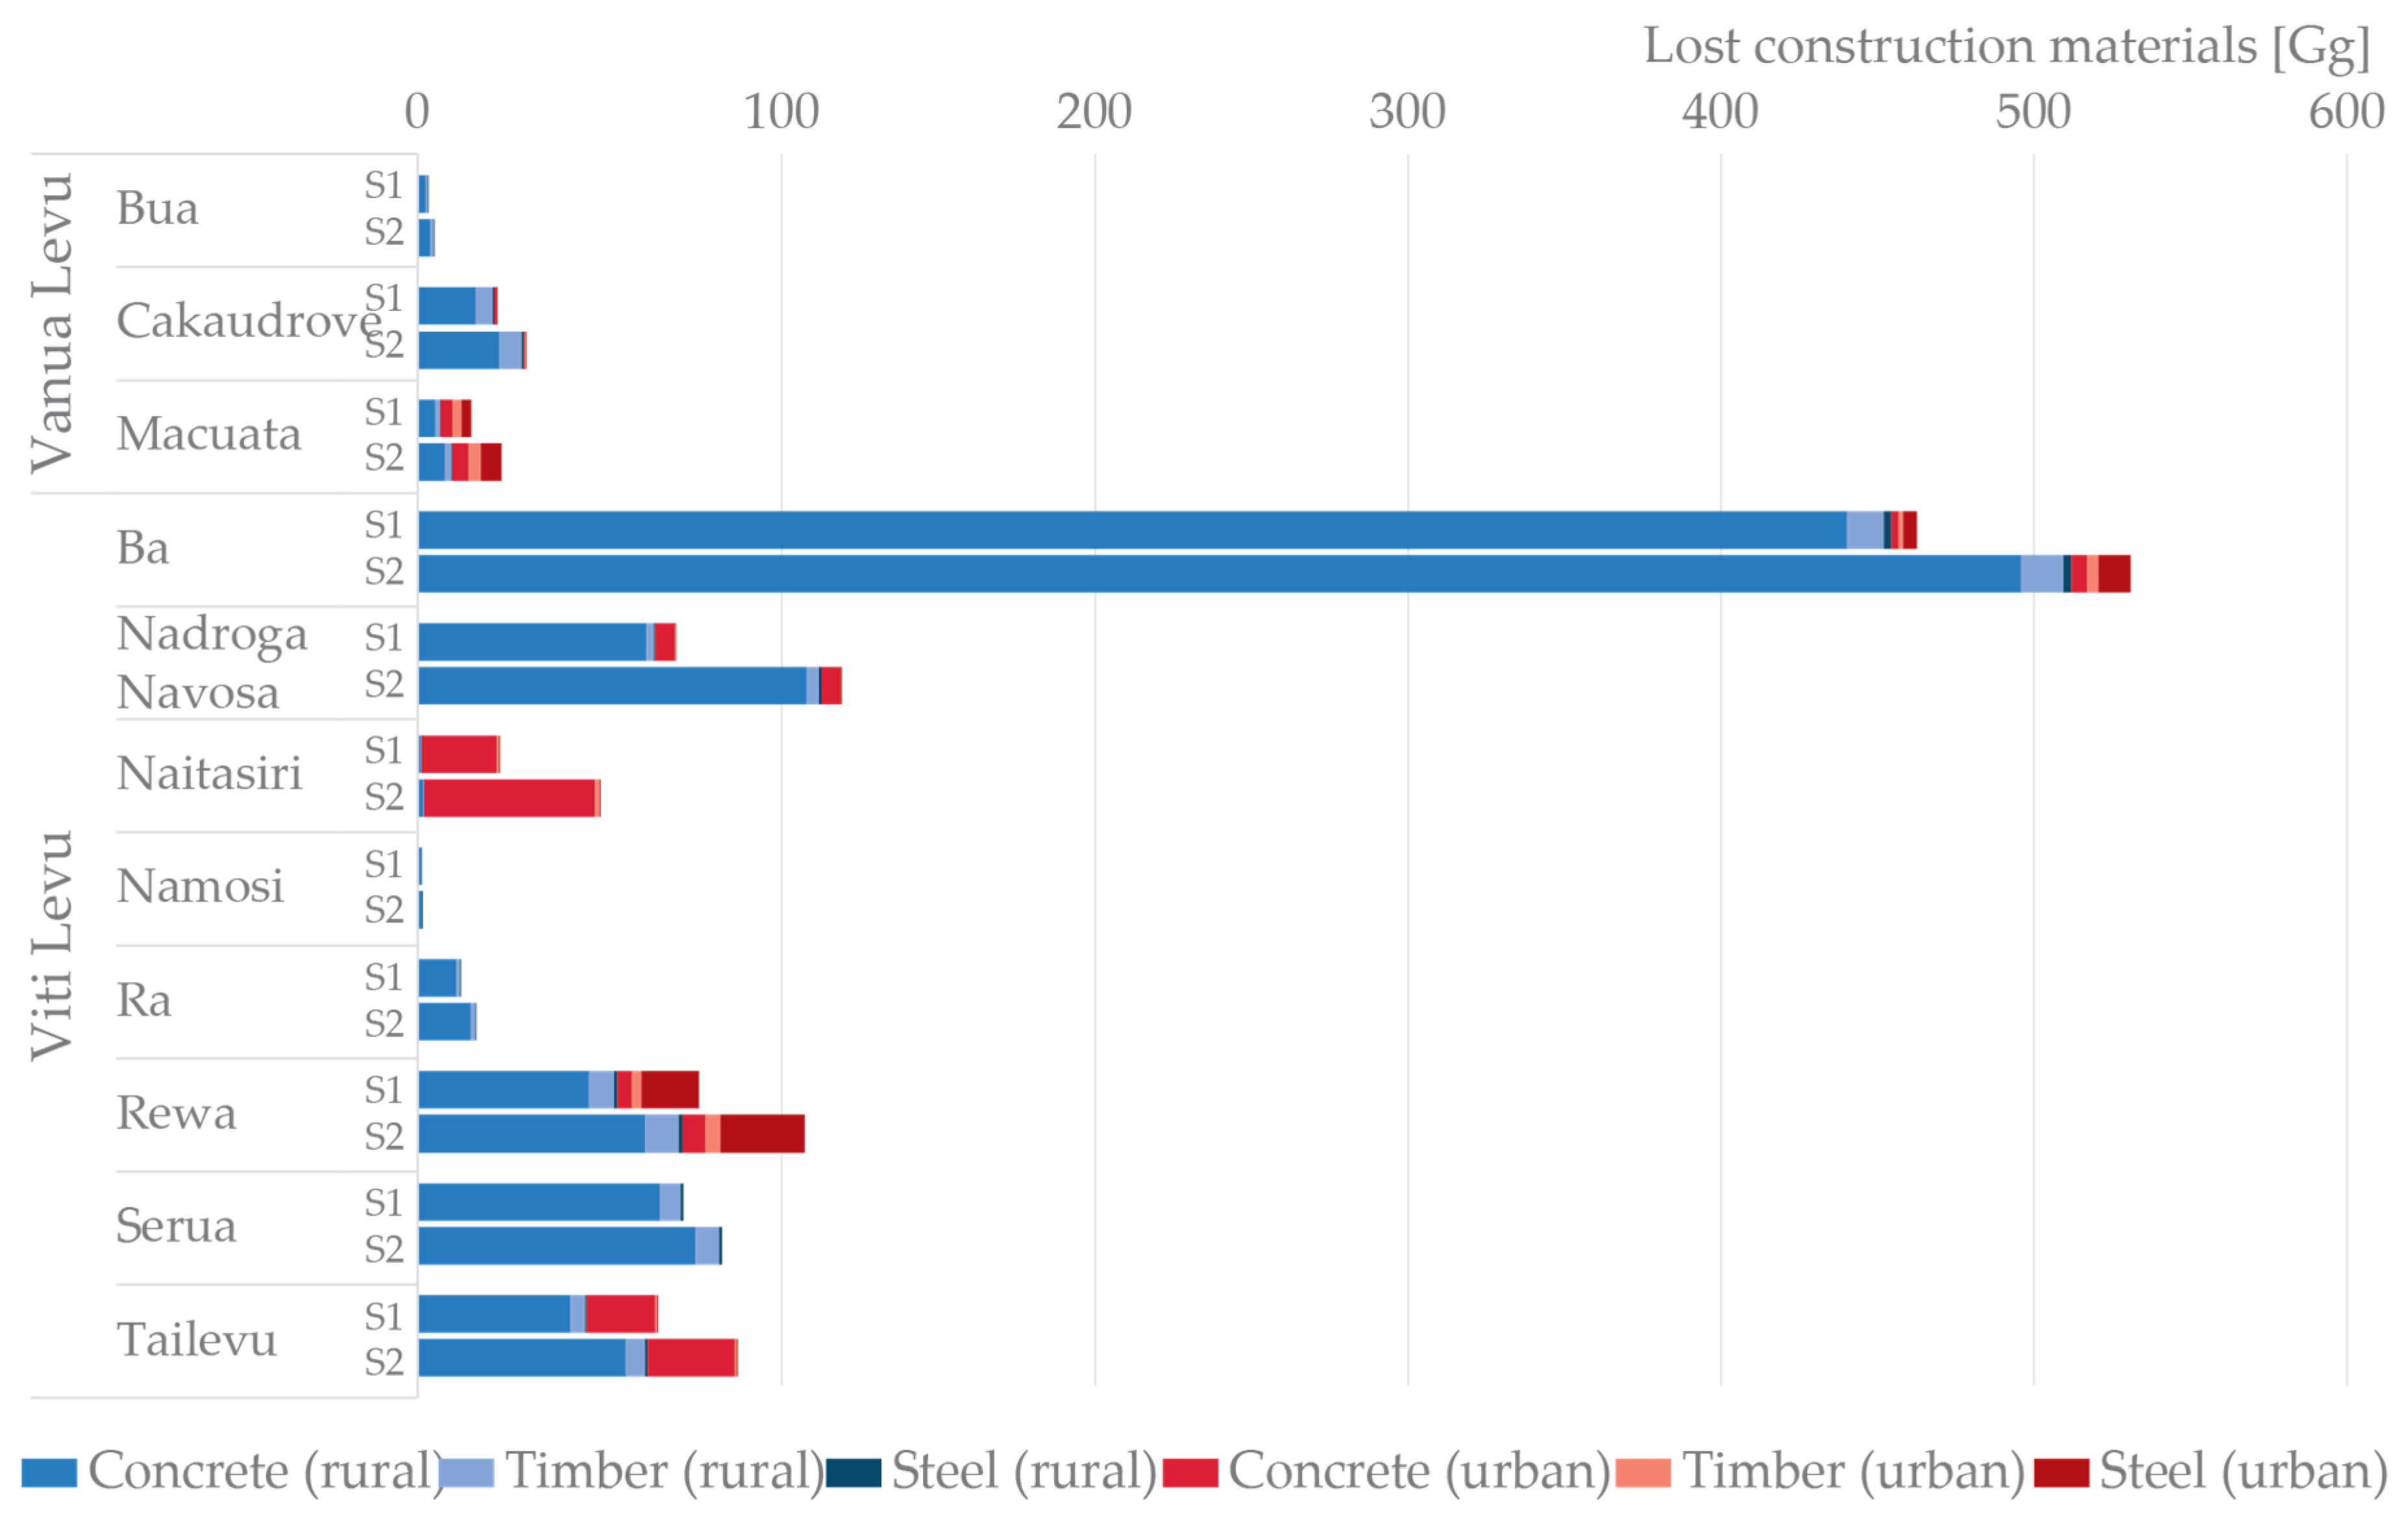
3.2. Results of the MSA

Figure 8 plots the lost material stock for the 2050 and 2100 scenarios (an equivalent table can be retrieved in the Supplementary Materials §4, and in the supporting data file for a machine-readable format). Our simulation predicts that, by 2050, 816 gigagrams (Gg) of concrete, 52 Gg of timber and 32 Gg of steel is stocked in buildings that are likely to be inundated. On average, every year will see 26 Gg of concrete, 1.7 Gg of timber, and 1 Gg of steel rendered unusable because of SLR.
In both scenarios, concrete accounts for about 90% of the total material lost by mass, followed by timber and steel, with 6% and 4% respectively. Steel will be mainly lost in urban areas while timber and concrete mainly occur in rural areas, due to the prevalence of this construction type in more urbanized areas. In total, most material will be lost in the provinces of Ba, Tailevu, Serua, Nadroga, Navosa, and Rewa.
The differences between the 2050 scenario and the 2100 scenario are proportional to the number of buildings that are additionally inundated in scenario 2. While steel rises by 62%, concrete rises by only 26% and timber by 34%. Those values are similar to the increases that can be seen when observing the changes of buildings being inundated in rural areas (33%) and urban areas (58%). The amount of lost material grows more than 100% in the urban areas of Naitasiri and Ba.

4. Discussion

It is unknown to which extent SLR induced by man-made climate change will influence future resource demand and waste flows. However, this aspect needs to be considered in regard to adaptation actions, especially in countries characterized by large coastal regions with limited economic possibilities and resource availability. One first step in trying to fill this knowledge gap is to estimate the material stock that will be lost due to the permanent inundation of buildings. This study is a first attempt at quantifying the amount of materials rendered unusable by SLR. By explicitly quantifying the number of buildings and amount of materials that will be under water, policymakers have a valid dataset which can contribute to planning adaptation actions to climate change.
The results show that the main material that will be lost is concrete, a structural material which is notorious for its high carbon emissions and energy requirements [51,52]. This is bad news for the environment but it is also an opportunity for transitioning towards more sustainable building solutions. Fijian policy makers are in time for planning relocations, incentivize the use of alternative structural materials, and consider appropriate actions for the large amount of concrete that will need to be demolished. Concrete can be recycled into new concrete [53,54,55], or downcycled for the formation of road beddings and railway ballasts [56,57,58]. Timber can be carefully disassembled and used in new constructions [59,60,61], or it can be used for generating energy [62,63,64]. Steel should be brought to smelting facilities and remanufactured into new steel products [65]. The fraction of materials that cannot be kept within the economy should be opportunely disposed in landfills, whose number, location, and size should be discussed with local communities and waste managers. The discussed waste treatment would require the establishment of new recycling and incineration facilities. Therefore, reusing and recycling demolition materials should be considered and will likely bring benefits to the environment in the long term, but will add to the costs of relocation in the short term (e.g., operation costs, facility costs, labor costs).
By 2050, the total expected demolition flows due to SLR are 900 Gg, averaging 30 Gg per year. Considering that in 2017 and 2018, the amount of construction materials in new buildings was on average 1170 Gg per year [36,37], SLR demolition flows equate to 2.6% of the total yearly material requirements for new constructions. Such a small fraction has the potential for being absorbed into new constructions without the need for dumping materials into landfills—albeit this does not consider demolition flows coming from normal activities not related to SLR. Fijian policymakers should consider facilitating the inclusion of construction and demolition waste into new buildings by legislating opportune regulations.
While concrete and timber are mainly lost in rural areas, urban areas show a large amount of steel loss. Nevertheless, adaptation policies might prevent urban areas from being flooded (e.g., constructing dams), which would thus protect existing buildings and prevent their demolition.
In both scenarios, rural buildings account for more than 80% of the inundated buildings. This is indicative of the fact that largest settlements are located inland, while coastlines are characterized by scattered buildings. The retreat of coastlines will push people further inland, likely increasing urbanization rates and shifting material demands toward reinforced concrete, as this is the preferred structural material used in cities. Future research shall include the influence climate change has on migration patterns in Fiji.
The relocation of Vunidogoloa cost US$15,625 per house [66]. If applied to the number of inundated rural buildings in this study, this would tally to US$96.13 million for scenario 1 and US$128.42 million for scenario 2. Yet, this simple estimation does not take into account the full impact of SLR, as aside of relocating, people will lose agricultural land. Considering that over 80% of inundated buildings are in rural areas, the people affected by SLR will have either to purchase or be assigned new land, or find different occupations in cities. A thorough analysis of the economic implications of the impacts of SLR on the Fijian economy should be addressed by future research.
The overall difference between scenario 1 and scenario 2 (+ 28%) is relatively low in comparison to the difference of SLR between the two (+ 182%). These findings shed new light on the results of Gravelle and Mimura [13]. While any increase in SLR will results in a proportional reduction of land, the same does not hold for buildings, as losses are dependent on their spatial distribution. This shows that there is not necessarily a relation between the total area inundated and the number of buildings flooded, and that for an accurate assessment of the techno-economic impacts of SLR on human settlements specific studies are needed.

5. Conclusions

5.1. Conclusions

This study presents an estimation of the lost construction material stock due to the permanent rise of sea levels caused by man-made climate change. The results are designed to provide governments, research institutions, non-government organizations and residents a statistical foundation for sustainable long-term planning. In particular, they can be used as baseline data for processes of spatial planning, especially to identify highly affected areas and to plan potential resettlements.
This methodology can be easily applied to other regions and can be fairly simply automated through the use of ArcGIS ModelBuilder or similar applications. This would provide vital information to local and national policymakers for deciding on the best course of actions to adapt to climate change and prepare for the consequences of SLR.
The present study could be expanded in various directions. The GIS-DIAM showed that infrastructure, especially the coastal highways on Viti Levu, are threatened by inundation. While this will not generate demolition flows, as roads are rarely removed [67], new roads will need to be constructed. To plan future material consumption even more sufficiently, future viability plans and associated material requirements should be considered. Additionally, more precise material indicators which include additional materials such as glass, aluminum, or copper, should be calculated to increase the robustness of the results.
Relocations, waste flows, loss of agricultural land, and future resource demands could be placed in a more encompassing economic model to quantify the overall costs associated to SLR. If possible, integrating the current digital terrain model with a digital elevation model which includes buildings could allow for the calculation of the exact height of constructions. Moreover, a highly detailed LiDAR map should be used to analyze in more detail the inundation pattern. This would allow for the possibility of simulating water barriers, allowing for the study of different solutions in relation to their cost and effectiveness. For better predictions, future research should consider increasing the epochs in future time where inundation maps are generated for. By doing so, trends can be better analyzed and the study’s predictions could be compared to what has actually happened in the future. The present study’s results could be additionally used on Fiji to create maps with secondary resources including an approximate date on which they would become available.

5.2. Limitations and Assumptions

The main limitation of this study comes from the limited data available in relation to building typologies and construction techniques, which is a common problem when conducting research in developing regions [68]. Material intensities differ for each building, while construction typologies are not provided in official maps. The spatial distribution of the typologies, as well as material intensities, were thus assigned on a provincial level rather than being specifically assigned to each building. Additionally, official maps do not report the number of floors for each building, and digital elevation maps only report the terrain height instead of the actual ground elevation. Moreover, over 7000 buildings that were visible from aerial photos were not included in the vectorized digital maps, and had to be manually added.
Additional limitations occur from the DEM and the predicted SLR in regard of a certain point of time. The choice of the years the study was conducted for is to give an overview on two periods in time, one relevant on short-term planning and one relevant on long-term planning. The results stay relevant even if SLR predictions change and therefore provide a good orientation. The accuracy of the DEM is unknown, which unfortunately limits the accuracy of the results. However, this DEM was the best accessible DEM for Fiji during the time this research was conducted (June 2019). Further, this study is meant to provide an overview on the situation and identify the most critical areas rather than presenting highly detailed results on MS. Manual observation was used as a comparative method to verify whether the federal data are more suitable than the SRTM data or the ALOS data. Using ArcMap, it was proven that the governmental data are more consistent and furthermore, less restricted by the limitation of displaying surface elevation heights rather than ground elevation heights. This is particularly due to the fact that the governmental data incorporate the limitation of showing surface elevation more precisely than the SRTM data and the ALOS data. Research was performed to identify whether lost material stock in buildings inundated due to climate change induced SLR is an issue that should be considered in further climate change adaptation research and policies.
Further limitations can be found regarding the implications of actions to adapt to climate change. The construction of water barriers can significantly change the predicted inundated areas, rendering buildings that were predicted to be underwater still usable. As it is not possible to forecast if and when a water barrier will be constructed, this study disregards this option and presents results as if no water barriers will be erected.
In addition, results account only for buildings which will be actually inundated. Buildings which are not inundated might be included in relocation processes, especially in those cases where the majority of the buildings in a village will be flooded. This decision has to be considered from case to case and is therefore not possible to be included in this study.
Storms, coastal erosion, and the salination of agricultural land and water storages might cause additional relocations. Models on the permeation of seawater in agricultural land and aquifers are required to include these aspects for a more accurate prediction.
This study neglects approximately 36,000 people (about 4% of the national population) that are not living on the two main islands. These primarily rural residents could cause further challenges because relocations can eventually not happen on smaller islands and therefore increase the density of the larger islands.
In spite of its limitations, this study was conducted to provide an overview on the situation and its significance for climate change adaptation. The limitations do not influence the goodness of results in a way that would result in significant differences.

Supplementary Materials

The following are available online at https://www.mdpi.com/2071-1050/12/3/834/s1, Table S1: Typical number of floors in buildings by province, including references, Table S2: Distribution of construction typologies per province for scenario 1 (2050), Table S3: Distribution of construction typologies per province for scenario 2 (2100), Table S4: Material intensities of cement block masonry walls, construction typology based on [13], measurements based on [14] densities according to [15] (concrete), [16] (steel), [14] (timber). Note that GFA = Gross Floor Area, Table S5: Material intensities of corrugated iron walls and steel frame buildings, construction typology based on [13], measurements based on [14], densities according to [15] (concrete), [16] (steel), [14] (timber). Note that GFA = Gross Floor Area, Table S6: Material intensities of timber frame buildings, construction typology based on [13], measurements based on [14], densities according to [15] (concrete), [16] (steel), [14] (timber). Note that GFA = Gross Floor Area, Table S7: Results of the material stock analysis. Unit: Gg (note: 1 Gg = 109 g = 103 t = 1 kt).

Author Contributions

Conceptualization, S.M., A.M., S.W., H.T. and L.S.; Data curation, A.M.; Formal analysis, S.M. and A.M.; Funding acquisition, S.W. and L.S.; Investigation, S.M.; Methodology, S.M., A.M. and S.W.; Project administration, A.M. and S.W.; Resources, S.M.; Software, S.M.; Supervision, H.T. and L.S.; Validation, A.M., S.W., H.T. and L.S.; Visualization, S.M., A.M. and S.W.; Writing—original draft, S.M., A.M. and S.W.; Writing—review & editing, S.M., A.M., S.W., H.T. and L.S. All authors have read and agreed to the published version of the manuscript.

Funding

The authors acknowledge the financial support by the DFG (German Research Foundation) in the framework of the Excellence Initiative, Darmstadt Graduate School of Excellence Energy Science and Engineering (GSC 1070) as well as by the Open Access Publishing Fund of Technische Universität Darmstadt.

Acknowledgments

The authors are grateful to the staff at Geospatial Division of the Ministry of Lands & Mineral Resources Fiji, in particular M. Hicks, V. K. Raqona and N. N. Kumar for their kind assistance in providing data.

Conflicts of Interest

The authors declare no conflict of interest. The funders had no role in the design of the study; in the collection, analyses, or interpretation of data; in the writing of the manuscript, or in the decision to publish the results. Maps throughout this paper were created using ArcGIS® software by Esri. ArcGIS® and ArcMap™ are the intellectual property of Esri and are used herein under license. Copyright © Esri. All rights reserved. For more information about Esri® software, please visit www.esri.com.

References

  1. IPCC. Global Warming of 1.5 °C; An IPCC Special Report on the impacts of global warming of 1.5 °C above pre-industrial levels and related global greenhouse gas emission pathways, in the context of strengthening the global response to the threat of climate-change, sustainable development, and efforts to eradicate poverty; Masson-Delmotte, V.M., Zhai, P., Pörtner, H.-O., Roberts, D., Skea, J., Shukla, P.R., Pirani, A., Moufouma-Okia, W., Péan, C., Pidcock, R., et al., Eds.; IPCC: Geneva, Switzerland, 2018; In Press. [Google Scholar]
  2. Church, J.A.; Clark, P.U.; Cazenave, A.; Gregory, J.M.; Jevrejeva, S.A.; Levermann, A.; Merrifield, M.A.; Milne, G.A.; Nerem, R.S.; Nunn, P.D.; et al. Sea Level Change. In Climate Change 2013: The Physical Science Basis; Contribution of Working Group I to the Fifth Assessment Report of the Intergovernmental Panel on Climate Change; Stocker, T.F., Qin, D., Plattner, G.-K., Tignor, M., Allen, S.K., Boschung, J., Nauels, A., Xia, Y., Bex, V., Midgley, P.M., Eds.; Cambridge University Press: Cambridge, UK; New York, NY, USA, 2013. [Google Scholar]
  3. Dasgupta, S.; Meisner, C.; Laplante, B.; Wheeler, D.; Yan, J. The Impact of Sea Level Rise on Developing Countries; WPS-4136; The World Bank: Washington, DC, USA, 2007. [Google Scholar]
  4. Barbier, E.B. Climate Change Impacts on Rural Poverty in Low-Elevation Coastal Zones. Estuar. Coast. Shelf Sci. 2015, 165, A1–A13. [Google Scholar] [CrossRef] [Green Version]
  5. IPCC. Climate Change 2014: Synthesis Report; Contribution of Working Groups I, II and III to the Fifth Assessment Report of the Intergovernmental Panel on Climate Change; IPCC: Geneva, Switzerland, 2014. [Google Scholar]
  6. Kulp, S.A.; Strauss, B.H. New elevation data triple estimates of global vulnerability to sea-level rise and coastal flooding. Nat. Commun. 2019. [Google Scholar] [CrossRef] [Green Version]
  7. Climate Change Secretariat. Climate Change: Small Island Developing States; Climate Change Secretariat: Bonn, Germany, 2005. [Google Scholar]
  8. Golden, C.D.; Allison, E.H.; Cheung, W.W.L.; Dey, M.M.; Halpern, B.S.; McCauley, D.J.; Smith, M.; Vaitla, B.; Zeller, D.; Myers, S.S. Nutrition: Fall in Fish Catch Threatens Human Health. Nature 2016, 534, 317–320. [Google Scholar] [CrossRef] [PubMed]
  9. Mercer, J.; Kelman, I.; Alfthan, B.; Kurvits, T. Ecosystem-Based Adaptation to Climate Change in Caribbean Small Island Developing States: Integrating Local and External Knowledge. Sustainability 2012, 4, 1908–1932. [Google Scholar] [CrossRef] [Green Version]
  10. Turvey, R. Vulnerability Assessment of Developing Countries: The Case of Small-island Developing States. Dev. Policy Rev. 2007, 25, 243–264. [Google Scholar] [CrossRef]
  11. Kurniawan, F.; Adrianto, L.; Bengen, D.G.; Prasetyo, L.B. Vulnerability Assessment of Small Islands to Tourism: The Case of the Marine Tourism Park of the Gili Matra Islands, Indonesia. Glob. Ecol. Conserv. 2016, 6, 308–326. [Google Scholar] [CrossRef] [Green Version]
  12. Blasiak, R.; Spijkers, J.; Tokunaga, K.; Pittman, J.; Yagi, N.; Österblom, H. Climate Change and Marine Fisheries: Least Developed Countries Top Global Index of Vulnerability. PLoS ONE 2017, 12. [Google Scholar] [CrossRef]
  13. Gravelle, G.; Mimura, N. Vulnerability Assessment of Sea-Level Rise in Viti Levu, Fiji Islands. Sustain. Sci. 2008, 3, 171–180. [Google Scholar] [CrossRef]
  14. The World Bank. Climate Vulnerability Assessment: Making Fiji Climate Resilient; The World Bank: Suva, Fiji, 2017. [Google Scholar]
  15. Wu, S.Y.; Najjar, R.; Siewert, J. Potential Impacts of Sea-Level Rise on the Mid- and Upper-Atlantic Region of the United States. Clim. Chang. 2009, 95, 121–138. [Google Scholar] [CrossRef]
  16. Heberger, M.; Cooley, H.; Herrera, P.; Gleick, P.H.; Moore, E. The Impacts of Sea-Level Rise on the California Coast; California Climate Change Centre: Oakland, CA, USA, 2009. [Google Scholar]
  17. Sadler, J.M.; Haselden, N.; Mellon, K.; Hackel, A.; Son, V.; Mayfield, J.; Blase, A.; Goodall, J.L. Impact of Sea-Level Rise on Roadway Flooding in the Hampton Roads Region, Virginia. J. Infrastruct. Syst. 2017, 23, 05017006. [Google Scholar] [CrossRef] [Green Version]
  18. Hallegatte, S.; Ranger, N.; Mestre, O.; Dumas, P.; Corfee-Morlot, J.; Herweijer, C.; Wood, R.M. Assessing Climate Change Impacts, Sea Level Rise and Storm Surge Risk in Port Cities: A Case Study on Copenhagen. Clim. Chang. 2011, 104, 113–137. [Google Scholar] [CrossRef] [Green Version]
  19. Ministry of Health and Ministry of Economy. 5- Year to 20- Year National Development Plan for Fiji; Ministry of Health and Ministry of Economy: Suva, Fiji, 2017.
  20. California Coastal Comission. California Coastal Comission Sea Level Rise Policy Guidance: Interpretive Guidelines for Addressing Sea Level Rise in Local Coastal Programs and Coastal Development Permits; California Coastal Comission: San Francisco, CA, USA, 2015.
  21. Ministry of Economy. Fiji’s National Adaptation Plan Framework Ministry of Economy; Ministry of Economy: Suva, Fiji, 2017.
  22. Charan, D.; Kaur, M.; Singh, P. Customary Land and Climate Change Induced Relocation—A Case Study of Vunidogoloa Village, Vanua Levu, Fiji. In Climate Change Adaptation in Pacific Countries Forstering Resilience and Improving the Quality of Life; Leal Filho, W., Ed.; Springer International Publishing: Cham, Switzerland, 2017. [Google Scholar] [CrossRef]
  23. Fuldauer, L.I.; Ives, M.C.; Adshead, D.; Thacker, S.; Hall, J.W. Participatory Planning of the Future of Waste Management in Small Island Developing States to Deliver on the Sustainable Development Goals. J. Clean. Prod. 2019, 223, 147–162. [Google Scholar] [CrossRef]
  24. United Nations Environment Programme. Small Island Developing States Waste Management Outlook; United Nations Environment Programme: Nairobi, Kenya, 2019. [Google Scholar] [CrossRef] [Green Version]
  25. Ali, S.; Darsan, J.; Singh, A.; Wilson, M. Sustainable Coastal Ecosystem Management – An Evolving Paradigm and Its Application to Caribbean SIDS. Ocean Coast. Manag. 2018, 163, 173–184. [Google Scholar] [CrossRef]
  26. Mackay, S.; Brown, R.; Gonelevu, M.; Pelesikoti, N.; Kocovanua, T.; Iaken, R.; Iautu, F.; Tuiafitu-Malolo, L.; Fulivai, S.; Lepa, M.; et al. Overcoming Barriers to Climate Change Information Management in Small Island Developing States: Lessons from Pacific SIDS. Clim. Policy 2019, 19, 125–138. [Google Scholar] [CrossRef]
  27. Tanikawa, H.; Fishman, T.; Okuoka, K.; Sugimoto, K. The Weight of Society over Time and Space: A Comprehensive Account of the Construction Material Stock of Japan, 1945–2010. J. Ind. Ecol. 2015, 19, 778–791. [Google Scholar] [CrossRef]
  28. Tanikawa, H.; Managi, S.; Lwin, C.M. Estimates of Lost Material Stock of Buildings and Roads Due to the Great East Japan Earthquake and Tsunami. J. Ind. Ecol. 2014, 18, 421–431. [Google Scholar] [CrossRef]
  29. Kleemann, F.; Lehner, H.; Szczypińska, A.; Lederer, J.; Fellner, J. Using Change Detection Data to Assess Amount and Composition of Demolition Waste from Buildings in Vienna. Resour. Conserv. Recycl. 2017, 123, 37–46. [Google Scholar] [CrossRef]
  30. Miatto, A.; Schandl, H.; Forlin, L.; Ronzani, F.; Borin, P.; Giordano, A.; Tanikawa, H. A Spatial Analysis of Material Stock Accumulation and Demolition Waste Potential of Buildings: A Case Study of Padua. Resour. Conserv. Recycl. 2019, 142, 245–256. [Google Scholar] [CrossRef]
  31. Cheng, K.L.; Hsu, S.C.; Li, W.M.; Ma, H.W. Quantifying Potential Anthropogenic Resources of Buildings through Hot Spot Analysis. Resour. Conserv. Recycl. 2018, 133, 10–20. [Google Scholar] [CrossRef]
  32. H2. Main Material for Construction of Walls—Proportion of Wood—Pie Chart—2007 Census (Households). Available online: http://fiji.popgis.spc.int/#z=211120,8600481,1039511,939237;l=en;v=map1 (accessed on 26 November 2018).
  33. Fiji Bureau of Statistics. Census 2007 Results: Population Size, Growth, Structure, and Distribution; Fiji Bureau of Statistics: Suva, Fiji, 2008.
  34. Fiji. Available online: https://download.geofabrik.de/australia-oceania/fiji.html (accessed on 22 November 2018).
  35. ArcGIS—World Imagery Mit Metadaten. Available online: https://www.arcgis.com/home/webmap/viewer.html?webmap=268c1b2fe17842758476f4e002d19ef4&extent=12.0492,52.0048,13.9938,52.8464 (accessed on 30 June 2019).
  36. Building Statistics December Quarter and Annual 2018. Available online: https://www.statsfiji.gov.fj/index.php/latest-releases/establishment-surveys/building-statistics/931-building-statistics-december-quarter-annual-2018?highlight=WyJidWlsZGluZyIsImFubnVhbCIsMjAxOCwiYW5udWFsIDIwMTgiXQ== (accessed on 30 August 2019).
  37. Building Statistics—December Quarter & Annual 2017. Available online: https://www.statsfiji.gov.fj/index.php/latest-releases/establishment-surveys/building-statistics/818-building-statistics-december-quarter-and-annual-2017?highlight=WyJidWlsZGluZyIsMjAxN10= (accessed on 30 August 2019).
  38. Raqona, V. Personal Communication; Geospatial Division of the Ministry of Lands & Mineral Resources Fiji: Suva, Fiji, 2019.
  39. Caimi, A.; Moles, O.; Joffroy, T.; Serlet, M. Fiji/Baseline Data on Local Building Culture & Coping Strategies; International Centre for Earthen Construction: Villefontaine, France, 2016. [Google Scholar] [CrossRef]
  40. Habitat for Humanity Fiji. Construction Manual; Habitat for Humanity Fiji: Suva, Fiji, 2013. [Google Scholar]
  41. Chang, Y.-S. Life Cycle Assessment on the Reduction of Carbon Dioxide Emission of Buildings; Chenggong University: Tainan, Taiwan, 2002. [Google Scholar]
  42. Nagaoka, K.; Tanikawa, H.; Yoshida, N.; Higashi, O.; Onishi, A.; Feng, S.; Imura, H. Study of Accumulation (Distribution Tendency to the Material Stock of the Construction Sector in All Prefectures and Mega Cities in Japan. Environ. Sci. 2009, 23, 83–88. [Google Scholar]
  43. Tanikawa, H.; Hashimoto, S. Urban Stock over Time: Spatial Material Stock Analysis Using 4D-GIS. Build. Res. Inf. 2009, 5–6, 483–502. [Google Scholar] [CrossRef]
  44. Google Maps. Suva City. Available online: https://www.google.com/maps/@-18.1394616,178.424621,3a,75y,96.46h,110.5t/data=!3m7!1e1!3m5!1sAF1QipNCJNPOQ8u1FqqGFOpm5jq-ztenE-FzsWw0-ORt!2e10!3e11!7i5376!8i2688 (accessed on 10 April 2019).
  45. Fiji Key Facts. Available online: http://thecommonwealth.org/our-member-countries/fiji (accessed on 30 October 2018).
  46. Pacific Islands Climate Change Assistance Programme. Climate Change the Fiji Islands Response; Pacific Islands Climate Change Assistance Programme: Suva, Fiji, 2005. [Google Scholar]
  47. Fiji: Building Resilience in the Face of Climate Change. Available online: https://www.unocha.org/story/fiji-building-resilience-face-climate-change (accessed on 23 October 2019).
  48. USGS Earth Explorer. Available online: https://earthexplorer.usgs.gov/ (accessed on 7 January 2019).
  49. ALOS Science Project. Available online: https://www.eorc.jaxa.jp/ALOS/en/aw3d30/index.htm (accessed on 7 January 2019).
  50. Fiji 2017 Population & Housing Census; Fiji Islands Bureau of Statistics: Suva, Fiji, 2018.
  51. Solutions, Green Cement: Concrete. Available online: https://www.nature.com/news/green-cement-concrete-solutions-1.12460 (accessed on 8 November 2019).
  52. Barcelo, L.; Kline, J.; Walenta, G.; Gartner, E. Cement and Carbon Emissions. Mater. Struct. 2014, 47, 1055–1065. [Google Scholar] [CrossRef]
  53. Hansen, T.C. Recycling of Demolished Concrete and Masonry, 1st ed.; CRC Press: London, UK, 1992. [Google Scholar] [CrossRef]
  54. Oikonomou, N.D. Recycled Concrete Aggregates. Cem. Concr. Compos. 2005, 27, 315–318. [Google Scholar] [CrossRef]
  55. Tam, V.W.Y. Comparing the Implementation of Concrete Recycling in the Australian and Japanese Construction Industries. J. Clean. Prod. 2009, 17, 688–702. [Google Scholar] [CrossRef]
  56. Courard, L.; Michel, F.; Delhez, P. Use of Concrete Road Recycled Aggregates for Roller Compacted Concrete. Constr. Build. Mater. 2010, 24, 390–395. [Google Scholar] [CrossRef]
  57. Schimmoller, V.E.; Taylor Eighmy, T.; Smith, M.; Rohrbach, G.J.; Helms, G.; Van Deusen, C.H.; Almborg, J.A.; Holtz, K.; Wiles, C.; Malasheskie, G. Recycled Materials in European Highway Environments: Uses, Technologies, and Policies; DIANE Publishing: Washington, DC, USA, 2000. [Google Scholar] [CrossRef]
  58. Herrador, R.; Pérez, P.; Ordónez, J. Use of Recycled Construction and Demolition Waste Aggregate for Road Course Surfacing. J. Transp. Eng. 2012, 138. [Google Scholar] [CrossRef]
  59. Ormondroyd, G.A.; Spear, M.J.; Skinner, C. The Opportunities and Challenges for Re-Use and Recycling of Timber and Wood Products Within the Construction Sector. In Environmental Impacts of Traditional and Innovative Forest-based Bioproducts; Kutnar, A., Muthu, S., Eds.; Springer: Singapore, 2016; pp. 45–103. [Google Scholar] [CrossRef]
  60. Hafner, A.; Ott, S.; Winter, S. Recycling and End-of-Life Scenarios for Timber Structures. Mater. Joints Timber Struct. 2014, 9. [Google Scholar] [CrossRef]
  61. Addis, B.; Addis, W. Building with Reclaimed Components and Materials: A Design Handbook for Reuse and Recycling; Routledge: London, UK, 2006. [Google Scholar]
  62. Kaziolas, D.N.; Zygomalas, I.; Stavroulakis, G.E.; Baniotopoulos, C.C. Environmental Impact Assessment of the Life Cycle of a Timber Building. In Proceedings of the Fourteenth International Conference on Civil, Structural and Environmental Engineering Computing, Cagliari, Sardinia, Italy, 3–6 September 2013; Topping, B.H.V., Ivány, P., Eds.; Civil-Comp Press: Stirlingshire, Scotland, 2013. Available online: http://repository.edulll.gr/2516 (accessed on 06 November 2019).
  63. John, S.; Buchanan, A. Review of End-of-Life Options for Structural Timber Buildings in New Zealand and Australia; University of Canterbury: Christchurch, New Zealand, 2013; Available online: http://hdl.handle.net/10092/10296 (accessed on 06 November 2019).
  64. Macineasa, S.G.; Entuc, I.S.; Taranu, N.; Florenta, I.; Secu, A. Environmental Performances of Different Timber Structures for Pitched Roofs. J. Clean. Prod. 2018, 175, 164–175. [Google Scholar] [CrossRef]
  65. Tam, V.W.Y.; Tam, C.M. A Review on the Viable Technology for Construction Waste Recycling. Resour. Conserv. Recycl. 2006, 47, 209–221. [Google Scholar] [CrossRef] [Green Version]
  66. McNamara, K.E.; Des Combes, H.J. Planning for Community Relocations Due to Climate Change in Fiji. Int. J. Disaster Risk Sci. 2015, 6, 315–319. [Google Scholar] [CrossRef] [Green Version]
  67. Switalski, T.; Bissonette, J.; DeLuca, T.; Luce, C.; Madej, M. Benefits and Impacts of Road Removal. Front. Ecol. Environ. 2004, 2. [Google Scholar] [CrossRef]
  68. Nguyen, T.C.; Fishman, T.; Miatto, A.; Tanikawa, H. Estimating the Material Stock of Roads: The Vietnamese Case Study. J. Ind. Ecol. 2019, 23, 663–673. [Google Scholar] [CrossRef]
Figure 1. Schematic representation of the methodological approach of this study.
Sustainability 12 00834 g001
Figure 2. Number of inundated buildings in urban and rural areas of Fiji by province. Scenario 1 refers to projections to 2050 (+ 0.22 m), scenario 2 refers to projections to 2100 (+ 0.63 m).
Sustainability 12 00834 g002
Figure 3. Percentage of inundated buildings compared to the total buildings currently standing. The inner circle represents the percentage for 2050 (+ 0.22 m); the outer circle represents the percentage for 2100 (+ 0.63 m).
Sustainability 12 00834 g003
Figure 4. Distribution of permanently inundated buildings in Vanua Levu in 2050. Each province is colored according to the percentage of inundated buildings compared to the total existing ones.
Sustainability 12 00834 g004
Figure 5. Distribution of permanently inundated buildings in Viti Levu in 2050. Each province is colored according to the percentage of inundated buildings compared to the total existing ones.
Sustainability 12 00834 g005
Figure 6. Distribution of permanently inundated buildings in Vanua Levu in 2100. Each province is colored according to the percentage of inundated buildings compared to the total existing ones.
Sustainability 12 00834 g006
Figure 7. Distribution of permanently inundated buildings in Viti Levu in 2100. Each province is colored according to the percentage of inundated buildings compared to the total existing ones.
Sustainability 12 00834 g007
Figure 8. Amount of construction materials lost in gigagrams (Gg) due to sea level rise in Fiji. S1 refers to the 2050 scenario (+ 0.22 m); S2 refers to the 2100 scenario (+ 0.63 m). The blue colors indicate materials located in rural areas, while the red colors represent urban areas.
Sustainability 12 00834 g008
Table 1. Data sources used for the Geographic Information System-Digital Inundation Analysis Model (GIS-DIAM) and the material stock analysis (MSA).
Area of InterestSpecificationReference
Administrative boundariesEnumerations[32]
Provinces[32]
Towns and Cities[33]
Building data Open Street Map data[34]
Satellite imagery[35]
Buildings per province[36,37]
Elevation data Government data[38]
Inundation dataPermanent sea level rise based on Intergovernmental Panel of Climate Change (IPCC) prediction[2]
Construction typologiesConstruction types commonly used on Fiji[39]
Gross floor areaArea of a building[34]
Number of floors in urban areasPlease refer to Supplementary Information Table S1 for the references on the determination of the number of floors within urban areas
Material intensitiesMaterial intensities in kg/m²[28,31,39,40,41,42,43,44]
Spatial distribution per province and construction type[32]
Table 2. Material intensity per construction type (kg/m² of gross floor area) [28,31,39,40,41,42,43,44].
Construction TypeLayerConcreteSteelTimber
Cement bricks Foundation120000
Wall62400
Roof051
Total182451
Reinforced concreteTotal14161040
Steel claddedFoundation108056
Wall044
Roof041
Total108861
Timber claddedFoundation108056
Wall0036
Roof051
Total108594

