1. Introduction
With the deepening of economic globalization, numerous manufacturing enterprises have begun to realize that traditional extensive development is difficult to sustain. Moreover, the 19th National Congress highlighted the development concept of “innovation, coordination, green, opening and sharing” [
1]. “Green innovation”, representing the combination of innovation-driven and green development strategies, has become the inevitable choice for overcoming bottlenecks regarding resources and the environment [
2,
3]. With the rapid development of “Internet +” [
4,
5], a green technology innovation service platform, which represents an important vehicle for information on green technology innovation, can eliminate barriers to the sharing of green innovation information and promote the in-depth development of cloud-based green technology innovation [
6]. Therefore, it has considerable theoretical value and practical significance for systematically analyzing and comprehensively evaluating enterprises’ green innovation abilities in an innovation network to effectively enhance the those abilities and realize sustainable development [
7,
8].
In contrast to traditional technology, green technology innovation seeks to reduce resource consumption and environmental pollution with the new concepts and technologies [
9,
10]. It requires that enterprises not blindly pursue profit maximization, but also consciously fulfill their social responsibilities, reduce the environmental externalities of economic development, and obtain corresponding economic benefits. At present, scholars in various countries have begun to refine the evaluation of green innovation ability using specific indicators, and especially quantitative indicators, to empirically evaluate green technology innovation ability. Thus, the design of systems for evaluating green technology innovation tends to be comprehensive and scientific, but most of them focus on evaluating the green technology innovation in a non-networked context, and some are based on the analysis of innovation output [
11,
12,
13]. For example, according to Garcia Granero, evaluation indicators for green innovation capability include four types: product, process, organization, and marketing [
14]. Anthonio (2009) et al. divided innovation ability into three aspects: indirect performance, direct performance, and knowledge output [
15]. Rizos established an evaluation index system on the basis of direct performance, indirect performance, knowledge output, ecological performance, and economic performance. In their work, indirect performance refers to the improvement of resource utilization and productivity [
16]. Direct performance is mainly reflected in the sales revenue of green technology and the number of innovative products, while knowledge output includes the number of, for example, green patents and monographs. Some scholars argue that green technology innovation ability is not limited to the ability to produce environmental protection products [
17,
18,
19,
20]. For example, Wield et al. contended that green technology innovation ability should also include the resources, processes, and technologies that operate with reduced energy consumption [
21]. Scholars have also evaluated the green innovation ability of enterprises from an input–output perspective. For example, Yin Qun established an evaluation framework of green innovation efficiency based on four categories: resource inputs, nonresource inputs, expected output, and nonexpected output [
22]. Wang Hailong and colleagues calculated the efficiency of green innovation in China by the data envelopment analysis (DEA) method from 2007 to 2011 [
23]. Hsueh evaluates green supply chain innovation of the construction industry from two aspects of energy and environment by using a multicriteria evaluation model [
24]. Enterprises can gain a competitive advantage by developing green product innovation and exploring the key factors of green product evaluation [
25]. Cheng Hua and colleagues considered innovation input from capital, human resources, and environmental regulation, and treated environmental performance and economic performance as innovation outputs. Many scholars have also constructed evaluation index systems based on the elements of green innovation capability, such as Yang Lisheng, who defined green technology innovation ability indices based on the six aspects, namely, innovation input ability, management ability, R&D ability, manufacturing ability, entrepreneur innovation consciousness, and marketing capability, and used the comprehensive fuzzy evaluation method to evaluate the green sustainability of enterprises [
26]. From the perspective of the green innovation environment of enterprises, Wang Qiang established an evaluation index system including green culture, innovation investment, and resource environment [
27].
The methods commonly used for evaluation are generally a combination of subjective and objective, and qualitative and quantitative methods, including DEA [
28,
29,
30,
31], grey correlation analysis [
32,
33], entropy [
34], the DEMATEL method, panel data, fuzzy comprehensive evaluation [
35,
36], and the AHP analytic hierarchy process [
37]. For example, Gupta et al. used the grey-DEMATEL to determine 21 factors contributing to green innovation [
38]. According to panel data, Ghisetti selected nine indicators of energy consumption and environmental pollution to evaluate the efficiency of the green innovation of enterprises [
39]. Roberto also used a two-stage model and empirical research to assess the impact of green input on productivity [
40]. Liu Chun Xiang (2018) and others used fuzzy comprehensive evaluation and AHP methods to comprehensively evaluate the green innovation ability of pulp and paper enterprises [
41]. Ren Yao and Niu Chonghuai evaluated the industrial green innovation efficiency of Shanxi Province based on the DEA–range adjusted measure (RAM) model [
42]. Tseng used DEA Malmquist and other productivity index analysis methods to evaluate China’s green innovation ability [
43]. However, the aforementioned evaluation methods often inevitably lead to subjective assumptions being made by experts and unreasonable weight allocations, ignoring the randomness of evaluation information and the relationships between indicators [
44,
45,
46]. Fuzziness and randomness are interrelated, and although the aforementioned methods have advantages in analyzing complex evaluation factors, it is regrettable that the inherent randomness of the information is ignored. Fortunately, Deyi firstly proposed the cloud model, which describes the relationship between fuzziness and randomness [
47,
48,
49]. As an effective mathematical method, the cloud model has been used in evaluation fields. For example, based on the cloud model method, Fu et al. (2016) [
50] constructed the scheme evaluation system of the sustainable utilization of water resources. Yang et al. (2019) [
51] evaluated the vulnerability of debris flow based on the improved entropy method and cloud model. Its numerous advantages have led to the successful application of the cloud model in energy management.
Thus, based on the current status of green innovation among manufacturing enterprises in China’s innovation network, this paper designs a first-level index based on innovation input, environment, and output, and constructs an innovation evaluation system consisting of 14 s-level indices, including R & D funds, technology investment funds, rental platform equipment funds, and the ability to improve green technology, among others [
52,
53]. The entropy [
54], DEMATEL, and cloud model [
55,
56,
57] methods are used to calculate the comprehensive weight of the indices, and grey correlation analysis [
58] and the cloud model are used to quantitatively evaluate the qualitative indicators.
The contributions of this paper are as follows:
- (1)
Combined with the objective of green innovation and the present state of “Internet +” development, this paper establishes a comprehensive evaluation index system for enterprises’ green innovation abilities in an innovation network. The index system reflects enterprises’ green innovation abilities based on innovation input, environment, and output.
- (2)
To obtain a reasonable conversion between quantitative and qualitative information in the process of evaluation, and to fully consider the fuzziness and randomness in the information used in the evaluation, we introduce the cloud model to determine the weightings used in the entropy and DEMATEL methods, which are better suited to deriving the ideal weights in a comprehensive weight method. This represents a scientific and feasible evaluation method that exhibits high classification accuracy for evaluating the ability of manufacturing enterprises in innovation networks to collaboratively produce scientific and technological innovations.
The rest of the paper is organized as follows. In
Section 2, we introduce the construction of the index system for green innovation capacity.
Section 3 briefly introduces the methods employed, including the cloud model and its calculation, and calculates the comprehensive index weight by combining the entropy and DEMATEL methods.
Section 4 evaluates and analyzes the green innovation ability of five companies in an innovation network as examples, and compares the results with those obtained via other accurate numerical methods to verify the accuracy and effectiveness of the proposed method. Finally,
Section 5 concludes the work. This paper demonstrates that the evaluation index system devised here for evaluating manufacturing enterprises’ green innovation abilities in an innovation network is highly applicable, and the empirical analysis further demonstrates that the method can be used to guide engineering practice.
3. Methodologies
In this part, we propose an evaluation model, including the cloud model and the methods required to obtain indicator weights. By comparing different methods, the cloud model is employed to express the evaluation information, while we use the entropy weight and DEMATEL to calculate the comprehensive weights of the indices. Finally, we use the cloud distance measurement method to evaluate the performance of the weighting methods.
3.1. Cloud Model and Related Calculation
The theory underlying the cloud model is based on the idea of fuzzy theory [
59], as proposed by professor Li [
60]. It is a model based on fuzzy mathematics that can find the uncertainty conversion between qualitative and quantitative values [
61]. The “cloud” in the model is formed through the condensation of numerous “water droplets,” where the cloud reflects the importance of qualitative indicators and the droplets represent a quantitative description of it. The process of producing these droplets can be used to express the mapping between quantitative values and qualitative indicators.
Let U be a quantitative domain and C a qualitative concept in U. If the uncertainty
μ(
x) of element
x in U to C is a random number with a stable tendency, the parameter
μ(
x) can be described as:
Mathematically, the distribution of
x can be determined by three characteristics: the expectation parameter
Ex, the entropy parameter
En, and the hyper entropy parameter
He [
62,
63,
64].
Ex is the expected value of a droplet based on the universe of discourse data, i.e., on the concept and the best representation of qualitative concept.
En reflects the distribution of droplets and the range of a droplet in the distribution, which can be determined by the randomness and uncertainty of the concepts. The degree of dispersion of the droplets is denoted by
He. This is the membership degree of a random variable, and reflects the thickness of the cloud. The representation method of the cloud model fully shows the randomness of qualitative language, so it is more objective.
3.1.1. Evaluation Scale of Cloud Model
In scheme evaluation,
n (generally odd) semantic evaluation scales are given for experts to evaluate each index in the scheme. The effective domain is U = [X
min, X
max] (generally set by experts). The generated
n clouds correspond to
n semantic scales one by one. If a middle cloud is denoted by
E0(
Ex0,
En0,
He0), then the adjacent clouds can be defined as, respectively,
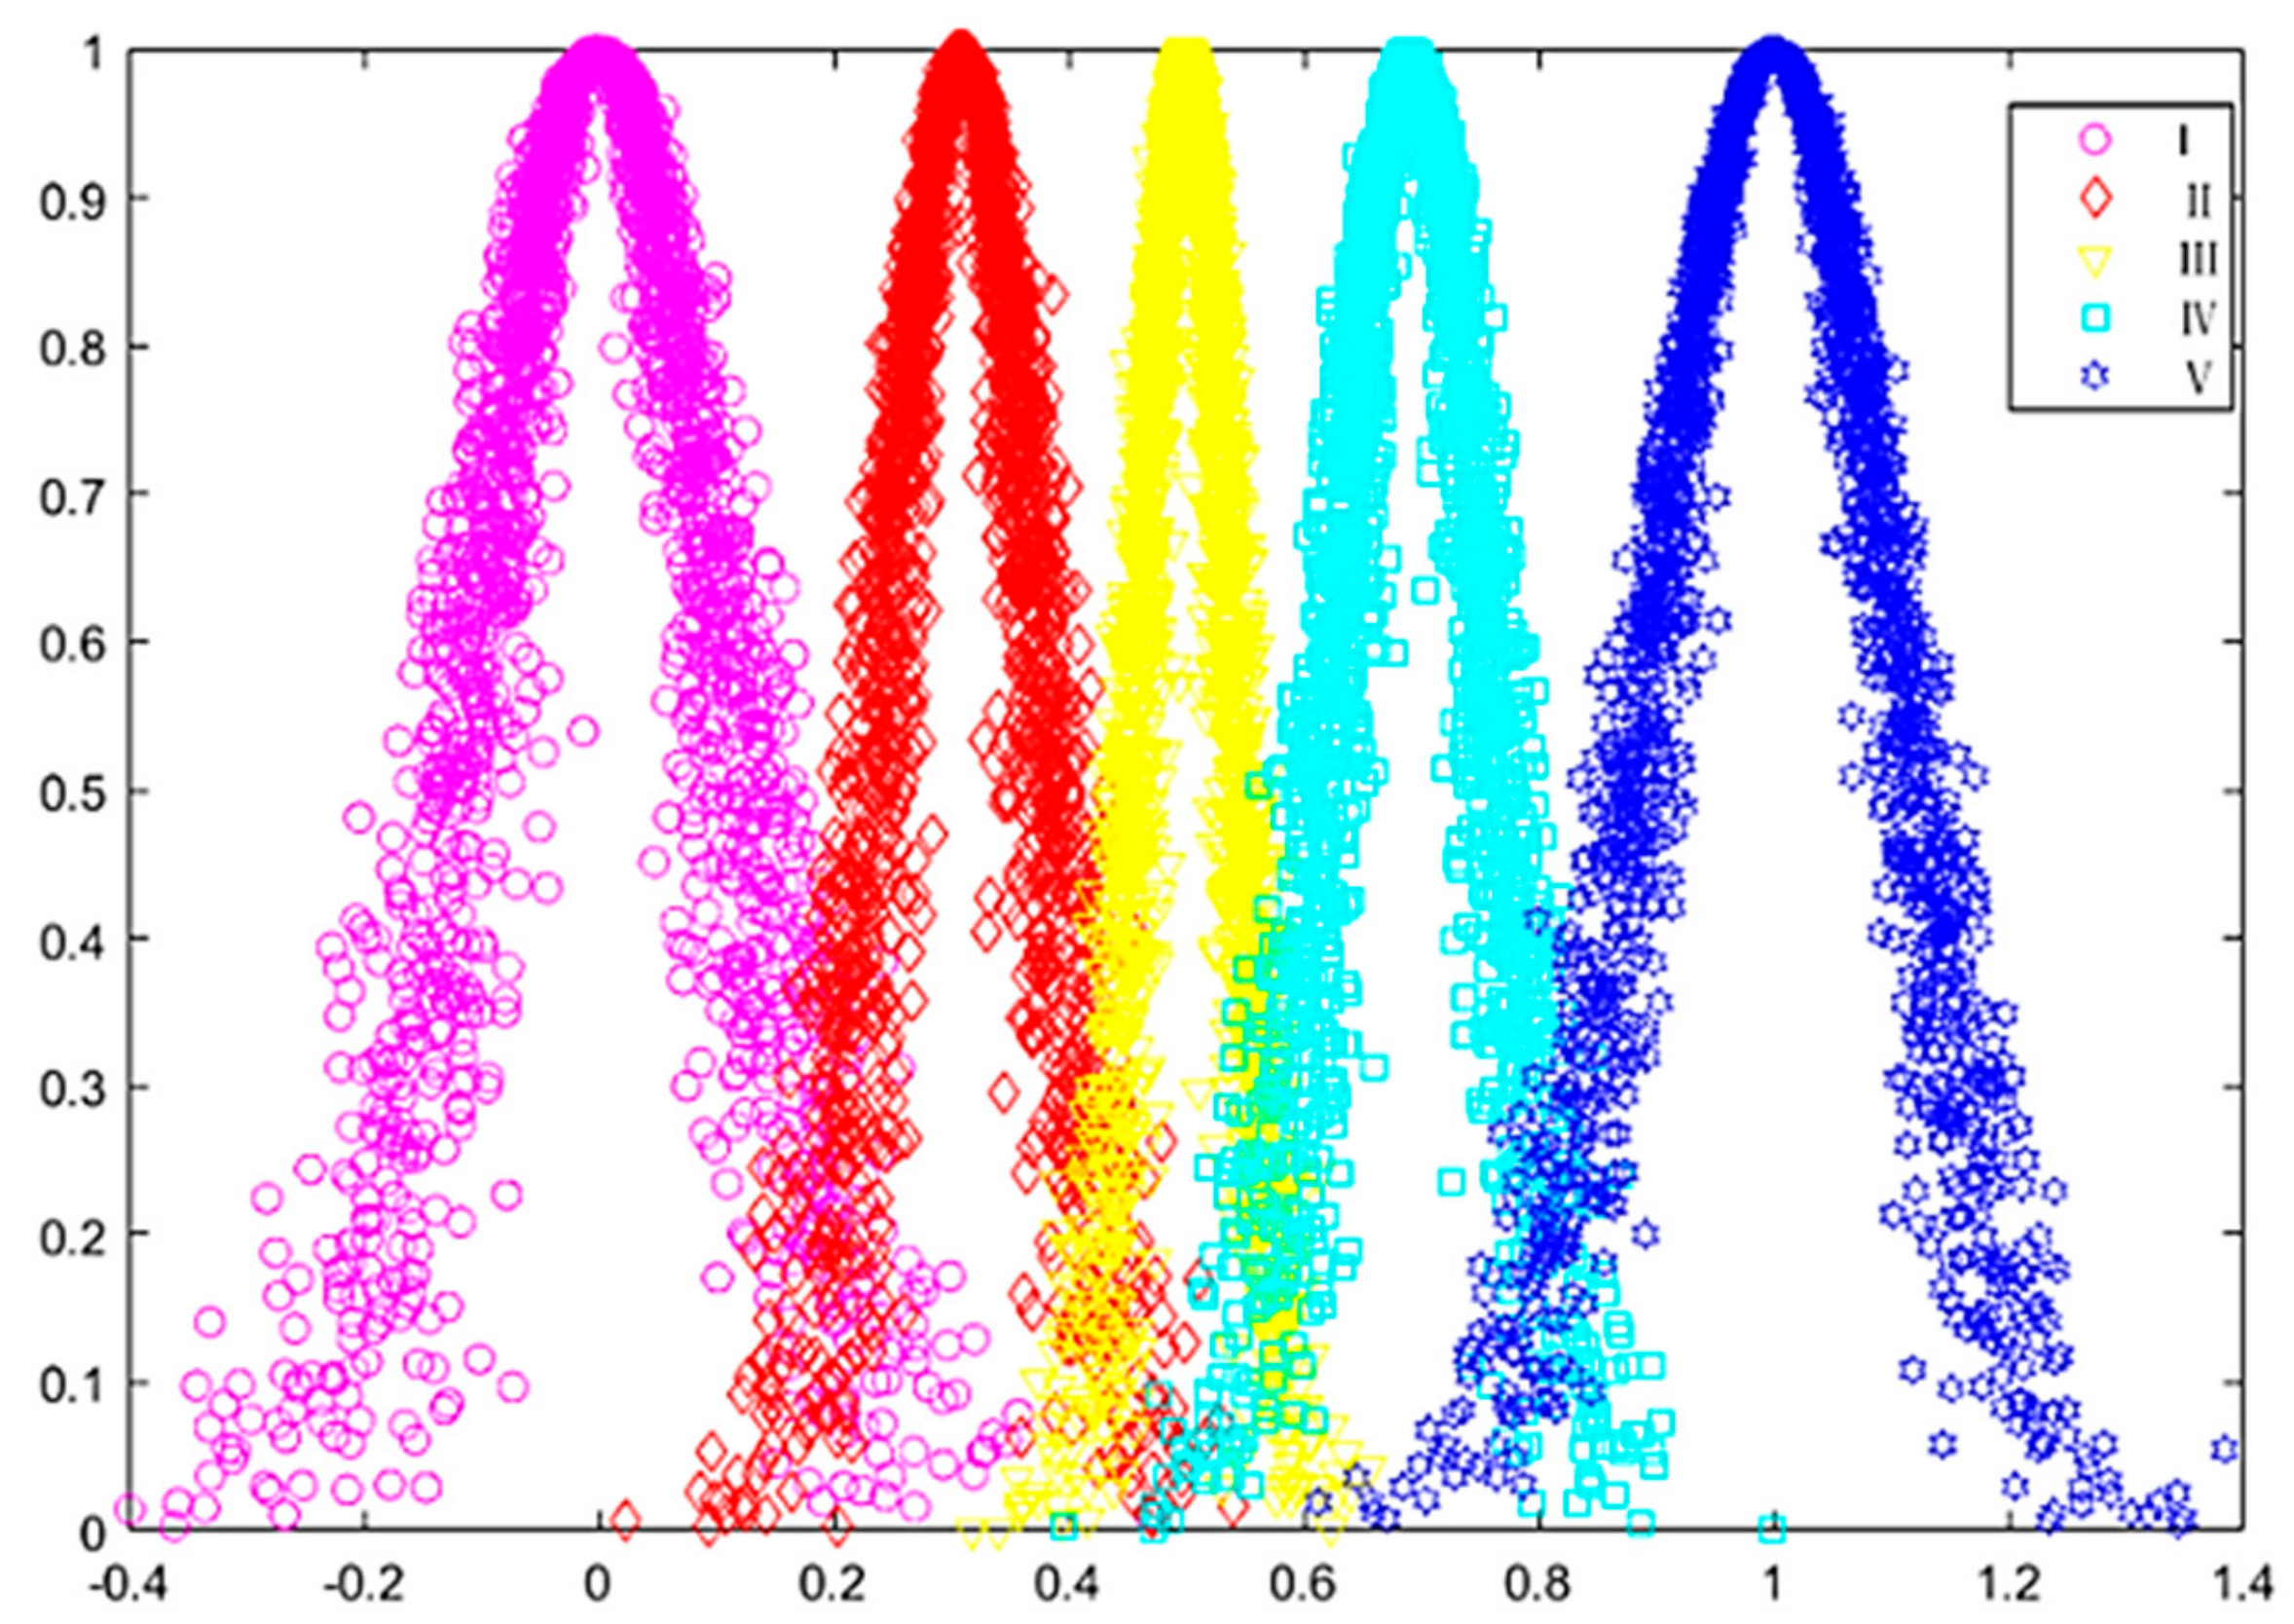
Generally, we generate five clouds by the golden section method, and, according to expert evaluation, we select [X
min, X
max] as [0,1], and
He0 = 0.05. For a given
He0,
He−1 =
He1 =
He0/0.618. The method for calculating the numerical characteristics of a cloud is shown in
Table 2. The calculated cloud evaluation scale is as follows: excellent
E2(1, 0.103, 0.016), good
E1(0.691, 0.064, 0.016), medium
E0(0.5, 0.039, 0.01), poor
E−1(0.309, 0.064, 0.016), and very poor
E−2(0, 0.103, 0.026).
Figure 1 shows the five clouds used in the cloud evaluation model.
3.1.2. Cloud Integration
According to the steps above, we determine that each expert’s linguistic assessment has
n fundamental clouds, i.e.,
where
n is the number of experts. These basic clouds can generate a floating cloud. If the generated floating cloud can be represented as
, then:
In the above equation,
ωi,
i = 1, 2,⋯,
n denotes the corresponding indicator weight. When the weight values of each cloud model are equal, that is,
ωn = 1/
n,
, then the integrated cloud is:
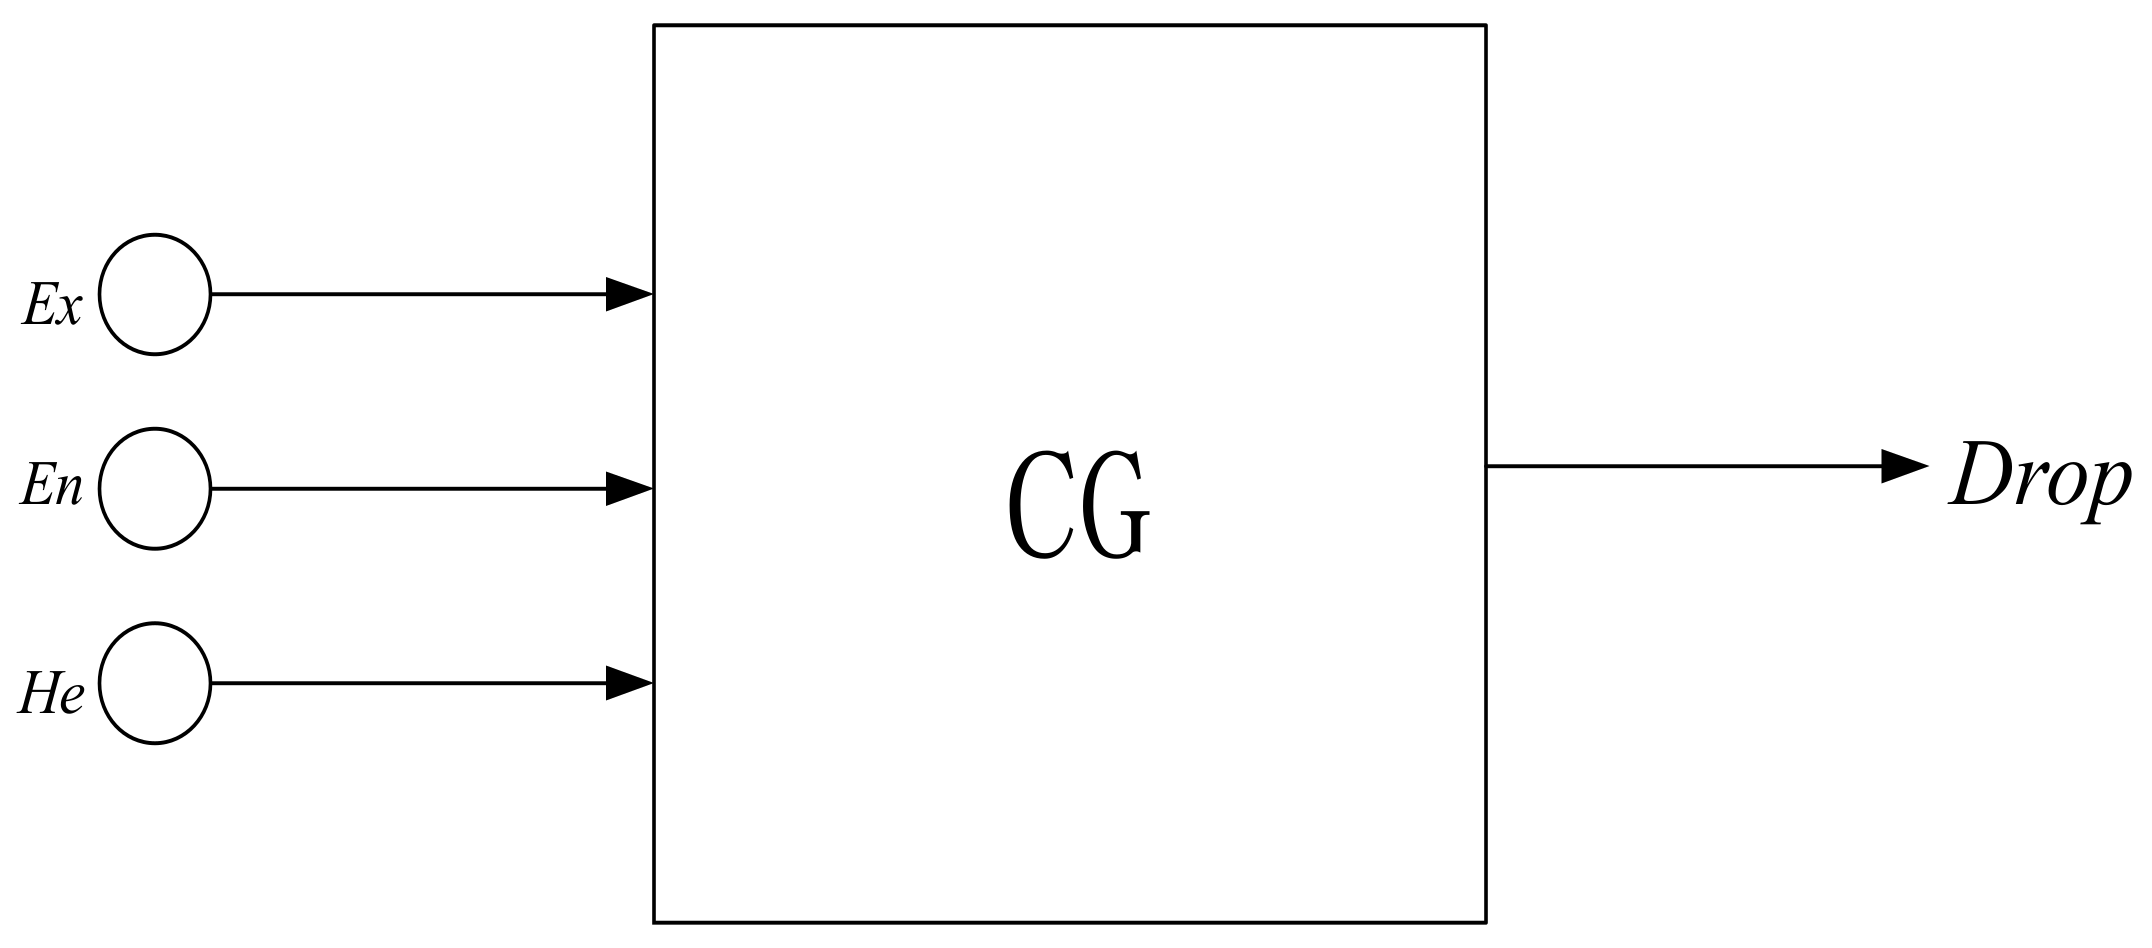
3.1.3. The Positive Cloud Generator
The cloud generator is a cloud generation algorithm that is implemented in software. Cloud generators can reveal the relationship between qualitative concepts and quantitative characteristics, which including two common types: forward and backward cloud generators. The processes of the positive cloud generator is shown in
Figure 2.
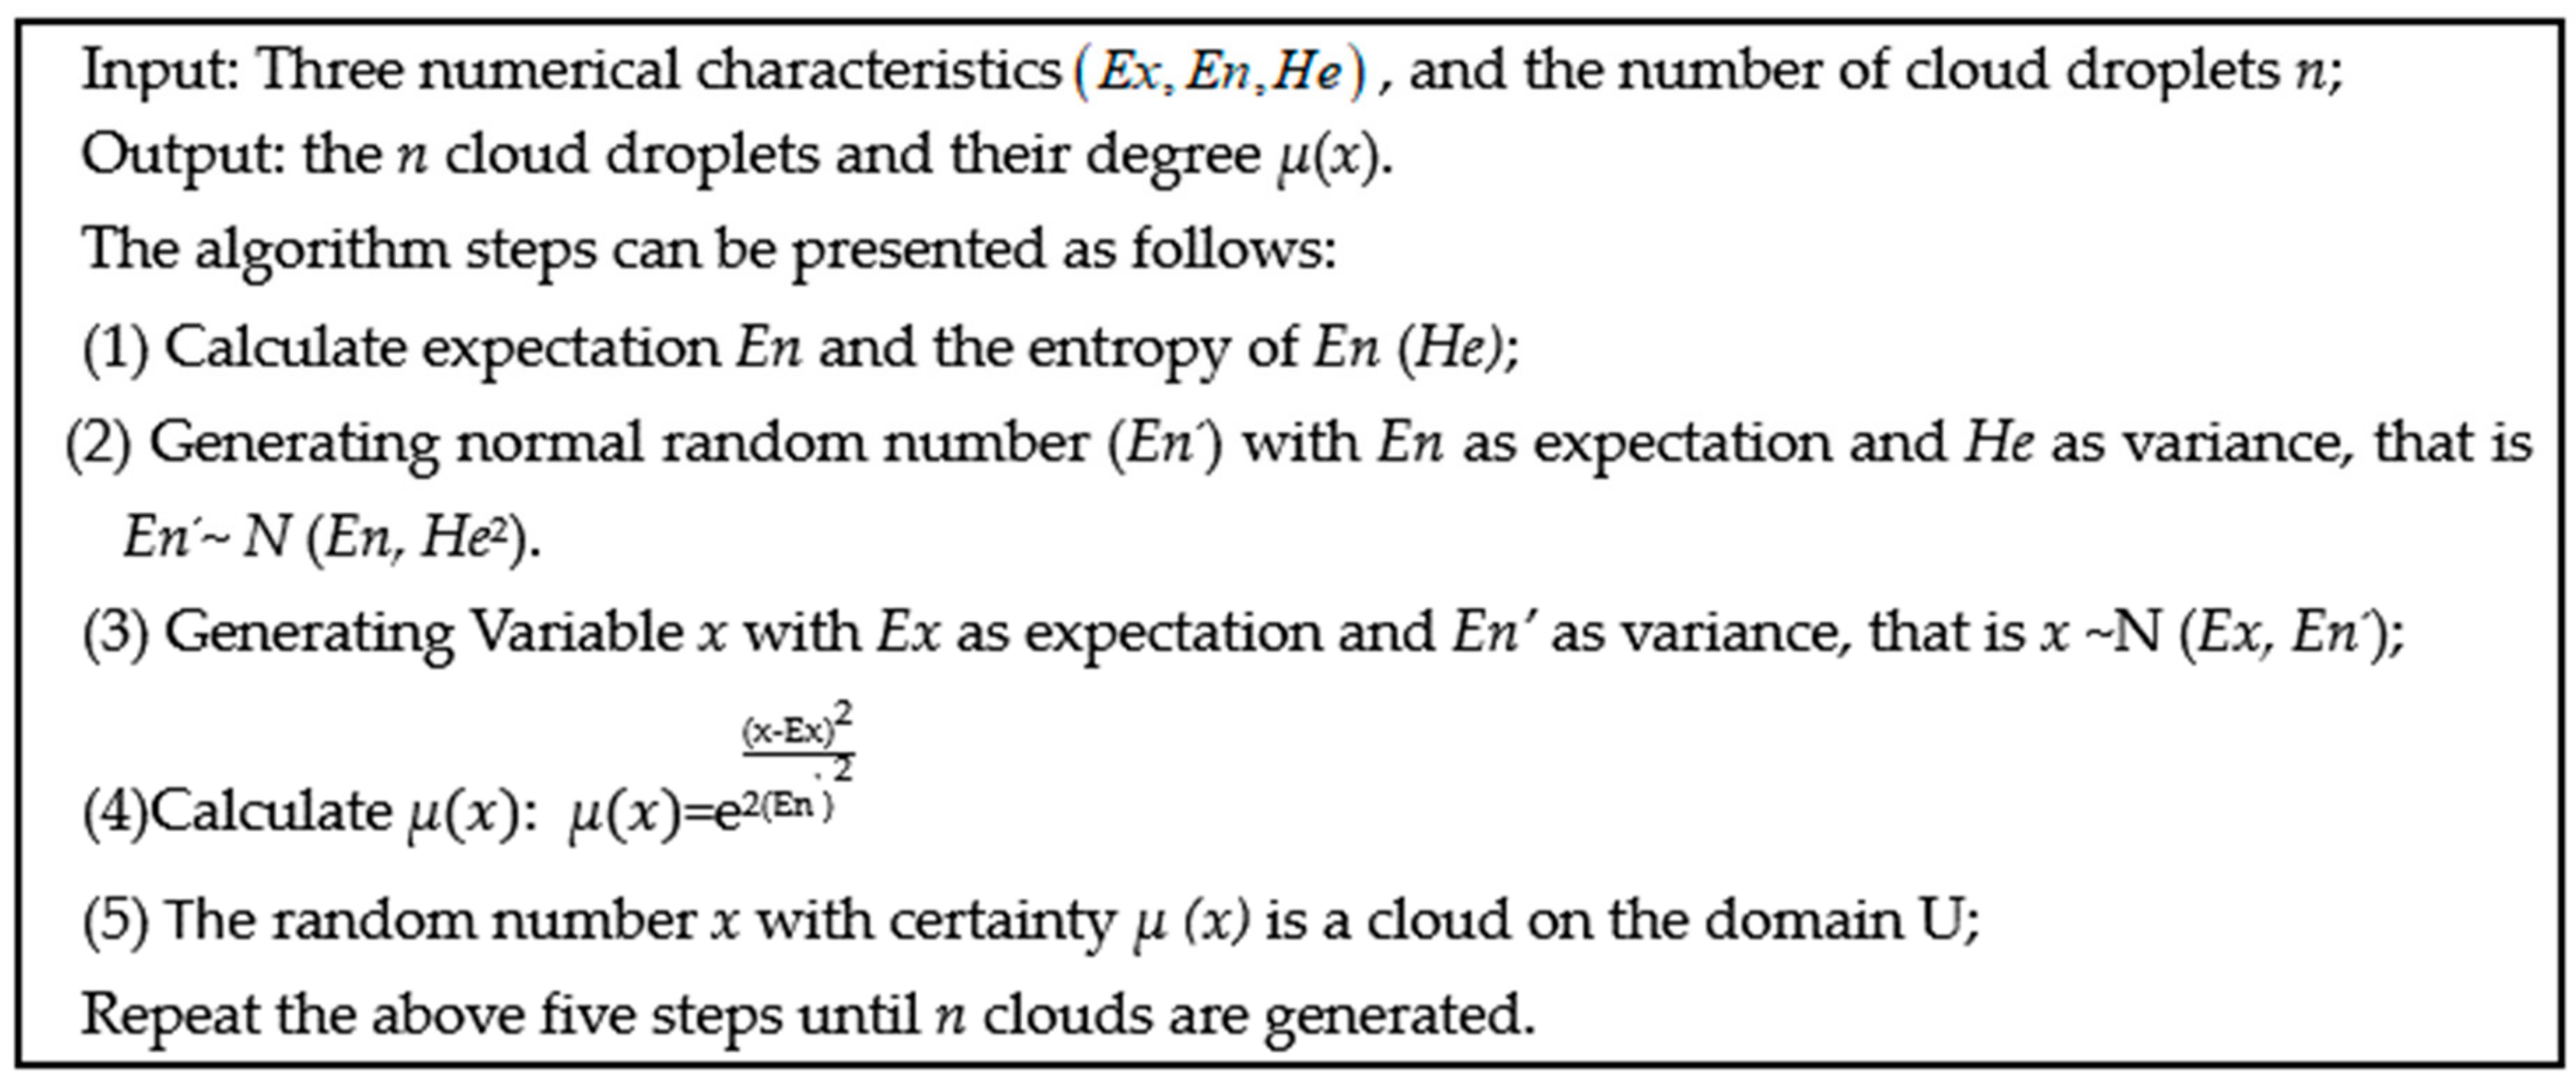
Specifically, the forward cloud generator makes it easier to transform qualitative concepts into quantitative features. The backward cloud generator can also transform the quantitative characteristic into a qualitative concept. Using generators, the required cloud drops can be produced. The algorithm flow of the positive cloud generator is shown in
Figure 3.
3.1.4. Measurement of Cloud Distance
Cloud distance refers to the distance between two clouds. The specific steps of this algorithm are as follows:
- (1)
Input the eigenvalues E1 (Ex1,En1,He1), E2(Ex2,En2,He2) and cloud drop number n of the two clouds;
- (2)
The two clouds generate n cloud droplets respectively through the positive cloud generator.
- (3)
Arrange each cloud drop from small to large in abscissa;
- (4)
Screen the cloud drops and keep them falling in the range of ;
- (5)
Set the number of cloud drops of the two clouds after screening to n1 and n2 respectively. Suppose n1 > n2 randomly select n2 cloud drops from n1 cloud drops of the first cloud, then sort the cloud drops from small to large in abscissa, and keep them in the set Drop1 and Drop2; if n1 < n2, do the opposite;
- (6)
Calculate the distance between each cloud drop (
x, (
x)) in drop1 and drop2 in corresponding order;
- (7)
Output the distance D (E1, E2) between two clouds.
The algorithm fully considers the randomness of the cloud model, and its calculation results also reflect that when the super entropy of the two clouds is large, the distance between the two clouds is also greater.
3.2. Determine the Evaluation Index Weights
In 1948, the American mathematician Shannon first applied cloud models in information theory, using them as a measure of the uncertainty between things and problems [
65]. In information theory, entropy can quantitatively express the disorder and effectiveness of a system. Any information has redundancy, and its size is related to the probability or uncertainty of each symbol in the information. The entropy method is a method to give weight to the evaluation index objectively. It determines the weight of each index by the information provided by the observation value of the index [
66]. This method can help prevent human factors from influencing the weights of evaluation indices, meaning that the evaluation results are reasonable.
To obtain an index weighting that comprehensively captures subjective and objective factors, the cloud model and entropy weighting method were employed, as in the following steps.
Step 1: Let
Eij(
Exij,
Enij,
Heij) be the evaluation value of the
j-th
index in the
i-th
enterprise, where
represents the distance between the evaluation value and the ideal. The larger
is, the less similar the two clouds are. The judgment matrix
=
composed of
m evaluation schemes and
n evaluation indices is established. Next, transform it into the distance measure matrix
:
where
n is the number of indices and
m is the number of enterprises.
(2) Due to the differences in properties and units of evaluation indices, it is necessary to standardize matrix
D to obtain dimensionless index matrix
:
(3) The entropy of the
j-th evaluation indices is:
In Formula (6), is Boltzmann’s constant, where entropy guarantees that 0 ≤ ≤ 1.
(4) Get the initial weight of each indicator by the above entropy:
3.3. Using the Cloud Model—Applying the DEMATEL Method to Modify the Weighting
The DEMATEL method is a method for visualizing the relationships between factors in an understandable way. It can transform the causal relationship between factors into a comprehensive model to assist in decision-making processes. In general, when using the DEMATEL method to estimate the relationship between factors, the following steps are included: measure the strength and direction between factors; construct and normalize an initial direct relationship matrix; determine the overall relationship matrix and the importance and weights of factors.
However, there are different aspects of uncertainty in complex decision-making processes, including the formalization of qualitative or quantitative standards and the preferences of decision makers. In this sense, the analysis approach of the DEMATEL method is more comprehensive. Therefore, we use this method to analyze the direct and indirect effects of various influencing factors. Moreover, the cloud model is employed to represent and address fuzzy linguistic information, and the DEMATEL method is employed to analyze the relationships among indicators and to calculate the weights.
The specific analysis steps are as follows:
- (1)
Construct the initial direct relation matrix. Suppose that
K experts are asked to indicate the direct influences among
j-th factors
, then determine the relationship among all evaluation factors in this system and establish an assessment standard. To facilitate evaluation, influence was divided into five levels, which are represented by five symbols (I, II, III, IV, and V, respectively). The original evaluation number is then converted into a cloud evaluation value. Levels of influence are determined based on the expert evaluation. Then, five symbols are converted into cloud evaluation values (
Table 3).
- (2)
According to the results of the questionnaire, the relationships among all of the factors that involved green innovation are derived, and the direct relationship matrix
of each expert is modeled as follows:
where
represents the evaluation cloud of the
k-th expert on the relationship between evaluation indicators, and the diagonal elements of the evaluation matrix are all zero. Then, we aggregate the qualitative evaluation results of decision makers using Equation (12), and the initial direct relation matrix can be obtained:
- (3)
In this study, the cloud evaluation scale
(0,0.103,0.026) is used as the evaluation value of the reference cloud to calculate the distance between each indicator and the benchmark cloud: the greater the cloud distance, the greater the influence. The cloud distance measurement matrix is obtained by (13):
- (4)
Using (14) and (15) to normalize the matrix
, a standardized direct relation matrix is obtained:
- (5)
We calculate the direct/indirect influence matrix, which reflects the interaction between matrix elements, and the total relation matrix
T can be expressed as:
- (6)
Calculate the average of the matrix
T and use it as a threshold
t [
67,
68,
69]. Only the value greater than the threshold value in the
T matrix is retained, and the factor less than the threshold value is set to 0. Accordingly, matrix
is obtained.
- (7)
Find the sum of rows
Rj and columns
Cj of the matrix
. The importance of each factor is as follows:
where
Rj is the sum of influences of
Fj on other factors and
Cj is the total influences of other factors on
Fj. In addition,
Rj +
Cj shows the importance of the factor
Fj to the system. In contrast,
Rj − Cj represents the net effect of the factor
Fj on the system.
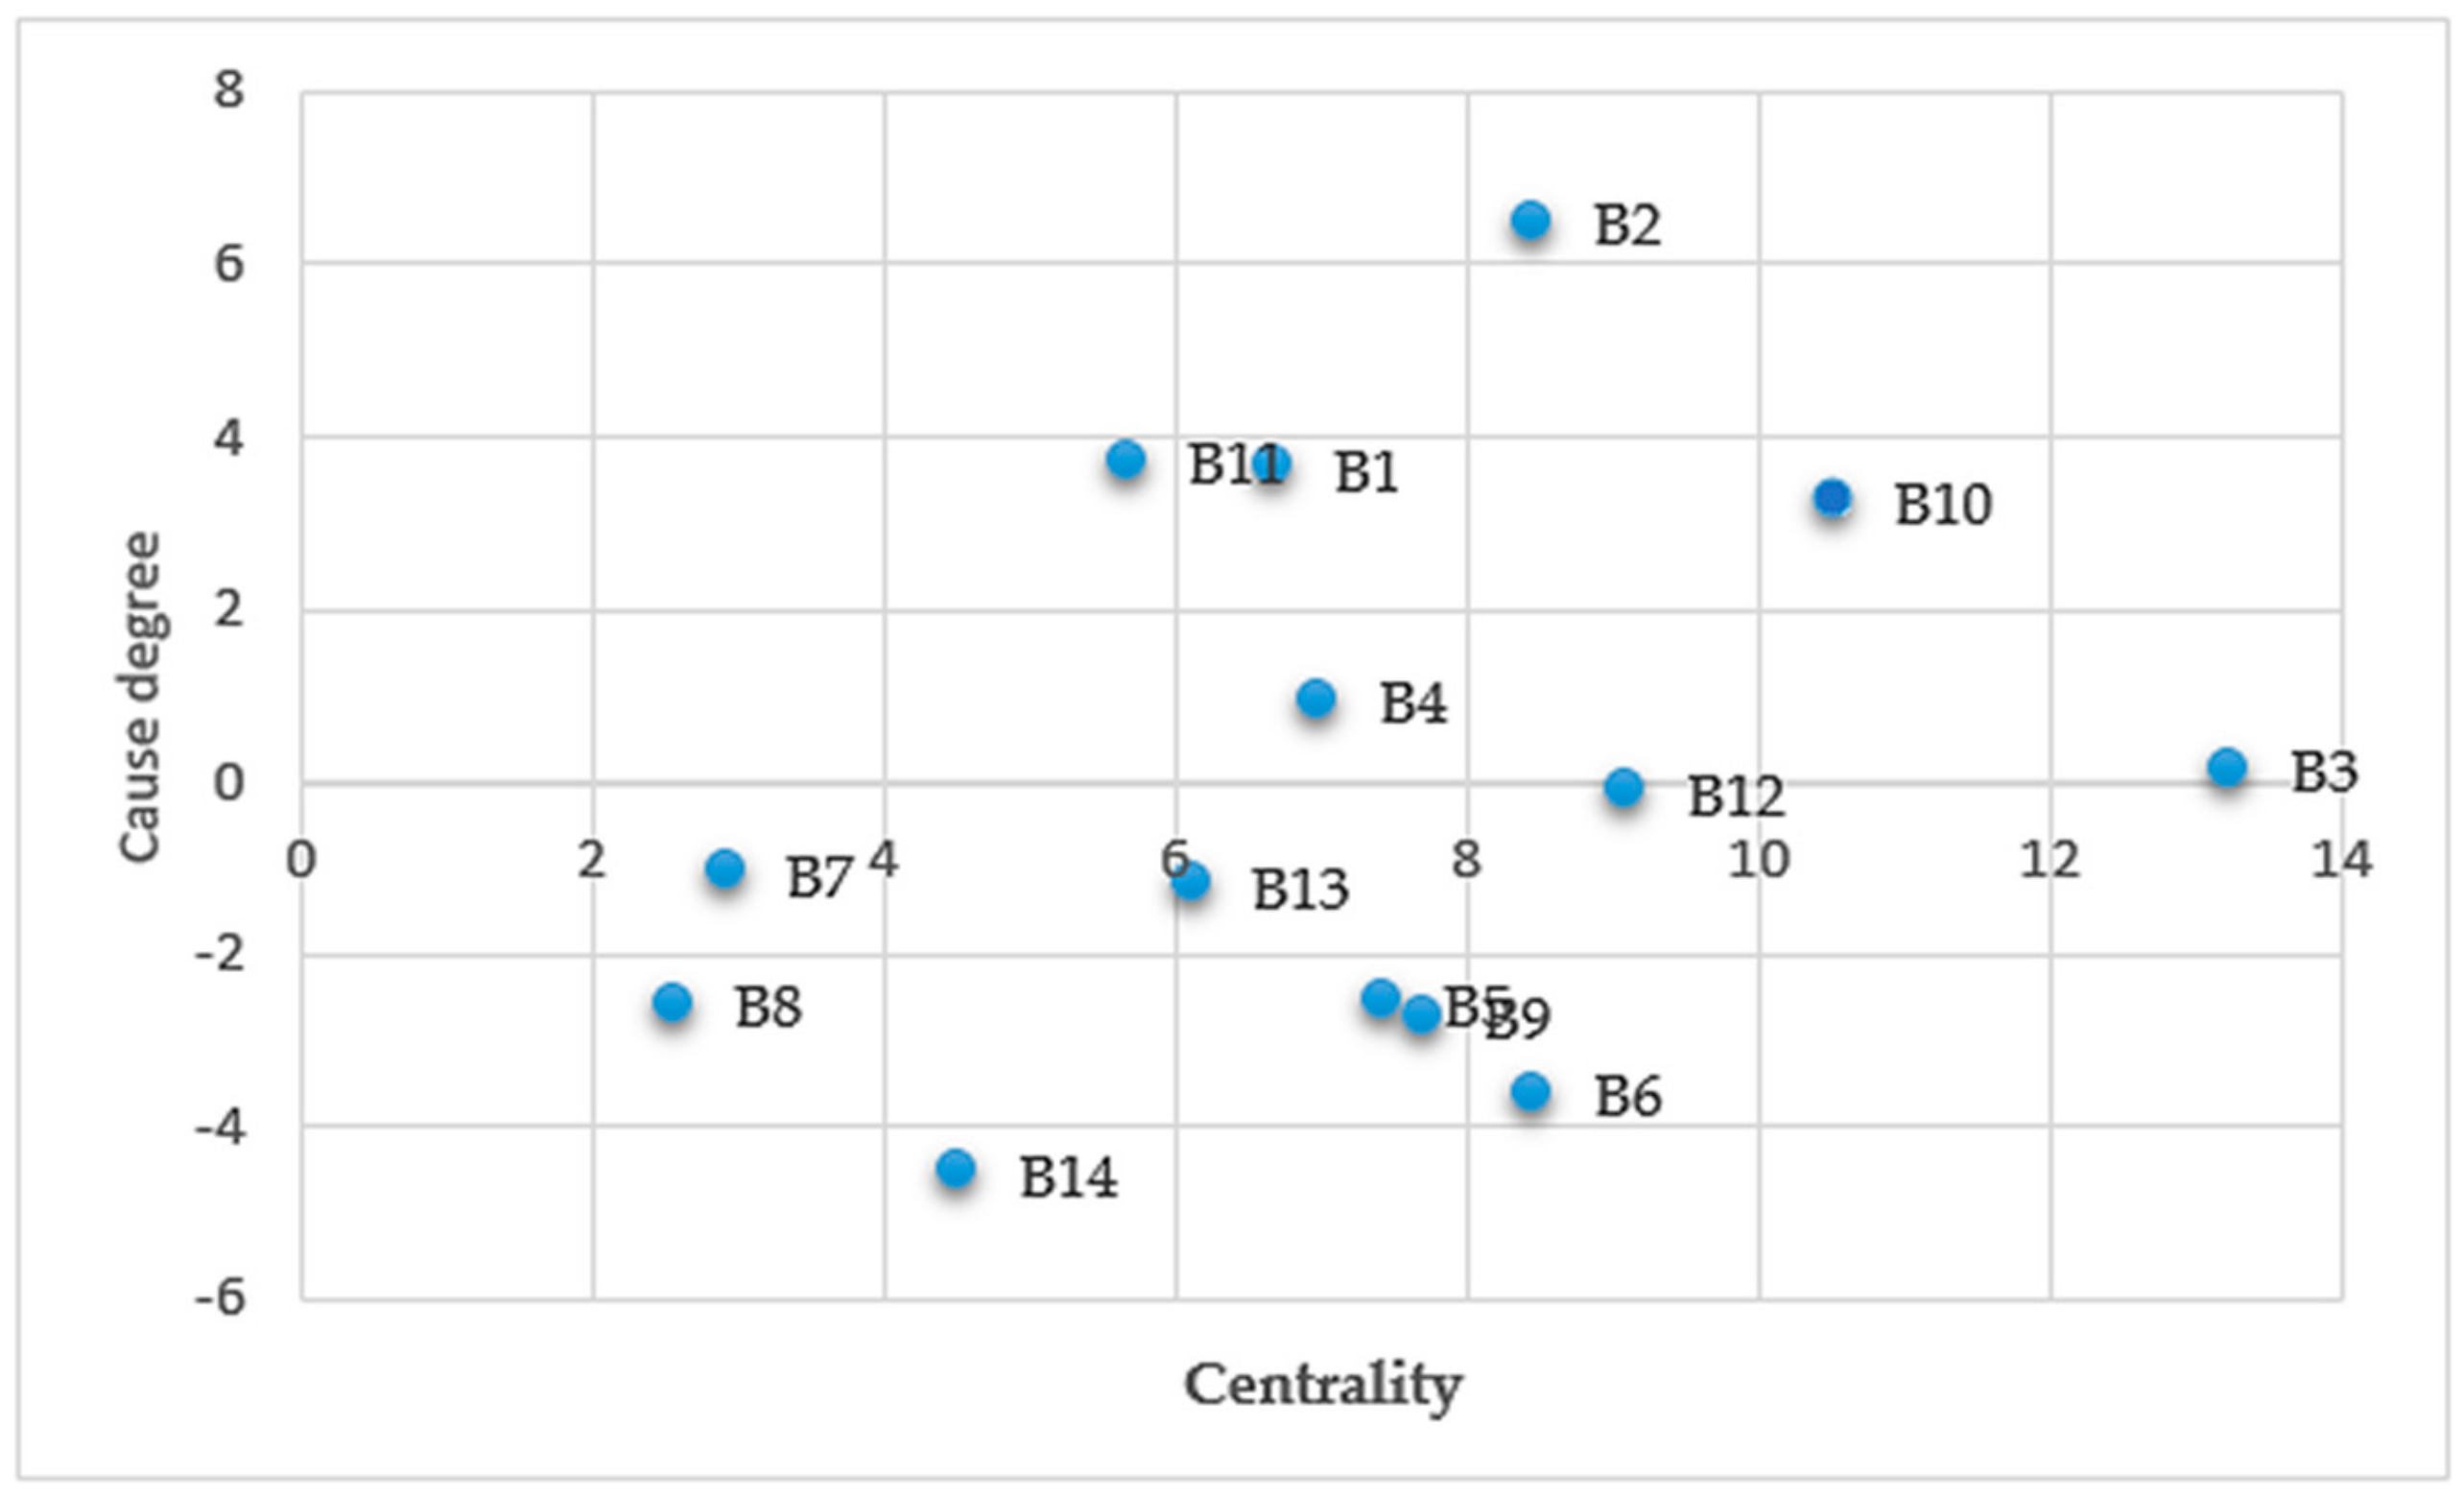
- (8)
Draw the causality graph, which takes the center degree of each factor as the abscissa and the cause degree Rj − Cj as the ordinate.
- (9)
The relative importance of each factor is as follows:
- (10)
We then determine the combined weights of the evaluation indices
for the assessment of green innovation ability of manufacturing companies based on the DEMATEL and entropy weighting methods. The combined weights
of the evaluation criteria can be determined by integrating the weight of DEMATEL
and entropy weighting
methods:
where
is the combined coefficient.
3.4. Cloud Model and Grey Relation Analysis Method
Grey relational analysis is a method for solving the multicriteria decision-making (MCDM) problem with multiple attributes in uncertain situations. In the analysis, an ideal solution is required, and we can judge the pros and cons of the scheme by comparing the correlation between each scheme and the ideal solution. The greater the degree of relevance, the closer the scheme is to the ideal solution, and the better the scheme is evaluated. In this paper, by calculating the distance and the grey correlation between the cloud evaluation value of each enterprise and the ideal cloud evaluation value, we can more intuitively compare enterprise performance. Grey relation analysis comprises three steps: the normalization of data, calculation of the relationship coefficient, and the grey relational degree.
- Step 1.
Generate the ideal solution.
Let Mi = [Ei1, Ei2,…, Ein] represent the integrated evaluation value of all experts for i (i = 1, 2,…, m) enterprises. We find the ideal solution in the matrix A0 = [E01, E02,…, E0n], where E0j(1,0.103,0.016) is the reference of the j-th evaluation index, which is the maximum value of each evaluation index.
- Step 2.
Calculate the grey relational coefficient
of indices using Equations (20)–(23).
where
ρ is the resolution coefficient and indicates the importance of
. The smaller
ρ is, the higher its distinguish ability.
is the distance between the cloud assessment value and the ideal value. In most situations,
, because the value usually provides good discrimination.
- Step 3.
Calculating grey correlation degree .
The grey correlation coefficient can be obtained by summing up the grey correlation coefficient
using Equation (24):
where
is the weight of j-th evaluation index, and
γi is the grey relational degree, which represents the magnitude of the measured correlation between the reference and comparison sequences. Moreover, the cloud evaluation value of the enterprise with the highest relational degree is the best solution. Therefore, when
γi is larger, the cloud evaluation value of the enterprise and the ideal value are highly related. In contrast, when
γi is lower, these two values are less related.


