Article

Nitrogen Pulse and Competition Affects Nitrogen Metabolism in Invasive Weed (Amaranthus retroflexus) and Native Crop (Glycine max)

1
College of Resources and Environment, Northeast Agricultural University, Harbin 150030, China
2
Julius Kühn-Institut (JKI), Federal Research Centre for Cultivated Plants, Inst. for Strategies and Technology Assessment, 14532 Kleinmachnow, Germany
3
School of Environment, Northeast Normal University, Changchun 130117, China
4
Department of forestry engineering, Zhalantun Vocational College, Zhalantun 162650, China
*
Author to whom correspondence should be addressed.
Sustainability 2020, 12(3), 772; https://doi.org/10.3390/su12030772
Submission received: 11 November 2019 / Revised: 16 January 2020 / Accepted: 18 January 2020 / Published: 21 January 2020
(This article belongs to the Section Sustainable Agriculture)

Abstract

:
Nitrogen (N) pulse is a frequent event in agroecosystems caused by fertilization. Understanding the responses of nitrogen metabolisms in native crops and invasive weeds to N pulses is essential in investigating the invasive mechanism of invasive weeds. A pot experiment was carried out to study the impacts of N pulse and the interspecific competition on nitrogen metabolism of an invasive weed (Amaranthus retroflexus) and a native crop (Glycine max); the plants were applied with an equal amount of N in three N pulse treatments, i.e., sole-summit treatment (SS) with N only applied on the seeding date, double-summit treatment (DS) with twice N applied (the fertilizer was applied on both the seeding date and the flowering date), and no-summit treatment (NS) in which N was applied evenly during the experiment. The results showed that A. retroflexus increased the nitrate reductase (NR) activity more than G. max (except for the roots) in the early growing stage, and increased the glutamine synthetase (GS) and glutamate dehydrogenase (GDH) activities in stem more than G. max in SS and DS treatments during the last two growing stages, however, the advantages were far weaker in the NS treatment. Interspecific competition had negative effects on the nitrogen metabolism of the two species among most of the sample times, and the effects of interspecific competition exerted a tissue-specific influence on nitrogen metabolism in the two species. A. retroflexus switched to reproductive growth earlier in SS treatment than in the DS and NS treatments when it was grown in mixed planting, and its height was the lowest in the NS treatment, so the competitive ability of A. retroflexus was higher in the SS and DS treatments than in the NS treatment, while SS treatment was the common application method of N fertilizer in the G. max farmland in China. Thus, the results of this study suggest that, if the farmer changed the N fertilizer application mode to a constant multiple fertilization mode, the competitive capacity of A. retroflexus will be reduced.

1. Introduction

Numerous ecosystems go through resource pulses. Resource pulses are incidents of increased available resources in space and time and are large sized, low in frequency, short-time lasting, and put stress on the impacts of spatiotemporal resource pulses on the interactions of the resource-consumers [1]. While resource pulses are recognized as unusual phenomena for consumers in specific systems, they are common in nature [2]. Resource pulses are also prevailing in agro-ecosystems, and the frequency and extent of resource pulses occurring in the agro-ecosystem are greater compared to those in natural ecosystems, including applying fertilizer, irrigating, weeding, and shifting of crops. Researches in a great variety of natural systems have been done to study how resource pulses affect ecological processes in recent years [3,4,5,6,7,8], while few researches have been done on resource pulses in agro-ecosystems.
In China, nearly 60% of the total exotic species were distributed in farmlands [9]. In the farmland, the exotic weed would undergo intense and various pulses caused by the agricultural activities, and the exotic weed could be well-suited to the pulses conditions of agro-ecosystems [10]; thus, exploring the eco-physiological responses of the invasive weed to resource pulses will contribute considerably to our understanding of the invasive mechanisms of the exotic weed. While many scientists have studied the reasons for the successful invasion of exotic weeds [11,12,13,14], few researches have been done to reveal the eco-physiological adaptive mechanism of invasive weeds to resource fluctuations in farmlands [15], and few have considered the different adaptive mechanisms between exotic weed and native crop.
The fluctuating resource availability hypothesis (FRAH) is one of the well-known hypothesis to explain the invasive mechanism, which states that invasive plants were better able to take advantage of resource fluctuations or pulse conditions than native plants [16,17]. Parepa et al. [18] found that the biomass of the invasive plant was greater in fluctuating resource conditions (such as one large nutrient supply or multiple nutrient supply) than that in the stable condition (such as the nutrient was supplied evenly during the experiment period). Liu et al. [19] reported that invasive plants showed higher leaf nitrogen content in variable fertilizer supply conditions than native plants in uniform fertilizer supply conditions.
In order to enhance the crop yield, nitrogen fertilizer is commonly applied in cropland [20], and different nitrogen fertilization strategies had different impacts on the nitrogen metabolism of the crop [21] and weed [22], however, how nitrogen pulses impact the nitrogen metabolism of native crop and invasive weed is still undefined. The research on the responses of enzymes activities related to N metabolism to different nitrogen pulses strategies would contribute to our understanding of the exotic weed invasive mechanisms in agro-ecosystem.
In higher plants, nitrate reductase (NR), glutamine synthetase /glutamate synthase (GS/GODAT), and glutamate dehydrogenase (GDH) are the major enzymes of nitrogen metabolism. NR catalyzes the reduction of NO3 to NO2, usually playing an important role in nitrogen nutrition or metabolism [23]. NR is a substrate inducible enzyme, which is strongly affected by plant growth conditions [24]. Afterwards, NH4+ derived from NO3 reduction is converted to glutamate via GS/GOGAT or GDH pathways. GS /GOGAT cycle is the main pathway to assimilate ammonia, while GDH activity may be enhanced by ammonium with a toxic amount in stressful environments, when the GS/GOGAT cycle is not totally effective [25].
To investigate the effects of N pulses on the nitrogen metabolism of invasive weed and native crops, an experiment was conducted with Amaranthus retroflexus and Glycine max. Amaranthus retroflexus is a major invasive weed occurring in the G. max field in China [15,26], originating in South America [27], while G. max originates in North and central China [28], and G. max loss could achieve 22% due to the invasion of A. retroflexus [26]. In the current study, A. retroflexus and G. max were planted in either as pure or in mixture in Northern China. Based on FRAH, we hypothesize that (1) A. retroflexus would respond more rapidly (higher nitrate/ammonium or N metabolism enzymes activities) to the variable nitrogen supply than G. max when the two plant species were planted together, while the advantages would be weakened or would disappear in the stable nitrogen supply condition; and (2) A. retroflexus would have higher nitrate and ammonium contents or nitrogen metabolism enzyme activities in mixed culture than in pure culture in the variable nitrogen supply conditions, whereas G. max would show the opposite trend.

2. Materials and Methods

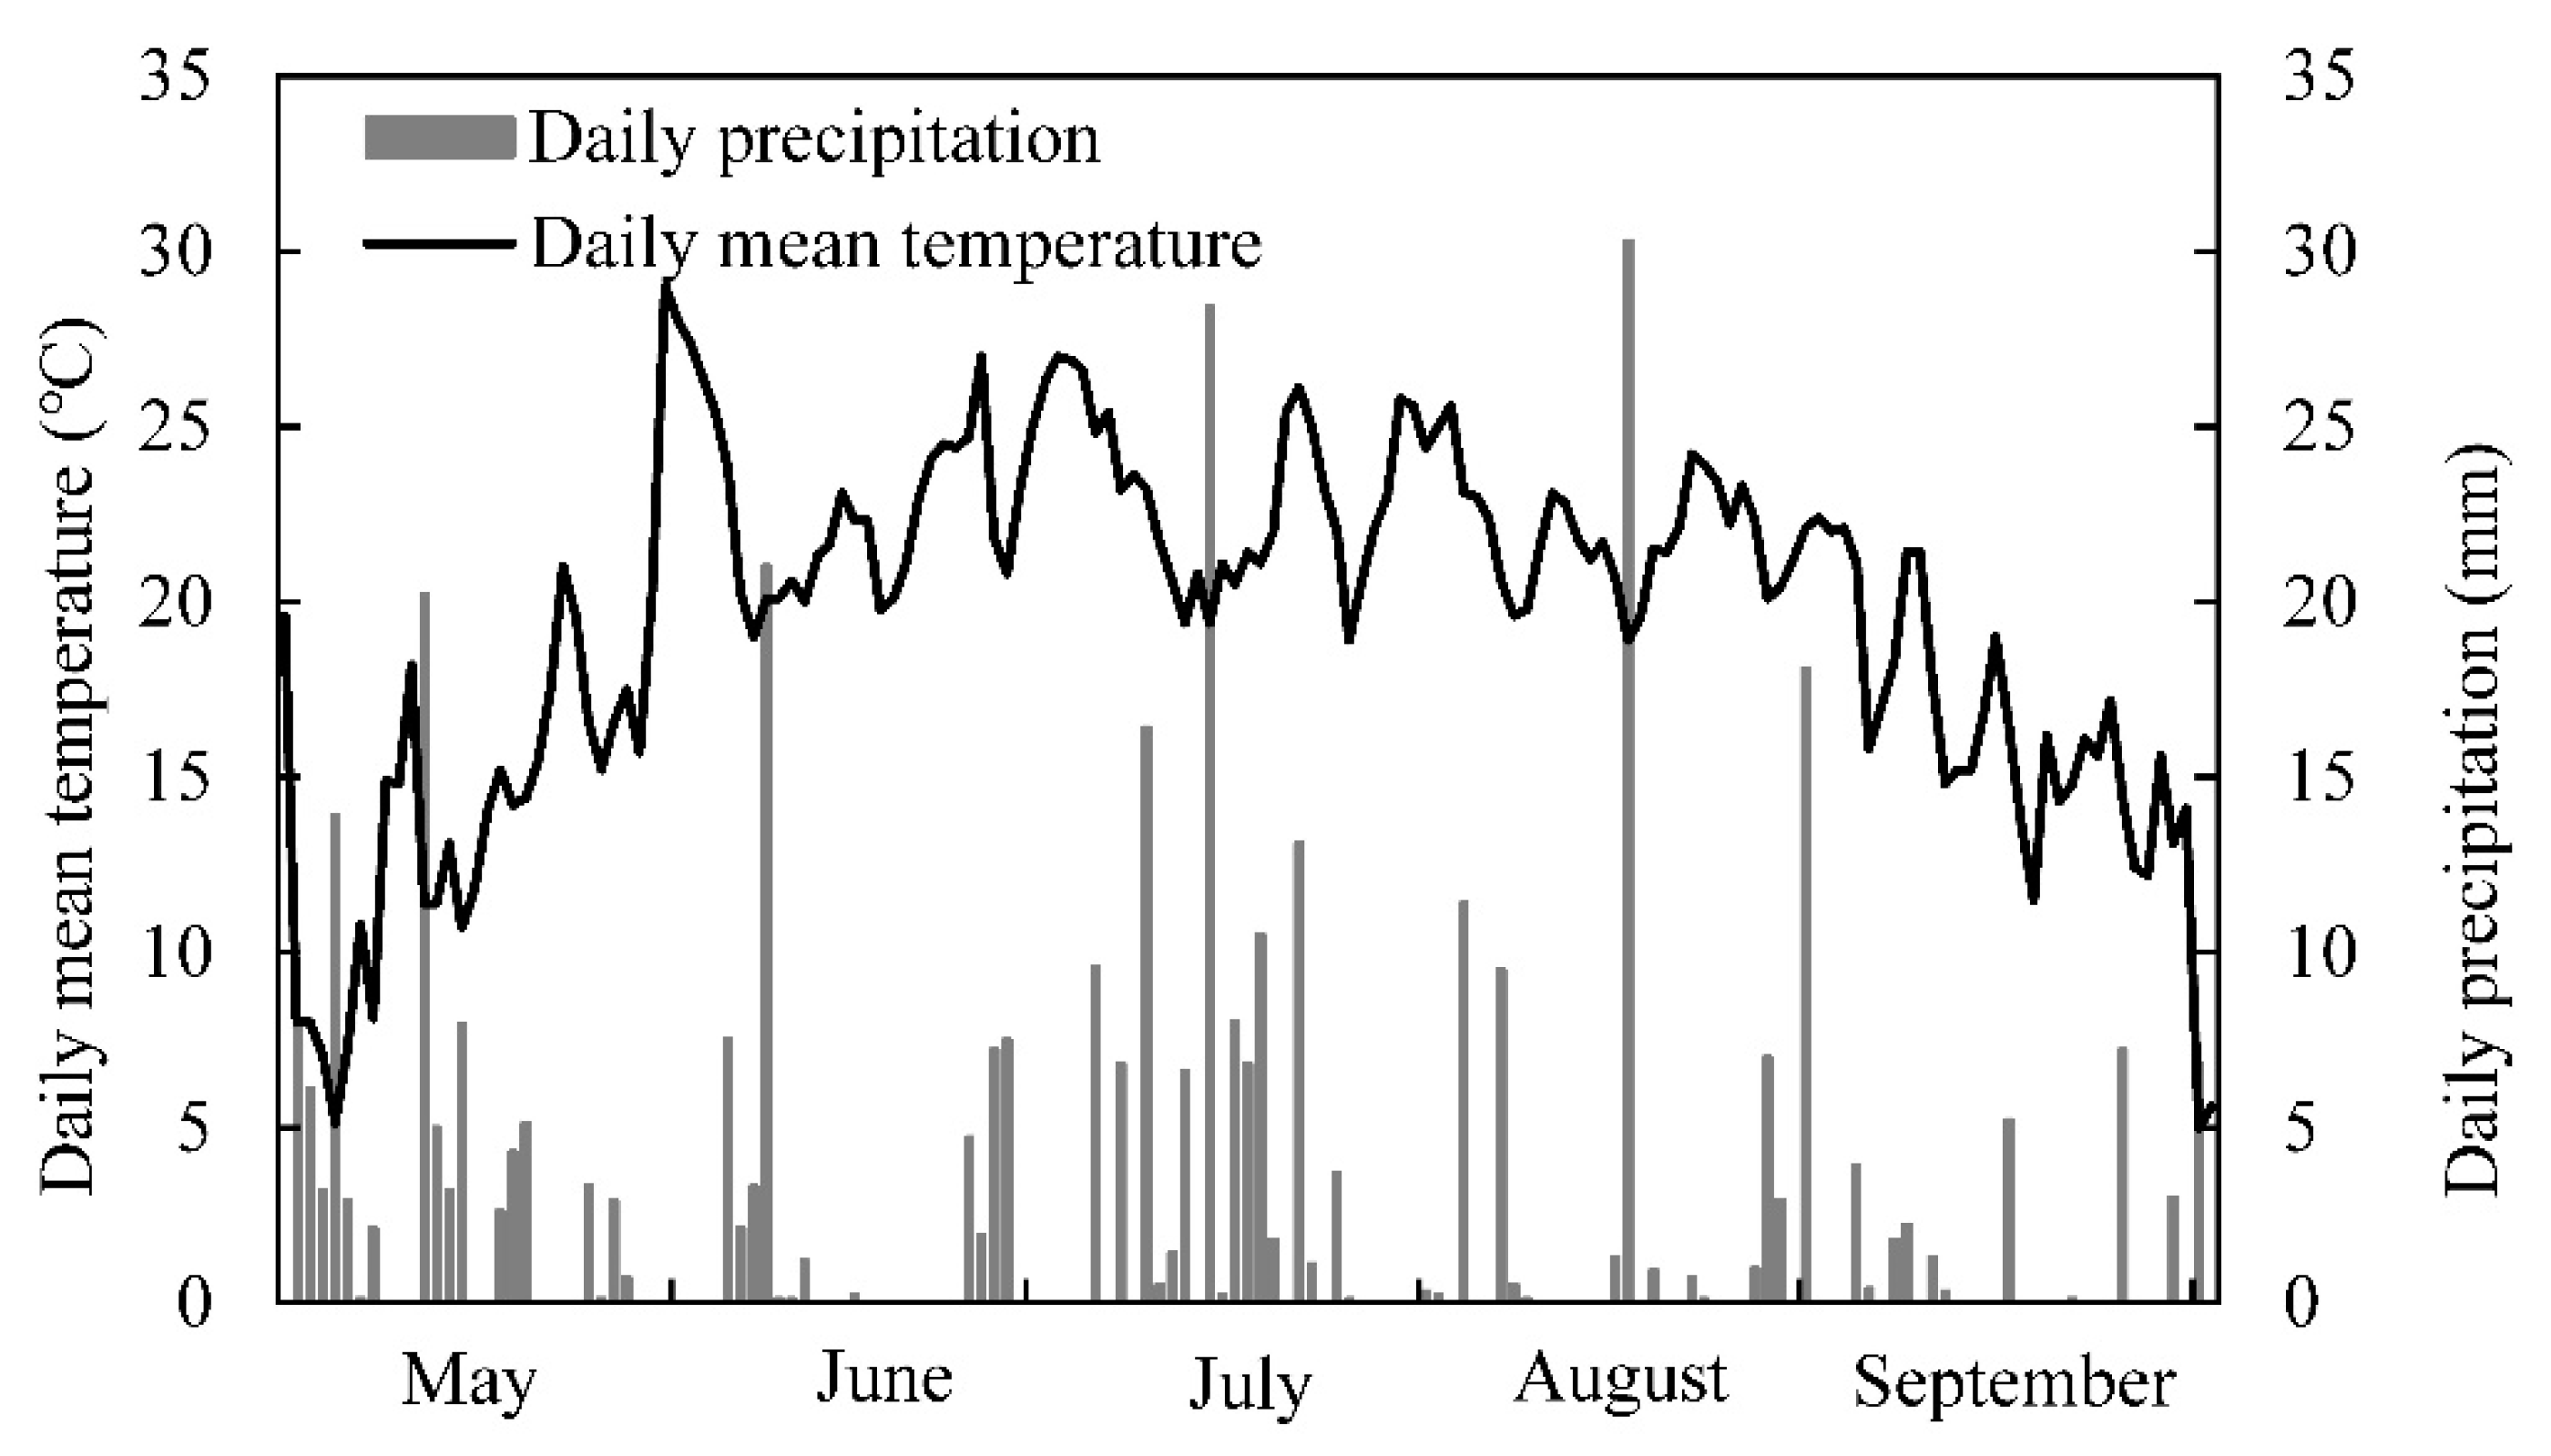
2.1. Experimental Design

The pot experiment was carried out at Northeast Agriculture University in Harbin, China (45°34′ N, 126°22′ E). At this site, the mean annual air temperature was 4.5 °C, with a mean annual precipitation at 590 mm, and the temperature range from −17.1 °C in January to 23.4 °C in July
(Heilongjiang Meteorological Bureau, China). The pots were placed in natural conditions, and the temperature and precipitation during the experiment are shown in Figure 1.
Invasive weed (Amaranthus retroflexus) and native crop (Glycine max) seeds were obtained in 2013 from the Xiangfang Experimental Station of Northeast Agriculture University. Seeds were planted into 30 cm deep, 30 cm diameter plastic pots filled with 12.75 kg black soil. The soil was a typical black loam with a soil organic matter of 2.31%, pH value of 7.57, and total nitrogen content of 0.015%. On 22 May 2014, 10 seeds of each plant species were planted, and after the emergence, seedlings were hand thinned to two plants/pot (pure planting (two A. retroflexus or G. max) or a mixed planting (one A. retroflexus with one G. max)).
The experiment was carried out in four replicate blocks in a two-factor complete random factorial design (N pulse and competition group). Treatments included three N fertilizer application treatments and three competition types. The three N fertilizer application treatments including a sole-summit treatment (SS) with N only applied on the seeding date (on 22 May 2014), a double-summit treatment (DS) with twice N application (the first fertilization was done on the seeding date (on 22 May 2014), the second fertilization was done on the flowering date (on 2 July 2014), and a no-summit treatment (NS) with N applied evenly over the duration of this research). The total amount of N fertilizer application was 50 kg·ha−1 for all the three N fertilizer application treatments. Three competition groups including two G. max, two A. retroflexus, and one A. retroflexus with one G. max. Each block comprised four replicates of each treatment to ensure sufficient samples for monthly destructive sampling. There were 16 pots for each type, and 324 pots in total. Each pot was applied with the same total amount of N fertilizer at 50 kg·ha−1, the applied rate was chosen to represent the usual N fertilizer rate in Northeast China G. max production. The nitrogen was administered as urea (CO(NH2)2) into pots at the rate of 50 kg·ha−1, calculated according to the internal surface area of the plastic pot. The phosphorus and potassium application rates were the same at the rate of 50 kg·ha−1, and were only fertilized once on the seeding date. In the SS treatment, every pot was received 0.5 L 26.22 mM urea solution and 0.5 L water on the seeding date, and received 1 L water every 10 days over the rest of the experiment period. In the DS treatment, every pot received 0.5 L 13.1 mM urea solution and 0.5 L water two times, the first fertilization was done on the seeding date, the second fertilization was done on the flowering date, and it received 1 L water every 10 days over the rest of the experiment period. In the no-summit treatment, every pot received 0.5 L 2.016 mM urea solution and 0.5 L water every 10 days from 22 May to 28 September 2014. All the pots were irrigated with 1 L water with a watering can if it did not rain on the rest days during the experiment period.

2.2. Plant Sampling

Plant sampling was taken three times, four replicates for each treatment every 30 days from 1 June to 29 August. After harvest, plants were divided into leaf, stem, root, and reproductive organs. The plant tissue samples were washed in distilled water and weight, and were then were placed into liquid nitrogen and stored at −80 °C.

2.3. Determination of Nitrate and Ammonium Contents

For a determination of NO3 and NH4+, 1 g fresh plant material was ground with 10 mL deionized water, and filtered to avoid the interference of chlorophyll pigment. NO3 content was analyzed using the salicylic acid method [29] and NH4+ content was analyzed using the Nessler reagent method [30].

2.4. NR Extraction and Activity Assays

For determination of the NR activities, the plant tissue was added to a 0.1 M potassium phosphate buffer (pH 7.5) consisting of 5 mM cysteine, 2 mM EDTA, and 0.5% PVP. The extract was centrifuged at 20,000× g for 20 min at 4 °C, and the suspension was used for NR activities assay.
NR activity was measured based on the method of Gajewska and SkŁodowska [23], and the crude enzyme was added to a 0.1 M potassium phosphate buffer (pH 7.5) consisting of 10 mM MgCl2, and supplemented with 0.2 mM NADH to start the reaction. After the solution incubating at 27 °C for 30 min, 0.1 mL 0.5 M zinc acetate was added to stop the reaction. The solution was centrifuged at 3000× g for 10 min. Then, 1% sulfanilamide and 0.01% naphthylenediamine dihydrochloride were added to the mixture for reacting for 20 min. The absorbance was determined at 540 nm and the quantity of nitrite formed was calculated according to the standard curve of NaNO2.

2.5. GS Extraction and Activity Assays

For determination of GS activities, the plant tissue was added to a 25 mM Tris–HCl buffer (pH 7.6) consisting of 1 mM EDTA-Na2, 1 mM MgCl2, 14 mM β-mercaptoethanol, and PVP 1% (w/v). GS activity was measured based on the method of O’Neal and Joy [31], and the quantity of glutamyl hydroxamate was detected at 540 nm.

2.6. GDH Extraction and Activity Assays

The extraction solution of GDH was similar to that used for GS. GDH activity was detected at 30 °C by measuring the reduction in absorption at 340 nm due to the oxidation of NADH, based on the method of Groat and Vance [32]. The reaction solution (3 mL) contained 0.1 M Tris–HCl (pH 8.0), 0.1 M NH4Cl, 0.2 mM NADH, 10 mM 2-oxoglutaric acid, and crude enzyme.

2.7. Measurement of Height

The four pots in each of the nine treatments were chosen for height measurement every 30 days during the experiment period.

2.8. Statistical Analysis

SPSS statistical software (SPSS 23.0, SPSS Inc., Chicago, IL, USA) was used for statistical analysis. A three-way ANOVA model was performed to test for main the effects of nitrogen pulse treatment, competition, sample time, and their interactions on the key nitrogen metabolism enzyme activities (NR, GS, GDH), NH4+ content, NO3 content, and height in A. retroflexus and G. max. The different treatments were compared by Duncan’s multiple range test. The differences in key nitrogen metabolism enzyme activities (NR, GS, GDH), NH4+ content, NO3 content, and height between the two species or two competition types (interspecific competition and intraspecific competition) in individual treatment were tested by independent sample t tests. All data are presented as untransformed values because the data met the homogeneity of variance.

3. Results

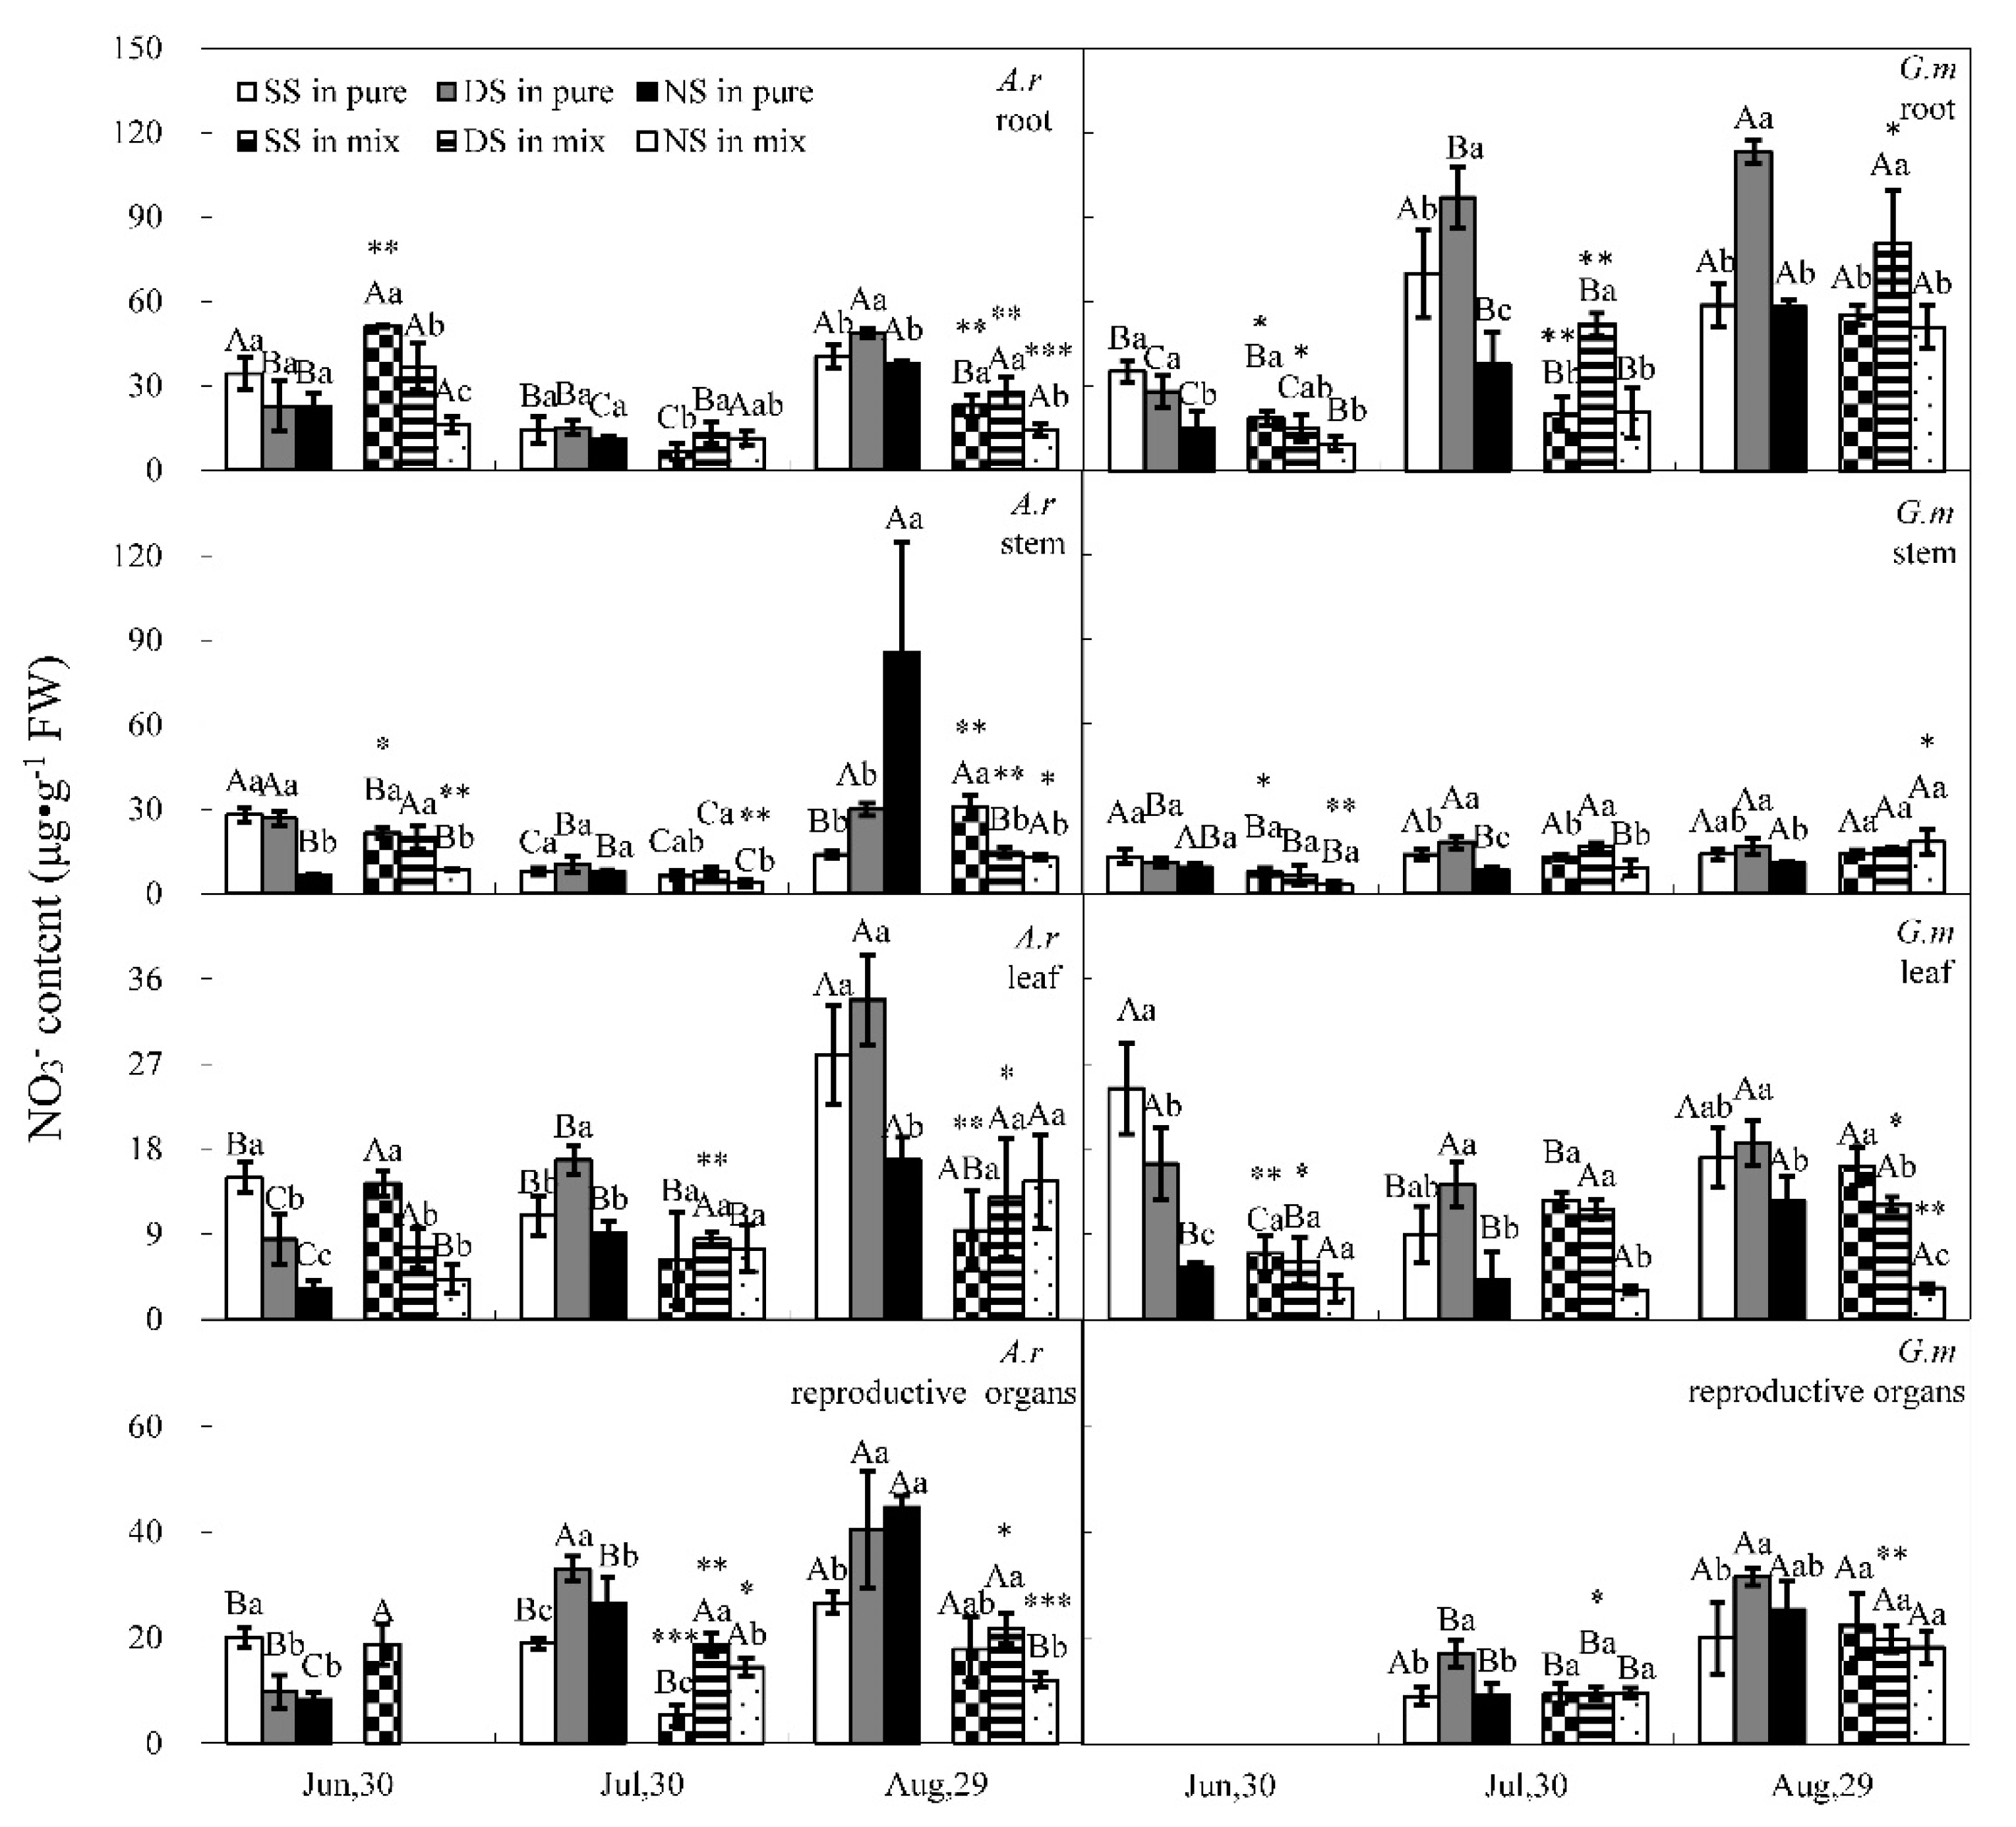
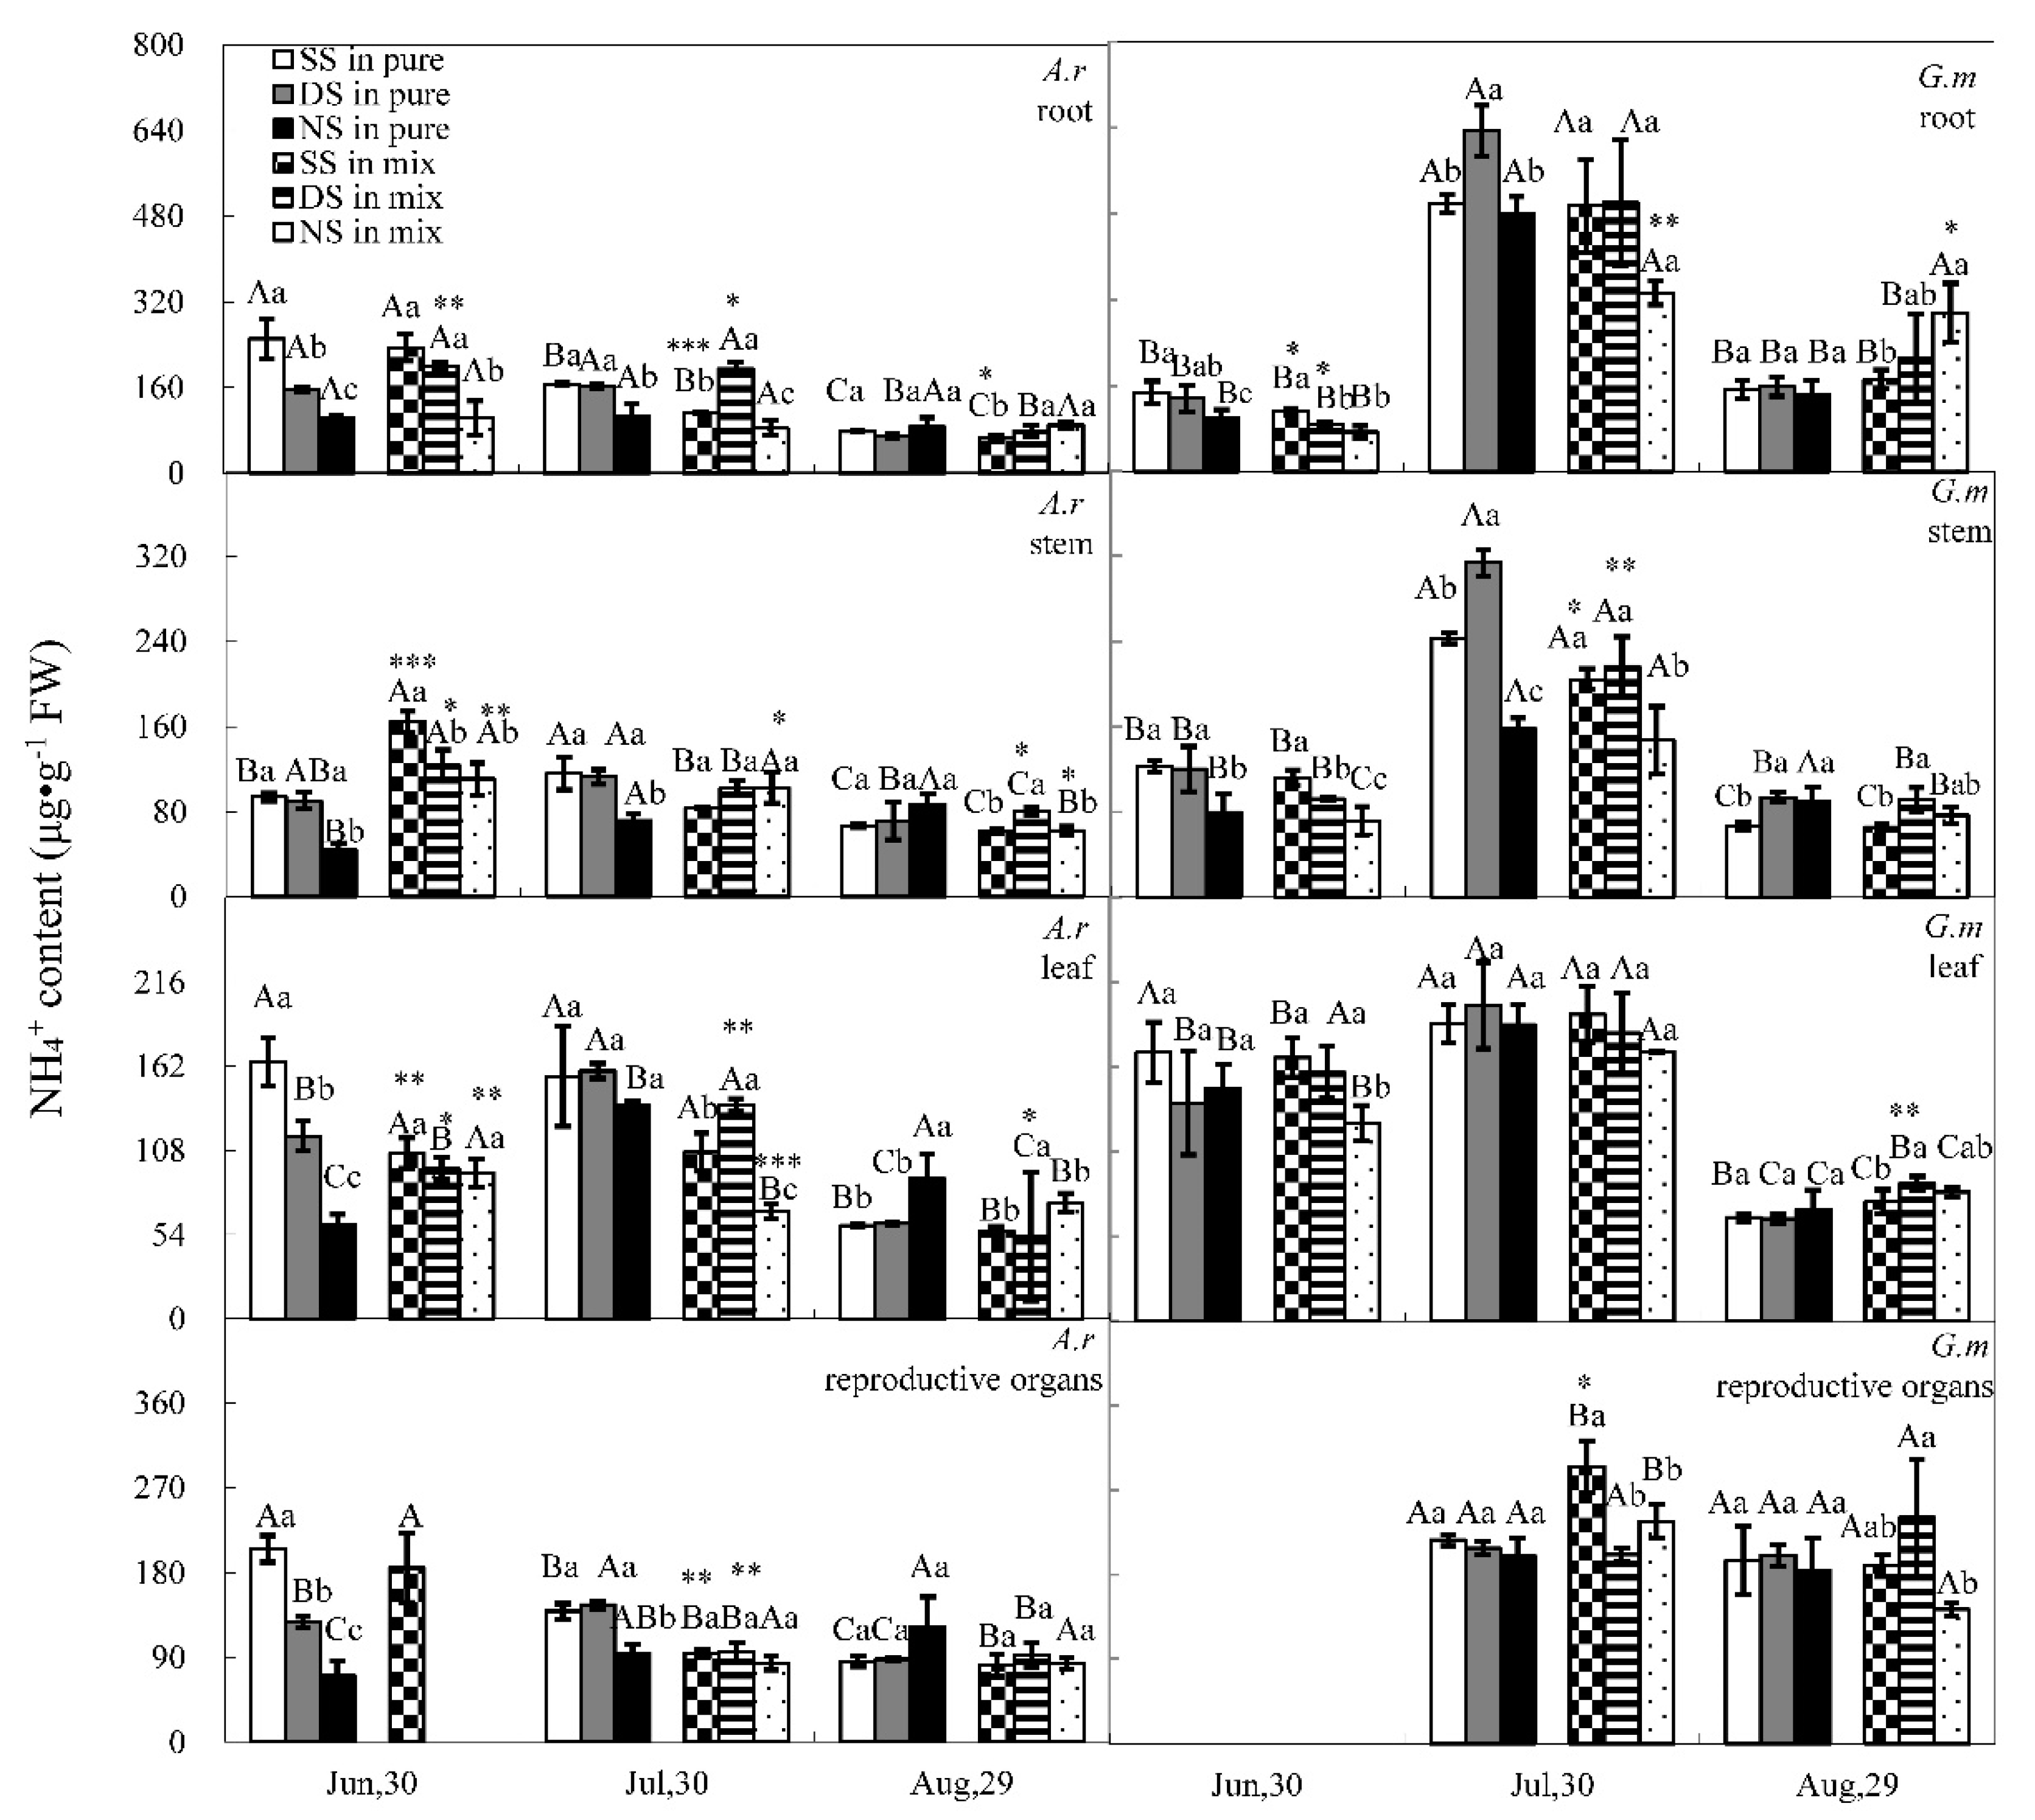
3.1. Nitrate and Ammonium Contents
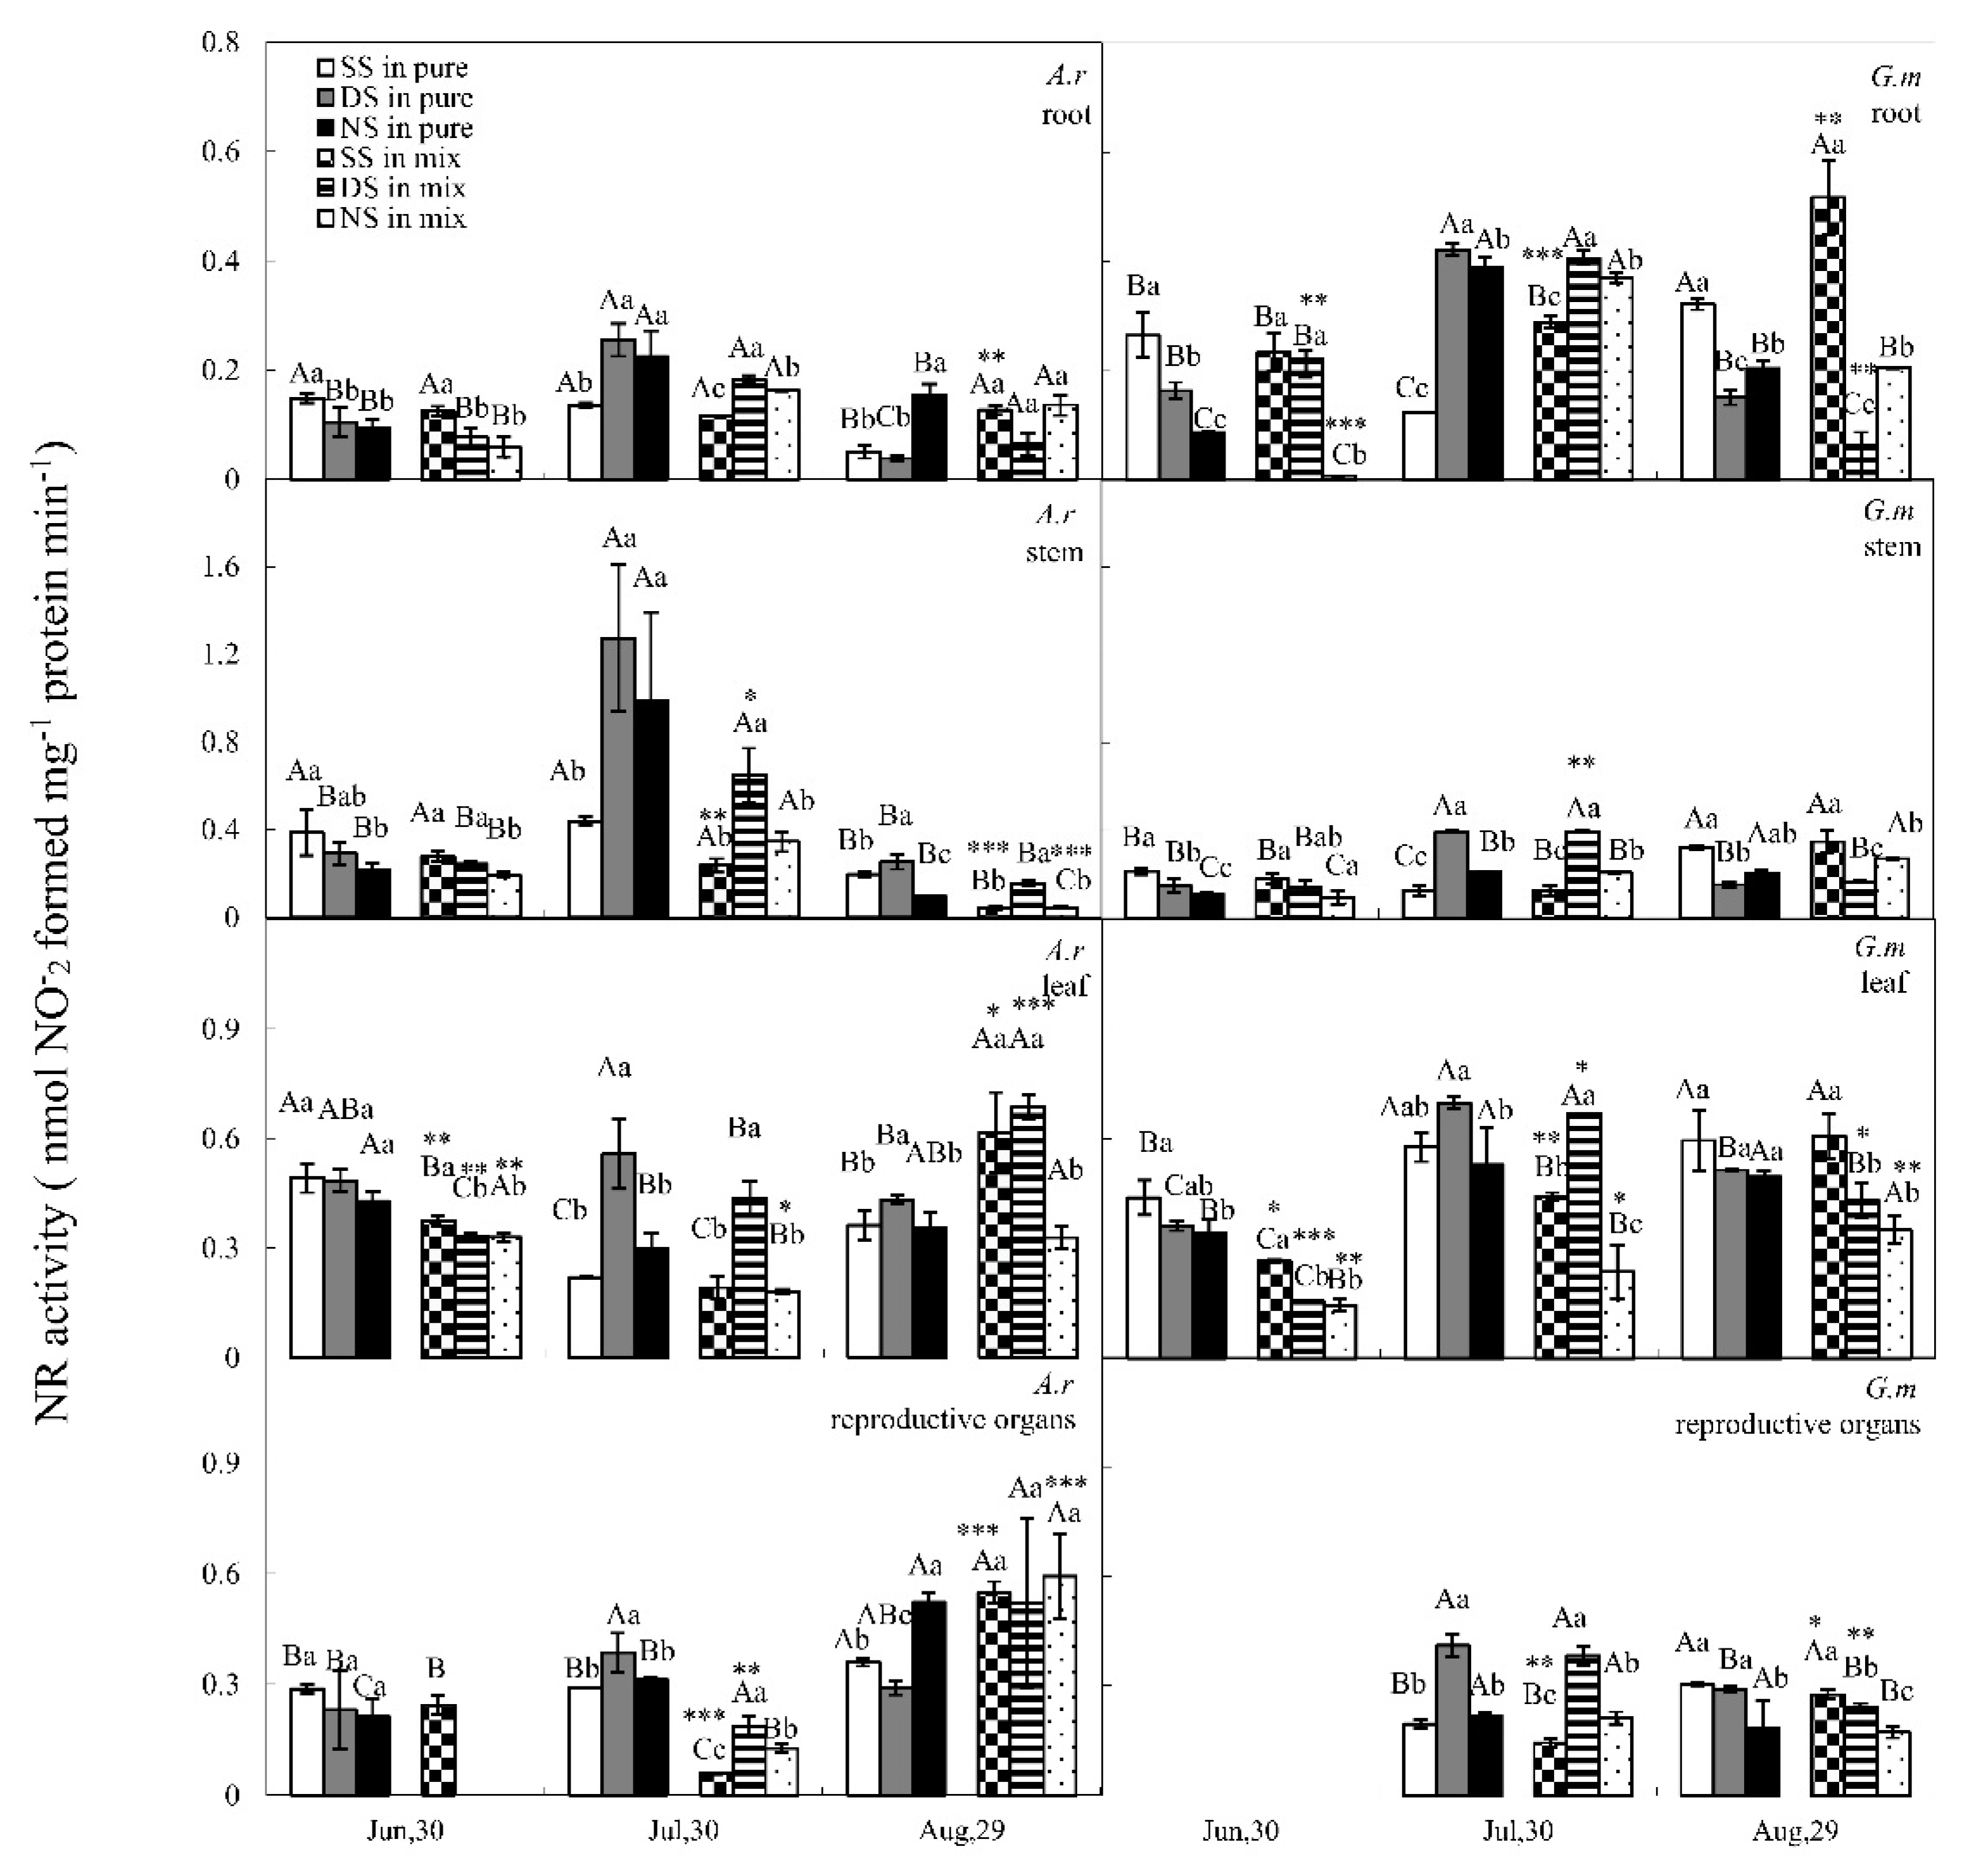
The nitrate and ammonium contents in the two species were strongly impacted by N fertilizer application treatments, except for G. max leaves (P < 0.05) (Table 1). On the first sample time, nitrate and ammonium contents in the two species peaked in the SS treatment and showed the lowest value in the NS treatment. On the second sample time, the nitrate and ammonium contents in both species peaked in the DS treatment. However, on the third sample time, the two species response to N fertilizer application treatments were idiosyncratic, and the nitrate contents of the two species showed tissue-specific changes in response to N fertilizer application treatments (Figure 2), while the ammonium contents of G. max were maximizing in the DS treatment, the ammonium contents of A. retroflexus were maximizing in the NS treatment, except for the stems in the mixed planting (Figure 3).
Competition significantly impacted nitrate contents in A. retroflexus and G. max, except for G. max stems (Table 1), with a higher nitrate content in the pure planting in comparison to those in the mixed planting (except for A. retroflexus root and A. retroflexus stem under NS treatment in June, G. max stem under NS treatment in August) (P < 0.05, Figure 2). The nitrate contents in both species (except for G. max stems) differed significantly in different combinations of competition, nitrogen pulse, and sample time (Table 1).

3.2. NR Activity

NR activities in the two species were markedly impacted by the N fertilizer application treatments, sample time, and their interactions (Table 2). On the first sample time, NR activities of both species reached the maximum value in the SS treatment, and the minimum value in NS treatment, which showed similar trends of the nitrate contents in both species during the same period. On the second sample time, NR activities of both species peaked in the DS treatment, which were also consistent with the nitrate contents in both species at the same time. However, on the third sample time, the two species showed a different trend; NR activities of G. max peaked in SS treatment, whereas NR activities in leaves and stems of A. retroflexus peaked in DS treatment, and NR activities in roots and reproductive organs of A. retroflexus peaked in NS treatment (Figure 4).

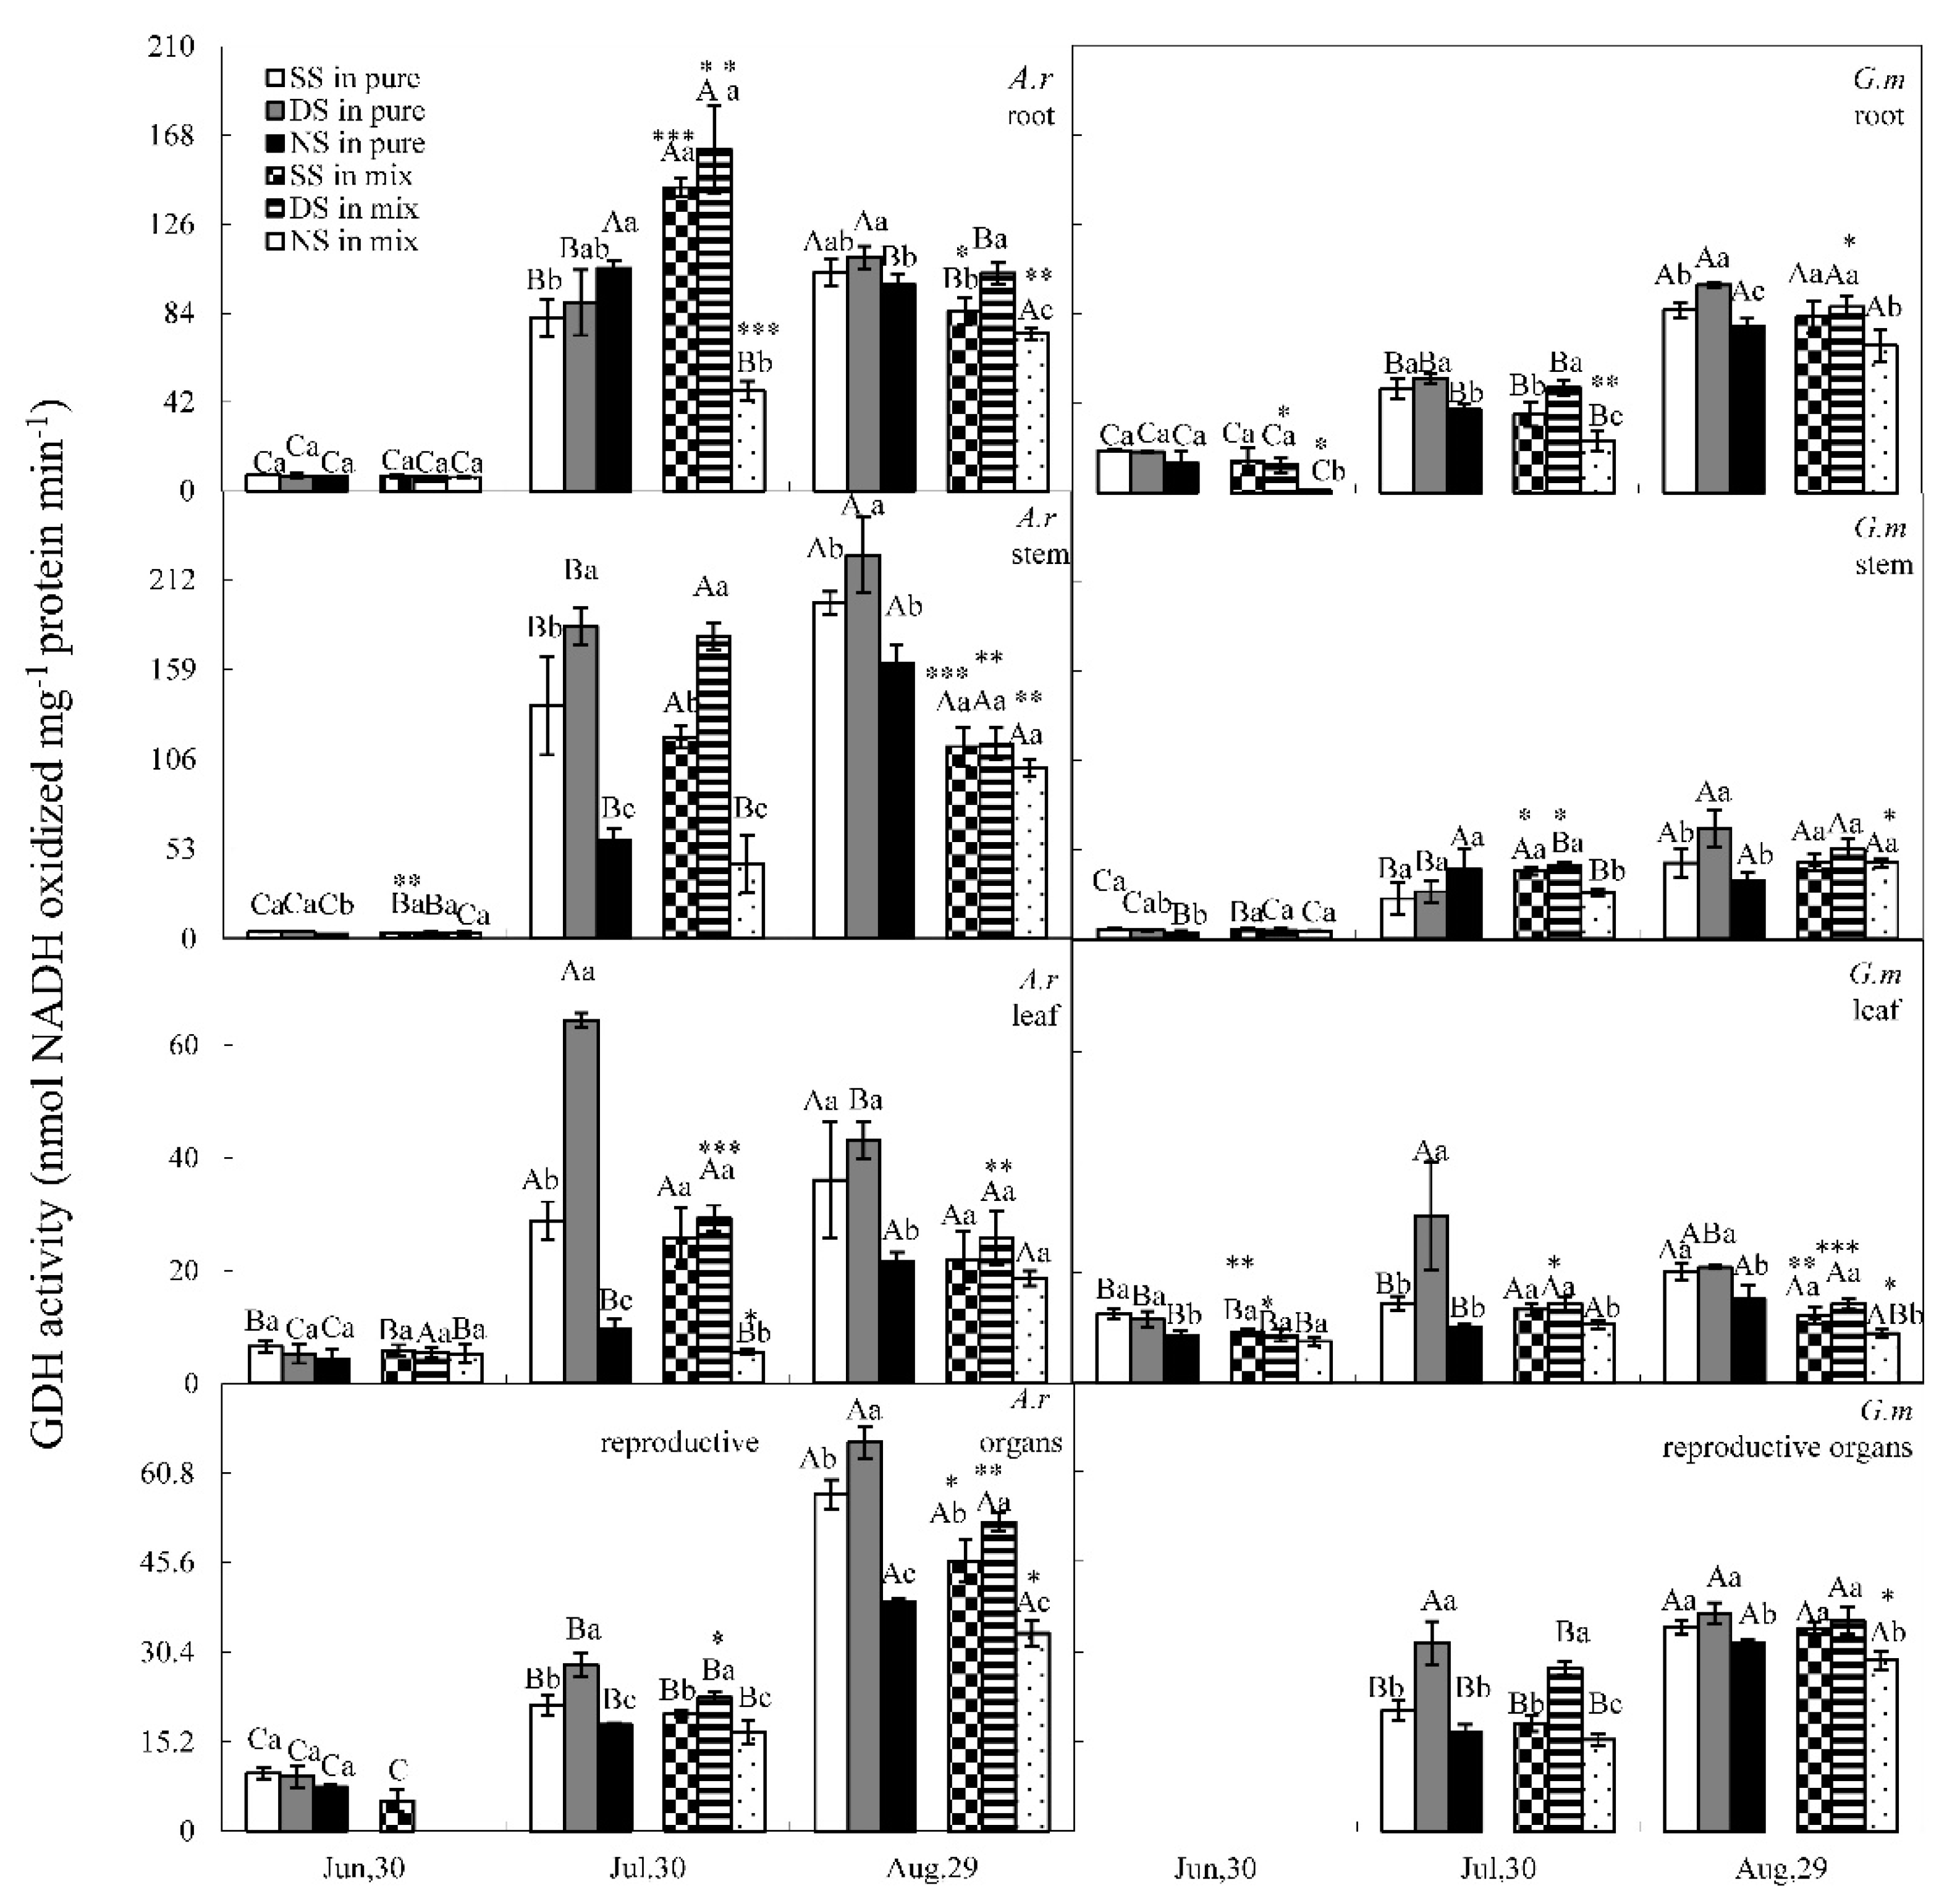
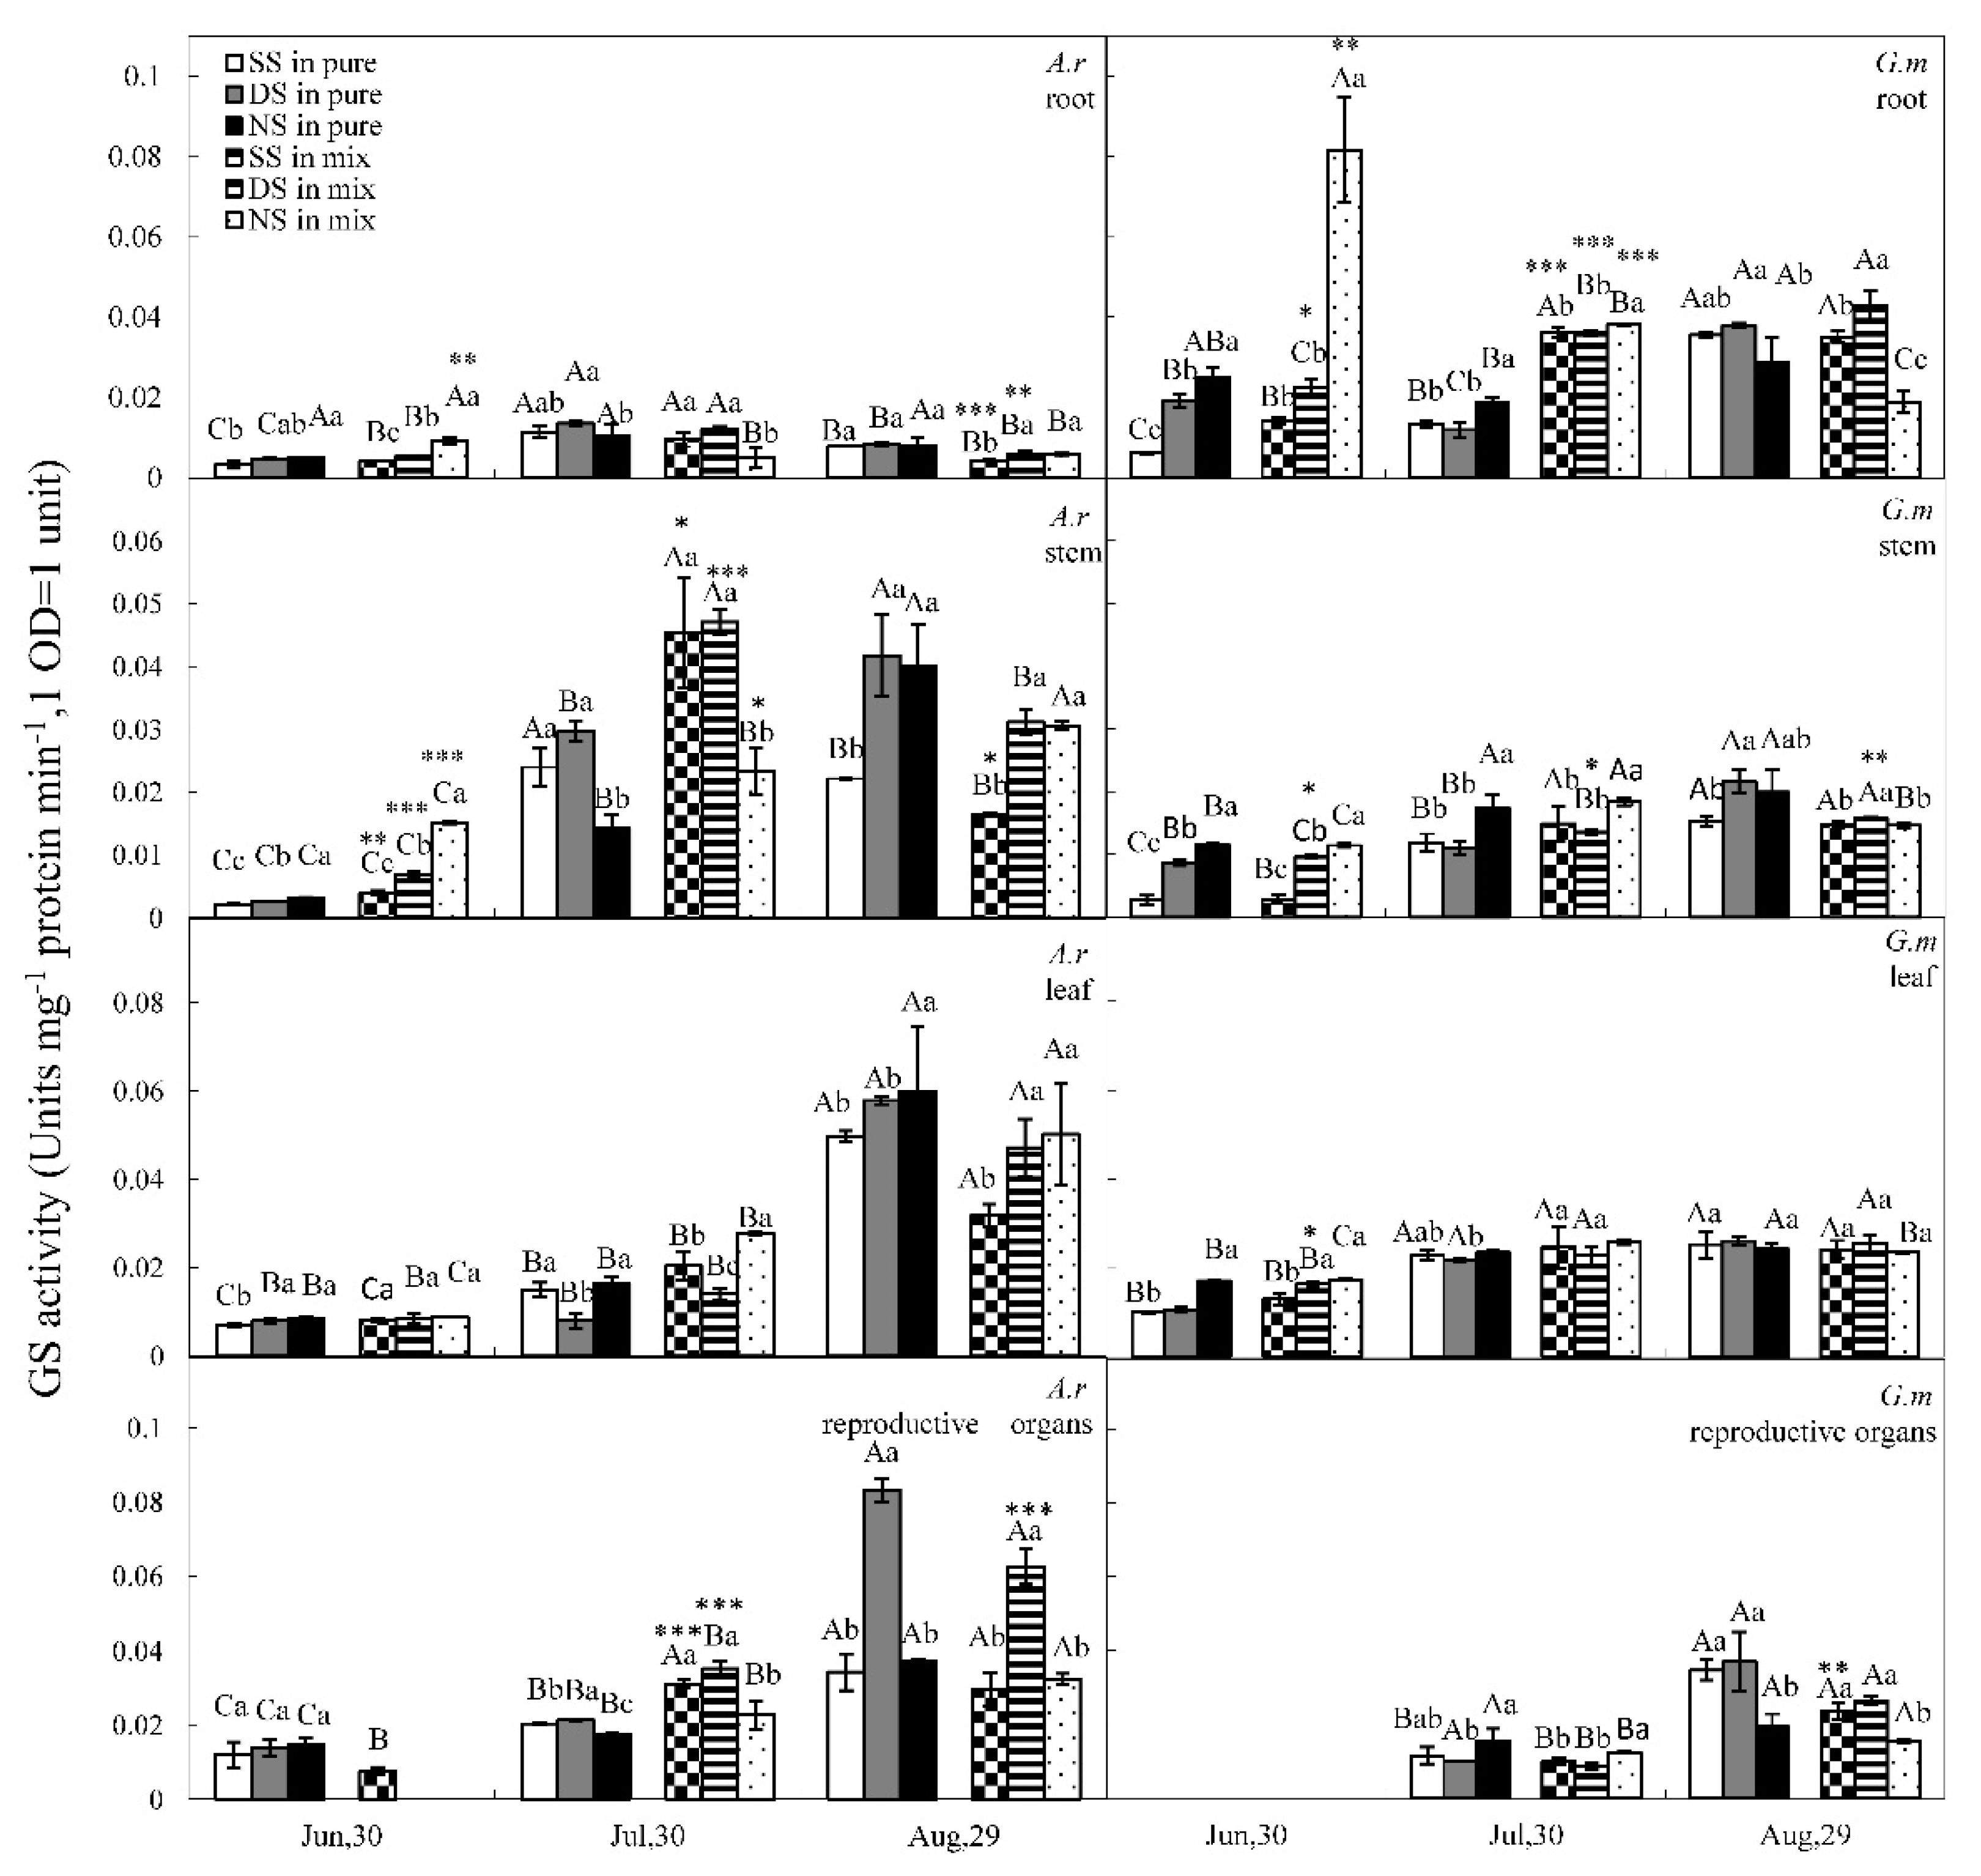
3.3. GS and GDH Activities
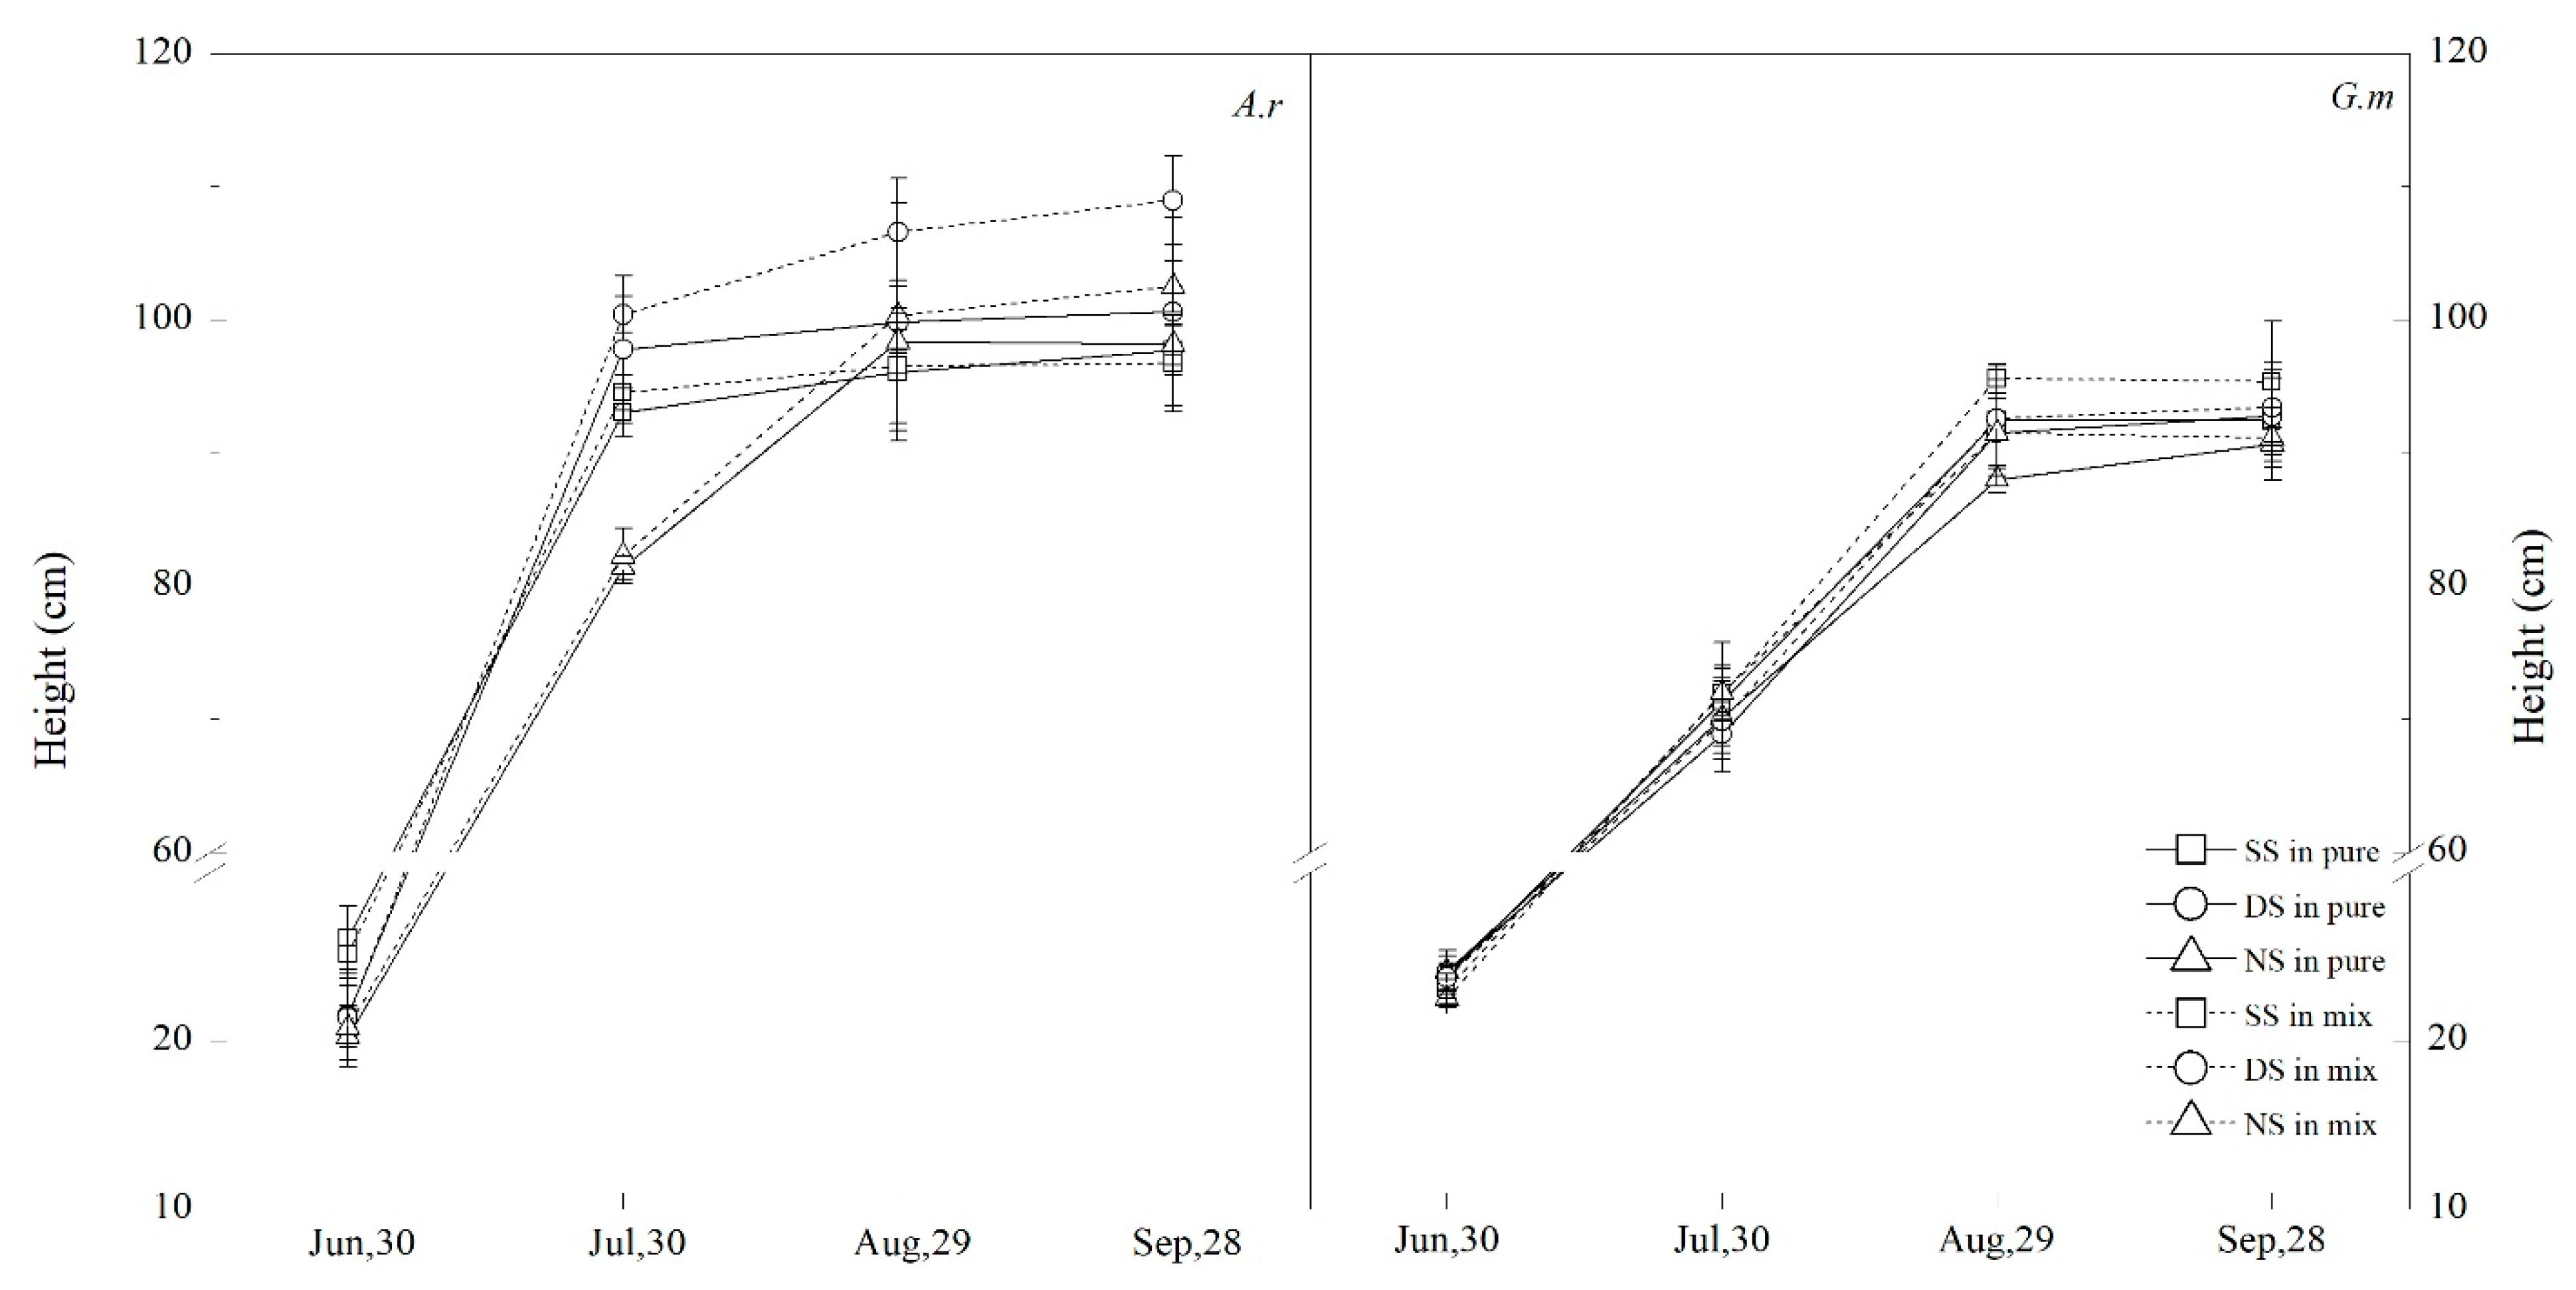
N pulses significantly affected GS and GDH activities in the two species (Table 2). For the first sample time, GDH activities in the two species showed a similar pattern with the ammonium contents, GDH activities peaked in the SS treatment, while it dropped to the lowest in the NS treatment (Figure 5), but GS activities showed an inverse pattern to GDH activities, the highest GS activities were recorded in NS treatment, while the lowest were recorded in SS treatment (Figure 6). For the second sample time, GDH activities in both species peaked in DS treatment, except for A. retroflexus roots and G. max stems, whereas a prominent difference in GS activities was observed between these two species at this time, the lowest GS activities of G. max occurred in DS treatment, while the greatest occurred in NS treatment; on the contrary, the lowest GS activities of A. retroflexus was recorded in NS treatment, while it was the highest in DS treatment, except for the leaves. For the third sample time, GDH activities showed a similar pattern, GDH activities of the two species peaked in DS treatment and decreased to the lowest in NS treatment. GS activities peaked in DS treatment, but went down to the lowest GS activity recorded in different nitrogen treatments, with the minimum GS activity of A. retroflexus in SS treatment and G. max in NS treatment (except for G. max stem in pure planting) (Figure 5 and Figure 6). However, it is worth noting that GS and GDH activities of A. retroflexus (except for GS activities of A. retroflexus roots) were higher in comparison to those of G. max on the last sample time (P < 0.05, Figure 5 and Figure 6).

3.4. Plant Height

The height of the two species was markedly impacted by the N fertilizer application treatments and sample time (Table 2). The main effect of competition in height of A. retroflexus was significant; the height of A. retroflexus in mixed planting was higher than that in pure planting (P < 0.05), while there was no significant difference in the height of G. max between pure planting and mixed planting (Table 2). The height of A. retroflexus was higher than G. max during the last three growing stages (P < 0.05) (Figure 7).

4. Discussion

4.1. N Pulse

The changes of nitrate content and NR activity followed nitrogen availability, especially at the first and second sample times, which showed that both the two species could respond rapidly to N pulses (Figure 2 and Figure 4). It is worth noting that the nitrate content declined rapidly in roots and stems of A. retroflexus at the second sample time compared to the first one, whereas NR activity maintained or increased greatly in roots and stems of A. retroflexus at the second time compared to the first time; the declined nitrate content might be attributed to the “dilution effect”, owing to the large biomass of A. retroflexus. Moreover, the constant or increased NR activities may be due to the fact that A. retroflexus is a nitrophilous species [33], which is highly responsive to higher soil N levels [34,35], and the competitive ability of A. retroflexus with crop could improve since its N fertilizer rate increased [30]. At the second sample time, the dramatic increase of NR activities in A. retroflexus stems in DS and NS treatments indicated that it could respond to nitrogen pulses at a larger magnitude than G. max, and during this period, the height of A. retroflexus increased fast, and it could exceed G. max for a short time, which is important for A. retroflexus to compete for light with the crop (Figure 7).
The different seasonal dynamics of NR activities of the two species response to N pulses might be due to the different biological and life-history characters of the two species; A. retroflexus is a luxury consumer of N, it could increase the biomass by increasing N doses [33], so when all the nitrogen fertilizer was applied once on the planting date, A. retroflexus could quickly capture the applied nitrogen with higher NR activity (except for the roots) in the early growing period, resulting in a rapid initial growth, but it ceased growing sooner [22]. However, G. max is an abstemious consumer of N, high nitrogen fertilizer may have negative effects on G. max growth [36]; when the nitrogen was supplied once on the planting date or before the flowering period of G. max, the nitrogen would act as a higher “priming N” than the continuous supplying nitrogen in G. max growth at the seedling stage, whereas after the flowering stage, the non-continuous N supplying would suppress the nodule development, decrease the nitrogenase activity, and leghemoglobin content in G. max more significantly than the continuous N supplying, and the suppress effect would weaken in the pod fill period [37]. Thus, in SS treatment, the highest NR activities in G. max roots and stems occurred in August, whereas NR activities of G. max leaves and reproductive organs were increasing from June to August, due to the increasing movement of NO3 from roots to leaves during the flowering and podding period [38].
N pulses were observed to affect the activities of GS and GDH differently in the two species. In June, the negative relationship existed between GS and GDH activities in the two species, due to the fact that the GS/GOGAT enzyme system had a much higher affinity for NH4+ than GDH [39]. GDH usually has a high Km for NH4+, indicating that it functions efficiently only at high NH4+ contents [40], while GS activity was repressed by high NH4+ contents [41]. GDH activities in the two species were consistent with the results from tomato [21], rice [42], and barley [43]. In July, the negative relationship was still observed between GS and GDH activities in G. max, but not in A. retroflexus. GS and GDH activities showed a similar trend at this time, GS activities remained high in DS treatment, except for the leaves. The relative importance of GS/GOGAT and GDH pathways seems to be species dependent. A. retroflexus were able to use both pathways in a similar trend, while G. max used the two pathways in a reciprocal relationship. In August, GS and GDH activities of G. max were the greatest in DS treatment and the lowest in NS treatment, which may due to the different energy level and carbon availability in the G. max plants in different nitrogen treatments, as reported by Gan et al. [44]. The photosynthesis of G. max increased greatly when it received the supplemental nitrogen after flowering, and obtained the highest amount of N uptake, whereas, as reported by Wang et al. [37], the continuous N supplying decreased the nitrogenase activity and leghemoglobin content greatly in G. max during the pod fill period, which would decrease GS and GDH activities of G. max in NS treatment. However, it is not the case for A. retroflexus, both GDH and GS activities were the greatest in DS treatment, but GDH and GS activities showed a reciprocal relationship in SS and NS treatments, the ratio between GDH and GS/GOGAT of A. retroflexus was different in the different nitrogen treatments at the third sample time.
The results in this study demonstrate that nitrogen pulses can impact the nitrogen metabolism of both A. retroflexus and G. max in different ways. The biochemical data also suggest a differential response to nitrogen pulses in an organ-dependent manner, evidenced by the G. max NR activities decreased in roots and stems and increased in leaves and reproductive organs at the second sample time, whereas the A. retroflexus NR activities decreased in roots and stems and increased in leaves and reproductive organs at the third sample time.

4.2. Competition

It should be noted that A. retroflexus growing in the mixed planting in DS and NS treatments delayed the reproductive time, whereas all the plants in the pure planting were switched to reproductive growth, irrespective of the nitrogen treatments in the early growing period (Figure 2, Figure 3, Figure 4, Figure 5 and Figure 6). As a widespread annual weed, A. retroflexus could show high phenotypic plasticity to the changing environment conditions [45,46,47,48], and the life span could last from short (72 d) to long (110 d) [47]. In the current study, we found that, in SS treatment, A. retroflexus was growing rapidly at the initial time, and the height of A. retroflexus was higher than that of G. max until the end of June (Figure 7), but it ceased growing sooner (about 92 d), while in DS and NS treatments, A. retroflexus lived longer (DS 105d, NS 115 d). However, evidence for tradeoffs between rapid initial growth and sustained later growth in G. max is still limited, which was consistent with the results of Jannink et al. [48].
Interspecific competition exerted negative impacts on the nitrogen metabolism of the two species for the most sample times, resulting in a decrease in nitrate and ammonium contents, activities of NR, GS, and GDH in mixed planting compared with those in pure planting (Figure 2, Figure 3, Figure 4, Figure 5 and Figure 6). However, interspecific competition exerted a positive influence on nitrogen metabolism in some organs of the two species, suggesting a tissue-specific change in interspecific competition. Furthermore, seasonal variations in N metabolism were observed between the two species. A. retroflexus showed a higher NR activity (except for the roots) and nitrate content than those of G. max in June and G. max showed a higher NR activity (except for the stems) than that of A. retroflexus in mixed planting in July. G. max had higher GS and GDH activities (except for reproductive organs) than those of A. retroflexus in June, whereas A. retroflexus exhibited higher GS (except for the roots) and GDH activities than those of G. max in July and August, leading to a lesser amount of ammonia accumulation in G. max than those of A. retroflexus in June, and a lower amount of ammonia accumulation in A. retroflexus than those of G. max in July and August.
When growing with G. max, A. retroflexus always have a height advantage over G. max [49], its leaf area was concentrated in the upper strata of the canopy and thus reduced the light available to G. max leaves lower in the canopy [50]. Consistent with their results, in this experiment, we found that the activities of NR, GS, and GDH of A. retroflexus stems were higher than G. max, regardless of the N pulse treatments for most of the sampling times. In SS treatment, A. retroflexus showed higher NR activities (except for the roots) at the first sample time. It was growing fast, and had a greater height than G. max until the end of June, whereas in DS and NS treatments, its height was similar or a little smaller than G. max until the end of June (Figure 7), but its NR, GS, and GDH activities of stems increased dramatically at the second sample time in the two treatments, and the height of A. retroflexus exceeded G. max until the end of July. As for G. max, NR and GS activities of roots were higher than A. retroflexus regardless of the N pulse treatments. The results indicate a difference between the two species in their competitive strategies, A. retroflexus possesses an efficiency at aboveground competition due to its higher height, whereas G. max at underground competition due to its higher root biomass and root/shoot ratio.
A. retroflexus have shown to be highly responsive to soil N level changes among the weed species [35]. In the current study, it could quickly increase the NR activity more highly than G. max (except for the roots) in the early growing period, and could increase GS and GDH activities in stem more highly than G. max in SS and DS treatments during the last two growing stages. However, the advantages were much weaker in the NS treatment. Interspecific competition had negative effects on nitrogen metabolism of the two species among most of the sample times, and the effects of interspecific competition exerted a tissue-specific influence on nitrogen metabolism in the two species. A. retroflexus switched to reproductive growth earlier in SS treatment than in DS and NS treatments when it was grown in mixed planting, and its height was the lowest in NS treatment, so the competitive ability of A. retroflexus was higher in SS and DS treatment than in NS treatment, while SS treatment was the common application method of N fertilizer in G. max farmland in China [51]. Thus, the results of this study suggest that, if the farmer changed the N fertilizer application mode to a constant multiple fertilization mode, the competitive efficacy of A. retroflexus would be reduced.

Author Contributions

B.J. conceived and designed the study; X.Z., Q.L. and H.Y. performed measurements; P.L. conceived the study and wrote the paper; B.J., X.Z. and T.F. analyzed the data; L.Z., J.G., W.Z. and H.L. were contributed to writing. All authors have read and agreed to the published version of the manuscript.

Funding

This research was supported by the Natural Science Foundation of Heilongjiang Province (contract C2017018), the National Natural Science Foundation of China (contract 31770582; 31370546), the “Academic Backbone” Project of Northeast Agricultural University (contract 17XG08).

Conflicts of Interest

The authors declare that they have no competing interests.

References

  1. Yang, L.H.; Naeem, S. The ecology of resource pulses. Ecology 2008, 89, 619–620. [Google Scholar] [CrossRef]
  2. Yang, L.H.; Edwards, K.F.; Byrnes, J.E.; Bastow, J.L.; Wright, A.N.; Spence, K.O. A meta-analysis of resource pulse-consumer interactions. Ecol. Monogr. 2010, 80, 125–151. [Google Scholar] [CrossRef] [Green Version]
  3. Cui, M.Y.; Caldwell, M. A large ephemeral release of nitrogen upon wetting of dry soil and corresponding root responses in the field. Plant Soil 1997, 191, 291–299. [Google Scholar] [CrossRef]
  4. Jankju-Borzelabad, M.; Griffiths, H. Competition for pulsed resources: An experimental study of establishment and coexistence for an arid-land grass. Oecologia 2006, 148, 555–563. [Google Scholar] [CrossRef] [PubMed]
  5. Yang, L.H.; Bastow, J.L.; Spence, K.O.; Wright, A.N. What can we learn from resource pulses? Ecology 2008, 89, 621–634. [Google Scholar] [CrossRef] [PubMed]
  6. Yee, D.A.; Juliano, S.A. Concurrent effects of resource pulse amount, type, and frequency on community and population properties of consumers in detritus-based systems. Oecologia 2012, 169, 511–522. [Google Scholar] [CrossRef] [PubMed] [Green Version]
  7. Weber, M.J.; Brown, M.L. Effects of resource pulse magnitude on nutrient availability, productivity, stability, and food web dynamics in experimental aquatic ecosystems. Hydrobiologia 2018, 814, 191–203. [Google Scholar] [CrossRef]
  8. Miller, T.E.; Buhler, M.L.; Cuellar-Gempeler, C. Species-specific differences determine responses to a resource pulse and predation. Oecologia 2019, 190, 169–178. [Google Scholar] [CrossRef] [PubMed]
  9. Xu, H.G.; Ding, H.; Li, M.Y.; Qiang, S.; Guo, J.Y.; Han, Z.M.; Huang, Z.G.; Sun, H.Y.; He, S.P.; Wu, H.R.; et al. The distribution and economic losses of alien species invasion to China. Biol. Invasions 2006, 8, 1495–1500. [Google Scholar] [CrossRef]
  10. Clements, D.R.; DiTommaso, A.; Jordan, N.; Barbara, D.B.; Cardina, J.; Doohan, D.; Mohler, C.L.; Murphy, S.D.; Swanton, C.J. Adaptability of plants invading North American cropland. Agric. Ecosyst. Environ. 2004, 104, 379–398. [Google Scholar] [CrossRef]
  11. Lu, Z.J.; Ma, K.P. Scale dependent relationships between native plant diversity and the invasion of crofton weed (Eupatorium adenophorum) in southwest China. Weed Sci. 2005, 53, 600–604. [Google Scholar] [CrossRef]
  12. Sang, W.G.; Zhu, L.; Axmacher, J.C. Invasion pattern of Eupatorium adenophorum Spreng in Southern China. Biol. Invasions 2010, 12, 1721–1730. [Google Scholar] [CrossRef]
  13. Zhang, F.J.; Guo, J.Y.; Chen, F.X.; Liu, W.X.; Wan, F.H. Identification of volatile compounds released by leaves of the invasive plant croftonweed (Ageratina adenophora, Compositae), and their inhibition of rice seedling growth. Weed Sci. 2012, 60, 205–211. [Google Scholar] [CrossRef]
  14. Qin, R.M.; Zheng, Y.L.; Valiente-Banuet, A.; Callaway, R.M.; Barclay, G.F.; Pereyra, C.S.; Feng, Y.L. The evolution of increased competitive ability, innate competitive advantages, and novel biochemical weapons act in concert for a tropical invader. New Phytol. 2013, 197, 979–988. [Google Scholar] [CrossRef]
  15. Lu, P.; Li, J.X.; Jin, C.G.; Jiang, B.W.; Bai, Y.M. Different growth responses of an invasive weed and a native crop to nitrogen pulse and competition. PLoS ONE 2016, 11, e0156285. [Google Scholar] [CrossRef] [PubMed] [Green Version]
  16. Davis, M.A.; Grime, J.P.; Thompson, K. Fluctuating resources in plant communities: A general theory of invasibility. J. Ecol. 2000, 88, 528–534. [Google Scholar] [CrossRef] [Green Version]
  17. Melbourne, B.A.; Cornell, H.V.; Davies, K.F.; Dugaw, C.J.; Elmendorf, S.; Freestone, A.L.; Hall, R.J.; Harrison, S.; Hastings, A.; Holland, M.; et al. Invasion in a heterogeneous world: Resistance, coexistence or hostile takeover? Ecol. Lett. 2007, 10, 77–94. [Google Scholar] [CrossRef]
  18. Parepa, M.; Fischer, M.; Bossdorf, O. Environmental variability promotes plant invasion. Nat. Commun. 2013, 4, 1604. [Google Scholar] [CrossRef]
  19. Liu, Y.Y.; Sun, Y.; Heinz, M.S.; Yan, R.; Zhou, Z.X.; Wang, Y.J.; Yu, F.H. Do invasive alien plants differ from non-invasives in dominance and nitrogen uptake in response to variation of abiotic and biotic environments under global anthropogenic change? Sci. Total Environ. 2019, 672, 634–642. [Google Scholar] [CrossRef]
  20. Patterson, D.T. Effects of environmental stress on weed/crop interactions. Weed Sci. 1995, 43, 483–490. [Google Scholar] [CrossRef]
  21. Debouba, M.; Gouia, H.; Suzuki, A.; Ghorbela, M.H. NaCl stress effects on enzymes involved in nitrogen assimilation pathway in tomato “Lycopersicon esculentum” seedlings. J. Plant Physiol. 2006, 163, 1247–1258. [Google Scholar] [CrossRef] [PubMed]
  22. Gebauer, G.; Schuhmacher, M.I.; Krstić, B.; Rehder, H.; Ziegler, H. Biomass production and nitrate metabolism of Atriplex hortensis L.(C3 plant) and Amaranthus retroflexus L. (C4 plant) in cultures at different levels of nitrogen supply. Oecologia 1987, 72, 301–314. [Google Scholar] [CrossRef] [PubMed]
  23. Gajewska, E.; SkŁodowska, M. Nickel-induced changes in nitrogen metabolism in wheat shoots. J. Plant Physiol. 2009, 166, 1034–1044. [Google Scholar] [CrossRef] [PubMed]
  24. Li, H.S. (Ed.) Mordern Plant Physiology; Higher Education Press: Beijing, China, 2002; pp. 219–220. (In Chinese) [Google Scholar]
  25. Chaffei, C.; Gouia, H.; Ghorbel, M.H. Nitrogen metabolism in tomato plants under cadmium stress. J. Plant Nutr. 2003, 26, 1617–1634. [Google Scholar]
  26. Li, X.J.; Zhang, H.J.; Ni, H. Review on the biological characters and control of redroot pigweed (Amaranthus retroflexus). Pestic. Sci. Adm. 2004, 25, 13–16. (In Chinese) [Google Scholar]
  27. Weber, E.; Sun, S.G.; Li, B. Invasive alien plants in China: Diversity and ecological insights. Biol. Invasions 2008, 10, 1411–1429. [Google Scholar] [CrossRef] [Green Version]
  28. Nagata, T. Studies on the differentiation of soybeans in the world, with special regard to that in Southeast Asia.2. Origin of culture and paths of dissemination of soybeans, as considered by the distributions of their summer versus autumn soybean habit and plant habit. Crop Sci. Soc. Jpn. 1959, 28, 79–82. [Google Scholar]
  29. Cataldo, D.A.; Maroon, M.; Schrader, L.E.; Youngs, V.L. Rapid colorimetric determination of nitrate in plant tissue by nitration of salicylic acid. Commun. Soil Sci. Plant 1975, 6, 71–80. [Google Scholar] [CrossRef]
  30. Molins-Legua, C.; Meseguer-Lloret, S.; Moliner-Martinez, Y.; Campíns-Falcó, P. A guide for selecting the most appropriate method for ammonium determination in water analysis. Trends Anal. Chem. 2006, 25, 282–290. [Google Scholar] [CrossRef]
  31. O’Neal, D.; Joy, K.D. Glutamine synthetase of pea leaves: Purification, stabilization and pH optima. Arch. Biochem. Biophys. 1973, 159, 113–122. [Google Scholar] [CrossRef]
  32. Groat, R.G.; Vance, C.P. Root nodule enzyme of ammonia assimilation in alfalfa (Medicago sativa L.). Developmental patterns and response to applied nitrogen. Plant Physiol. 1981, 67, 1198–1203. [Google Scholar] [CrossRef] [PubMed] [Green Version]
  33. Bazzaz, F.A.; Garbutt, K.; Reekie, E.R.; Williama, W.E. Using growth analysis to interpret competition between a C3 and a C4 annual under ambient and elevated CO2. Oecologia 1989, 79, 223–235. [Google Scholar] [CrossRef] [PubMed]
  34. Blackshaw, R.E.; Brandt, R.N.; Janzen, H.H.; Entz, T.; Grant, C.A.; Derksen, D.A. Differential response of weed species to added nitrogen. Weed Sci. 2003, 51, 532–539. [Google Scholar] [CrossRef]
  35. Blackshaw, R.E.; Brandt, R.N. Nitrogen fertilizer rate effects on weed competitiveness is species dependent. Weed Sci. 2008, 56, 743–747. [Google Scholar] [CrossRef]
  36. Di, W.; Jin, X.J.; Ma, C.M.; Gong, Z.P.; Dong, S.K.; Zhang, L. Effects of nitrogen application on yield and nitrogen accumulation in soybean. J. Nucl. Sci. Technol. 2010, 24, 612–617. (In Chinese) [Google Scholar]
  37. Wang, S.Q.; Han, X.Z.; Qiao, Y.F.; Yan, J.; Li, X.H. Soybean (Glycine max L.) growth and nitrogen fixation as affected by different N supplying modes. Soybean Sci. 2009, 5, 859–862. (In Chinese) [Google Scholar]
  38. Nelson-Schreiber, B.M.; Schweitzer, L.E. Limitations on leaf nitrate reductase activity during flowering and podfill in soybean. Plant Physiol. 1986, 80, 454–458. [Google Scholar] [CrossRef] [Green Version]
  39. Geisseler, D.; Doane, T.A.; Horwath, W.R. Determining potential glutamine synthetase and glutamate dehydrogenase activity in soil. Soil Biol. Biochem. 2009, 41, 1741–1749. [Google Scholar] [CrossRef]
  40. Helling, R.E. Pathway choice in glutamate synthesis in Escherichia coli. J. Bacteriol. 1998, 180, 4571–4573. [Google Scholar] [CrossRef] [Green Version]
  41. Baars, J.J.; Op den Camp, J.M.H.; van der Drift, C.; Van Griensven, L.J.L.D.; Vogels, G.D. Regulation of nitrogen-metabolizing enzymes in the commercial mushroom Agaricus bisporus. Curr. Microbiol. 1995, 31, 345–350. [Google Scholar] [CrossRef]
  42. Lu, B.B.; Yuan, Y.Z.; Zhang, C.F.; Ou, J.Q.; Zhou, W.; Lin, Q.H. Modulation of key enzymes involved in ammonium assimilation and carbon metabolism by low temperature in rice (Oryza sativa L.) roots. Plant Sci. 2005, 169, 295–302. [Google Scholar] [CrossRef]
  43. Robredo, A.; Pérez-López, U.; Miranda-Apodaca, J.; Lacuesta, M.; Mena-Petite, A.; Muñoz-Rueda, A. Elevated CO2 reduces the drought effect on nitrogen metabolism in barley plants during drought and subsequent recovery. Environ. Exp. Bot. 2011, 71, 399–408. [Google Scholar] [CrossRef]
  44. Gan, Y.B.; Chen, J.; Qiu, Z.M.; Stulen, I. Effects of N fertilizer application at different growth stages on N uptake and N-fixation of soybeans. Chin. J. Oil Crop Sci. 1996, 18, 45–47. (In Chinese) [Google Scholar]
  45. Huang, J.Z. Effects of photoperiod on the phenological development of redroot pigweed (Amaranthus retroflexus L.). Can. J. Plant Sci. 2000, 80, 929–938. [Google Scholar] [CrossRef]
  46. Rajcan, I.; AghaAlikhani, M.; Swanton, C.J.; Tollenaar, M. Development of redroot pigweed is influenced by light spectral quality and quantity. Crop Sci. 2002, 42, 1930–1936. [Google Scholar] [CrossRef]
  47. Zhou, D.W.; Wang, T.H.; Valentine, I. Phenotypic plasticity of life-history characters in response to different germination timing in two annual weeds. Can. J. Bot. 2005, 83, 28–36. [Google Scholar] [CrossRef]
  48. Jannink, J.L.; Jordan, N.R.; Orf, J.H. Feasibility of selection for high weed suppressive ability in soybean: Absence of tradeoffs between rapid initial growth and sustained later growth. Euphytica 2001, 120, 291–300. [Google Scholar] [CrossRef]
  49. Shurtleff, J.L.; Coble, H.D. The interations of soybean (Glycine max) and five weed species in the greenhouse. Weed Sci. 1985, 33, 669–679. [Google Scholar] [CrossRef]
  50. Légère, A.; Schreiber, M.M. Competition and canopy architecture as affected by soybean (Glycine max) row width and density of redroot pigweed (Amaranthus retroflexus). Weed Sci. 1989, 37, 84–92. [Google Scholar] [CrossRef]
  51. Tian, Y.H.; Liu, Y.Y.; Zhang, W.Z.; Luo, S.G. Effect of N fertilization at different stage on nitrogenase activity and yield of soybean. J. Northeast Agric. Univ. 2008, 39, 15–19. (In Chinese) [Google Scholar]
Figure 1. Daily mean temperature and precipitation during the experiment in 2014.
Sustainability 12 00772 g001
Figure 2. Changes in NO3 content of A. retroflexus (A. r) and G. max (G. m). Plants were grown in pure planting (pure) or mixed planting (mix) in the three N pulse treatments (SS, single-summit treatment; DS, double-summit treatment; NS, no-summit treatment). Each value represents the mean value ± standard error, n = 4. Uppercase letters represent differences between different growth stages of the same nitrogen fertilizer supply mode, and lowercase letters represent differences between different nitrogen fertilizer supply treatments in the same growth stage (P < 0.05), which is the same below. * represents that the nitrate contents in the mixed plants were significantly different from those in the pure plants in the same nitrogen fertilizer supply mode and growth stage (* P < 0.05, ** P < 0.01, *** P < 0.001).
Sustainability 12 00772 g002
Figure 3. Changes in NH4+ content of A. retroflexus (A. r) and G. max (G. m). Abbreviations are the same as those in Figure 2. Each value represents the mean value ± standard error, n = 4. * represents the ammonium contents in the mixed plants, which were significantly different from those in the pure plants in the same nitrogen fertilizer supply mode and growth stage (* P < 0.05, ** P < 0.01, *** P < 0.001).
Sustainability 12 00772 g003
Figure 4. Changes in NR activity of A. retroflexus (A. r) and G. max (G. m). Abbreviations are the same as those in Figure 2. Each value represents the mean value ± standard error, n = 4 * represents the NR activities in the mixed plants, which were significantly different from those in the pure plants in the same nitrogen fertilizer supply mode and growth stage (* P < 0.05, ** P < 0.01, *** P < 0.001). Competition significantly interacted with sample time to affect NR activities in both species, except for G. max reproductive organs. For the first and second sample times, NR activities of A. retroflexus leaves and reproductive organs were 14–64% and 17–384% greater in the pure planting, respectively, in comparison with those in the mixture, whereas for the third sample time, NR activities of A. retroflexus leaves and reproductive organs were 37–41% and 12–44% lower in the pure planting compared with those in the mixed planting (except for the leaves in the NS treatment), respectively, but NR activities of A. retroflexus stems were 13–324% greater in the pure planting compared with those in the mixed planting (P < 0.05, Figure 4). The NR activities of G. max were higher in the pure planting than in the mixed planting during the most experimental period, and the degree of the competition effect on NR activities altered with different sample times (Figure 4).
Sustainability 12 00772 g004
Figure 5. Changes in GDH activity of A. retroflexus (A. r) and G. max (G. m). Abbreviations are the same as those in Figure 2. Each value represents the mean value ± standard error, n = 4 * represents the GDH activities in the mixed plants, which were significantly different from those in the pure plants in the same nitrogen fertilizer supply mode and growth stage (* P < 0.05, ** P < 0.01, *** P < 0.001).
Sustainability 12 00772 g005
Figure 6. Changes in GS activity of A. retroflexus (A. r) and G. max (G. m). Abbreviations are the same as those in Figure 2. Each value represents the mean value ±standard error, n = 4 * represents the GS activities in the mixed plants, which were significantly different from those in the pure plants in the same nitrogen fertilizer supply mode and growth stage (* P < 0.05, ** P < 0.01, *** P < 0.001).
Sustainability 12 00772 g006
Figure 7. Changes in Height of A. retroflexus (A. r) and G. max (G. m). Abbreviations are the same as those in Figure 2. Each value represents the mean value ± standard error, n = 4.
Sustainability 12 00772 g007
Table 1. Nitrate and ammonium content of different organs (root, stem, leaf, and reproductive organs (RO)) in A. retroflexus and G. max, as affected by N fertilizer application treatments (N), competition (C), and sample time (S).
Nitrate Content aAmmonium Content a
RootStemLeafRORootStemLeafRO
A. retroflexus
N**********************
C************ns*********
S***********************
N × S************ns *********
C × N*************ns****
S × C***ns ******************
S × N × C********ns*********
G. max
N**************ns*
C***ns*****ns***nsns
S************************
N × S*******ns ******ns***
C × N**nsns**ns**nsns
S × C****************ns*
S × N × C*ns*******ns**
a ns, Not significant (P > 0.05); * P < 0.05; ** P < 0.01; *** P < 0.001.
Table 2. Nitrate reductase (NR), glutamine synthetase (GS) and glutamate dehydrogenase (GDH) activities of different organs (root, stem, leaf and reproductive organs (RO)) in A. retroflexus and G. max, as affected by N fertilizer application treatments (N), competition (C), and sample time (S).
NR aGS aGDH aHeight
RootStemLeafRORootStemLeafRORootStemLeafRO
A. retroflexus
N**************************************
C*****nsns**********ns***********
S***************************************
N × S***************************************
C × N***ns***nsnsnsns******ns*******
S × C************************************ns
S × N × Cnsns*******nsns***********ns
G. max
N**********************************
C**ns********ns********ns*****ns
S***************************************
N × S**********************************ns
C × N***ns***ns***nsnsnsnsns**nsns
S × C*******ns***********nsnsns*ns
S × N × C***ns**ns***nsnsnsns******nsns
a ns, Not significant (P > 0.05); * P < 0.05; ** P < 0.01; *** P < 0.001.

