1. Introduction
The provision of large-scale Light-Rail Transport (LRT) infrastructure that has been deprived of an adequate sustainability assessment may result in challenges that lead to high costs and undesirable socio-economic and environmental effects for the light-rail provider and users, especially for cities transitioning to LRT. Integration of sustainable development into local, state, and national development plans is very important and should be taken seriously when making the plans. In the past twenty years, there have been substantial changes in the provision of infrastructure facilities globally. The World Bank, governments of developing countries, and various donor agencies have been dissatisfied with the sustainability of their investments in public-sector infrastructure, especially during the 1980s and 1990s. These actors were all concerned that their investments were not having a lasting effect of the transport services, quality, and degree of usefulness that was initially anticipated, and they were also not in accordance with standards [
1].
The LRT system usually functions in urban surroundings and uses a rail-based technology to provide public transport. Vehicles are typically lightweight, move on steel rails, and are either driven by electricity [
2] or use diesel as fuel. Addis-Ababa Light-Rail Transport is a sort of modern day tram that has a reserved or segregated right of way on street segments and traffic lights [
3]. In the Addis-Ababa LRT case study that was carried out it was assumed that China replicated some of their innovations from the LRT in China to Addis Ababa since they are the custodians of the implementation and a major financier of the light rail system in Addis-Ababa [
4].
The following points can be made about the Addis Ababa LRT:
Is an electrified light rail transit
There are currently 41 stations
There is a double track for the whole route which has a standard gauge of 1.435 m
It is sub divided into two lines, namely North-South line—16.9 km and the East-West line—17.35 km
It has a total length of 34.25 km
The two lines share a 2.7 km section of the track in the city centre
It operates between 16–18 h per day [
5]
It has a targeted headway time of 6 min, but is currently only able to deliver 10 min due to the limited amount of LRT vehicles
Every LRT has a maximum service speed of 80 km/h and an average operational speed of 65 km/h
The network is designed to carry 15,000 passengers per hour per direction (PPHPD) [
5]
It has a 286 passenger carrying capacity
It has a capacity of 80,000 passengers/h (PPH)
The network is designed to carry a maximum of 115,000–120,000 people per day (PP/PD)
Sustainable development as explained in the United Nations World Commission on Environment and Development, acknowledged the Brundtland Commission (1987): “is the development that meets the needs of the present without compromising the ability of future generations to meet their own needs” [
6]. The main aim of sustainable transport is to move goods and people, while at the same time contributing to realizing economic, social, and environmental sustainability [
7]. Sustainable transportation goals include the delivery of efficient, effective, and safe access to transportation in the future while also taking into consideration social, environmental, and economic aspects [
8]. The European Union’s strategy for sustainable development defines sustainability with respect to transport as: “The ability to meet the needs of society to move freely, gain access, trade, establish relationships, and communicate without sacrificing other essential human or ecological values today or in the future” [
9]. Transportation system sustainability can also be defined as the results of the effects of the system on the social well-being, environment, and economy, which is measured by a system’s efficiency and effectiveness [
6].
The French Internal Transport Law (LOTI) necessitates that when cities are involved in major urban transport infrastructure systems which have used public funds, they assess the plans using criteria that confirm the socio-economic proficiency of the infrastructural assets. These assessments are implemented before and after the developments from a socio-economic perspective [
10]. Evaluations therefore need to be provided in a structure that guides policymakers to pinpoint the main reasons that are used to assess their decisions. These factors highlight risks, uncertainties, and trade-offs in particular [
11]. The European Union (EU) urban transport has revealed that 15% of all greenhouse gas emissions, 80% of congestion costs, 20,000 road fatalities per annum, and upwards of 100,000 untimely deaths are caused yearly from air pollution [
12]. There is sufficient evidence that European urban transport strategies are presently not close to being sustainable, but there are laudable projects, such as bike and car sharing, and provision of more public transport using renewable energy, which will gradually close these sustainability gaps [
13].
In several cities, urban rail transportation developments such as the metro, tram, and light rail systems have over the decades shown that they are the ideal key in providing sustainable mobility for the growing urban inhabitants. These forms of transport also provide additional advantages such as: high carrying capacities, shortened travel time, comfort, and more safety and reliability compared to other forms of transport. Rail systems are known to be very large projects that require high capital investments, particularly in the building of infrastructure and maintenance expenses. Excluding the economic profits, the environmental and social development benefits are also derived from rail system ventures [
14]. Therefore, the primary aim of this research was to identify how pricing and infrastructural innovations of a Light-Rail Transport (LRT) from a Chinese context was able to be successfully transferred to the Addis-Ababa city context. Secondly, the research aimed to reveal the economic, social, and environmental effects of these adapted innovations on passenger service delivery, what the Multi-National Corporations (MNCs) expected outcomes were, and what effect the resident proximity had while living and doing business along the LRT routes? Thirdly, it investigated what the identified re-adaptations to a more sustainable LRT might be with respect to passengers, MNCs, and residents.
This paper has been divided into the following sections;
Section 1 is the introduction,
Section 2 explains the theoretical framework,
Section 3 is the methodology,
Section 4 provides the empirical results and discussions, and
Section 5 presents a conclusion.
2. Theoretical Framework
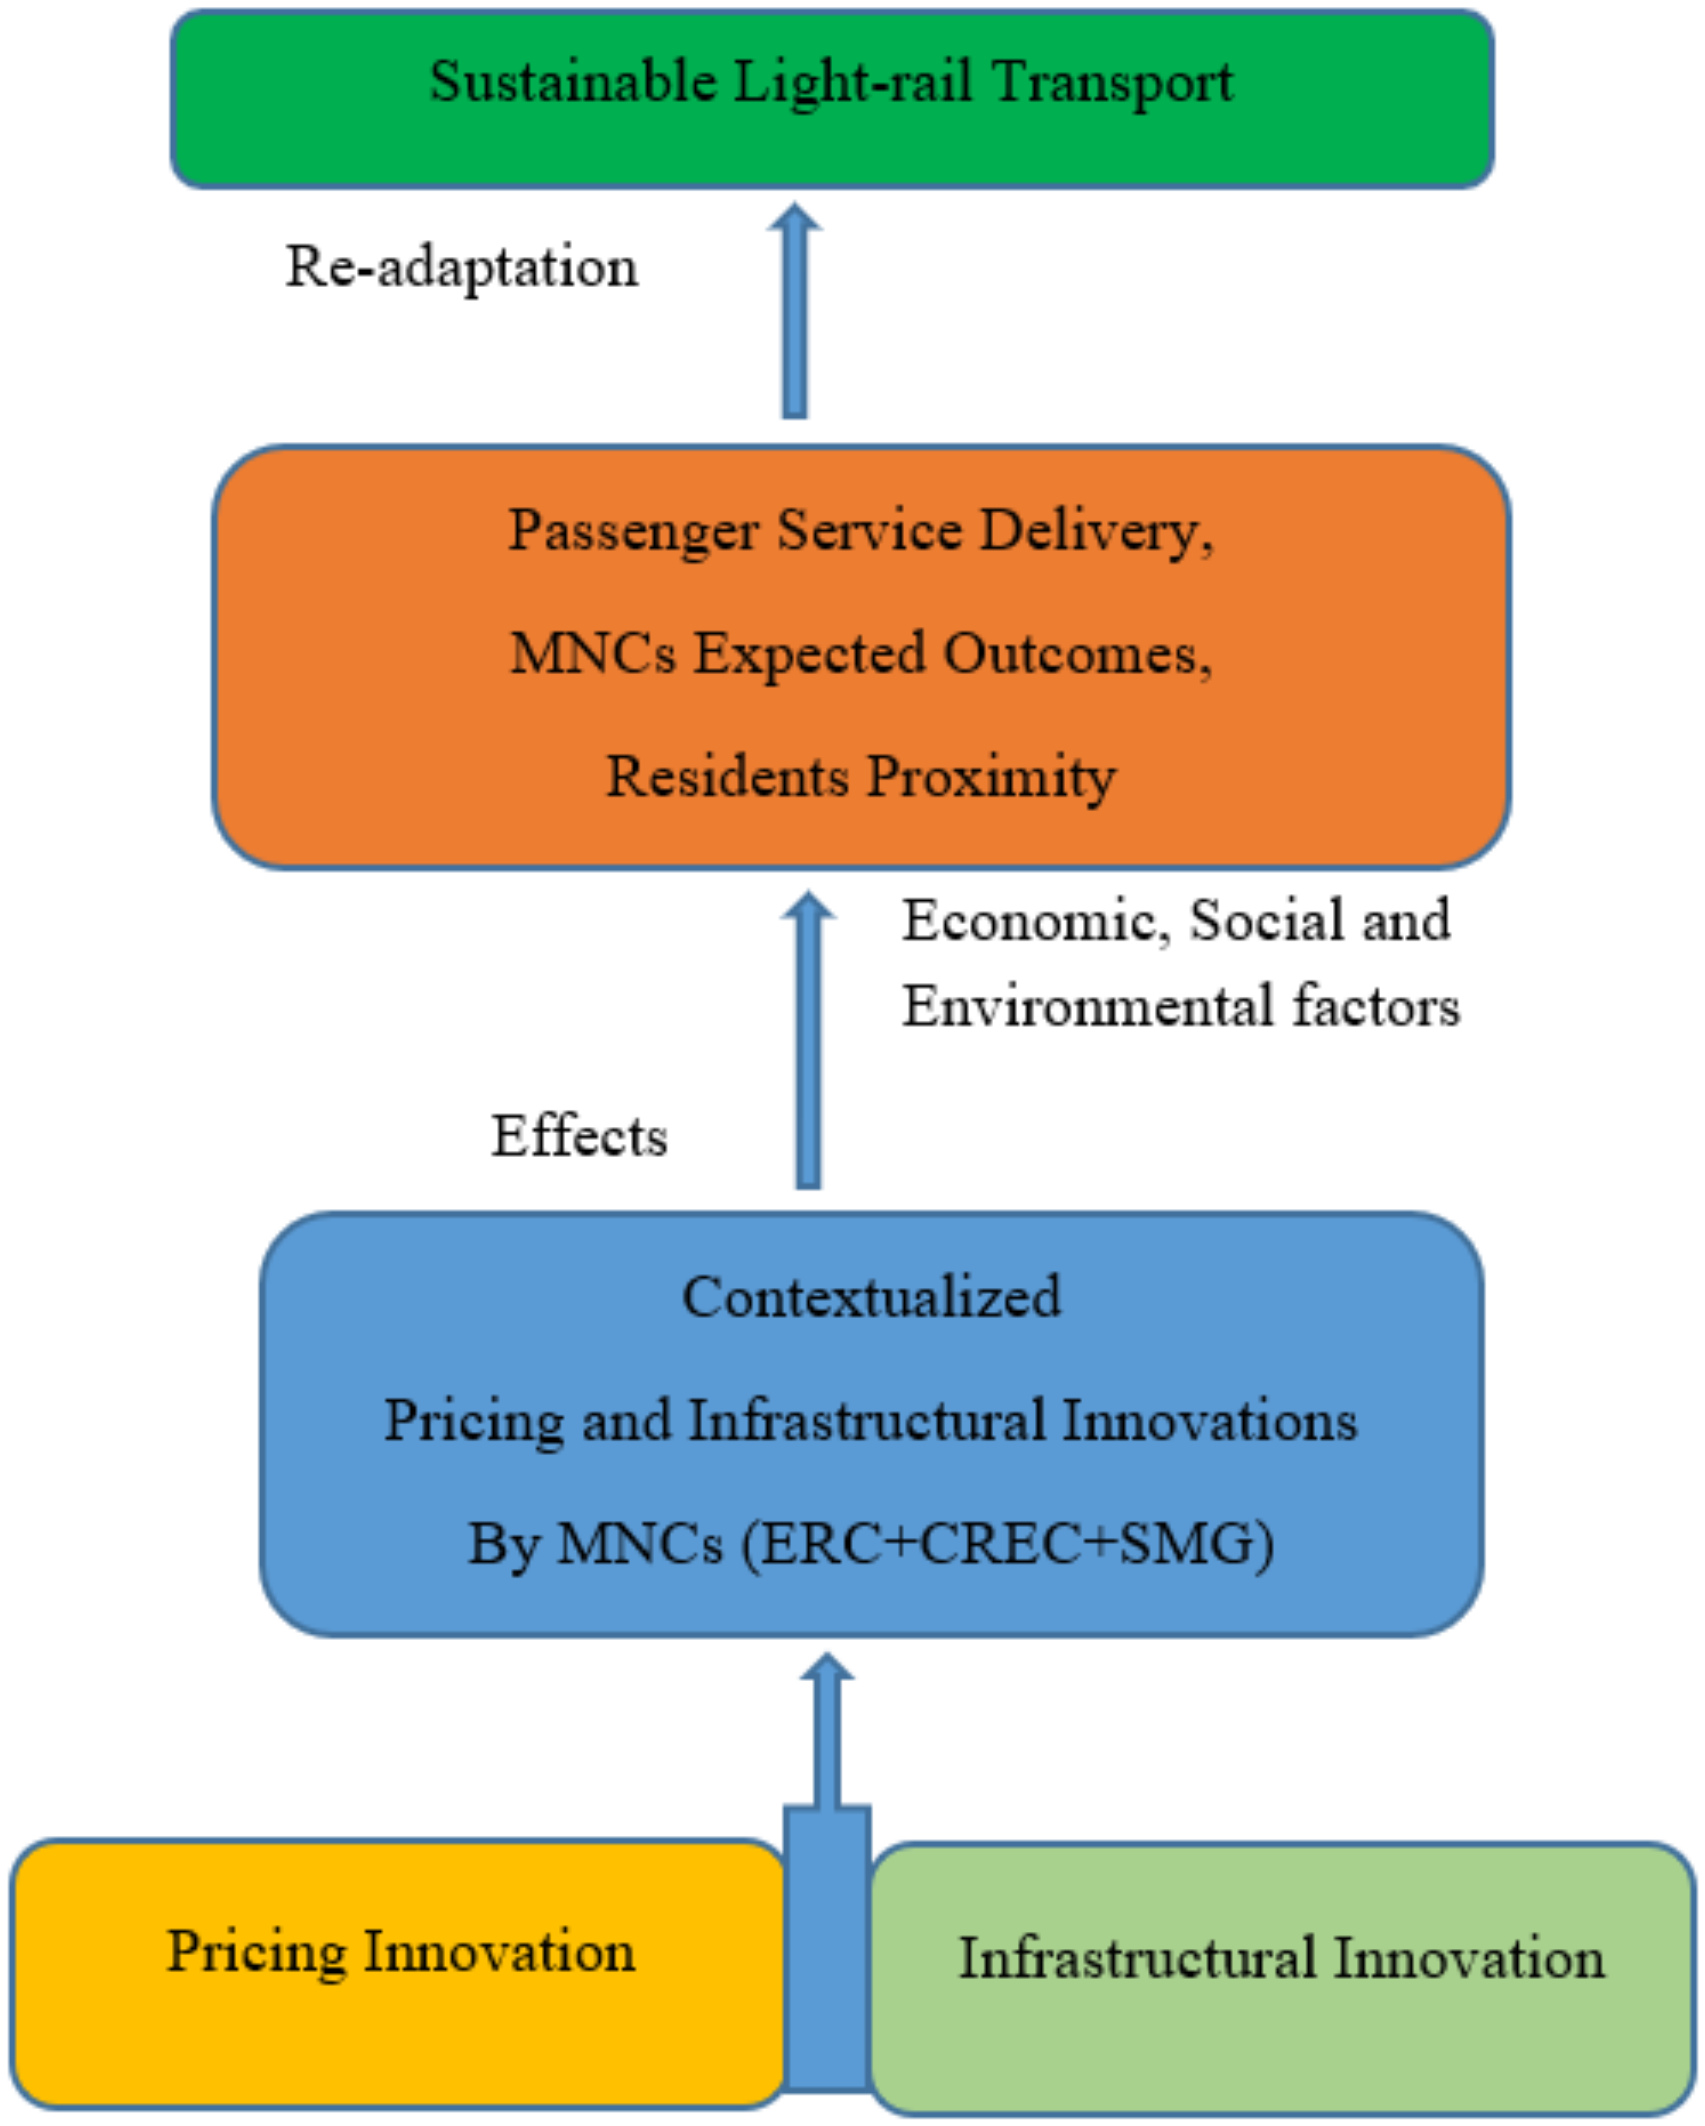
In this section, as shown in
Figure 1, the conceptual model describes the pricing and infrastructural innovation, and how they are both contextualized. In addition, the effects of economic, social, and environmental factors from the contextualized pricing and infrastructural innovations have been described. These effects are concerned with the passenger service delivery, Multi-National Corporations (MNCs) expected outcomes from the China Railway Engineering Corporation (CREC), Shenzhen Metro Group (SMG), Ethiopian Railway Corporation (ERC), and what effect the resident’s proximity had while living and doing business along the LRT route. Furthermore, re-adaptations have been proposed, with ideas to provide a more sustainable light-rail transport that considers the social, economic, and environmental factors.
In the theoretical framework of
Figure 1, sustainable Light-Rail Transport is the dependent variable, as it depends on the economic, social, and environmental factors in passenger service delivery, MNCs expected outcomes, and resident proximity. Pricing innovation, such as expected cash return for the MNCs, is dependent on economic factors after using a contextualized pricing system and effective use of electronic cards. Passenger service delivery is from infrastructural innovation. Infrastructure is needed at LRT stations, which need to be contextualized in order to suit the land space that is available, pedestrian needs, connectivity to other public modes of transport, spatial proximity to the stations by passengers, etc. [
4]. Furthermore, the proximity of the residents along the LRT routes originates from the presence or absence of some LRT support infrastructure, such as the demarcation structures between the roads and the LRT routes.
Pricing innovation is a pricing system innovation that is designed by a transport associated corporation to provide transport services to passengers, and can be characterized into pricing, fare structure, ticket, taxes, and parking pricing [
15]. This research focuses on components of the ticketing system and fare structure. This was chosen because they were the two notable aspects in the Addis-Ababa case study in the first two years of starting the LRT in Addis Ababa. Pricing innovations are comprised of the facilities which were supplied for the sale of fare tickets to the LRT passengers, such as ticket machines in LRT stations, sales personnel on the LRT vehicles, or outside of the LRT vehicles, such as ticket shops; ticket validation facilities on the platforms or inside the vehicles; types of fare structures according to zones, distance, or a flat rate for the whole distance.
The pricing innovation in the Addis-Ababa example was characterized into the devices or the places used in acquiring the tickets; the place where the ticket was validated before accessing the light-rail, at the entrance of the light-rail, or during the trip and the fare structure for passenger service delivery. The price is defined as the sum of money that a buyer or user must pay for a service or product [
16]. Pricing refers to the delivery of a service to the passengers based on the value customers perceive to have been acquired from the product and what they are prepared to pay for it. Therefore, a suitable ticket price, with regard to the service provided, can motivate the use of light rail based on some derived benefits, such as journey time and perceived value of time savings [
17]. The pricing strategy is one of the most important fundamental concepts to the achievement of a sustainable LRT system. According to Piercy; Cravens, et al. (2010) [
18], pricing should be altered from being a simple planned tool into being a strategic tool. This is because it can alter a customer’s actions and provide innovative market opportunities. Therefore, it should be acknowledged as an influential tool to promote user satisfaction and the firm’s viability [
19], which provides diverse and viable choices of pricing systems for the benefit of both the LRT operators and passengers.
In economic theory, there are three methods of calculating prices, which may be applied to transport services [
20,
21].
Costs method: The price includes the unit costs incurred by the company to provide services, as a price margin. This method is usually used.
Demand method: This is based on determining the price as an existing or anticipated demand.
Method based on competition: This is the approach where the price is determined based on price investigation of contending services, such as competitors like public bus operators, Bus Rapid Transit (BRT), taxi, and private bus operators. The LRT in Addis-Ababa used this method.
Infrastructure innovation is comprised of support for infrastructure, provides structures essential to support a passengers use of public transport, such as pedestrian accessibility infrastructure, park and ride, information provision for passengers, and public transport measures (priority and increased frequency) [
15], thereby advancing the level of usage of the LRT public transport system. Infrastructure innovation is introduced to benefit the safe movement of passengers, provide a high travel demand, real-time trip information to passengers, better accessibility and proximity to LRT platforms, reduce congestion and encourage modal change from private to public transport, such as the use of park-and-ride facilities [
4].
2.1. Sustainability in Light-Rail Transport
Sustainable transportation can be considered as an expression and demonstration of sustainable development in the transportation sector. Therefore, there is a need to integrate sustainable transportation concerns into the activities of transportation agencies. It is important to develop methodologies that will address and evaluate sustainable transportation within the regular transportation-planning paradigm. It must be noted that planning for trade-offs in inter-generational equity has been known to be very challenging in developing countries where sustainability is an uphill task [
22]. Sustainability can promote local economic growth and reduce air pollutant emissions through a modal shift from other motorized transport to the LRT. The social, economic and environmental effects can be deduced from their impact on the passengers, MNCs, citizens along the light-rail corridor, and the city.
Socially, sustainable urban transportation can be defined as transportation that provides adequate access to transport that minimizes social exclusion and improves or does not reduce an individual’s quality of life [
23]. The three aspects of social sustainability research are comprised of: social equity, quality of life, and social exclusion, with a common chord being the fair distribution of society’s benefits and challenges. Exclusion is the effect of spatial, temporal, financial, or personal challenges and quality of life, which can be measured subjectively. It is a multidimensional construct measuring the ability to seek happiness and fulfil needs, while equity means the fairness of allocating resources based on need, which can be varied in compliance with the total system’s efficiency.
To be economically sustainable means to have the ability of transport investment to advance economic growth at both the local and regional levels. The major transport benefit has been identified as travel-time savings, other benefits including employment generation and income for the government [
13]. It is important for all concerned to provide a realistic measurement of these benefits [
24]. How infrastructural investments can advance economic development is a vital question that decision makers are striving to answer in a logical manner. Transport improvements are also intended to create better economic mechanisms within broader urban active clusters, and these are related to spatial agglomeration gains and are connected to innovation and monetary benefits of new knowledge [
25].
The economic aspects of sustainable assessment in transportation are very crucial as they provide an enabling environment for investments to meet their profit margins, enabling them to maintain the systems. The concept of cost benefit analysis and multicriteria analysis is very useful in this respect, which also consequently determines the extent of funding instruments such as user-cost financing, public-private partnerships, and taxes [
26]. A conservation ethic might increase energy prices, which can be through a carbon tax, while implementing programs to weatherize buildings, increase vehicle fuel efficiency, improve alternative modes of energy, and increase industrial efficiency so that manufacturers and consumers can meet their needs with less resource consumption [
27].
Environmental sustainability impacts of transport are geared towards attaining a reduction in local atmospheric pollution, global warming, negative impact on plants and animals, impact of solid waste disposal on the environment, etc. Over the years this has given rise to developments such as technology for more efficient solid waste disposal methods to reduce the solid waste disposal effects and use of alternative fuel to decrease the dependence on non-renewable resources, and to also reduce pollution from the use of fossil fuels [
13]. In order to reduce CO2 emissions from road transport, an initiative of a significant modal shift in public transport is required. Trains and buses provide the obvious solution. This initiative also facilitates state policies such as a greenhouse gas budget [
26]. Therefore, offering sustainable transport choices, at a local level is important, as short-distance, local trips are where the biggest opportunities for people to change the way they travel can be found, as two out of three journeys are under five miles. Light rail schemes in operation have contributed to the removal of car trips from overcrowded roads which have led to the reduction in the amount of pollution caused by car exhaust fumes [
26].
2.2. Relationships between Contextualized Pricing and Infrastructural Innovations; Effects of Economic, Social, and Environmental Factors on Passenger Service Delivery, Residents, and MNCs; and Sustainable LRT
LRT was brought to Addis-Ababa city from China by CREC and SMG (Two Chinese corporations) in cooperation with the Ethiopian Railway Corporation (ERC), jointly they were able to design, construct and operate the Addis Ababa LRT. As the Addis-Ababa context is very different from any city in China, there is a need to contextualize the pricing and infrastructural innovations that have taken place in order to design, construct, and operate the Ethiopian LRT. Pricing innovations, such as methods of ticket provision, validation, and fare structures were contextualized and modified where necessary to suit the Addis-Ababa city case. In addition, the infrastructural innovations such as type, style, and positioning of provided infrastructure were contextualized, modifying different areas of the infrastructure to suit Addis-Ababa.
After contextualization, the following points were analyzed: economic, social, and environmental effects; how the passenger services were delivered for sustainable use; whether the MNCs expected outcomes were met; and what the effect was on the residents and business owners along the LRT. These sustainability factors as effects of the contextualized innovations are further discussed within the results in
Section 4.
3. Methodology
In this section, the single case and mixed method of qualitative and quantitative research approaches employed is explained. The sampling methods, sample size, and different respondent groups are also fully described.
Research Strategy
This research employed a mixed method of qualitative and quantitative approaches in a single case study of Addis-Ababa city [
28]. The qualitative method entailed a two-step approach of (a) pilot interviews [
29], using open-ended questions as a pre-test, carried out in 2015 followed by (b) two rounds of in-depth interviews using semi-structured questions. The goal of the pretest was to guarantee that the types of instruments that would be used in the main test sufficiently communicated the anticipated research questions, values, reported facts, and behaviors [
29]. Thus, the pilot interviews were able to provide a credible and sound research approach and interview protocol in which the pilot survey confirmed whether the variables that were measured existed in the study area, as the area of research was relatively new. This made it possible to streamline the related semi-structured questions from the pilot survey into more specific semi-structured questions during the first and second round interviews.
The first round of interviews took place in 2015, while the second round took place in 2017, both with a total of twenty-two respondents. The second round of interviews was necessary in order to collect data from the operational phase to be able to compare the responses over time. As there was a difference of almost two years between the first and second round of interviews which gave the experts about 24 months of experience with the operation of the LRT, in turn it would provide more comprehensive data on how the infrastructures and pricing systems had been adopted or changed within two years. Five respondents took part in the pilot interviews in 2015, six during the semi-structured interviews in 2015 and eleven during the second round of semi-structured interviews in 2017. The research initially targeted double the executed sample size but was constrained due to the limited number of Ethiopian and Chinese LRT experts that were available to provide the specific and required feedback, i.e., targeting experts who were knowledgeable enough on how the cities were able to adapt the LRT. As one of the Ethiopian LRT top experts mentioned, “It has been commented by fellow workers that we are limited on the knowledge know-how, and lots of things are yet to be known”.
Using case studies provided a more robust understanding of the social characteristics of adoption of innovation in infrastructure provision [
30]. This approach to research was applied to real-life settings, which also focused on studies with small units and large variables [
31,
32]. According to Altmann and Engberg (2016), in public transport institutional analysis, variables are better analyzed qualitatively, which needs in-depth methodologies, such as semi-structured interviews which provides deeper and more comprehensive data, depending on the specific context of study. It makes the data that is collected more comprehensive, because it is obtained by collection of respondents’ opinions, using various sources and concepts related to actors, their related groups, and their interactions are taken into consideration [
33].
The quantitative approach entailed the use of survey questionnaires for a total of 254 passengers. These 254 respondents were comprised of passengers along the North-South (N-S) line—16.9 km and the East-West (E-W) line—17.35 km. The surveys were carried out during transit and finally resulted in almost an equal balance of respondents along the N-S and E-W lines, with a percentage ratio of 48% to 52%, respectively. In addition, the quantitative approach first began with a qualitative approach, using a focus group discussion method with 6 respondents to discuss questions which were proposed to be in the survey in order to get feedback on the real situation on the ground, which was essential in testing and re-structuring the final survey questionnaire for LRT passengers in Addis-Ababa. The pilot interviews and focus group discussions further establish the validity and reliability of the research instruments.
The 6 focus group respondents comprised of two students, two civil servants, one entrepreneur, and one technician in a female-to-male ratio of 2:4. These selected respondents used the LRT an average of 4 times per week. To calculate the sample size and a confidence interval, the Addis-Ababa population statistics of 2015 was used on 4,216,000 people. Therefore, using a confidence level of 95% and confidence interval of 6, the sample size needed was 267 users of the LRT, as deduced from the confidence interval and sample size calculator to be within the required figure from the total population. However, due to some non-response surveys, eventually 254 were completely administered in total. The non-response surveys accounted for a difference of 13, which is not significant enough to influence the total number of 254 respondents surveyed. Thus, the total sample size used was adequate and justified enough to generate reliable results.
The sampling method that was used was a purposive sampling method which was selected because it was based on characteristics of the population, i.e., LRT experts and LRT passengers, and it also considered the objective of study. The processes of LRT adoption and actions involving many individuals within the light-rail organizations—ERC, CREC, and Shenzhen Metro were a basis for the interviews.
In the qualitative approach, the coverage method entailed the coverage population, which included the Ethiopians (Addis-Ababa LRT experts working with ERC) and Chinese (LRT experts from the Chinese consortium working with CREC and SMG). This specific selection was made in order to acquire up-to-date data and reasonable information from the multi-actors based on their respective daily experiences and direct involvement with the LRT on a more frequent basis with adequate expertise qualifications as mid and high-ranking experts. This enabled the respondents to relate their experiences on the ground with their expertise as engineers and managers. Thus, concepts qualifying these interactions and processes were drawn from the data that were acquired during the pilot test and semi-structured interviews.
While the quantitative approach entailed the LRT passengers along the two available N-S and E-W lines in operation, the analysis instrument used to code the data gathered for the qualitative approach was the Atlas-TI software, which facilitated the categorizing of the various levels of data, generating a robust data set capable of deducing categories from the data. The quantitative approach used the Statistical Package for the Social Sciences (SPSS), to code results before creating pie charts and percentage results where applicable.
Table 1 shows the operationalization of different concepts, variables and indicators.
4. Empirical Results and Discussions
This section presents the empirical results and their related discussions based on contextualized pricing and infrastructural innovations; passenger service delivery; expected MNCs outcomes; and what effect the resident’s proximity have living and doing business along the LRT route; and sustainable Light-Rail Transport.
4.1. Pricing Innovation
4.1.1. Methods of Ticket Provision and Validation
Ticket shops for the purchase of tickets by the passengers were not the original plan for the LRT system by the ERC and the MNCs. One of the top directors mentioned that “the ticket shops were an emergency plan after completing the LRT for operation, it was not part of the original plan of the ERC and MNCs”. It became an emergency plan which was put into practice when the LRT started transporting passengers. The emergency plan was executed because the earlier plan of using digital Integrated Cards (IC) or electronic cards by the passengers, which would be validated on the already installed ticket validation machines in the entrance to the LRT vehicles, was not appropriate for use. This was due to the high travel demand of the LRT. The check in-out procedure in embarking and disembarking from the LRT became practically impossible and possibly dangerous due to the unforeseen large number of passengers. Thus, the ERC and MNCs decided to use paper tickets as an alternative solution. Paper tickets were sold in ticket shops close to the LRT platforms at each LRT stop, while LRT stops with an interchange also shared one ticket shop. Therefore, the pricing system became an off-board ticket sale at ticket shops and on-board ticket validation by ticket officers who checked the tickets bought by the passengers before they boarded the LRT and inside the LRT during commuting [
4].
4.1.2. Fare Structure
In the economic theory, as mentioned in the theoretical framework, the three approaches of computing prices, relevant to transport services are costs, demand, and competition methods [
20,
21]. The ERC and MNCs chose the method based on competition, this approach was achieved through a visibility study of the transport fares of private transport such as private and public taxis and buses, which used the same corridor route as the LRT since the LRT also used a large percentage of the road routes above ground as an over-pass and in some areas below the ground as an under-pass. This method was used as a comparison with the LRT competitors, such as the taxis and buses, in order not to charge the passengers the same price and be competitive. The passengers were charged a lower fare than most of the other transport modes so that it was a competitive price and affordable to the passengers.
Consequently, the fare price was introduced as pricing by zoning system, with a price of 2, 4, and 6 Ethiopian Birr (ETB) ((ETB) Ethiopian birr—Ethiopian national currency, with an equivalence present rate of 27.7 ETB to 1 USD (dollar)). Under half the route costs 2 Birr. Between half and three quarters of a route costs 4 Birr. Three quarters and a whole route costs 6 Birr. The initial master plan of using the electronic cards had a fare structure based on a distance method. Whereby the passengers paid based on every stop, meaning every LRT stop had a slight difference in price compared to the other. One of the top-level engineers mentioned: “We are presently thinking of using a flat rate of 5 birr for everybody, regardless of if it is short or long distance, to curb this fare evasion menace”.
4.2. Infrastructure Innovation
4.2.1. Type, Style, and Positioning of Provided Infrastructure
Type of Head-Way Time
The minimum headway is the shortest distance or time achievable by the LRT without a reduction in the speed of the vehicles. The ERC, CREC, and SMG targeted frequency of the LRT to be a maximum of 6 min headway time, with plans to further reduce the headway time for better reliability in the future. However, the delivered head-way time of the LRT was 10 min on average, this was due to the limitation of only 41 LRT vehicles, which was not enough, considering the number of passengers using the light-rail.
The high demand for the LRT exceeded the capacity provided, which consequently led to some negative effects, such as the LRT being less comfortable for the passengers due to the congestion during rush hours, unrealistic swiping of electronic cards on validation machines on the LRT, fare evasion and loss of income revenue to ERC and MNCs from ticket sales due to fare evasion. A senior engineer shared his viewpoints: “Our plan is to achieve a 98% reliability factor for the LRT, but for now we only have 41 light-rail vehicles on the ground, each with a 286-passenger carrying capacity, therefore we are unable to meet our targeted plan of 6 min. But we believe we can achieve it when we have more finance to purchase more LRT vehicles.”
Park and Ride
Park and ride facilities were planned for 6 LRT stations. The park and ride facilities were planned to be part of commercial mega malls as a Transit-Oriented Development (TOD). Cars and other vehicles can park with a fee, and then they are able to continue their journey using the LRT. Drop off points were provided and more will be provided for other public transport systems, like buses and taxis, to be able to drop off passengers who intend to use the LRT or transport the passengers home on routes that the LRT does not cover. Thereby serving as a feeder system, to support travel demands and maintain a good flow of passengers changing their transport modes from busses or taxis to LRT or vice versa, which consequently fosters modal change to LRT, as a public transport.
As of June 2017, 12 escalators and 25 lifts were provided in certain stations based on needs, such as elevated platforms and interchange stations. These aid faster access to the LRT and they support the elderly for easy access to the LRT [
4]. A mid-level engineer mentioned that: “The stations with park and ride facilities will generate income for us to further support the maintenance of the rolling stock, as a TOD, since the LRT system is for non-profit”.
Ticket Shops
Ticket shops were constructed as an emergency measure, as the already installed ticket validation machines were unable to work due to the non-envisaged travel demand, which made the use of a check-in and check-out processes of ticket validation impossible. The use of ticket shops with ticket sale agents was the only option that was adapted. Electronic ticket sales or top-up machines at designated LRT stations and a turnstile as a validation machine on the platforms were still being debated upon as a more appropriate option to further support the already existing ticket shops at every station. The ticket shops had their own problems such as pedestrian safety while crossing the road to purchase tickets and rushing back with speed to catch a LRT which was about to move [
4]. It is not possible to buy a ticket from the LRT officials, as they only check the already bought tickets to validate them. A mid-level engineer explained that: “We hope the electronic tickets and other information technology related devices which are presently being discussed as options to reduce the crowd buying tickets at the ticket shops will come into reality soon”.
4.3. Re-Adaptation for Sustainable Light-Rail Transport
The effects on passenger service delivery, MNCs expected sustainable positive outcomes and the effect of the resident’s proximity to living and doing business in the areas along the LRT route was also expected to be positive. If the residents living and doing business along the LRT routes were discontent with the LRT, then this would need to be analyzed as to why and if necessary, further re-adapted would need to occur if the results were negative.
Contextualizing innovations when the LRT was initially constructed did not automatically guarantee a positive outcome. It forced the ERC and MNCs to re-evaluate and consequently go through another process of negotiations as multi-actors to re-adapt certain aspects of the pricing and infrastructural innovations. How each of these contextual factors have influenced some level of re-adaptation are explained in the paragraph below.
The non-availability of ticket sensor barriers on the platforms caused a high level of fare evasion. This forced the multi-actors to go back to the drawing board to find a solution to this problem, they subsequently built emergency ticket shops. The option of barriers such as turnstiles is currently being strongly considered as a re-modification of the current station, as the electronic devices which were in the original plan were unable to be activated for use. Even though the LRT has narrow platforms which does not favor the construction of barriers on the LRT platform itself. The possibility of expanding the platforms was not an option at this late stage but it is being considered for new LRT stations in the future. The use of turnstiles is also being considered because the multi-actors are not satisfied with the emergency plan of paper tickets, which has also caused fare evasion. As confirmed by one of the top engineers, who said, “We are considering constructing some sensor barriers at the platforms, because the fare evasion is high, but the platforms are not that big to allow better flow on the platforms during rush hours, however it may cause some traffic at the platforms, which may extend into the roads, causing concerns for human safety on the roads”.
The travel demand was underestimated as to what degree of the population of Addis-Ababa city would embrace the LRT. A few weeks after the start of the LRT, it was observed that the use of LRT was overwhelmingly embraced by the people, most of the users used it during the peak periods which caused a high level of congestion during these times. This caused a congested travel pattern at the entrance and exit to the platforms, which made the original plan of an electronic card system of mounted sensor devices onboard the LRT useless. This necessitated a complete re-adaptation of the fare pricing system from an electronic device on the LRT platforms to the ‘emergency plan’ of ticket shops at every LRT station, which are approximately two minutes by LRT from each other.
It was confirmed by a top ERC engineer that there was an average of 30% fare evasion due to the less secured use of paper tickets. The negative impact of fare evasion encouraged the multi-actors to re-think what was needed to re-modify the fare system again to either a flat rate of 5 Ethiopian Birr (0.178 US Dollars), regardless of the length of the trip, or re-invent the electronic card devices, perhaps on the LRT vehicles, instead of being on the platforms, or provide barriers at the platforms. It was noted that by increasing the number of agents that checked the tickets on the LRT was not an option as they would be unable to effectively handle the overwhelming numbers of commuters during the rush hours.
4.4. Re-Adapted Pricing and Infrastructural Innovations
Types of Re-Adaptations to LRT at Design, Construction, and Operational Phases of the Pricing System and LRT Support Infrastructure
The original pricing system needed to be changed, which was comprised of a method of ticket provision, a method of ticket validation, and a fare structure. In the pricing system, at the design stage, it was designed as an on-board ticket validation system using integrated cards and specific doors as an entry to and exit from the LRT. However, due to the non-envisaged high travel demand and the ticket validating machines non-functioning issues, from the commencement of the operation stage the whole system was completely changed to using paper tickets which were bought from ticket shops and ticket officials to sell tickets. One of the top ERC engineers revealed that “The challenge was foreseen during the design/construction phase, but the rolling stock has already been integrated with the installed ticket validation machines by the CREC, hoping it may be useful in the future, as having a ticket validating machine on board a LRT is one of the best standard practices”.
There were some changes in the modifications of the support infrastructure during the period when the LRT was being built. These modifications included the bridge over-passes and the underground tunnel under-passes and provision for the non-envisaged ticket selling shops. The over-passes and under-passes were not foreseen as necessary, but when it was not possible to relocate some major buildings, utilities or roads, at the construction stage, the design was partially altered, and they built extra bridges and tunnels. This was considered challenging, as it took more time to implement. Electricity and telecommunication lines as well as water utilities, which were under the ground also had to be taken into consideration. As a proportion of the LRT shares the road with other vehicles, this also needed to be integrated into the road infrastructure that already existed, a right-of-way system was necessary for the LRT, which also had to be incorporated into the infrastructure plans.
4.5. Social and Economic Effects of Re-Adapted Pricing Innovation on LRT Passengers
4.5.1. Inconvenience to Passengers
The inconvenience to passengers due to the re-adapted pricing innovation was considered a social effect, as it hampered their safety, well-being, and quality of life with stress and inconvenience in order to purchase a ticket. There were complaints from the passengers who were required to cross busy roads to buy tickets, as the ticket booths were located only on one side of every LRT station. This also generated safety issues, as some people crossed the road to return to the LRT platforms without using the zebra crossings, which were provided for pedestrians. Vehicles also needed to be more careful, as passengers crossed the roads in a haphazard manner, which in turn generated confusion and safety issues to drivers and pedestrians crossing the road. One of the mid-level engineers stated that “We have been told by some passengers that sometimes they struggle to run back to the LRT platform after buying a ticket across the road, because the ticket shops are located only on one side of the road close to the platforms”. As the pedestrian does not want to miss his/her train, they try and take a shortcut and often cross the road without using the provided zebra crossings, which can cause chaos between the potential LRT passenger(s) and motorists who are also in a hurry to move, which itself is a safety concern.
4.5.2. Unrealistic Swiping of Electronic Cards on Validation Machines on the LRT
The LRT in Addis Ababa is exceedingly well used, but unfortunately it is also very congested with passengers both sitting and standing. The already mounted validation machines were not as handy as first predicted when they were mounted in every LRT. The passengers were either unable to reach them when either getting into or getting out of the LRT or it took too much time to swipe the cards which held up the transport.
Consequently, with the introduction of a paper ticketing system it had economic effects, as it made some passengers pay slightly above what they would have paid if they were able to use the electronic cards to pay according to their distance and not according to the price zoning system of 2, 4, and 6 Birr, some paid less and some avoided paying at all. One of the high-level engineers from Ethiopia mentioned that “We envisaged this challenge of inability to use the electronic machines before the operations, but the LRT rolling stock had already been manufactured in China, although we mentioned that we foresaw such issues arising it was not taken into consideration by our Chinese partners”. Another mid-level engineer re-affirmed this, saying, “We envisaged that it would not be possible to only use two doors for entry and two doors for exit, because the travel demand was expected to be high, and it was foreseen that the passengers would not be able to patiently wait to swipe their cards before entry and exit, and it was not taken into consideration that the people of Addis-Ababa would be new to using the new transport system”.
4.5.3. Time Wastage due to Ticket Sales in Ticket Shops
Long queues were often experienced when purchasing a ticket, especially at interchange stations, of which both have the N-S and E-W lines passing through them, and at stations in highly populated areas. This makes the passengers miss their LRT connections sometimes or make them run across the road to the LRT platform in a haphazard manner, with less caution for safety just to save travel time. This leads in turn to the economic effect of time resource waste. A mid-level transport engineer mentioned that “This situation is very common, especially during the peak hours 8 am to 11 am and 4 pm till 8 pm, we see people moving in a haphazard manner, trying to buy their tickets in a long queue or a crowded setting. This sometimes raises issues of security, such as theft and safety such as accidents while crossing the roads at the zebra crossing or not, with fast moving vehicles on the road”. These safety and security issues are classified as a social effect, because it is related to quality of life, as represented in
Table 2.
4.6. Types of Effects on MNCs Outcomes due to Re-Adaptation
The following effects on MNCs, which have been represented in
Table 3, explain some of the outcomes as a result of re-adaptation, especially if the outcomes are negative.
4.6.1. Fare Evasion
Evasion of fare payments on public transport is a major problem for not only buses and trams but also LRT systems around the world that have not implemented an effective method of fare enforcement. As well as the ethical issues it raises, evasion can if unchecked, become a major contributor to an operating deficit [
35]. Due to non-consistent ticket validation by ticket officials on the LRT platforms and inside the LRT, and not enough ticket officials to deal with the excessive numbers of passengers, caused an inadequate coverage of ticket checks. This consequently caused fare evasion by some of the passengers, which has led to an economic effect, as shown in
Table 3. This effect is partly because the tickets have not been checked before entering the LRT or during transit and due to the LRT being a very popular mode of transport with a high clientele.
All interviewed respondents mentioned fare evasion as the major negative effect for the MNCs. One of the directors said: “Some passengers just want to have a free ride, by buying a ticket for a short distance but going from the beginning to the end, because we don’t have enough ticket checking officials inside the LRT”. Another high-level engineer emphasized that: “Some passengers don’t even buy a ticket, they just go on the LRT, since there is no barrier before entry onto the platforms and use the LRT for free”. “We noticed and calculated that at least about 30% of the passengers evade the fare one way or the other”.
It was further explained that the platforms were narrow, so therefore it was impossible to meet the requirements to be able to install an off-board ticket-validating machine on the platforms, such as a turnstile, which only opens automatically when in contact with an electronic ticket. However, the use of this type of turnstile on the narrow platforms would result in elongated queues from platforms into the nearby roads, causing road congestion that could be dangerous. This was one of the reasons that the paper tickets and ticket shops were adopted at every LRT stop, it was an emergency plan, which in turn caused fare evasion. A senior director in the service department mentioned that “Our initial targeted plan was to provide automated cards only at designated areas of the city, whereby the passengers could easily purchase them throughout the city”.
4.6.2. Loss of Income Revenue to ERC and MNCs from Ticket Sales due to Fare Evasion
An average of 30% of passengers are guilty of fare evasion in Addis Ababa, as mentioned by 15 out of 17 respondents during the semi-structured interviews. People struggle to get a space to stand inside the LRT, and if you wish to get a seat then you need to commence your journey from the beginning of the LRT line.
The paper tickets were dysfunctional, as they were unable to sustain the revenue needed for cost recovery over the concession years and LRT maintenance needs, which has caused a reduced cost recovery. One of the top directors stated that “The 30% average of fare evasion is quite huge, which will strongly affect the cash flow as income revenue, if not stopped in the long-run, because we know the LRT is for non-profit, but at least we need the revenue from tickets to maintain the LRT rolling stock, as much as possible”.
This economic effect means that fare evasion can lead to poor maintenance of the LRT in the long run, if something is not done about it, this could lead to a loss of concession revenue for the ERC and MNCs.
4.6.3. Extra Expenses Incurred in Selling Tickets at Ticket Shops
The tickets shops were built as an emergency alternative so that the LRT could commence public transport as soon as possible in 2015. The ticket shops were built at every LRT stop or station, which has an average of two minutes between each stop. This resulted to building many tickets shops at a cost, these costly expenses were not planned for within the operation, and it also led to an unexpected employment of ticket officials who needed to receive a monthly salary. This consequently led to an economic effect, which caused a search for more finance to build the ticket shops, as it was not part of the initial budget, however it may still be within the extra contingency budget. One of the top managers re-affirmed that: “We did not spend beyond the normal allocated budget for the LRT, it is within the budget”.
4.6.4. Difficulty Locating Closer Points for Ticket Shops and Extra Cost of Resettlements
There were challenges in locating suitable locations at a good proximity to the LRT platforms for the ticket shops. This was accomplished by buying property, and financially compensating residents who owned the buildings and had to be relocated. It also had an economic effect of higher costs. A mid-level head of unit mentioned that “We went through a lot of challenges, trying to secure ticket shop spaces with good proximity to the roadsides, where the LRT will follow. It was a tough battle, but we were able to secure most of the shops at good proximity locations to the LRT stops using monetary means to resettle the original dwellers”. These resettlements were characterized by third-party issues, which are buildings belonging to third parties (public), who dwell along the LRT routes.
4.7. Type of Effects on Addis-Ababa Resident’s Proximity and Business Owners Along LRT Routes
4.7.1. Economic Effects on Resident’s Proximity and Business Owners Along the LRT Routes
The two sides of the rail tracks are separated from the roads by a fence of 1.2 m in height and 2.4 m in length, these fences were placed as a safety measure, in order to avoid pedestrian accidents. Zebra crossings were only located in the vicinity of LRT platforms along the LRT routes. These are on average 0.8 km apart from each LRT station. As the zebra crossings are only at the stations it is not possible for the general public to cross the roads between the stations. Thus, causing difficult access to shops on either side of the fences.
This has had some economic effects and substantial monetary loss to some business owners. As mentioned by one of the respondents, “Shop owners are frustrated, because they have lost customers who visited them from the opposite side of the road, as there is no possibility to cross the road near their shops, thereby decreasing their customer patronage and personal business income”. Another shop owner added that “We no longer get as much customer patronage as we used to before the construction of the light-rail, as people need to walk a greater distance before being able to access our shops.” The fences run along all of the 34.25 km railway lines, having a pedestrian crossing space at 39 points that are all reserved for railway stations. Among the 39 stations, 3 are located underground, 9 on bridges, and 27 at ground level. More overpasses and other crossing points are currently being considered to be built to ease the movement of people.
Roadsides along the LRT routes are dominated by commercial shops engaging in various commercial activities, such as telecommunications, restaurants, food shops, electronic shops, fashion shops, etc., which are all a source of livelihood for the shop owners. Before the LRT, the residents were able to cross at any point to get to the other side of the road, but after the construction of the LRT, they were forced to walk an average of five to ten minutes before they are able to cross to the other side of the road. Only shops located next to LRT stations have easy access to the other side of the road via the LRT platform, which takes less than one minute. The LRT safety barriers have caused a loss of time for the residents who want to purchase things on the opposite side of the road, and it has reduced sales for the commercial shop owners along the LRT route. Both are economic effects which are described in
Table 4.
4.7.2. Increase in Fare Rate by Taxis Along LRT Route due to Extended Length of the Trip due to the Safety Barrier
Taxis in Addis-Ababa have had to increase their commercial rates slightly, due to the fence demarcating the LRT from the roads. Before the LRT they were used to maneuvering at junctions or U-turns at short distances, but now their journeys have increased in order to make a U-turn in order to be able to drop a passenger at the other side of the LRT route. This was noted during a personal conversation with a taxi driver that charged the author more than expected on a route that had been taken several times before. When the taxi driver was asked for the reason he answered that, “Before we don’t have the LRT dedicated route, so we can make a U-turn within short distances. But now, we need to go extra distances before we can access a U-turn, thereby burning more fuel and using more time, which demands for more money from our passengers”. Thus, the LRT safety barriers have led to an economic effect of more financial spending by the taxi owners, as they need to purchase more petrol or diesel to cover longer distances before accessing the U-turns.
4.7.3. Increase in Travel Distance and Time for Pedestrians
Pedestrians living far from zebra crossings along the LRT route now need to walk an average of an extra distance of 1 km before reaching their destination. Although this has a health benefit, some pedestrians are discontent as they are not used to walking such distances before reaching their destinations. Thus, having an economic effect due to wasted time is a resource, which can be used for other things to generate money. One of the pedestrians said, “It is a bit frustrating that we need to walk for more than 5 min to places we need to just cross over to the other side of the road, which usually takes us less than 15 s.”
It was also observed that the intersections where the pedestrian crossings exist do not only have the LRT passenger traffic to access the platforms, but they also have people using the crossing to buy paper tickets, or to cross the road to do their usual daily business.
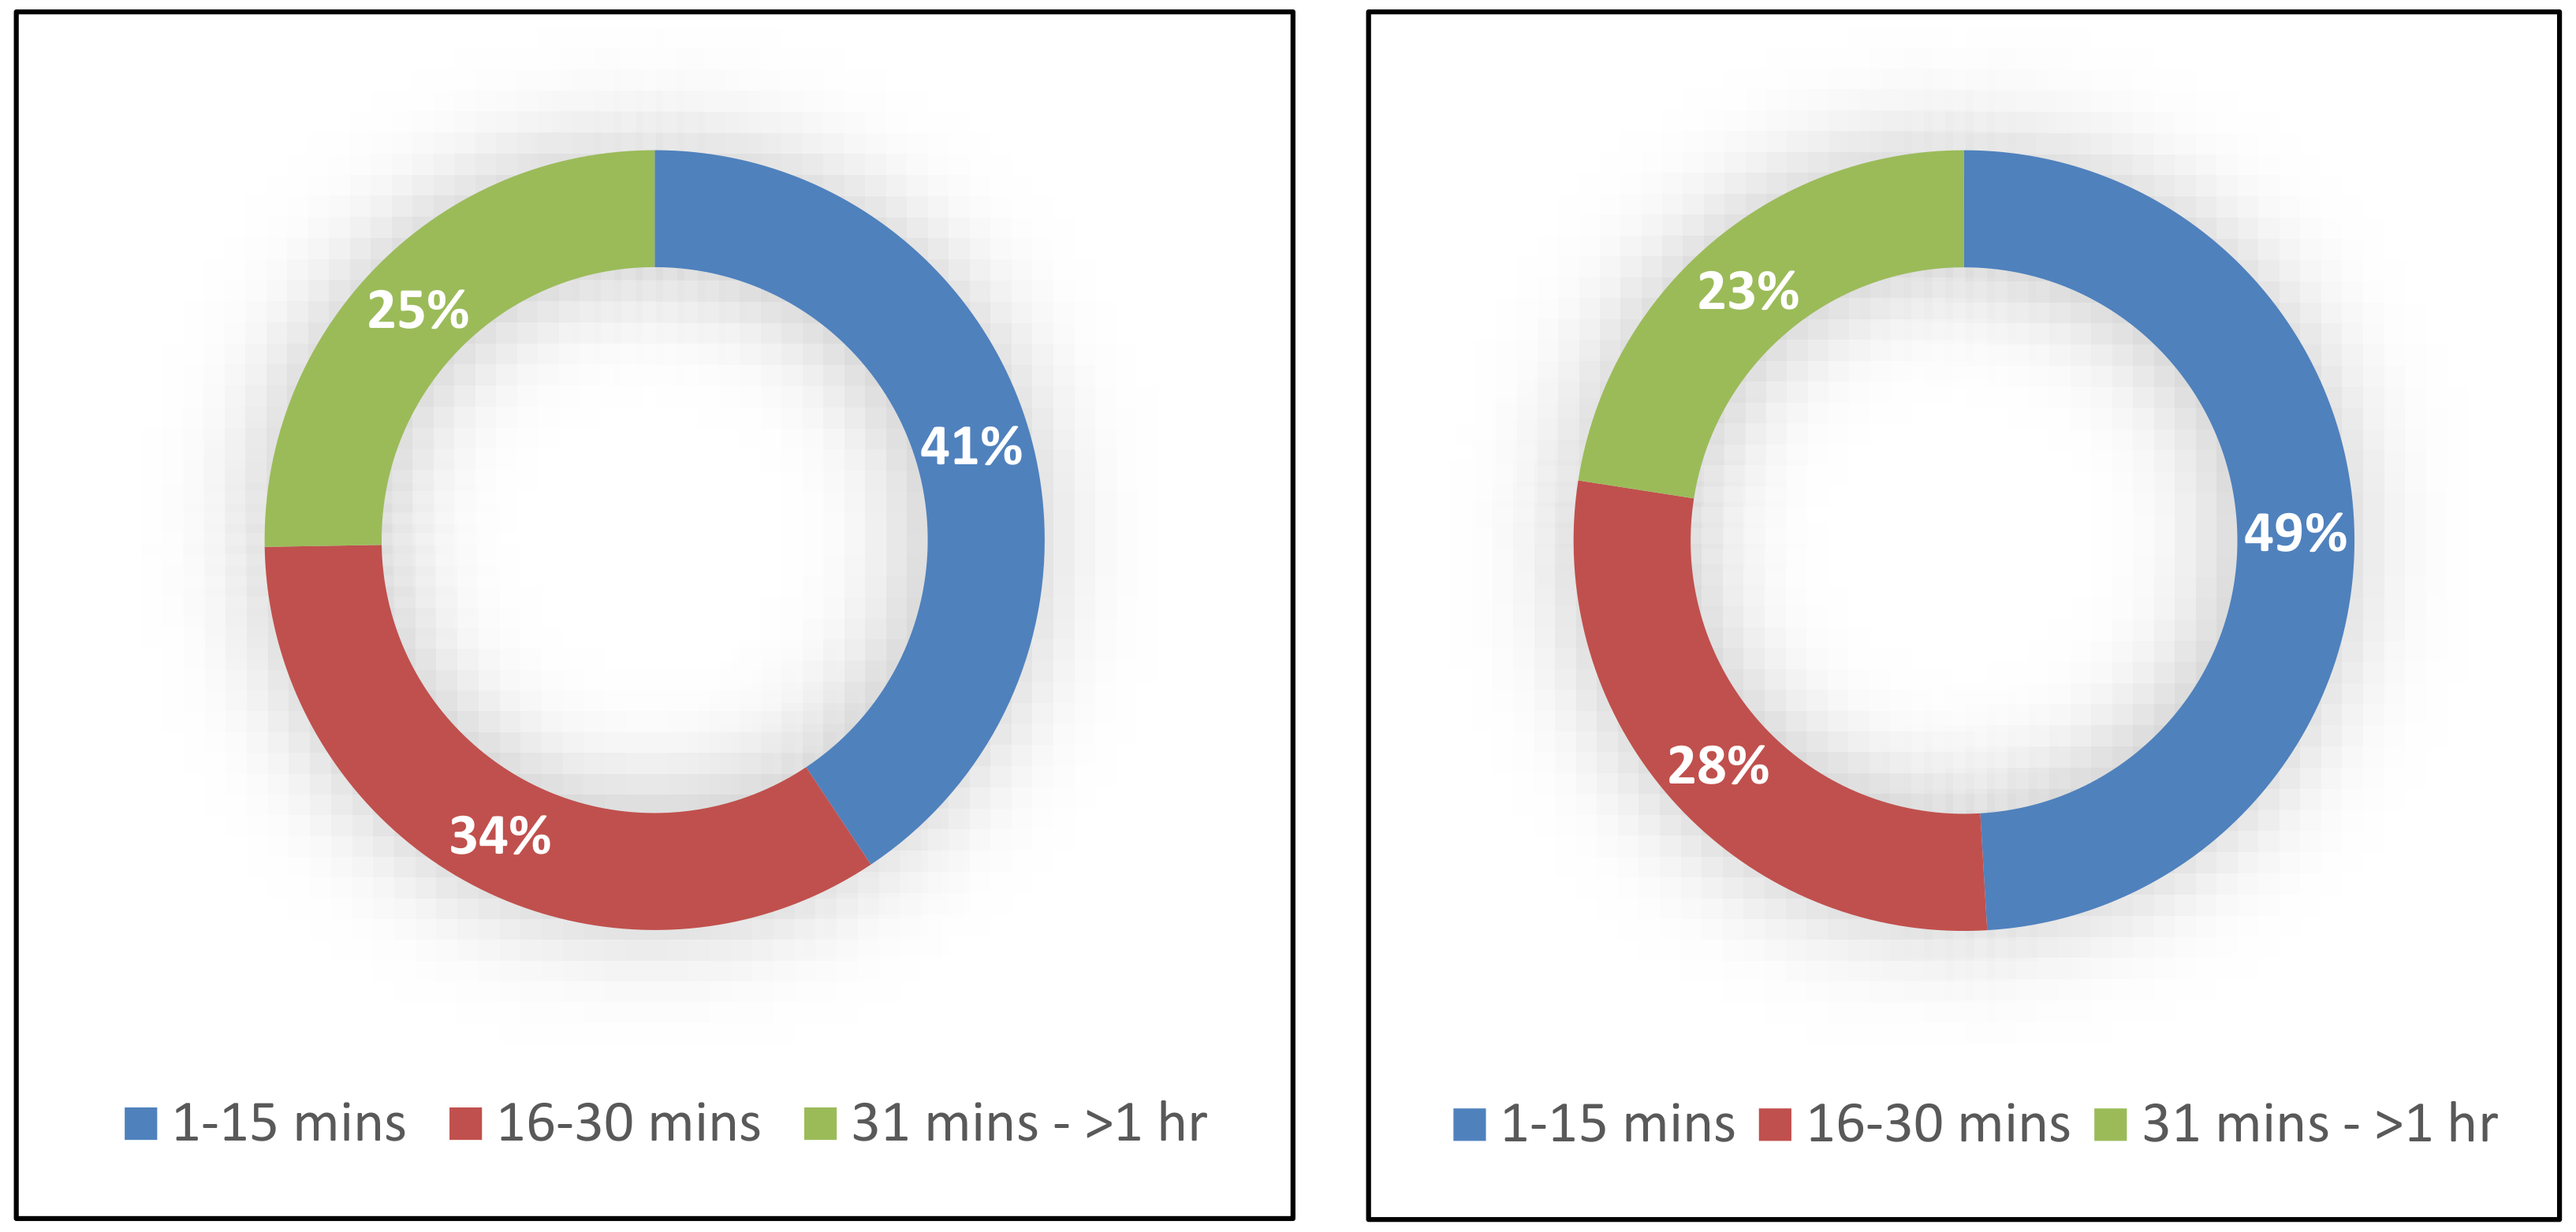
Passengers use different modes of transport before reaching the LRT platforms, as seen in
Figure 2. On the average, it shows that a substantial number of passengers get to the platform in a fairly good time of between 1–15 min. This implies that the platform distance to the passengers is fairly good but can be improved during future LRT route analysis and proximity to settlements on LRT corridors.
The results for the weekends compared to the weekdays, shows that passengers may get to the platform a bit quicker due to less peak periods during the weekends. In this regard, 41% of the passengers during the weekdays and 49% during the weekends perceived that their accessibility to the LRT platforms as adequate, as 1–15 min is relatively the most adequate period of time to access a light-rail platform.
4.8. Environmental Effects of LRT on Addis-Ababa City from Modal Shift of Motorized Transport to LRT
Addis-Ababa city has witnessed a gradual reduction of carbon emissions from other motorized transport due to the modal shift by a fraction of the passengers now using the LRT. This serves as a positive effect to the environment, as seen in
Table 5. To assess the level of modal shift, the approximation for other transport modes capacity have been assessed and compared to the capacity of the LRT, which was in order to provide an estimate of the modal shift [
36]. In this regard, other modes of public transport which include: 460 Higer Midi-buses that have a capacity of 22–27 passengers/Midi bus; 10,000 white and blue minibus taxis with a capacity of 12 sitting passengers/minibus taxi; 487 Anbessa city buses with the capacity of 70 standing and 30 sitting passengers/bus; 366 additional vehicles and 6500 salon taxis that have a capacity of 4 passengers/vehicle or taxi; the Alliance buses have a capacity of 60 standing and 40 sitting passengers/bus [
37]. The Anbessa city busses are the cheapest available public transport, which are used to assess the proportion of passengers that the LRT can transport from the modal shift. It is also categorized with 100 passengers per trip; 730,500 passengers per-day; 93 routes, with an average total of 6352 daily trips; 6.8 km as the shortest route; total route length of 1207 km; and the longest route is 47.2 km [
38].
If we compare the 153,000 passengers of the LRT to the closest mass public transport like the Anbessa city buses, which carries 730,500 passengers per day, is for now only 21% (153,405) of the passengers from Anbessa city buses [
36]. This shows that there is a high travel demand for the LRT and the transportation needs of the over 4 million Addis-Ababa population [
39]. Presently, a top director in the operations department acknowledged that: “We barely have off-peak periods, the people of Addis-Ababa use the LRT as a transport mode more than we anticipated, and it is most of the time, a peak period occupied to its full capacity”.
In addition, 85% of these 254 passengers do not use private cars as one of their modes of transport, as deduced from their modal combinations in the survey. While, 38% of passenger’s occupation status showed that they belonged mostly to the middle-income earners; 52% belong to the low-income group; and 10% of the passengers were upper income earners. Most of the upper income earners still prefer to use their private cars and are not yet willing to change modes of transport [
36].
This gradual modal shift will consequently decrease congestion on the roads and lessen the level of CO2 emissions. As the 275,500 Addis Ababa vehicles are discharging between 25,000 and 32,000 tons of hydrocarbons and 49,000 to 58,000 tons of carbon monoxide into the city’s air per annum, which is two to six times higher than World Health Organization standards [
40].
4.9. Economic and Social Effects of Fare Affordability and Pricing by Zone Distance on the Low-Income Group
The LRT was provided for the transport needs of the public, including the low-income groups for whom it also has an affordable ticket fare price and structure. The fare structure that has been provided is a zoning system of 2, 4, and 6 Ethiopian Birr ETB ((ETB) Ethiopian Birr—Ethiopian national currency, with an equivalence present rate of 29 ETB to 1 USD (dollar).) per E-W and N-S line’s trip, integrated into the short, intermediate and long or end-to-end zone distance passengers respectively. The LRT multi-actors used the competition based method [
20,
21], where the price has been decided upon and made more affordable compared to the price of contending public transport, for example the competing private taxi’s, bus operators, and public bus operators. This provided a benefit because it fostered the delivery of an affordable transport fare for the low-income groups [
41], compared to other key public transport systems, which made it easy for the low income groups to simply shift from other transport modes to LRT, which is relatively low in price compared to all of the other modes of public transport.
In Addis Ababa the LRT fare rates was slightly more affordable than the Alliance bus and Higer midi-buses, the White and Blue Minibus Taxi’s, which have a price range from 2.5 ETB for 2.5–7 km, 4.5–5.5 ETB for 8–15 km, and 7 ETB for 15–25 km. The LRT, to a significant extent, is more affordable than the Salon taxis that cost at least triple the price of the LRT, depending on the trip distance, and were usually used by the mid and higher income wage groups.
However, the LRT is still slightly less affordable than the Anbessa city buses which were mainly used by the lower income groups, with prices extending from 1 ETB for 6–12.4 km, 1.75 ETB for 9–13 km, 2 ETB for 13–15 km and 10 ETB for 47–50 km. Therefore, a portion of the lower income groups used other modes of transportation. The lower income groups who live close to the LRT platforms have a better option of shifting from buses to the LRT, which is also safer, more reliable, more comfortable, and cheaper in fare than other modes of transport, except the Anbessa city buses. The LRT also provided a way to travel that is not dependent on taxis and other sorts of buses for the middle and high-income passengers [
36].
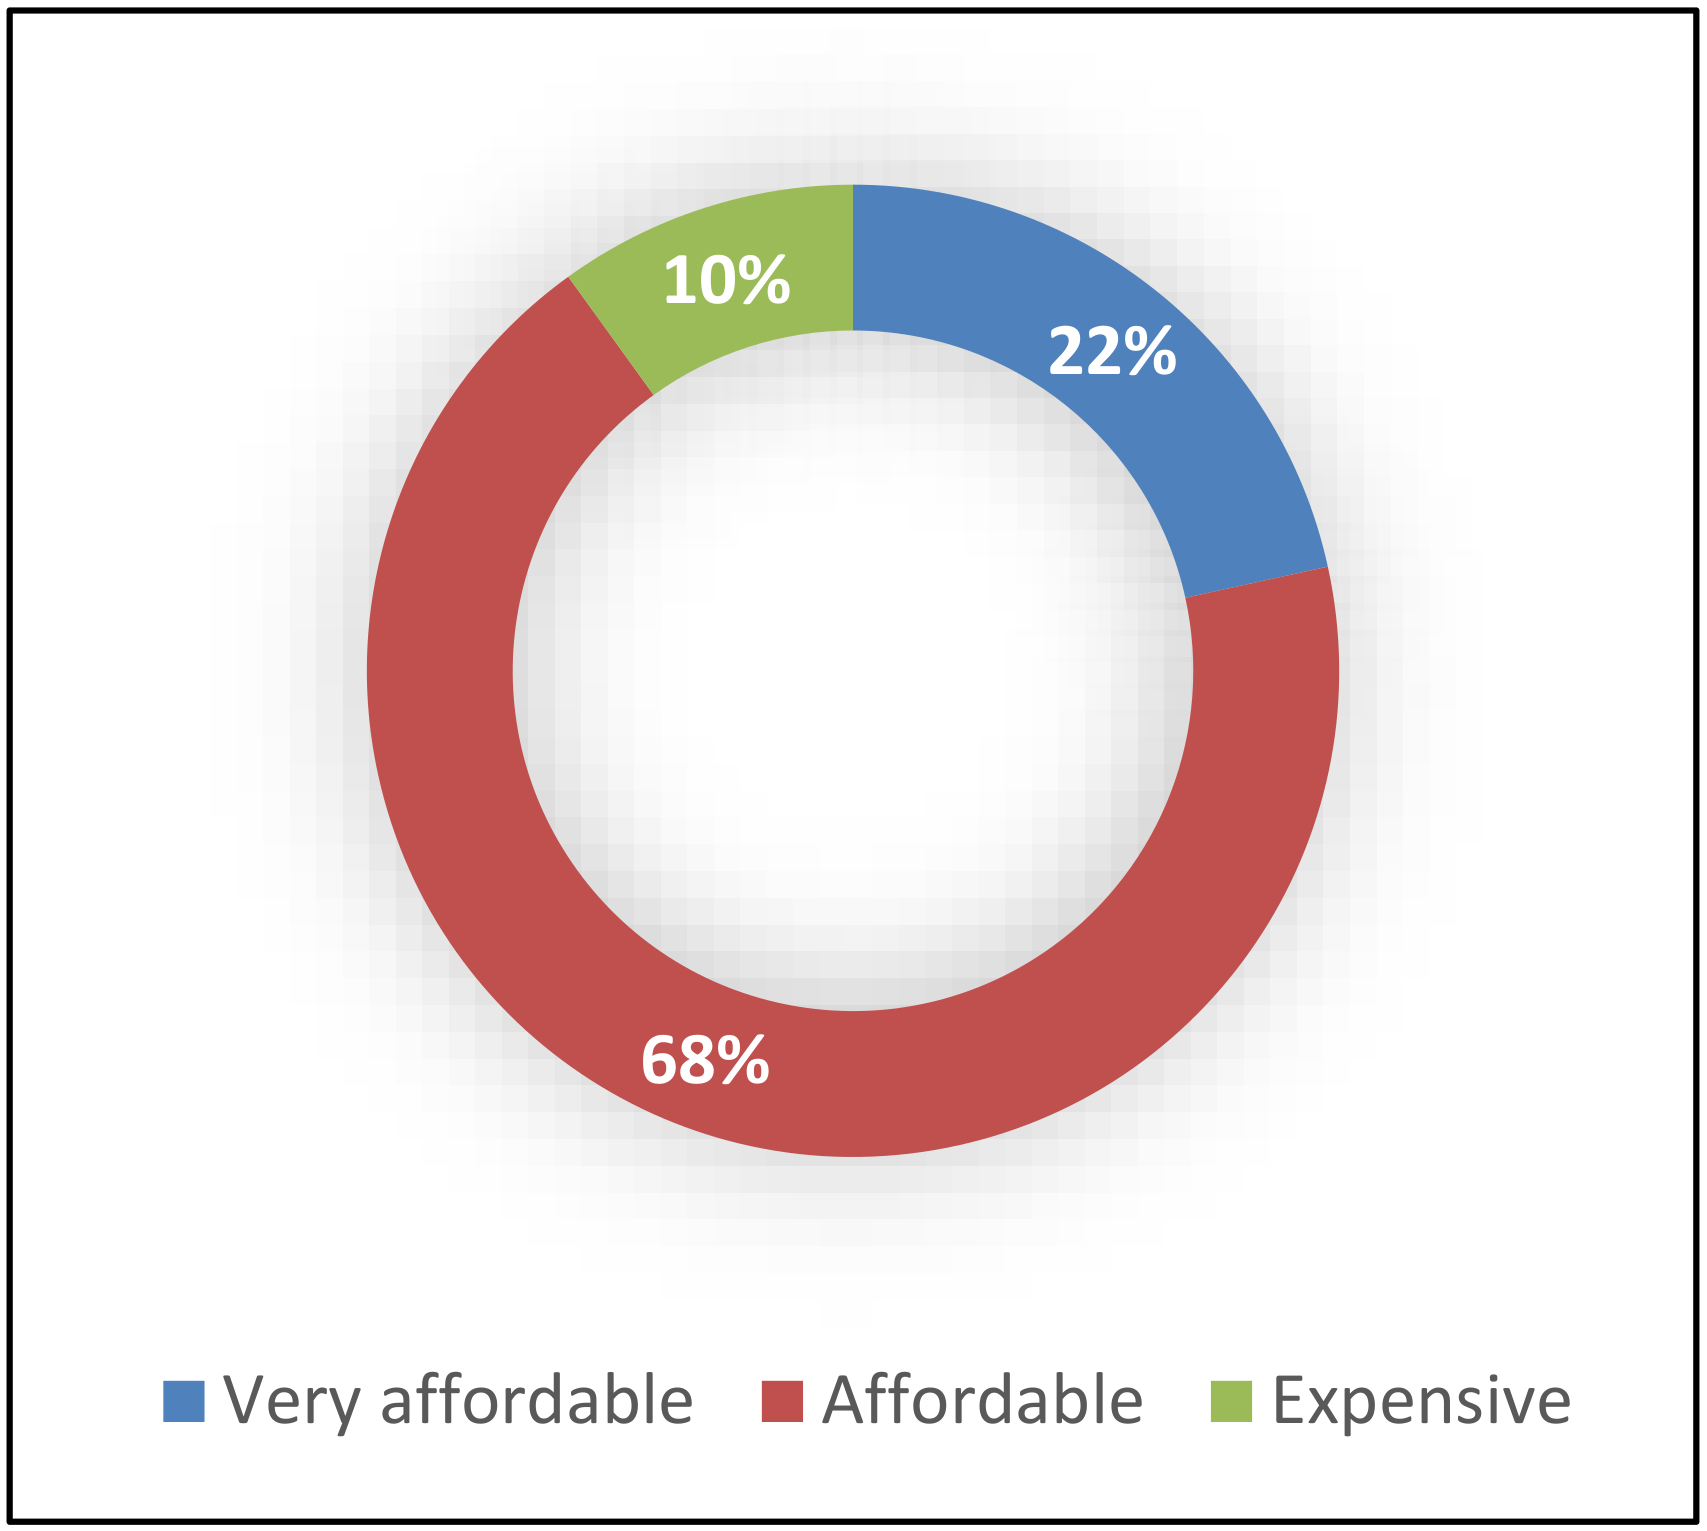
In the survey conducted by 254 passengers as respondents, 68% perceived this ticket fare as affordable (just OK), 22% perceived it as very affordable; whereas 10% perceive it as expensive, i.e., not affordable, as shown in
Figure 3. Thus, the total percentage perceived by the passengers as affordable ticket pricing in general represents 90%. Therefore, fulfilling the target for at least a portion of low-income passengers, whereby it increases accessibility and promotes the inclusion of the lower income groups. This consequently provides an economic benefit for the lower income passengers to save money by not using more expensive public transport and improves their social status by using the same public transport as middle and higher income groups as shown in
Table 5.
Nevertheless, it can be debated that the lower income groups in Addis-Ababa were the 10% who perceived the fares to be too expensive. Therefore, the LRT is still in the process of integrating more lower income groups, as approximately 50% of the population earns less than 500 ETB per household per month, and approximately 23% of the population are in total poverty, i.e., less than 300 ETB per household per month [
38]. Nonetheless, the LRT has commenced a goal towards affordable transportation, which is to include the lower income groups through the regulation of the prices by the ERC, in a way that is able to accommodate a significant number of the lower income groups, which may however not be able to cover all of the potential lower income LRT users [
36].
4.10. Economic and Environmental Effects of Transit-Oriented Development Along LRT Routes
Addis-Ababa provided Transit Oriented Development (TOD) in six LRT stations with a plan to increase it over a period of time. This TOD entails structural developments along the LRT routes, to promote commercial activities, providing the economic benefit of internal revenue to the city government and other amenities for the public [
4]. In addition, the TOD infrastructure, such as mega malls, office complexes, and other commercial activities provides an environmental benefit of reduced transport by individuals to other areas within the city with similar needs for infrastructure, as seen in
Table 5.
Consequently, reducing the carbon emissions from vehicles that would have been used to travel to other parts of the city, which has more trip distance than doing basic commercial activities within a TOD. This was observed as some individuals do their shopping, commercial activities, and meet their other basic needs at the TOD centers, saving them time and trip distance, rather than going to other areas of the city for the same needs; leading to an economic benefit. Over time, the use of more TOD by the city populace will gradually depict some significant measures of reduced carbon emissions from reduced transport movements by the people, especially those using private vehicles.
5. Conclusions
The conclusions answer the three research questions which characterize the predominant sustainability factors as effects from the adapted pricing and infrastructural innovations of the LRT. In addition, as a benefit, it provides contributions to scientific literature and also outlines guidelines to help the sustainable transport sector; it highlights some further research questions; proposes sustainable recommendations to support decision and policymakers on how to adapt the LRT from other countries with different socio-economic and technological backgrounds, thereby serving as a societal benefit.
The pricing and infrastructural innovations were transferred to the Addis-Ababa context from China, amidst considerations for the context and circumstances at hand; and their sustainability factors were based on economic, social and environmental factors. In addition, a re-adaptation process took place whenever a sustainability factor was not favorable.
The economic effects on passenger delivery were: unrealistic swiping of electronic cards on validation machine inside the LRT and time wastage due to ticket sales in ticket shops. The social effects include the inconvenience to passengers having to cross the roads to buy tickets.
The economic effects on MNCs were fare evasion leading to loss of revenue; extra expenses due to emergency ticket shops; difficulty locating closer points for ticket shops; and the extra cost of resettlements due to third-party issues.
The economic effects on residents living and engaged in commercial activities were: reduction in sales due to less proximity of people to access the commercial shops; increase in fare rate by taxi drivers; and an increase in travel distance by pedestrians.
Regarding the Addis-Ababa city environment, the environmental effects were: reduction in carbon emissions from reduced use of motorized transport and TOD. The economic effects were: affordability to LRT users and TOD. The social effect is the change of transports social status for low-income groups as a new, more comfortable, and safer mode of transport.
In addition, this research revealed that the economic sustainability factor is the most predominant effect as a result of the adapted LRT, which can be seen in
Table 2,
Table 3,
Table 4 and
Table 5. Overall, the economic sustainability factor accounts for 12 out of 14 sustainability factors. Each of the social and environmental sustainability factors accounts for 2 out of 14 sustainability factors, as shown in
Figure 4.
The identified re-adaptations to a more sustainable LRT as a recommendation to some of its major effects were: The newly proposed method of validating tickets on the platforms, as an off-board ticket validation system and the use of electronic cards by the ERC is one of the most suitable solutions to curb fare evasion. This will also provide a better cost recovery mechanism for both Addis-Ababa and China MNCs, and a fair system to short and long-distance travelers using electronic cards charged per kilometer. In this regard, construction of platforms during the design and construction stages should support long queues from highly populated cities with a high travel demand from their commercial activities, fostering and creating enough room for the use of off-board ticket validation systems, such as the turnstile machines and as an LRT accessibility support infrastructure. Although it is more costly, more over-passes and under-passes should be built to sustain the business flow along the LRT routes and reduce the number of shut down U-turns on roads, in order to reduce the distance travelled by commercial vehicles and people in need of a U-turn to cross to the opposite side of the road.
An inclusive option for future installation of validation machines should be provided, while it can start with ticket validations on the platforms, pending the period when the travel behavior data has been recorded for at least a year. Validation of the tickets on the platforms is safer for cost recovery and enforced reduction of fare evasion and without the use of human effort, such as ticket officials. This would further avoid the cost of the emergency construction of ticket shops, which were not included in the original budget. Fare subsidies should be introduced in order to attract more potential passengers from the lower income groups, such as targeting special provision for people living below the poverty level, children below twelve years and the elderly above sixty-five years [
36].
The scientific value of this research emphasizes the need to provide a tailor-made LRT to cities in need of a sustainable transport through the assessment of positive and negative effects of the implemented light-rail. They need to consider the socio-economic and environmental factors to guide in the design, planning, construction, and operation of the LRT, which provides sustainable benefits, especially to cities with a similar socio-economic and environmental context in transition to the LRT. Thus, lessons learnt from this research, due to its local extent and context, further recommends that cities with similar conditions should aim to match the travel demand with an adequate number of light-rail vehicles, this will avoid the negative spin-offs which can hinder normal operations and maintenance activities and it will avoid low cost recovery on the investment. In addition, this will promote more a modal shift from other motorized transport to the LRT, reducing carbon emissions and city pollution.
Furthermore, this research has added a niche to the theories on pricing and infrastructural innovations, especially the theories provided by Hyard [
15,
34] on how it relates to contextualization and its delivery of service to the LRT passengers with respect to sustainability factors.
The societal relevance is associated with better affordability and accessibility for the public through a better managerial practice of pricing systems, market competition, more passenger use options, and an increase in the use of public transport to reduce the level of private owned cars, thereby reducing greenhouse gas emissions, which can transcend into transport policy for climate change, by decision-makers in the transport sector. This can be implemented in such a way that other non-technological innovations such as green logistics and traffic management, can reduce carbon emissions related to road transport [
42]. Thus, filling related gaps, using a sustainable approach to assess and contextualize the pricing and infrastructural non-technological innovations, which consequently promotes positive sustainability factors with a specific focus on light-rail public transport.
Further research questions can be formulated based on this study for example: To what extent can sustainability factors influence the positive outcomes of a light-rail transport in cities? How can sustainability factor assessments be incorporated into the LRT implementation plans at the design stage? What are the policies formulated to reduce the negative outcomes of sustainability factors of the LRT implementation? In what ways can sustainability factors promote smart city public transport planning?
Moreover, classifying the sustainability factors enables decision makers and policy makers to tailor their solutions by specifically considering the extent and context of the economic, social and environmental factors as spin-offs from the LRT implementation. Despite some negative sustainability factors emanating from fare evasion and emergency ticket shops; the positive effects emanating from the use of the electrified LRT for zero carbon emissions, TOD, affordable, safe, and comfortable LRT outweighs the negative effects because the LRT was overwhelmingly embraced by the public; and the LRT in Addis-Ababa city has overall more benefits that have been able to improve the socio-economic and environmental factors of the city as a whole, which serves as a public good.


