Sensitivity Analysis in the Life-Cycle Assessment of Electric vs. Combustion Engine Cars under Approximate Real-World Conditions


Abstract
1. Introduction
2. Materials and Methods
2.1. General Purpose
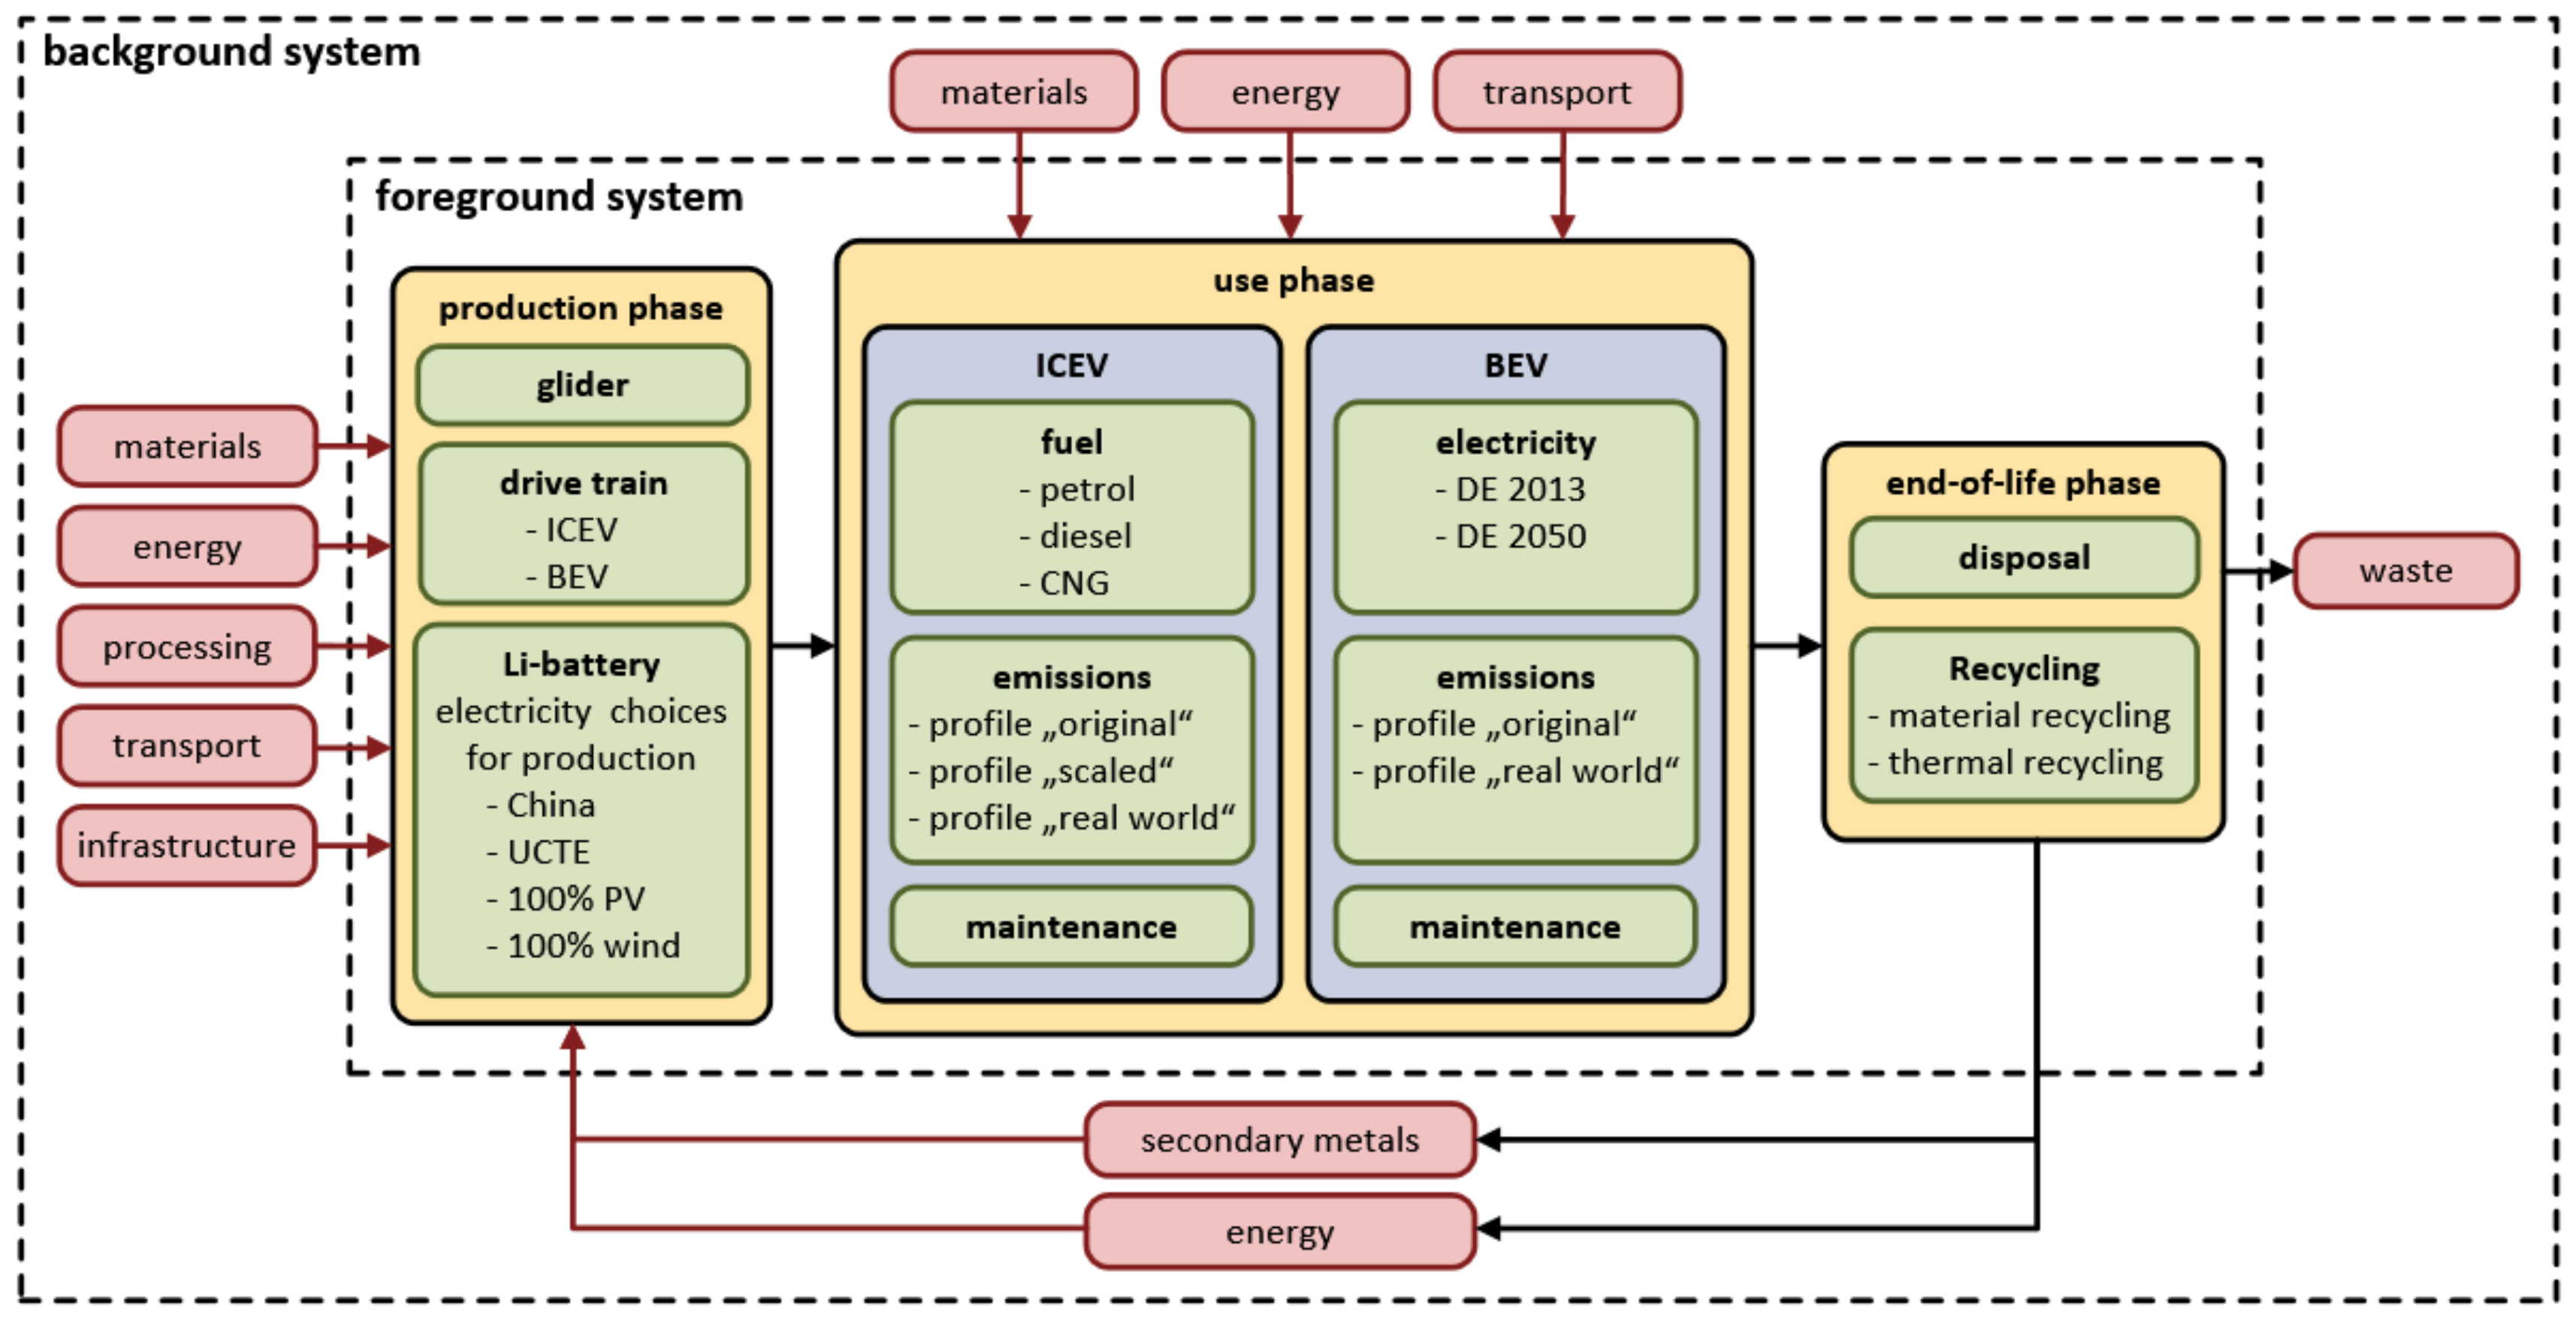
2.2. Modelling Approaches
Goal, Scope, Software, and Databases
- Size of the car (small vs. mid-sized, carbon footprint only);
- Emission profile (laboratory based vs. real-world);
- Fossil fuel choice (diesel, petrol, natural gas);
- Electricity choices during battery production and use phase;
- Battery size and battery second use;
- Mileage (150,000 and 200,000 km).
2.3. Inventory Development
2.3.1. Vehicle Composition, Assembly, and Use
2.3.2. Use Phase Energy Consumption
2.3.3. Electricity for Battery Cell Production
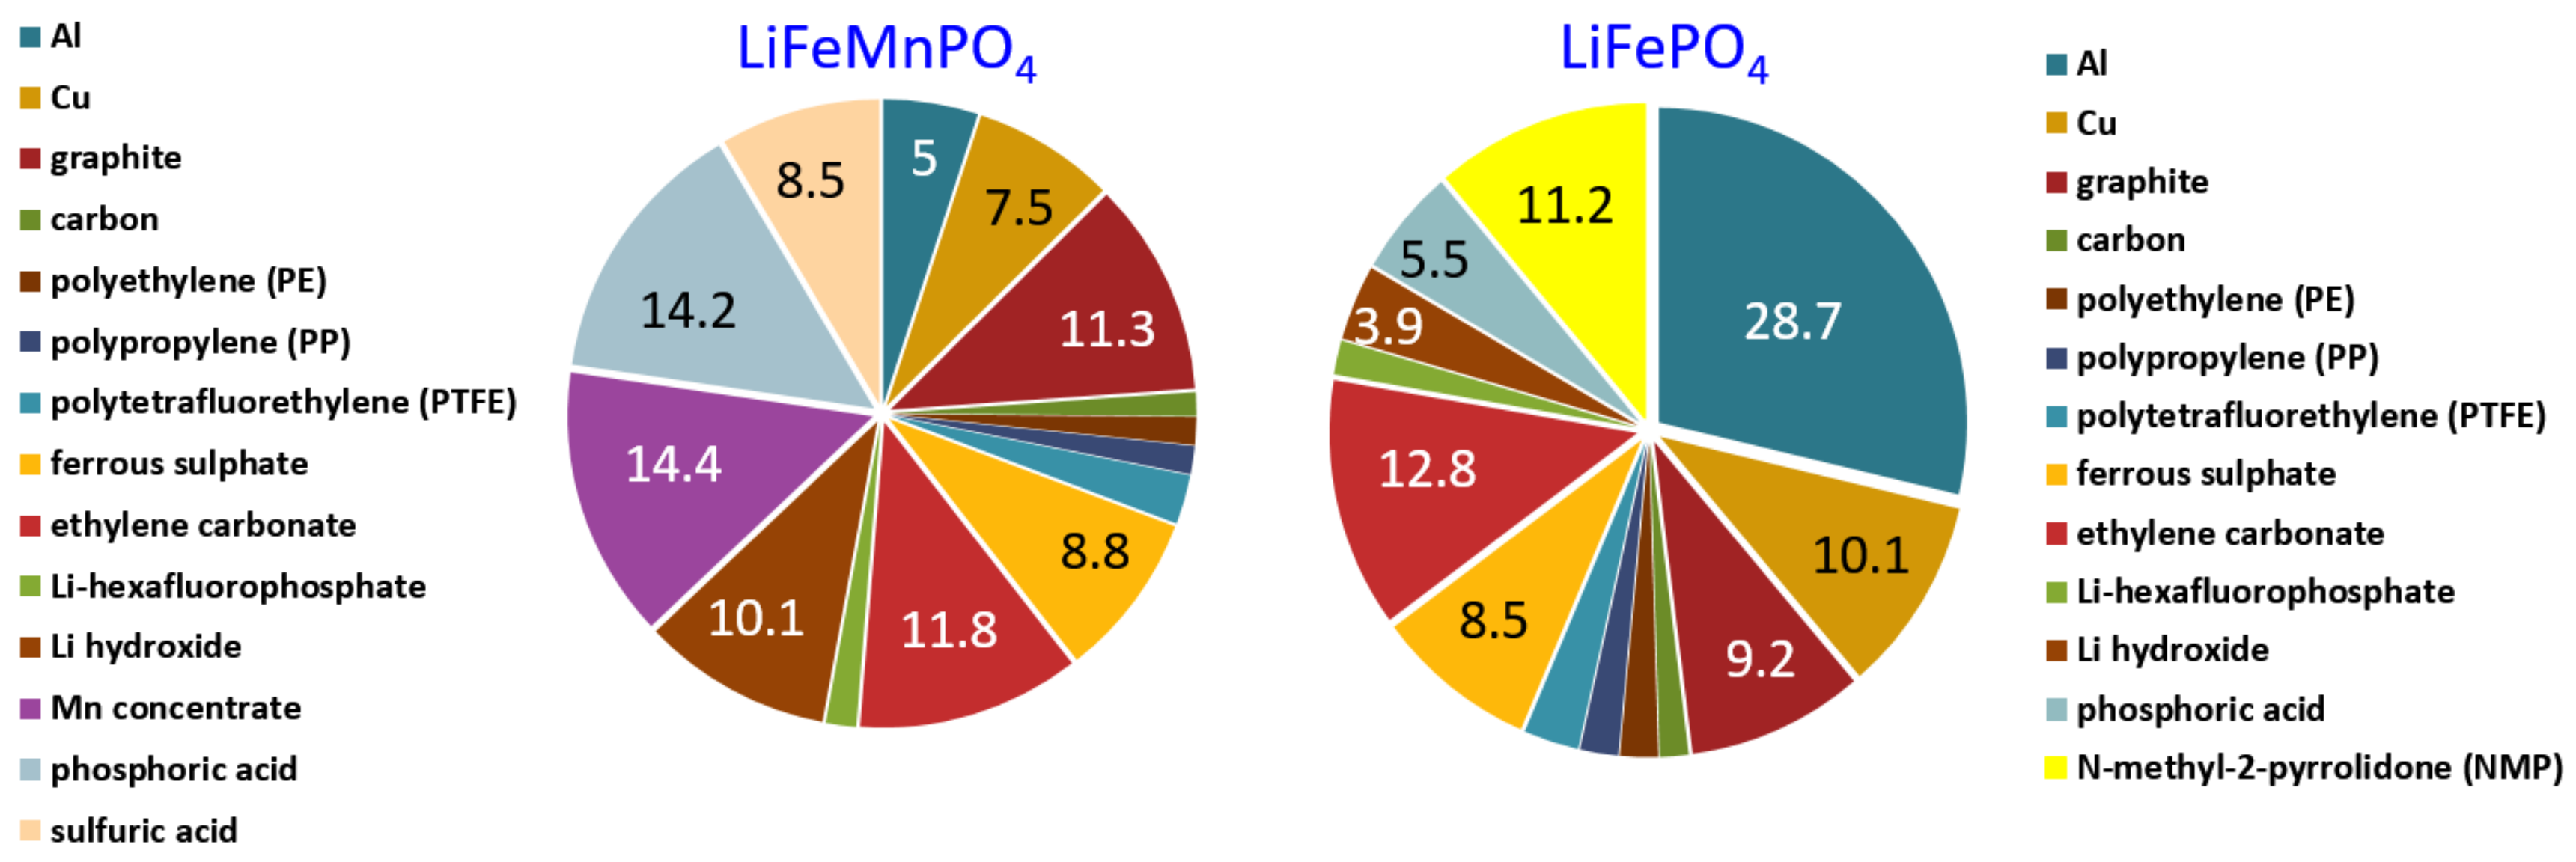
2.3.4. Battery Chemistry Alternatives
2.3.5. Battery Second Use
2.3.6. Emission Profiles Development
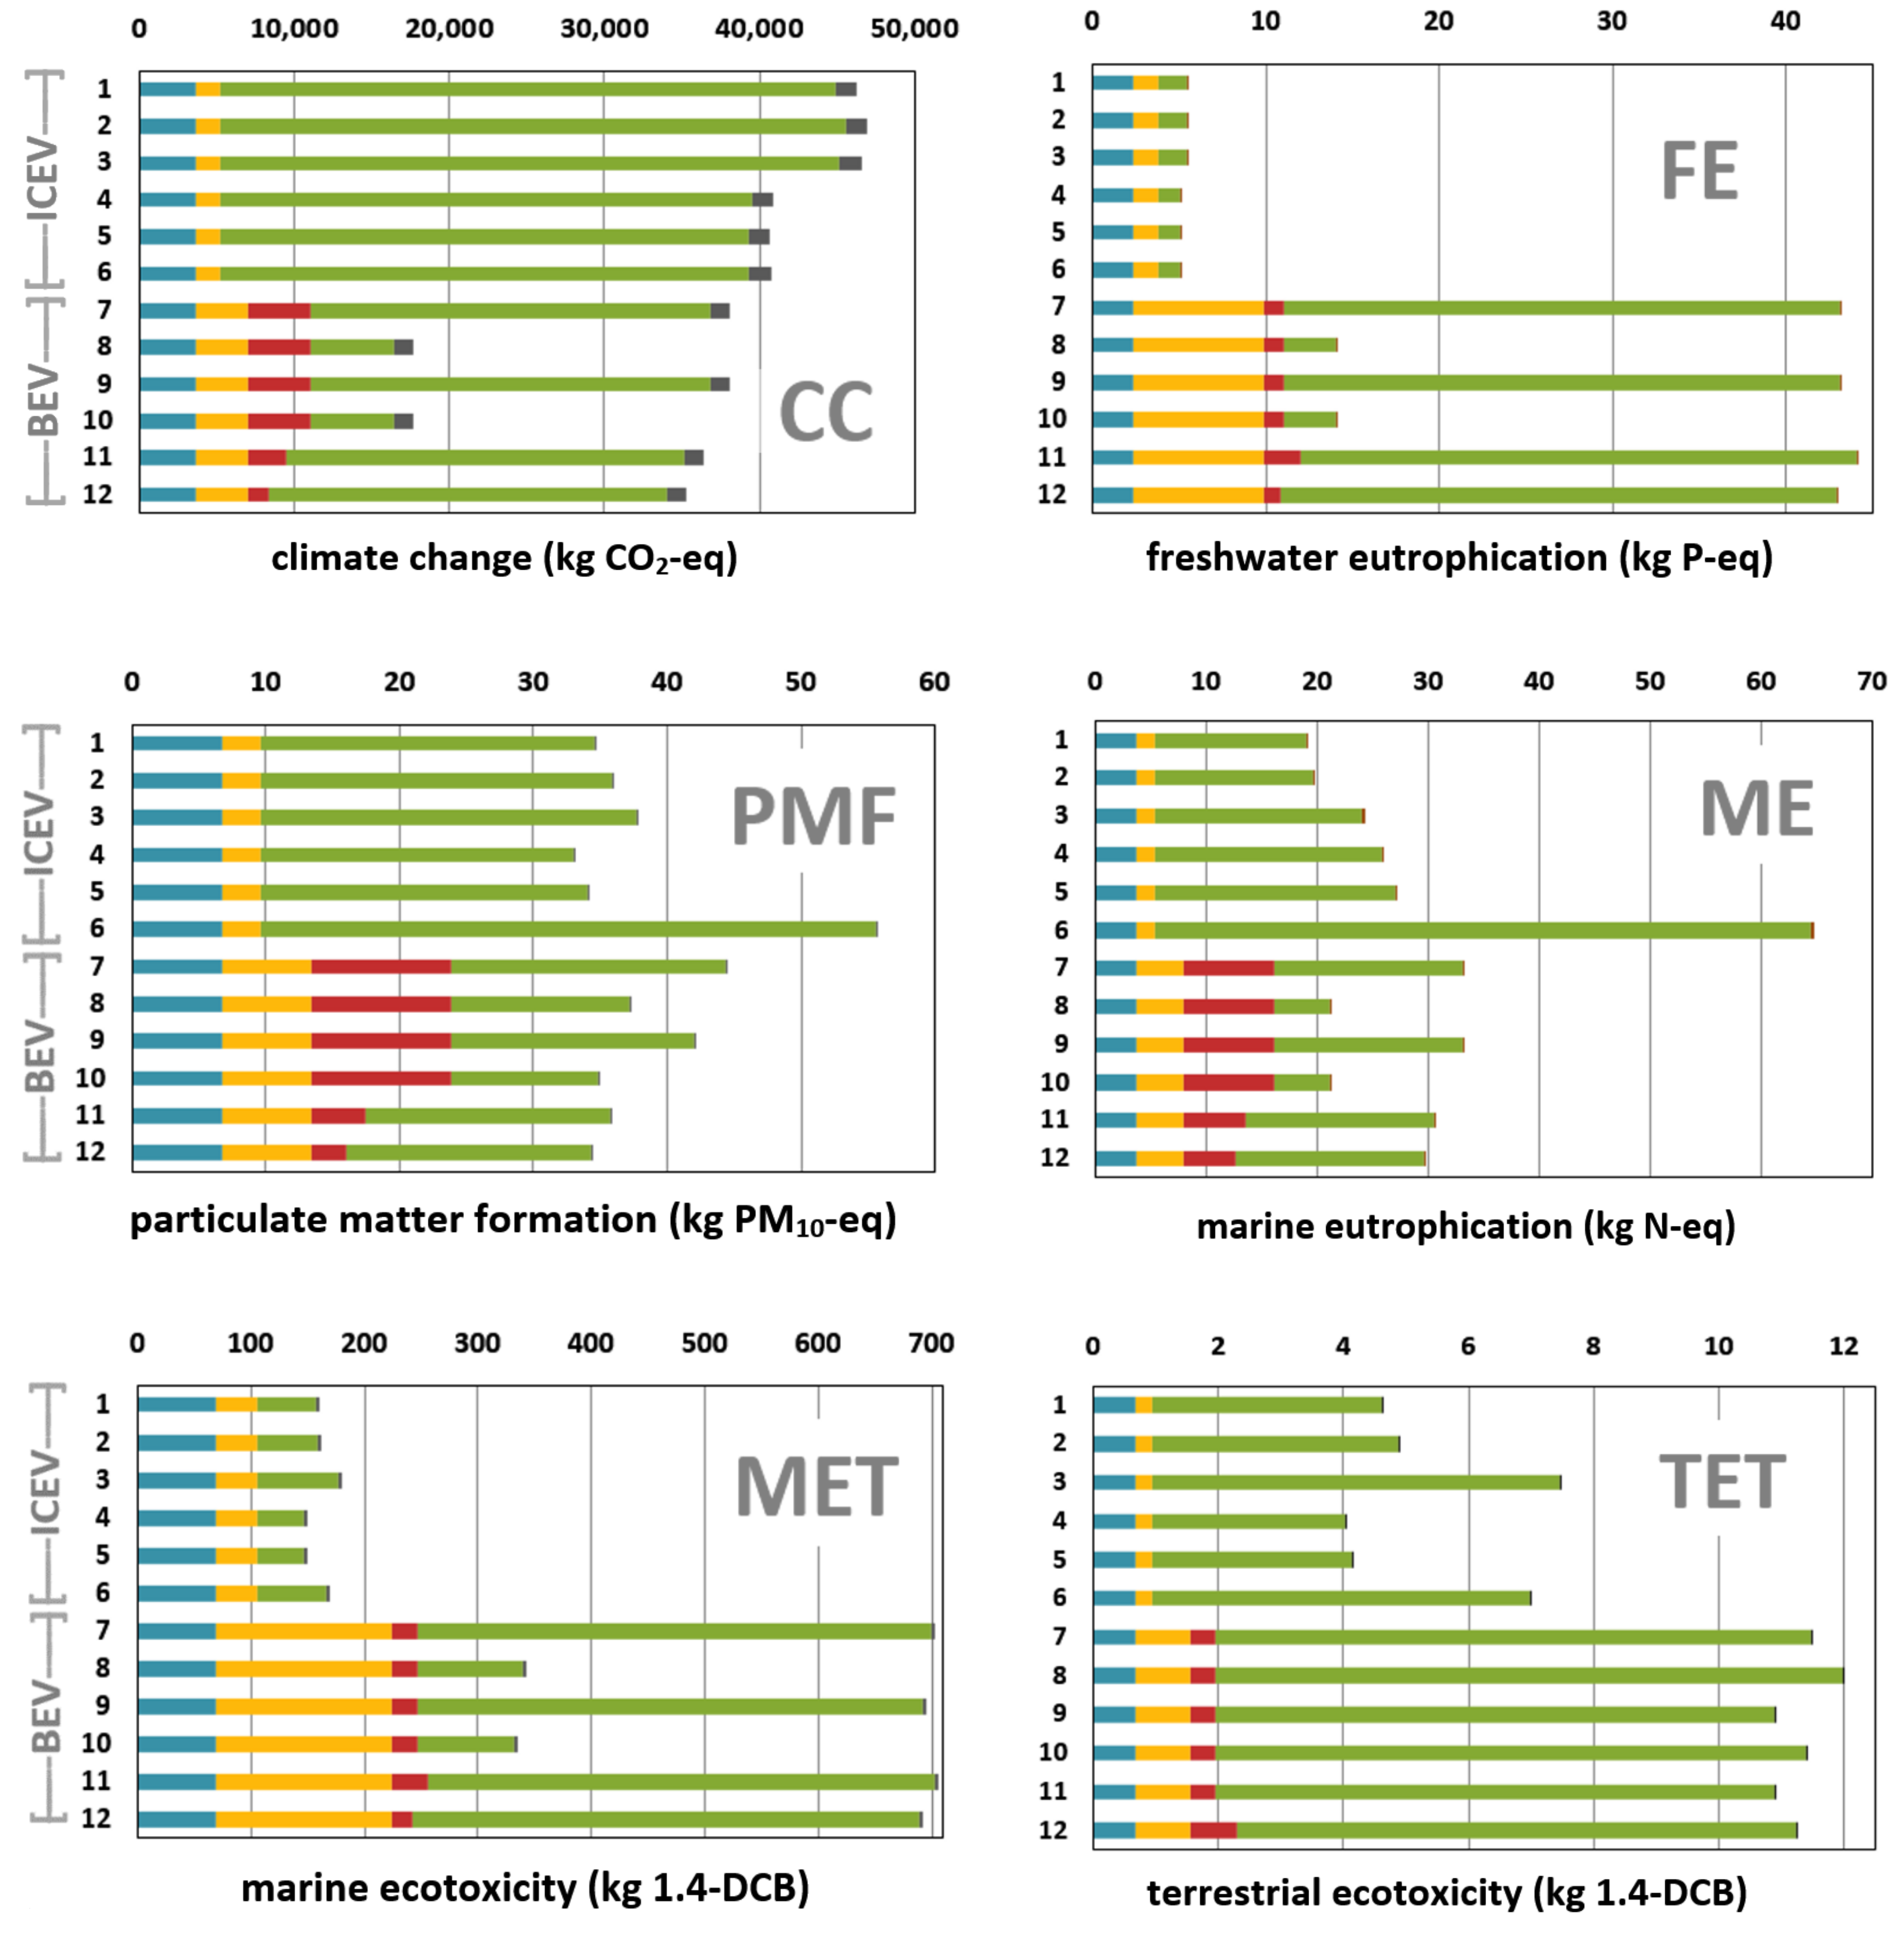
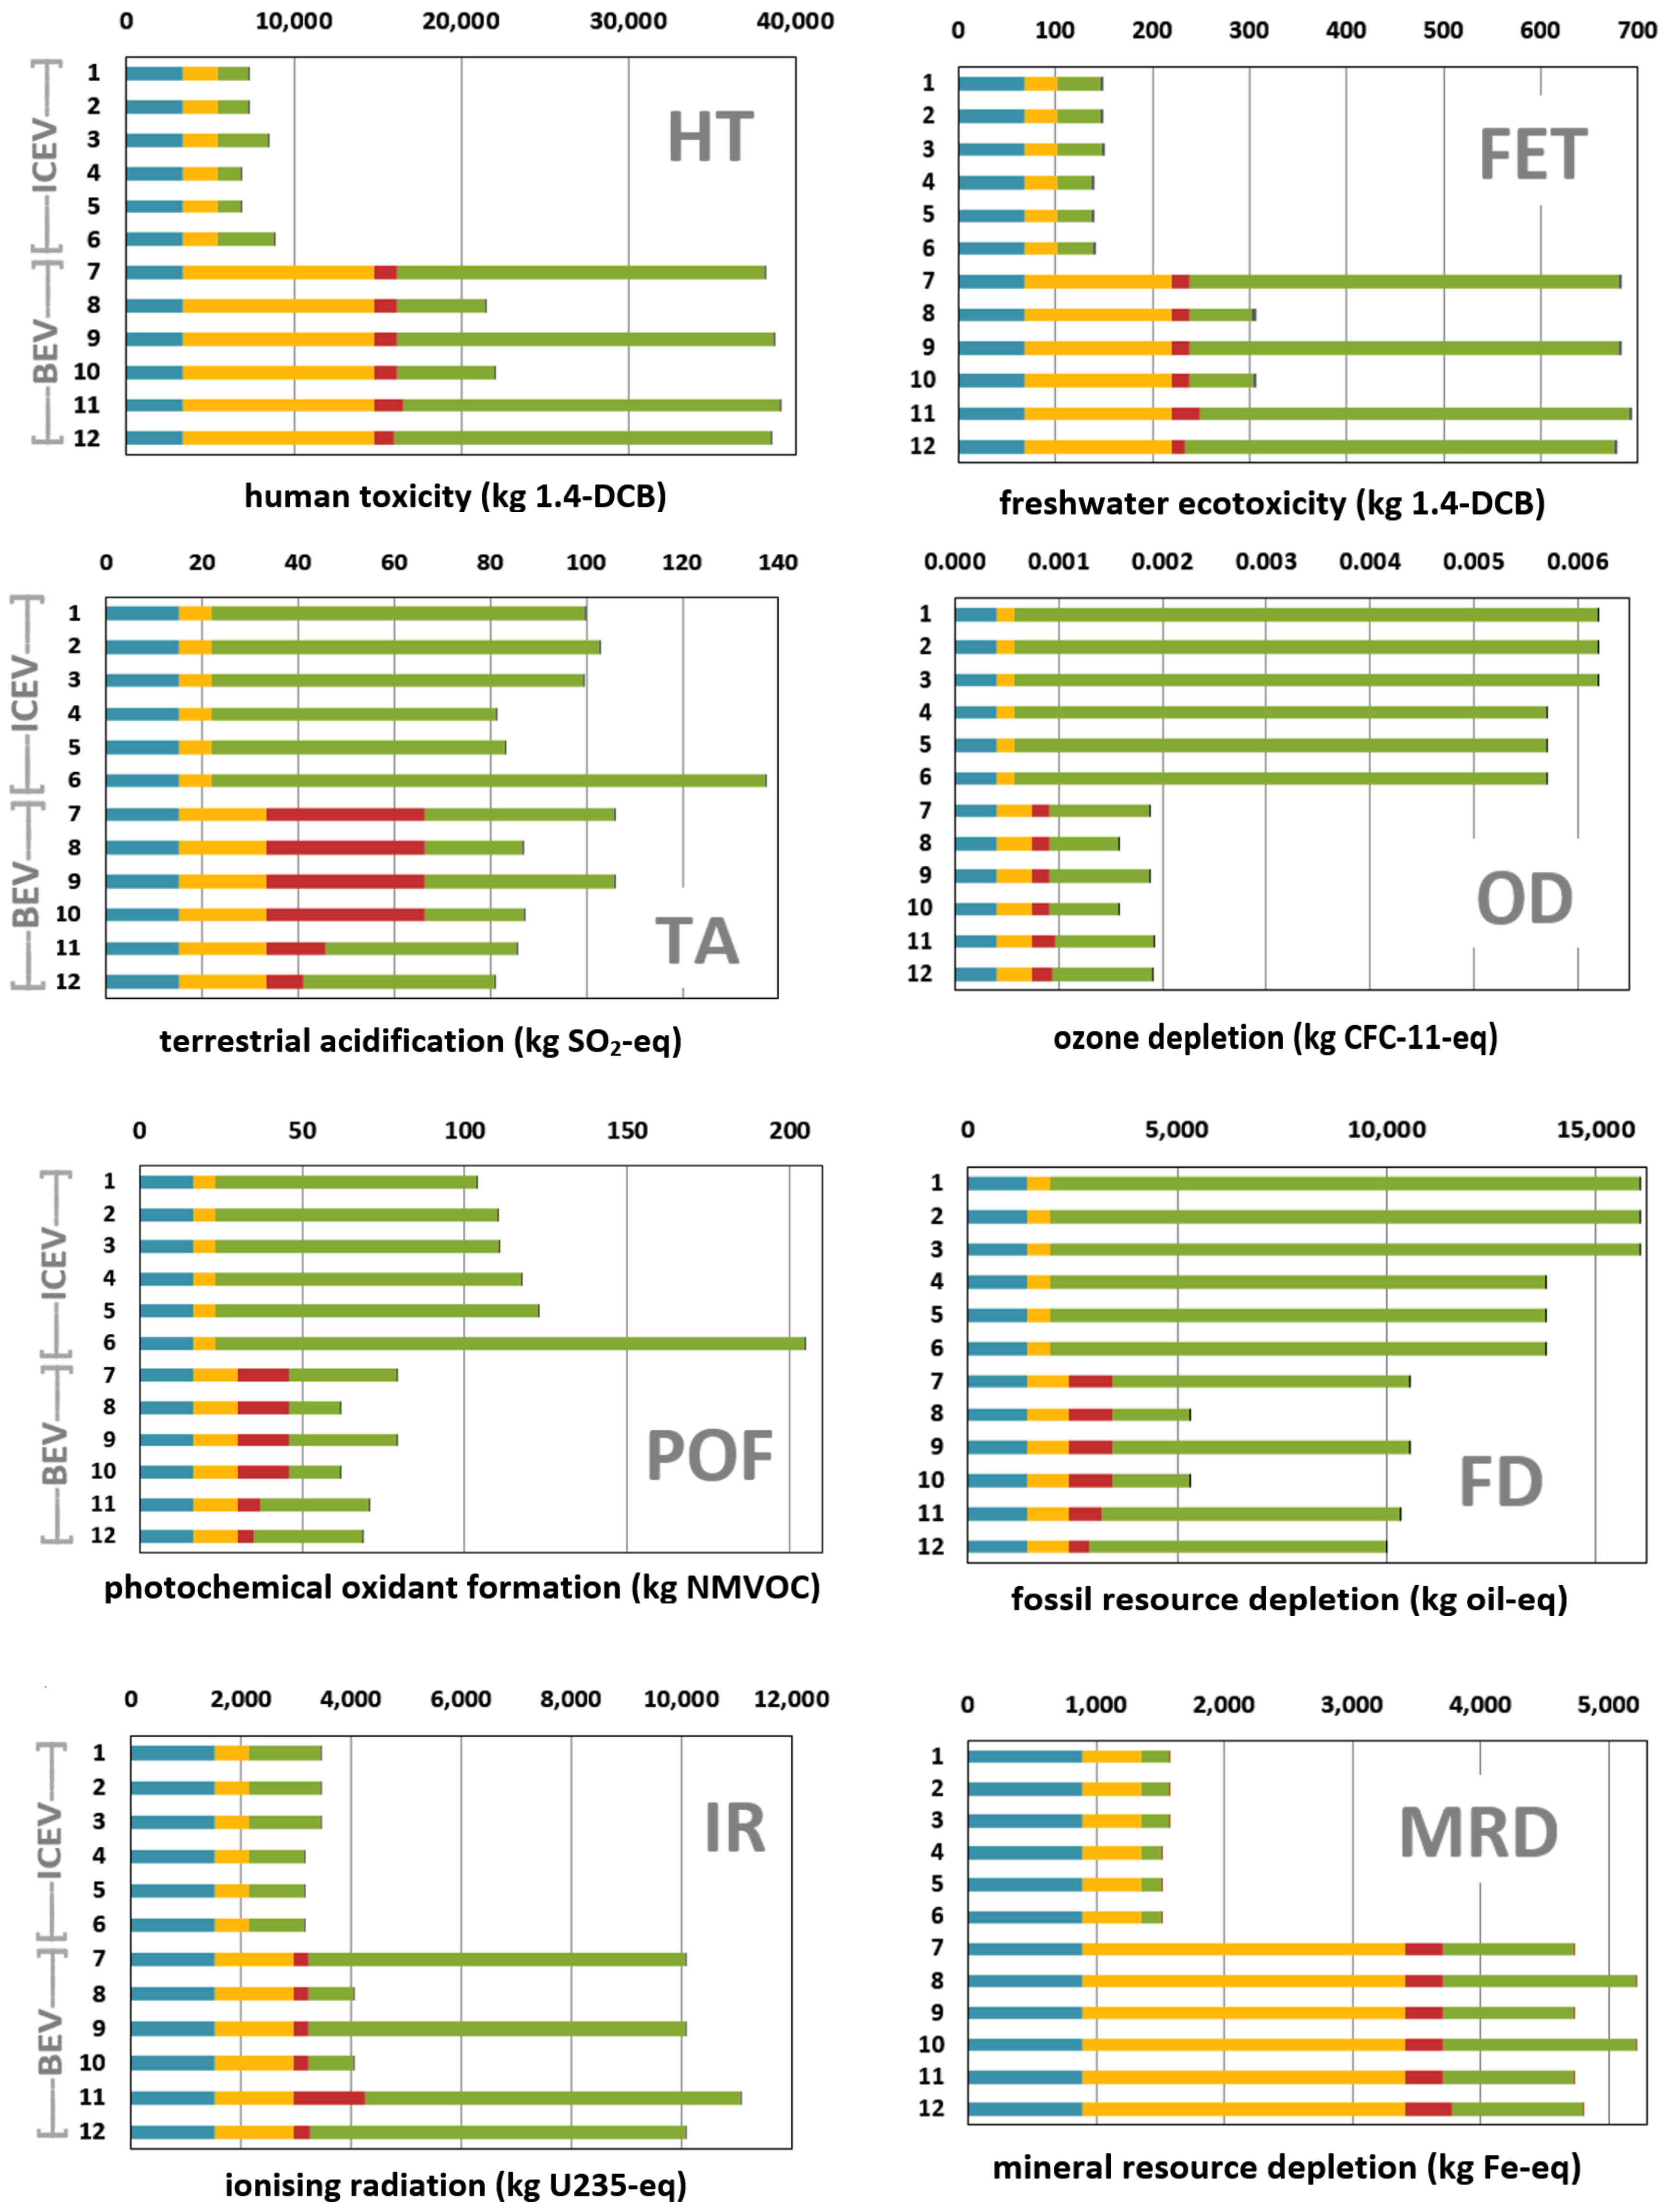
3. Results and Discussion
3.1. Impact Differences Due to Variations in Emission Profiles
3.2. Climate Change Impact Comparison of Diesel and Petrol Cars
3.3. Effects of Electricity Supply Choices on Battery Production Impacts
3.4. The Natural Gas Alternative and Effects of Electricity Supply Choices During Battery Production on the Lifetime Impacts
3.5. Climate Change Impact: Combining Different Mileages, Battery Sizes, and the Battery Second Use Case
3.6. The Size Effect: Comparing the Break-Even Mileages of the Electrified SMART and the VW Caddy
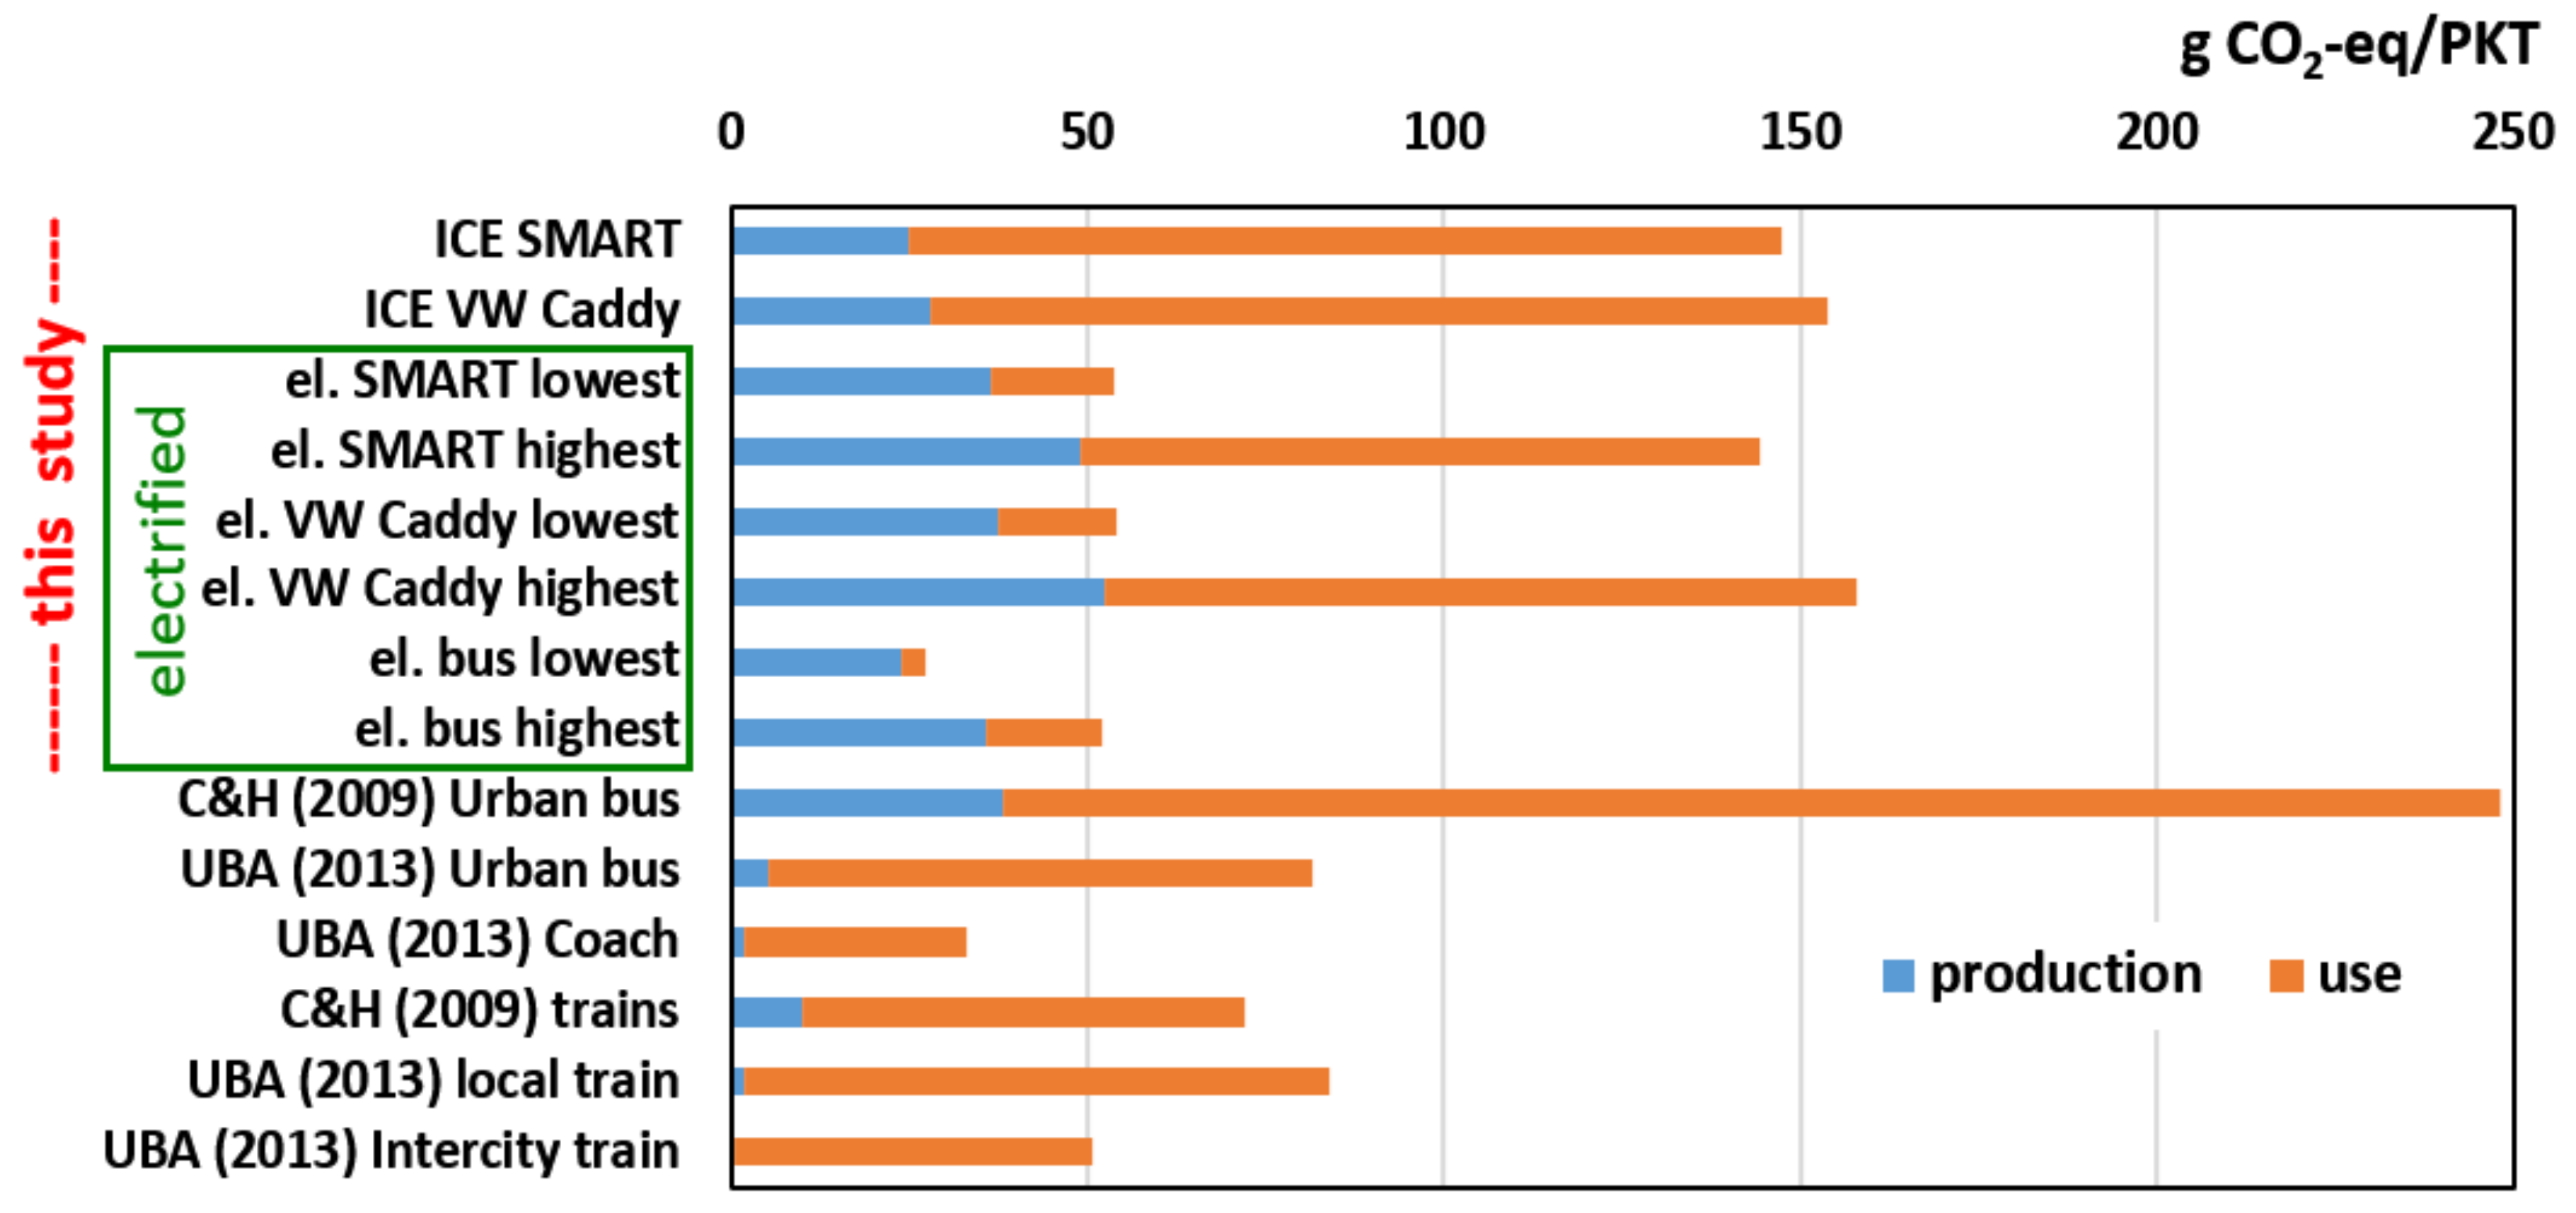
3.7. Lifecycle Climate Change Impacts of Electric Cars in Comparison with Competing Transportation Modes
4. Conclusions and Outlook
Supplementary Materials
Author Contributions
Funding
Acknowledgments
Conflicts of Interest
References
- IEA. Tracking Progress: Transport. International Energy Agency. 2019. Available online: https://www.iea.org/etp/tracking2017/transport/ (accessed on 23 March 2019).
- Motowidlak, U. Identification of behavioral changes in transport as a means for decarbonisation of the economy. In Transport Development Challenges in the Twenty-First Century; Springer Proceedings in Business and Economics; Springer International: Berlin, Germany, 2016; pp. 171–180. [Google Scholar]
- EU. Transport Emissions—A European Strategy for Low-Emission Mobility. 2019. Available online: https://ec.europa.eu/clima/policies/transport_en (accessed on 23 March 2019).
- Hawkins, T.R.; Gausen, O.M.; Strømman, A.H. Environmental impacts of hybrid and electric vehicles—A review. Int. J. Life Cycle Assess. 2012, 17, 997–1014. [Google Scholar] [CrossRef]
- Moro, A.; Helmers, E. A new hybrid method reducing the gap between WTW and LCA in the carbon footprint assessment of electric vehicles. Int. J. Life Cycle Assess. 2017, 22, 4–14. [Google Scholar] [CrossRef]
- McManus, M.C.; Taylor, C.M. The changing nature of life cycle assessment. Biomass Bioenergy 2015, 7, 1–14. [Google Scholar] [CrossRef]
- Cames, M.; Helmers, E. Critical evaluation of the European diesel car boom–global comparison, environmental effects and various national strategies. Environ. Sci. Eur. 2013, 25, 22. [Google Scholar] [CrossRef]
- Helmers, E.; Leitão, J.; Tietge, U.; Butler, T. CO2-equivalent emissions from European passenger vehicles in the years 1995–2015 based on real-world use: Assessing the climate benefit of the European “diesel boom”. Atmos. Environ. 2019, 198, 122–132. [Google Scholar] [CrossRef]
- Anenberg, S.C.; Miller, J.; Minjares, R.; Du, L.; Henze, D.K.; Forrest Lacey, F.; Malley, C.S.; Emberson, L.; Franco, V.; Klimont, Z.; et al. Impacts and mitigation of excess diesel-related NOx emissions in 11 major vehicle markets. Nature 2017. [Google Scholar] [CrossRef] [PubMed]
- Jonson, E.; Borken-Kleefeld, J.; Simpson, D.; Nyiri, A.; Posch, M.; Heyes, C. Impact of excess NOx emissions from diesel cars on air quality, public health and eutrophication in Europe. Environ. Res. Lett. 2017, 12, 1–12. [Google Scholar] [CrossRef]
- Carslaw, D.C.; Beevers, S.D.; Tate, J.E.; Westmoreland, E.J.; Martin, L.; Williams, M.L. Recent evidence concerning higher NOx emissions from passenger cars and light duty vehicles. Atmos. Environ. 2011, 45, 7053–7063. [Google Scholar] [CrossRef]
- Díaz, S.; Miller, J.; Mock, P.; Minjares, R.; Anenberg, S.; Meszler, D. Shifting Gears: The Effects of a Future Decline in Diesel Market Share on Tailpipe CO2 and NOx Emissions in Europe; White paper; International Council on Clean Transportation: Berlin, Germany, July 2017; Available online: https://theicct.org/sites/default/files/publications/Shifting-gears-EU%20diesel-futures_ICCT-white-paper_06072017_vF.pdf (accessed on 18 September 2019).
- Chen, Y.; Borken-Kleefeld, J. Real-driving emissions from cars and light commercial vehicles-Results from 13 years remote sensing at Zurich/CH. Atmos. Environ. 2014, 88, 157–164. [Google Scholar] [CrossRef]
- Carslaw, D.C.; Farren, N.J.; Vaughan, A.R.; Drysdale, W.S.; Young, S.; Lee, J.D. The diminishing importance of nitrogen dioxide emissions from road vehicle exhaust. Atmos. Environ. X 2019, 1, 100002. [Google Scholar] [CrossRef]
- Hawkins, T.R.; Singh, B.; Majeau-Bettez, G.; Strømman, A.H. Comparative Environmental Life Cycle Assessment of Conventional and Electric Vehicles. J. Ind. Ecol. 2012, 17, 53–64, Supporting information S2. Available online: https://onlinelibrary.wiley.com/action/downloadSupplement?doi=10.1111%2Fj.1530-9290.2012.00532.x&file=jiec532-sup-0001-S2.xls (accessed on 28 March 2019). [CrossRef]
- Bauer, C.; Hofer, J.; Althaus, H.J.; Del Duce, A.; Simons, A. The environmental performance of current and future passenger vehicles: Life cycle assessment based on a novel scenario analysis framework. Appl. Energy 2015, 157, 871–883. [Google Scholar] [CrossRef]
- Helmers, E.; Dietz, J.; Hartard, S. Electric Car Life Cycle Assessment Based on Real-world Mileage and the Electric Conversion Scenario. Int. J. Life Cycle Assess. 2017, 22, 15–30. [Google Scholar] [CrossRef]
- BMVI. The Future of Mobility Is Electric-Electric Mobility as a Building Block of Sustainable Mobility. German Ministry of Transport and Digital Infrastructure. 2019. Available online: https://www.bmvi.de/SharedDocs/EN/Dossier/Electric-Mobility-Sector/electric-mobility-sector.html (accessed on 10 December 2019).
- EEA. Electric Vehicles: A Smart Choice for the Environment. European Environmental Agency. 2019. Available online: https://www.eea.europa.eu/articles/electric-vehicles-a-smart (accessed on 10 December 2019).
- Almeida, A.; Nuno Sousa, N.; Coutinho-Rodrigues, J. Quest for Sustainability: Life-Cycle Emissions Assessment of Electric Vehicles Considering Newer Li-Ion Batteries. Sustainability 2019, 11, 2366. [Google Scholar] [CrossRef]
- Messagie, M.; Boureima, F.S.; Coosemans, T.; Macharis, C.; van Mierlo, J. A range-based vehicle Life Cycle Assessment incorporating variability in the environmental assessment of different vehicle technologies and fuels. Energies 2014, 7, 1467–1482. [Google Scholar] [CrossRef]
- Ellingsen, L.A.W.; Singh, B.; Strømman, A.H. The size and range effect: Lifecycle greenhouse gas emissions of electric vehicles. Environ. Res. Lett. 2016, 11, 1–8. [Google Scholar] [CrossRef]
- Hooftman, N.; Messagie, M.; Joint, F.; Segard, J.-B.; Coosemans, T. In-Life Range Modularity for Electric Vehicles: The Environmental Impact of a Range-Extender Trailer System. Appl. Sci. 2018, 8, 1016. [Google Scholar] [CrossRef]
- Helmers, E.; Weiss, M. Advances and critical aspects in the life-cycle assessment of battery-electric cars (review). Energy Emiss. Control Technol. 2017, 5, 1–18. [Google Scholar] [CrossRef]
- Lombardi, L.; Tribioli, L.; Cozzolino, R.; Bella, G. Comparative environmental assessment of conventional, electric, hybrid, and fuel cell powertrains based on LCA. Int. J. Life Cycle Assess. 2017, 22, 1989–2006. [Google Scholar] [CrossRef]
- Van Mierlo, J.; Boureima, F.; Sergeant, N.; Wynen, V.; Messagie, M.; Govaerts, L.; Denys, T.; Vanderschaeghe, M.; Macharis, C.; Turcksin, L.; et al. CLEVER: Clean Vehicle Research; Final Report Phase 1; Belgian Science Policy: Brussels, Belgium, 2009; p. 37. Available online: https://www.belspo.be/belspo/SSD/science/Reports/CLEVER_Finalreport_phaseI_ML.pdf (accessed on 16 September 2019).
- Nordelöf, A.; Messagie, M.; Tillman, A.M.; Ljunggren, M.; Söderman, J.V.M. Environmental impacts of hybrid, plug-in hybrid, and BEV—What can we learn from life cycle assessment? Int. J. Life Cycle Assess. 2014, 19, 1866–1890. [Google Scholar] [CrossRef]
- Notter, D.A.; Gauch, M.; Widmer, R.; Widmer, R.; Wäger, P.; Stamp, A.; Zah, R.; Althaus, H.-J. Contribution of Li-ion batteries to the environmental impact of EV. Environ. Sci. Technol. 2010, 44, 6550–6556. [Google Scholar] [CrossRef] [PubMed]
- Hawkins, T.R.; Singh, B.; Majeau-Bettez, G.; Strømman, A.H. Comparative Environmental Life Cycle Assessment of Conventional and Electric Vehicles. J. Ind. Ecol. 2012, 17, 53–64. [Google Scholar] [CrossRef]
- Mayyas, A.; Omar, M.; Hayajneh, M.; Mayyas, A.R. Vehicle’s lightweight design vs. electrification from life cycle assessment perspective. J. Clean. Prod. 2017, 167, 687–701. [Google Scholar] [CrossRef]
- Cox, B.; Mutel, C.L.; Bauer, C.; Beltran, A.M.; van Vuuren, D.P. Uncertain Environmental Footprint of Current and Future Battery Electric Vehicles. Environ. Sci. Technol. 2018, 52, 4989–4995. [Google Scholar] [CrossRef]
- Tietge, U.; Díaz, S.; Mock, P.; German, J.; Bandivadekar, A.; Ligterink, N. From Laboratory to Road. A 2016 Update of Official and real-world Fuel Consumption and CO2 Values for Passenger Cars in Europe. White Paper. November 2016. Available online: http://www.theicct.org/laboratory-road-2016-update (accessed on 7 May 2017).
- Tietge, U.; Díaz, S.; Mock, P.; German, J.; Bandivadekar, A.; Dornoff, J.; Ligterink, N. From Laboratory to Road. A 2018 Update of Official and “Real-World” Fuel Consumption and CO2 Values for Passenger Cars in Europe. White Paper. Available online: https://theicct.org/sites/default/files/publications/Lab_to_Road_2018_fv_20190110.pdf (accessed on 27 September 2019).
- Schaufenster. Questions about electric vehicles: How does data about energy consumption and range of electric vehicles come about? Parallel Impact Research of the Electric Mobility Showcase. Schaufenster Elektromobilität, results document No 6. May 2015, Report, Consortium Schaufenster Elektromobilität. Available online: http://buw.bridging-it.de/media/media/resultsdocumentsen/Results_Document_No_6_Data_about_energy_consumption_and_range_of_electric_vehicles.pdf (accessed on 5 February 2020).
- Haakana, A.; Laurikko, J.; Granström, R.; Hagman, R. Assessing Range and Performance of Electric Vehicles in Nordic Driving Conditions–End of Project Report. Nordisk Energieforskning. December 2013. Available online: https://docplayer.net/11036905-Assessing-range-and-performance-of-electric-vehicles-in-nordic-driving-conditions-project-final-report.html (accessed on 19 March 2019).
- IPCC. Fifth Assessment Report, Chapter 8–Transport. 2014. Available online: https://archive.ipcc.ch/pdf/assessment-report/ar5/wg3/ipcc_wg3_ar5_chapter8.pdf (accessed on 27 September 2019).
- Smit, R. Real-World CO2 Emissions Performance of the Australian New Passenger Vehicle Fleet 2008–2018—Impacts of Trends in Vehicle/Engine Design; TER (Transport Energy/Emission Research Pty Ltd.): Blackburn, VIC, Australia, 2019; p. 27. [Google Scholar]
- Zackrisson, M. Life Cycle Assessment of Long Life Lithium Electrode for Electric Vehicle Batteries. SWEREA-IVF Project Report 24603, 2016-01-21. 2016, p. 37. Available online: https://www.swerea.se/sites/default/files/trili_project_report_24603_1_lca_of_long_life_lithium_electrode_for_ev_batteries_5_ah_power_cell_160429_0.pdf (accessed on 16 September 2019).
- Helmers, E.; Marx, P. Electric cars: Technical characteristics and environmental impacts. Environ. Sci. Eur. 2012, 24, 14. [Google Scholar] [CrossRef]
- Lambert, F. Tesla Battery Degradation at Less Than 10% after over 160,000 Miles, According to Latest Data. Internet Page, Published 14 April 2018. Available online: https://electrek.co/2018/04/14/tesla-battery-degradation-data/ (accessed on 17 September 2019).
- Corno, M.; Pozzato, G. Active Adaptive Battery Aging Management for Electric Vehicles. IEEE Trans. Veh. Technol. 2019. [Google Scholar] [CrossRef]
- Weymar, E.; Finkbeiner, M. Statistical analysis of empirical lifetime mileage data for automotive LCA. Int. J. Life Cycle Assess. 2016, 21, 215–223. [Google Scholar] [CrossRef]
- Fotouhi, A.; Propp, K.; Auger, D.J.; Longo, S. State of Charge and State of Health Estimation Over the Battery Lifespan. In Behaviour of Lithium-Ion Batteries in Electric Vehicles; Pistoia, G., Liaw, B., Eds.; Springer: Cham, Switzerland, 2018; pp. 267–288. [Google Scholar] [CrossRef]
- Ahmadi, L.; Yip, A.; Fowler, M.; Young, S.B.; Fraser, R.A. Environmental feasibility of re-use of electric vehicle batteries. Sustain. Energy Technol. Assess. 2014, 6, 64–74. [Google Scholar] [CrossRef]
- Rohr, S.; Müller, S.; Baumann, M.; Kerler, M.; Ebert, F.; Kaden, D.; Lienkamp, M. Quantifying Uncertainties in Reusing Lithium-Ion Batteries from Electric Vehicles. Procedia Manuf. 2017, 8, 603–610. [Google Scholar] [CrossRef]
- Reinhardt, R.; Christodoulou, I.; Gassó-Domingo, S.; García, B.A. Towards sustainable business models for electric vehicle battery second use: A critical review. J. Environ. Manag. 2019, 245, 432–446. [Google Scholar] [CrossRef]
- Habermacher, F. Modeling Material Inventories and Environmental Impacts of Electric Passenger Cars. Master’s Thesis, 2011. Available online: https://www.empa.ch/documents/56122/458579/MasterThesis_Habermacher.pdf/7d82e2fb-247c-4e6e-a549-32e82bda8a37 (accessed on 17 May 2015).
- Althaus, H.J.; Gauch, M. Vergleichende Ökobilanz Individueller Mobilität, EMPA—Forschungsinstitut; ETH Zürich: Dübendorf, Germany, 2010; Available online: http://www.empa.ch/plugin/template/empa/*/104369 (accessed on 16 September 2019).
- Ecoinvent. Ecoinvent 3.6. 2020. Available online: https://www.ecoinvent.org/database/ecoinvent-36/ecoinvent-36.html (accessed on 13 January 2020).
- Simons, A. Road transport: New life cycle inventories for fossil-fuelled passenger cars and non-exhaust emissions in ecoinvent v3. Int. J. Life Cycle Assess. 2013, 21, 1299–1313. [Google Scholar] [CrossRef]
- Notter, D.A.; Gauch, M.; Widmer, R.; Wäger, P.; Stamp, A.; Zah, R.; Althaus, H.J. Supporting Information for the Manuscript Entitled “Contribution of Li-Ion Batteries to the Environmental Impact of Electric Vehicles”. 2010. Available online: https://pubs.acs.org/doi/suppl/10.1021/es903729a/suppl_file/es903729a_si_001.pdf (accessed on 16 September 2019).
- Der Golf, V.W. Umweltprädikat–Hintergrundbericht; Volkswagen AG: Wolfsburg, Germany, 2008; p. 21. [Google Scholar]
- Fluence, R.; Fluence, Z.E. Life Cycle Assessment. October 2011, p. 116. Available online: https://group.renault.com/wp-content/uploads/2014/09/fluence-acv-2011.pdf (accessed on 27 March 2019).
- Majeau-Bettez, G.; Hawkins, T.; Strömman, A.H. Life Cycle Environmental Assessment of Lithium-Ion and Nickel Metal Hydride Batteries for Plug-In Hybrid and Battery Electric Vehicles. Environ. Sci. Technol. 2011, 45, 4548–4554. [Google Scholar] [CrossRef] [PubMed]
- Spritmonitor.de. Dieselverbrauch: Volkswagen–Caddy. 2015. Available online: https://www.spritmonitor.de/de/uebersicht/50-Volkswagen/460-Caddy.html?fueltype=1 (accessed on 1 September 2015).
- Spritmonitor.de. Erdgasverbrauch Volkswagen Caddy. 2018. Available online: https://www.spritmonitor.de/de/uebersicht/50-Volkswagen/460-Caddy.html?fueltype=4 (accessed on 16 November 2018).
- Weiss, M.; Irrgang, L.; Kiefer, A.T.; Roth, J.R.; Helmers, E. Mass- and power-related efficiency trade-offs and CO2 emissions of compact passenger cars. J. Clean. Prod. 2020, 243, 118326. [Google Scholar] [CrossRef] [PubMed]
- Majeau-Bettez, G.; Hawkins, T.; Strömman, A.H. Life Cycle Environmental Assessment of Lithium-Ion and Nickel Metal Hydride Batteries for Plug-in Hybrid and Battery Electric Vehicles. Supporting Information. Environ. Sci. Technol. 2011, 45, 4548–4554. [Google Scholar] [CrossRef] [PubMed]
- Tesla. Tesla Gigafactory. 2018. Available online: https://www.tesla.com/en_AU/gigafactory (accessed on 22 November 2018).
- Frischknecht, R.; Tuchschmid, M.; Faist-Emmenegger, M.; Bauer, C.; Dones, R. Strommix und Stromnetz; Ecoinvent report No. 6, Teil XVI; Swiss Center for Life Cycle Inventories: Uster, Switzerland, December 2007; p. 143. [Google Scholar]
- Fehrenbach, H.; Lauwigi, C.; Liebich, A.; Ludmann, S. Documentation for the UMBERTO Based ifeu Electricity Model, Heidelberg. June 2016, p. 31. Available online: https://www.ifeu.de/wp-content/uploads/Documentation-IFEU-Electricity-Model-2016-06.pdf (accessed on 18 September 2019).
- Li, X.; Chalvatzis, K.J.; Pappas, D. China’s electricity emission intensity in 2020–An analysis at provincial level. Energy Procedia 2017, 142, 2779–2785. [Google Scholar] [CrossRef]
- Liang, Y.; Su, Y.; Xi, B.; Yu, Y.; Ji, D.; Sun, Y.; Cui, C.; Zhu, J. Life cycle assessment of lithium-ion batteries for greenhouse gas emissions. Resour. Conserv. Recycl. 2017, 117, 285–293. [Google Scholar] [CrossRef]
- Ellingsen, L.A.W.; Majeau-Bettez, G.; Singh, B.; Kumar Srivastava, A.K.; Ole Valøen, L.O.; Strømman, A.H. Life Cycle Assessment of a Lithium-Ion Battery Vehicle Pack. J. Ind. Ecol. 2013, 18, 113–124. [Google Scholar] [CrossRef]
- AIB. European Residual Mixes-Results of the Calculation of Residual Mixes for the Calendar Year 2018. Association of Issuing Bodies, Version 1.1, 2019-05-28. 2019, p. 36. Available online: https://www.aib-net.org/sites/default/files/assets/facts/residual-mix/2017/AIB_2017_Residual_Mix_Results_v13.pdf (accessed on 20 October 2019).
- Meylan, F.D.; Moreau, V.; Erkman, S. Material constraints related to storage of future European renewable electricity surpluses with CO2 methanation. Energy Policy 2016, 94, 366–376. [Google Scholar] [CrossRef]
- Yang, Z.; Yu, H.; Wu, C.; Cao, G.; Xie, J.; Zhao, X. Preparation of Nano-structured LiFexMn1-xPO4 (x = 0, 0.2, 0.4) by Reflux Method and Research on the Influences of Fe(II) Substitution. J. Mater. Sci. Technol. 2012, 9, 823–827. [Google Scholar] [CrossRef]
- Peters, J.F.; Weil, M. A Critical Assessment of the Resource Depletion Potential of Current and Future Lithium-Ion Batteries. Resources 2016, 46, 46. [Google Scholar] [CrossRef]
- EU. Study on the Review of the List of Critical Raw Materials-Criticality Assessments. Final Report. 2017, p. 93. Available online: https://publications.europa.eu/en/publication-detail/-/publication/08fdab5f-9766-11e7-b92d-01aa75ed71a1/language-en (accessed on 19 October 2018).
- Tsurukawa, N.; Prakash, S.; Manhart, A. Social Impacts of Artisanal Cobalt Mining in Katanga, Democratic Republic of Congo; Report; Öko-Institut e.V. Freiburg Head Office, November 2011; p. 75. Available online: https://www.oeko.de/oekodoc/1294/2011-419-en.pdf (accessed on 19 October 2018).
- Schneider, L.; Berger, M.; Schüler-Hainsch, E.; Knöfel, S.; Ruhland, K.; Mosig, J.; Bach, V.; Finkbeiner, M. The economic resource scarcity potential (ESP) for evaluating resource use based on life cycle assessment. Int. J. Life Cycle Assess. 2014, 19, 601–610. [Google Scholar] [CrossRef]
- Casals, L.C.; García, B.A.; Aguesse, F.; Iturrondobeitia, A. Second life of electric vehicle batteries: Relation between materials degradation and environmental impact. Int. J. Life Cycle Assess. 2017, 22, 82–93. [Google Scholar] [CrossRef]
- Ahmadi, L.; Young, S.B.; Fowler, M.; Roydon AFraser, R.A.; Achachlouei, M.A. A cascaded life cycle: Reuse of electric vehicle lithium-ion battery packs in energy storage systems. Int. J. Life Cycle Assess. 2017, 22, 111–124. [Google Scholar] [CrossRef]
- Richa, K.; Babbitt, C.W.; Nenadic, N.G.; Gaustad, G. Environmental trade-offs across cascading lithium-ion battery life cycles. Int. J. Life Cycle Assess. 2017, 22, 66–81. [Google Scholar] [CrossRef]
- ICCT. Effects of Battery Manufacturing on Electric Vehicle Life-Cycle Greenhouse Gas Emissions. Briefing. The International Council on Clean Transportation, February 2018; p. 12. Available online: https://www.theicct.org/sites/default/files/publications/EV-life-cycle-GHG_ICCT-Briefing_09022018_vF.pdf (accessed on 19 March 2019).
- Neubauer, J.; Smith, K.; Wood, E.; Pesaran, A. Identifying and Overcoming Critical Barriers to Widespread Second Use of PEV Batteries. Technical Report NREL/TP-5400-63332; 2015. Available online: https://www.nrel.gov/docs/fy15osti/63332.pdf (accessed on 19 March 2019).
- May, J.F.; Kanz, O.; Schürheck, P.; Fuge, N.; Waffenschmidt, E. Influence of usage patterns on ecoefficiency of battery storage systems for electromobility and home storage. In Proceedings of the 3rd PLATE 2019 Conference, Berlin, Germany, 18–20 September 2019; Available online: https://www.researchgate.net/publication/335967277_Influence_of_usage_patterns_on_ecoefficiency_of_battery_storage_systems_for_electromobility_and_home_storage (accessed on 23 September 2019).
- Bobba, S.; Mathieux, F.; Ardente, F.; Blengini, G.A.; Cusenza, M.A.; Podias, A.; Pfrang, A. Life Cycle Assessment of repurposed electric vehicle batteries: An adapted method based on modelling energy flows. J. Energy Storage 2018, 19, 213–225. [Google Scholar] [CrossRef]
- Helmers, E. Assessment of the environmental sustainability of modern vehicle drives–on the way from Diesel car boom to electric vehicles. Umweltwiss. Schadst. Forsch. 2010, 22, 564–578. [Google Scholar] [CrossRef]
- Tate. Project Report: Vehicle Emission Measurement and Analysis-Cambridge City Council; Draft document version 1.0: 28th November 2013; University of Leeds, Institute for Transport Studies, 2013; p. 65. Available online: https://www.cambridge.gov.uk/sites/default/files/documents/Cam_VEMS_ProjectReport_v1.0.pdf (accessed on 8 May 2017).
- GreenCarCongress. Study Finds Total PM10 Emissions from EVs Equal to Those of Modern ICEVs; Role of Weight and Non-Exhaust PM. 18 April 2016. Available online: https://www.greencarcongress.com/2016/04/20160418-pm10.html (accessed on 18 September 2019).
- Weiss, M.; Bonnel, P.; Hummel, R.; Provenza, A.; Manfredi, U. On-road emissions of light-duty vehicles in Europe. Environ. Sci. Technol. 2011, 45, 8575–8581. [Google Scholar] [CrossRef]
- Valverde, V.; Mora, B.A.; Clairotte, M.; Pavlovic, J.; Suarez-Bertoa, R.; Giechaskiel, B.; Astorga-LLorens, C.; Fontaras, G. Emission Factors Derived from 13 Euro 6b Light-Duty Vehicles Based on Laboratory and On-Road Measurements. Atmosphere 2019, 10, 243. [Google Scholar] [CrossRef]
- Jezek, I.; Drinovec, L.; Ferrero, L.; Carriero, M.; Mocnik, G. Determination of car on-road black carbon and particle number emission factors and comparison between mobile and stationary measurements. Atmos. Meas. Technol. 2015, 8, 43–55. [Google Scholar] [CrossRef]
- Kumar, P.; Morawska, L.; Harrison, R.M. Nanoparticles in European Cities and Associated Health Impacts. Handdb. Environ. Chem. 2013, 26, 339–366. [Google Scholar] [CrossRef]
- Huppes, G.; van Oers, L. Evaluation of Weighting Methods for Measuring the EU-27 Overall Environmental Impact. JRC Technical and Scientific Report 67216. p. 90. Available online: https://eplca.jrc.ec.europa.eu/uploads/LCIA-Evaluation-of-weighting-methods-in-EU27.pdf (accessed on 15 December 2019).
- Bauer, C. The environmental performance of current & future passenger vehicles. In Proceedings of the 21th ETH Conference on Combustion Generated Nanoparticles, Zurich, Switzerland, 19–22 June 2017; Available online: http://www.nanoparticles.ch/archive/2017_Bauer_FO.pdf (accessed on 23 September 2019).
- T&E. CO2 Emissions from Cars: The Facts. A Report by Transport & Environment, Published: April 2018; p. 53. Available online: https://www.transportenvironment.org/sites/te/files/publications/2018_04_CO2_emissions_cars_The_facts_report_final_0_0.pdf (accessed on 18 September 2019).
- Chen, Y.; Borken-Kleefeld, J. NOx Emissions from Diesel Passenger Cars Worsen with Age. Environ. Sci. Technol. 2016, 50, 3327–3332. [Google Scholar] [CrossRef] [PubMed]
- Helmers, E.; Tietge, U.; Butler, T. Radiative forcing from European passenger vehicles emissions (1995–2015) based on real-world use. In Proceedings of the 22nd ETH Conference on Combustion Generated Nanoparticles, Zürich, Switzerland, 18–21 June 2018; Available online: http://www.nanoparticles.ch/archive/2018_Helmers_PR.pdf (accessed on 17 September 2019).
- Emilsson, E.; Dahllöf, L. Lithium-Ion Vehicle Battery Production Status 2019 on Energy Use, CO2 Emissions, Use of Metals, Products Environmental Footprint, and Recycling. Report Number C 444 of the Swedish Environmental Research Institute. Available online: https://www.ivl.se/download/18.14d7b12e16e3c5c36271070/1574923989017/C444.pdf (accessed on 8 December 2019).
- Romare, M.; Dahllöf, L. The Life Cycle Energy Consumption and Greenhouse Gas Emissions from Lithium-Ion Batteries. A Study with Focus on Current Technology and Batteries for Light-Duty Vehicles. Swedish Environmental Research Institute, Report Number C 243: 58p. Available online: https://www.ivl.se/download/18.5922281715bdaebede9559/1496046218976/C243%20The%20life%20cycle%20energy%20consumption%20and%20CO2%20emissions%20from%20lithium%20ion%20batteries%20.pdf (accessed on 9 December 2019).
- Khan, I.M.; Yasmin, T.; Shakoor, A. Technical overview of compressed natural gas (CNG) as a transportation fuel. Renew. Sustain. Energy Rev. 2015, 51, 785–797. [Google Scholar] [CrossRef]
- Slowik, P.; Pavlenko, N.; Lutsey, N. Assessment of Next-Generation Electric Vehicle Technologies. International Council on Clean Transportation. White Paper. October 2016. Available online: https://theicct.org/sites/default/files/publications/Next%20Gen%20EV%20Tech_white-paper_ICCT_31102016.pdf (accessed on 19 March 2019).
- Helms, H.; Pehnt, M.; Lambrecht, U.; Liebich, A. Electric vehicle and plug-in hybrid energy efficiency and life cycle emissions. In Proceedings of the 18th International Symposium Transport and Air Pollution, Session 3: Electro and Hybrid Vehicles; 12pAvailable online: https://pdfs.semanticscholar.org/ca98/1a099bd4e83bb292f997a12bf348fff8cff4.pdf (accessed on 20 October 2019).
- Castellani, V.; Fantoni, M.; Cristobal, J.; Zampori, L.; Sala, S. Consumer Footprint-Basket of Products Indicator on Mobility; EUR 28763 EN; Publications Office of the European Union: Luxembourg, 2017; ISBN 978-92-79-73191-4. [Google Scholar] [CrossRef]
- ICCT. European Vehicle Market Statistics-Pocketbook 2018/19. Available online: http://eupocketbook.org/wp-content/uploads/2019/12/ICCT_Pocketbook_2019_Web.pdf (accessed on 19 January 2020).
- Cooney, G.; Hawkins, T.R.; Marriott, J. Life Cycle Assessment of Diesel and Electric Public Transportation Buses. J. Ind. Ecol. 2013, 17, 689–699. [Google Scholar] [CrossRef]
- Gao, Y.; Guo, S.; Ren, J.; Zhao, Z.; Ehsan, A.; Zheng, Y. An Electric Bus Power Consumption Model and Optimization of Charging Scheduling Concerning Multi-External Factors. Energies 2018, 11, 2060. [Google Scholar] [CrossRef]
- Zhou, B.; Wu, Y.; Zhou, B.; Wang, R.; Ke, W.; Zhang, S.; Hao, J. Real-world performance of battery electric buses and their life-cycle benefits with respect to energy consumption and carbon dioxide emissions. Energy 2016, 96, 603–613. [Google Scholar] [CrossRef]
- Chester, M.V.; Horvath, A. Environmental assessment of passenger transportation should include infrastructure and supply chains. Environ. Res. Lett. 2009, 4, 024008. [Google Scholar] [CrossRef]
- UBA. Treibhausgas-Emissionen durch Infrastruktur und Fahrzeuge des Straßen-, Schienen- und Luftverkehrs sowie der Binnenschifffahrt in Deutschland. Arbeitspaket 4 des Projektes “Weiterentwicklung des Analyseinstrumentes Renewbility”. Report 96/2013 of the German Federal Environ. Protection Agency (UBA). 2014. Available online: https://www.umweltbundesamt.de/sites/default/files/medien/376/publikationen/texte_96_2013_treibhausgasemissionen_durch_infrastruktur_und_fahrzeuge_2015_01_07.pdf (accessed on 27 September 2019).
- Ligen, Y. Environmental and Economic Assessment of Current and Future Freight Transport Systems by Road and Rail in Switzerland. Master’s Thesis, ETH Zürich, 2015; 101p. Available online: https://www.psi.ch/sites/default/files/import/ta/PublicationTab/MSc_Yorick_Ligen_2015.pdf (accessed on 20 October 2019).
- EU. Transport. 2019. Available online: https://ec.europa.eu/clima/policies/international/paris_protocol/transport_en (accessed on 18 September 2019).
- EU. Report from the Commission to the European Parliament, the Council, the European Economic and Social Committee, the Committee of the Regions and the European Investment Bank on the Implementation of the Strategic Action Plan on Batteries: Building a Strategic Battery Value Chain in Europe. Brussels, 9.4.2019, COM(2019) 176 Final, 17p. 2019. Available online: https://eur-lex.europa.eu/resource.html?uri=cellar:72b1e42b-5ab2-11e9-9151-01aa75ed71a1.0001.02/DOC_1&format=PDF (accessed on 3 October 2019).
- Kim, J.Y.; Jeong, S.J.; Cho, Y.J.; Kim, K.S. Eco-friendly manufacturing strategies for simultaneous consideration between productivity and environmental performances: A case study on a printed circuit board manufacturing. J. Clean. Prod. 2014, 67, 249–257. [Google Scholar] [CrossRef]
- Esfandyari, A.; Härter, S.; Javied, T.; Franke, J. A Lean Based Overview on Sustainability of Printed Circuit Board production assembly. Procedia CIRP 2015, 26, 305–310. [Google Scholar] [CrossRef]
- Ochoa, M.L.A.; He, H.; Schoenung, J.M.; Helminen, E.; Okrasinski, T.; Schaeffer, B.; Smith, B.; Davignon, J.; Marcanti, L.; Olivetti, E.A. Design parameters and environmental impact of printed wiring board manufacture. J. Clean. Prod. 2019, 238, 117807. [Google Scholar] [CrossRef]
- Meyer, R.; Benetto, E.; Mauny, F.; Lavandier, C. Characterization of damages from road traffic noise in life cycle impact assessment: A method based on emission and propagation models. J. Clean. Prod. 2019, 231, 121–131. [Google Scholar] [CrossRef]


| VW Caddy Propulsion (Fuel) | Main Sensitivity Parameters (1–3) | Vehicle Number # | ||
|---|---|---|---|---|
| 1: Electricity Choice During Battery Production (See also Table 3) | 2: Emission Profile | 3: Use Phase Electricity Choice | ||
| Petrol | Euro 5 original | 1 | ||
| Euro 5 scaled | 2 | |||
| Euro 5 real-world | 3 | |||
| Natural gas (CNG) | Euro 5 real-world | 3a | ||
| Diesel | Euro 5 original | 4 | ||
| Euro 5 scaled | 5 | |||
| Euro 5 real-world | 6 | |||
| Electric | China | abrasion original | DE 2013 * | 7 |
| DE 2050 ** | 8 | |||
| abrasion real-world | DE 2013 * | 9 | ||
| DE 2050 ** | 10/10a | |||
| European average | abrasion real-world | DE 2013 * | 11 | |
| 100% PV | abrasion real-world | DE 2013 * | 12 | |
| 100% wind | abrasion real-world | DE 2013 * | 13 | |
| Category | Component (Specification) | Location of Production (Distances) | Determination of Weight and Composition | Composition Details (Total Weight) |
|---|---|---|---|---|
| Glider | 200 km away from Poznań, Poland | A, B, C | see Tables S1 and S2 in Supplement #2 in Supplementary Materials | |
| ICEV powertrain (for complete composition see Tables S3–S8 in Supplement #2 in Supplementary Materials) | Motor (1.6L-petrol engine, 75 kW, 148 Nm, manufacturer ID: BGU 196175) | Salzgitter, Germany | A, D, E | (157 kg) 70.2% conventional steel, 17.3% Al, 6.5% plastics, 2.3% stainless steel, 1.1% rubber, 0.5% Cu, 1.5% polyamide, 0.6% polypropylene |
| gearbox | Kassel, Germany | A, E | (38.5 kg) 30.9% Al, 69.1% high-tensile steel | |
| Pb battery (61 Ah) | Hannover, Germany | A, F | (16.7 kg) 68.3% Pb, 14% H2O, 8% H2SO4, 4.1% PP, 2% fiber glass, 1.9% PE, 1% Cu, 0.7% Sb, 0.03% As | |
| remaining parts (e.g., starter, exhaust system, fuel pump) | 400 km average | A | (102.6 kg) see Table S5 in Supplement #2 in Supplementary Materials | |
| BEV powertrain (for complete composition see Supplementary Tables S6–S8) | Motor (FIMEA type N 80, 65 kW, 500 Nm) | Liscate (Italy) | manufacturer data | (128 kg) 34.4% Al, 52.3% high-tensile steel, 10.95% Cu, 2.35% PE |
| Gearbox (Novatec AXLE ZG0302 TG050200) | Palazzuolo sul Senio (Italy) | A, E | (27 kg) 30.9% Al, 69.1% high-tensile steel | |
| Pb battery 26 Ah (RPTechnik, type RPower OGiV 12260) | Rodgau (Germany) | A, F | (8.8 kg) composition equally to ICEV Pb battery | |
| powerpac (voltage converter, inverter, control device) | Ranica (Italy) | A | (23 kg) composition due to Habermacher (2011) [47] | |
| charger (TC Charger type TCCH-H192V-36A) | Hangzhou (China) | A, C | (20 kg) composition due to Habermacher (2011) [47] | |
| BMS (LIGOO type EK-FT-12) | Hefei (China) | A, G | (7.3 kg) 50% Cu, 40% stainless steel, 10% integrated circuits | |
| remaining parts (e.g. cables, holders, water pump, vacuum pump | 400 km average | A | (138.3 kg) see Table S8 in Supplement #2 in Supplementary Materials | |
| Final assembly (ICEV) | Poznań (Poland) | A | detailed weight information provided in the Supplements #1 and #2 in Supplementary Materials | |
| Final assembly (BEV), electric conversion | Birkenfeld (Germany) | A | ||
| Label | China | European Average (UCTE b 2004, as Utilized by Ecoinvent until 2014) | PV | Wind | |
|---|---|---|---|---|---|
| Fossil Electricity Production at Power Plant (%) | Coal Fossil (All) | 78.5 a | 26.7 c | ||
| 81.7 a | 51.1 a | ||||
| g CO2-eq/kWh d | 1180 | 531 | 92.5 | 15.8 | |
| Description/ Ecoinvent modules applied | “medium voltage, at grid”, China | “medium voltage, at grid, UCTE b“ | “medium voltage, at grid [DE]” (Ecoinvent 2.2), adapted to 100% renewable each | ||
| Propulsion | Emission Profile/Sensitivity | Applied to Vehicle #, see Table 1 | Number of Species Included | Comment/Origin |
|---|---|---|---|---|
| ICEV | Euro 5 original, Euro 5 scaled | 1; 2; 4; 5 | emissions to air: 25, to water: 6, to soil: 6 | according to Ecoinvent 2.2 |
| Euro 5 real-world | 3; 6 | emissions to air: 63, to water: 31, to soil: 31 | emission species added according to Ecoinvent 3, four diesel emission species corrected (see Table 5) | |
| BEV | abrasion original | 7; 8 | emissions to air: 10, to water: 6, to soil: 6 | according to Ecoinvent 2.2 |
| abrasion real-world | 9–13 | emissions to air: 36, to water: 31, to soil: 31 | non-exhaust emission species added/adapted according to Ecoinvent 3 |
| Species Emitted | Ecoinvent 2.2 (Diesel Euro 5), and Applied for Vehicles #4+5 kg/km | Ecoinvent 3 (Diesel Euro 5, Simons 2013) [50], kg/km | Corrected (Diesel Euro 5, Applied for Vehicle #6) kg/km | Comments, Sources |
|---|---|---|---|---|
| SO2 | 1.07 × 10⁻⁶ | 1.06 × 10⁻⁶ | 3.19 × 10⁻⁶ | corrected value from sulphur content in fuel plus lubrication oil combustion (Helmers 2010) [79] |
| CO (fossil) | 5.09 × 10⁻⁴ | 6.07 × 10⁻⁵ | 2.55 × 10⁻⁴ | perhaps a data error in Simons (2013) [50]. The corrected value is calculated from the Ecoinvent 2.2 emission which should have been halved due to Simons (2013) [50] |
| NOx | 2.00 × 10⁻⁴ | 9.38 × 10⁻⁵ | 8.63 × 10⁻⁴ | updated according to data from remote-sensing campaigns (Tate 2013) [80] |
| Particu-lates > 10 µm | 7.82 × 10⁻⁵ | 1.19 × 10⁻⁵ | 3.84 × 10⁻³ | originally abrasion considered only. We updated this emission according to data from remote-sensing campaigns (Tate 2013) [80] |
© 2020 by the authors. Licensee MDPI, Basel, Switzerland. This article is an open access article distributed under the terms and conditions of the Creative Commons Attribution (CC BY) license (http://creativecommons.org/licenses/by/4.0/).
Share and Cite
Helmers, E.; Dietz, J.; Weiss, M. Sensitivity Analysis in the Life-Cycle Assessment of Electric vs. Combustion Engine Cars under Approximate Real-World Conditions. Sustainability 2020, 12, 1241. https://doi.org/10.3390/su12031241
Helmers E, Dietz J, Weiss M. Sensitivity Analysis in the Life-Cycle Assessment of Electric vs. Combustion Engine Cars under Approximate Real-World Conditions. Sustainability. 2020; 12(3):1241. https://doi.org/10.3390/su12031241
Chicago/Turabian StyleHelmers, Eckard, Johannes Dietz, and Martin Weiss. 2020. "Sensitivity Analysis in the Life-Cycle Assessment of Electric vs. Combustion Engine Cars under Approximate Real-World Conditions" Sustainability 12, no. 3: 1241. https://doi.org/10.3390/su12031241
APA StyleHelmers, E., Dietz, J., & Weiss, M. (2020). Sensitivity Analysis in the Life-Cycle Assessment of Electric vs. Combustion Engine Cars under Approximate Real-World Conditions. Sustainability, 12(3), 1241. https://doi.org/10.3390/su12031241