Exploring the Role of Advertising Types on Improving the Water Consumption Behavior: An Application of Integrated Fuzzy AHP and Fuzzy VIKOR Method

 ,
, 
 , ,
, ,  ,
,  and
and
Abstract
1. Introduction
1.1. Advertising and Consumption
1.2. Decision-Making Techniques
1.3. Literature Review
1.3.1. Previous Studies Related to the Effective Criteria of Water Consumption
1.3.2. Previous Studies Related to Advertising and Consumer Behavior
1.3.3. Background of the Studies Related to the Proposed Method
1.4. Outline of the Current Study
2. Materials and Methods
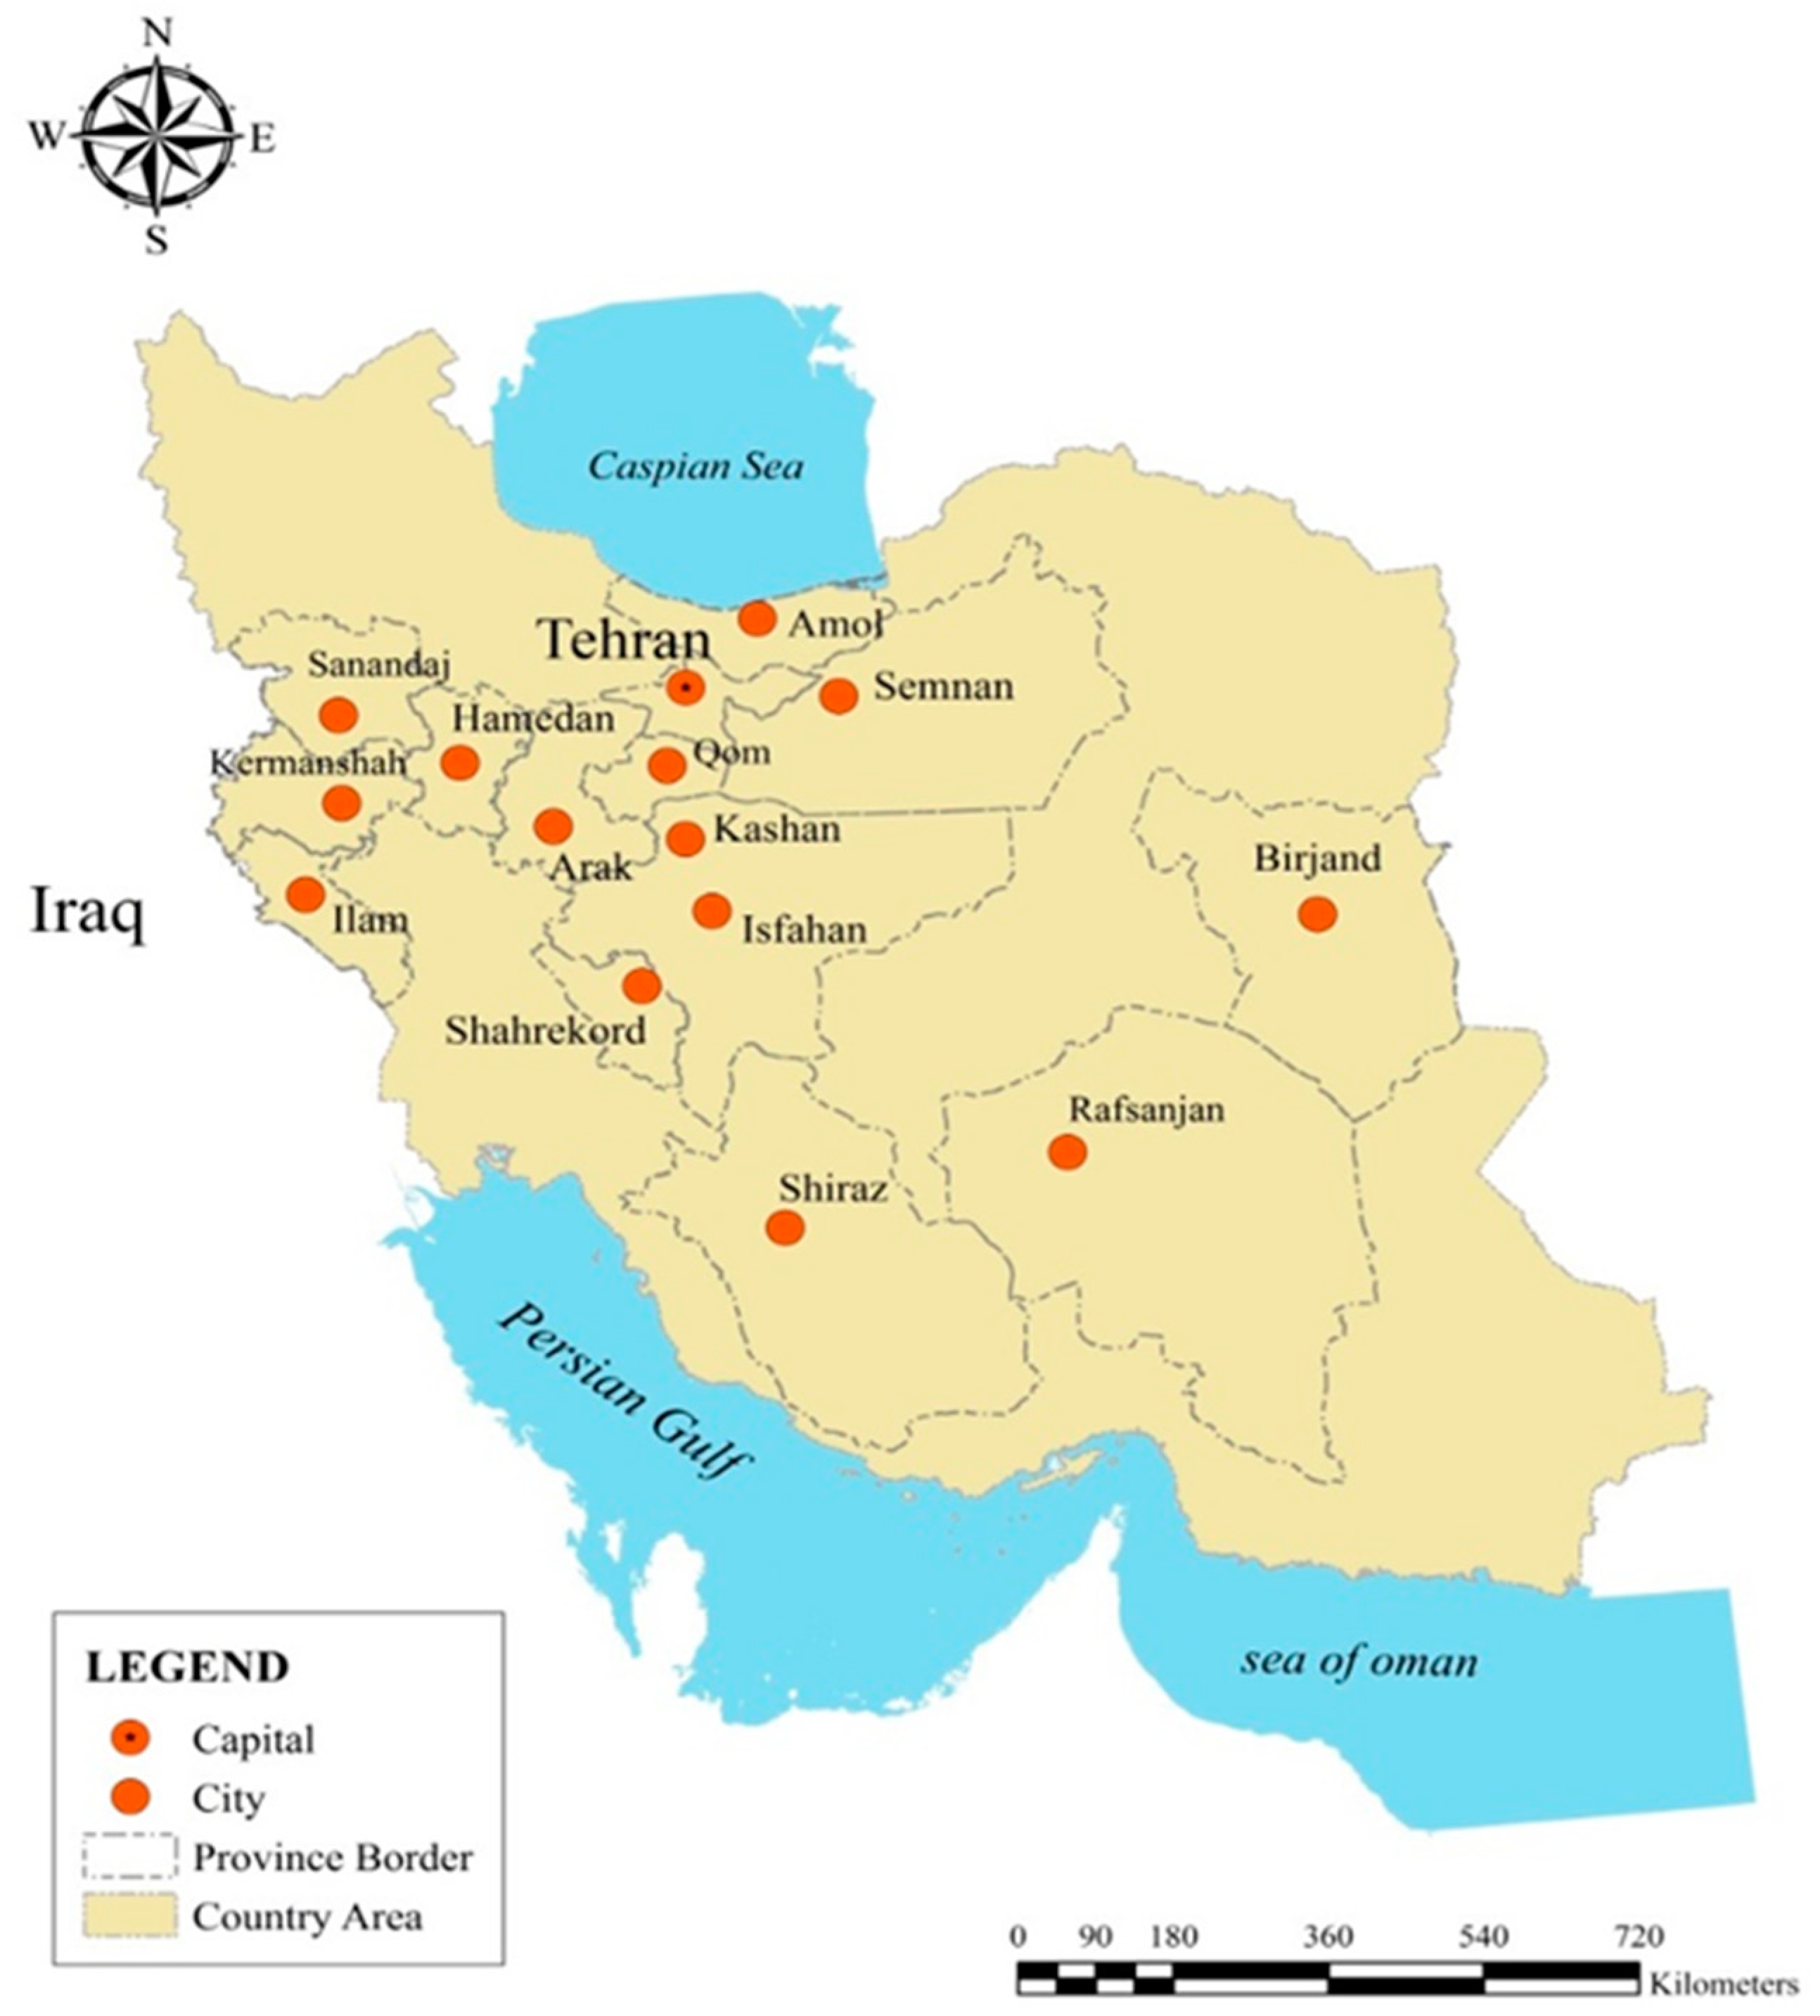
2.1. Study Area
2.2. Questionnaire Design Method
2.3. Theories Used to Design a Questionnaire
2.4. Scoring Method
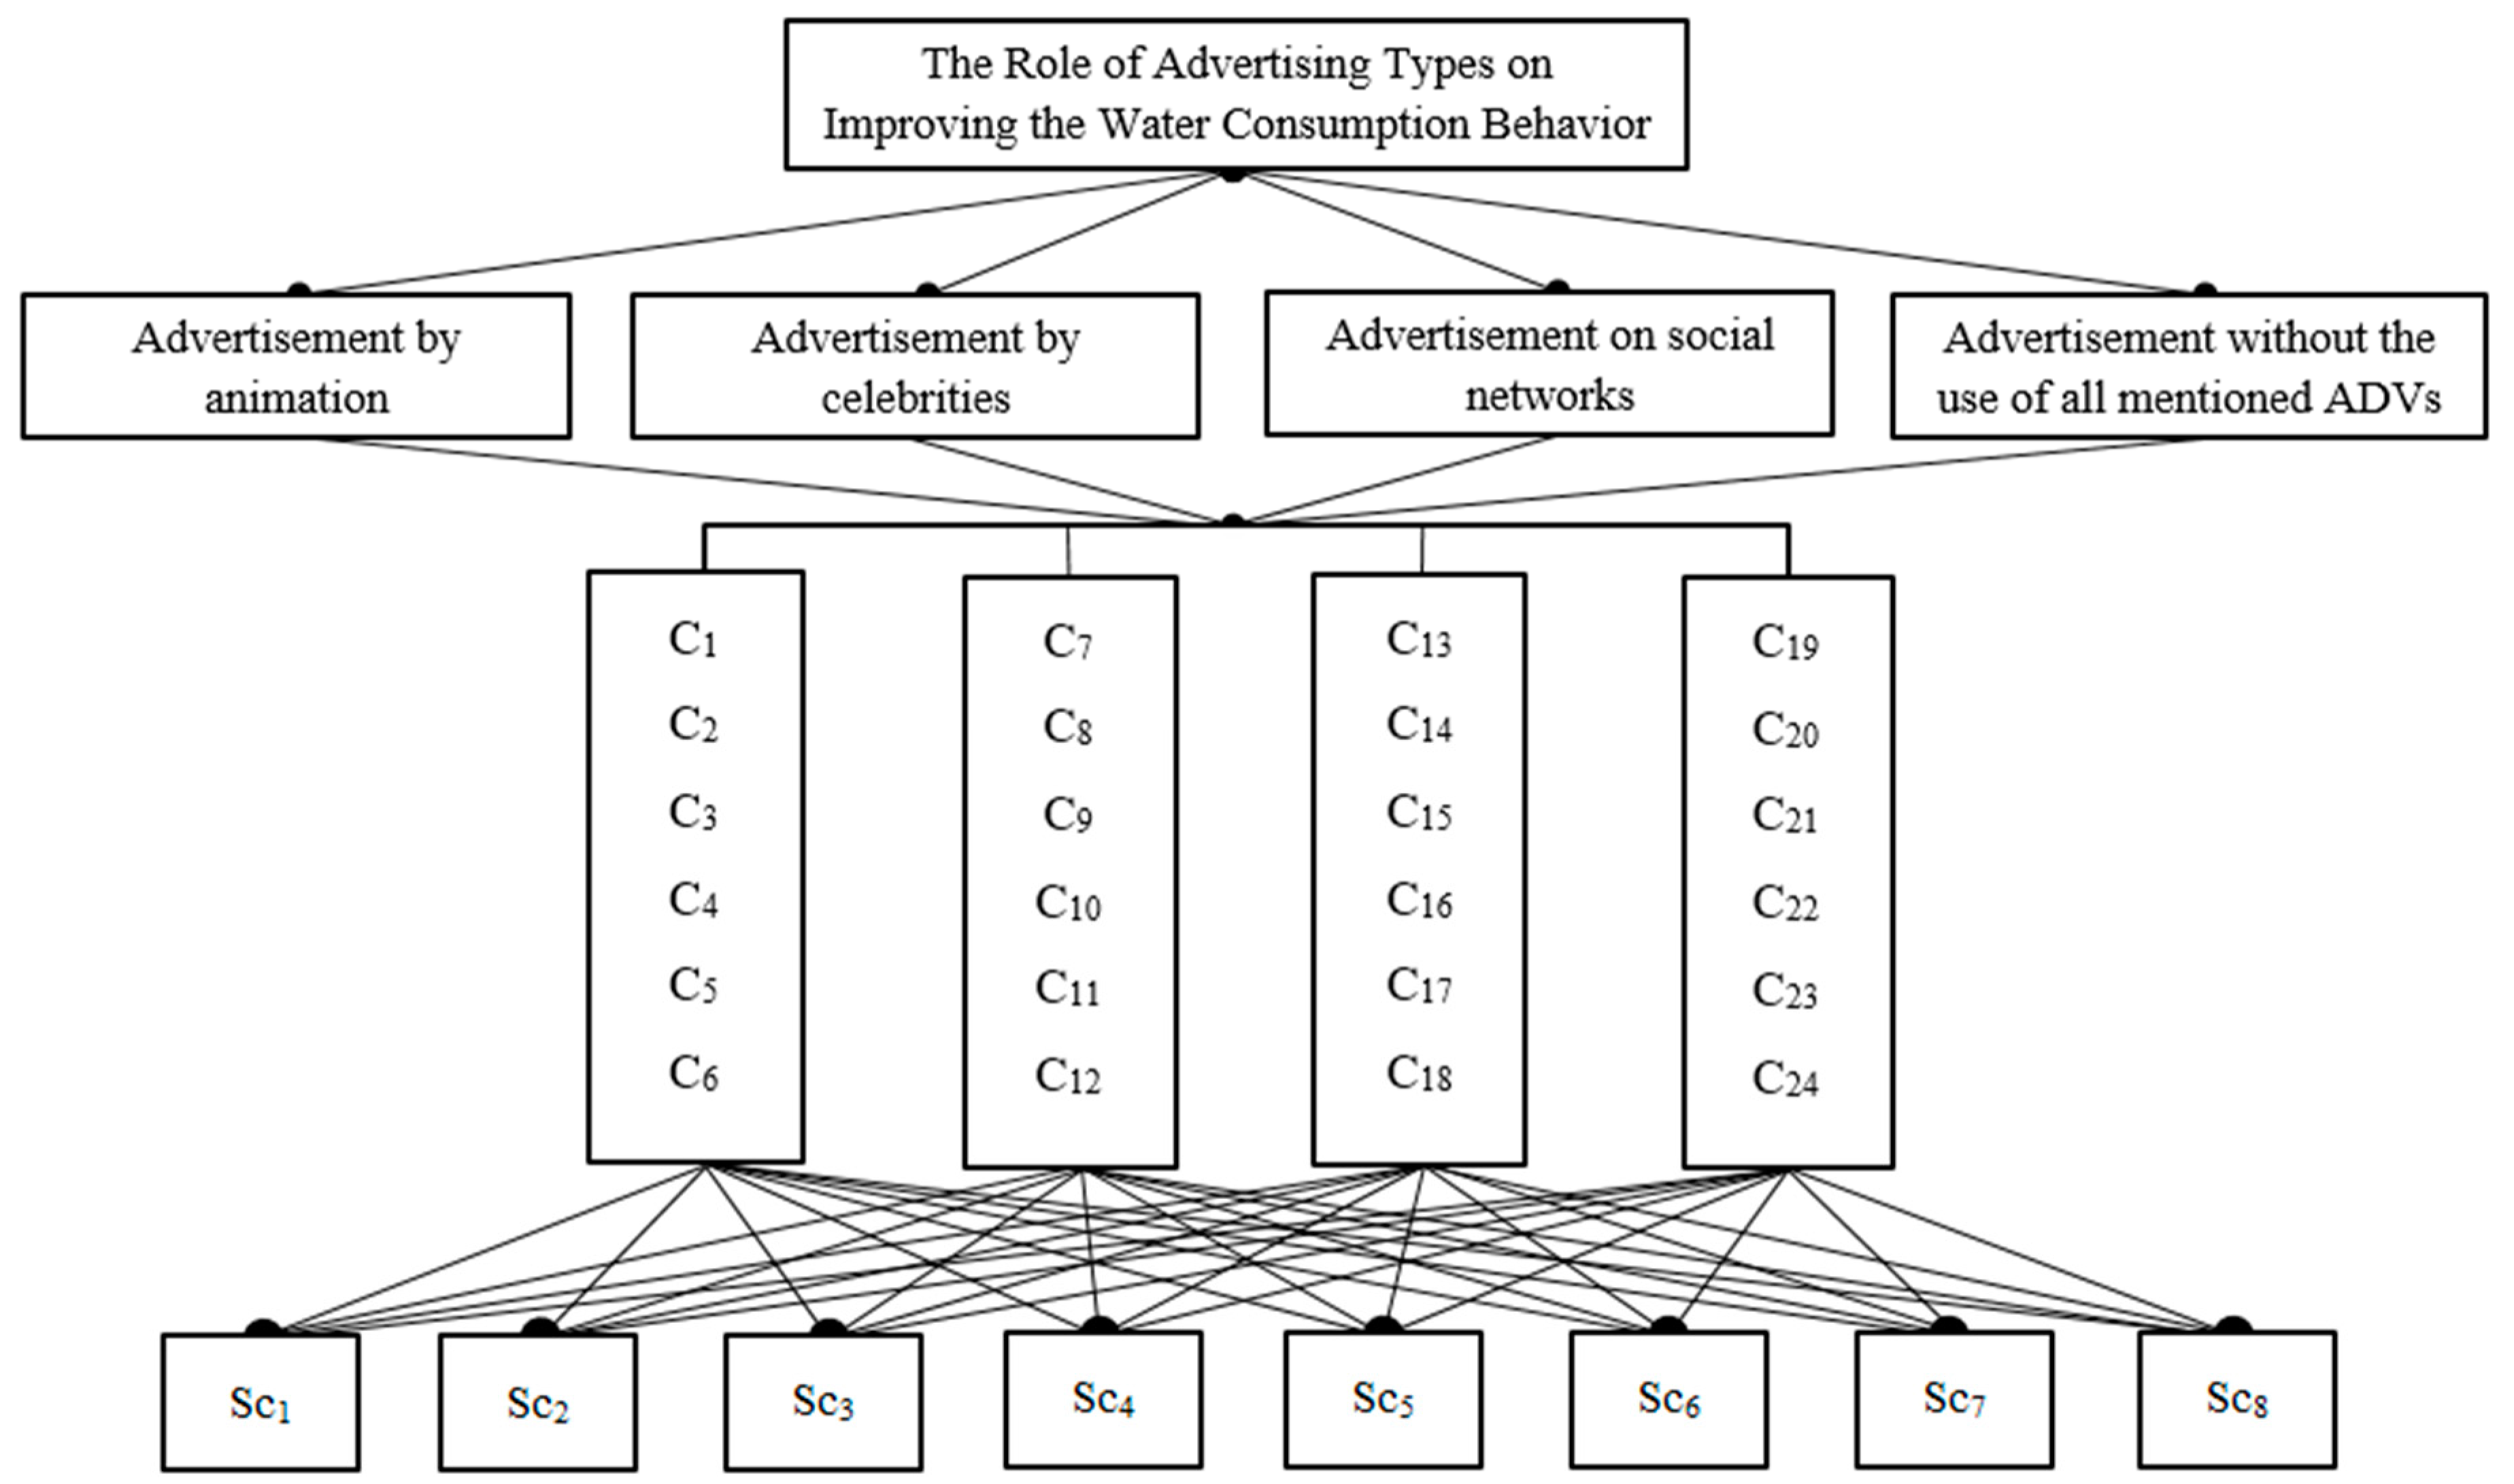
2.5. Alternatives and Assumptions of the Questionnaire
2.5.1. Advertising Using Animation
2.5.2. Advertising Using Celebrities
2.5.3. Advertising on Social Networks
2.5.4. Advertising Without the use of Celebrities, Animation, and Social Networks
2.6. Trapezoidal Fuzzy Numbers
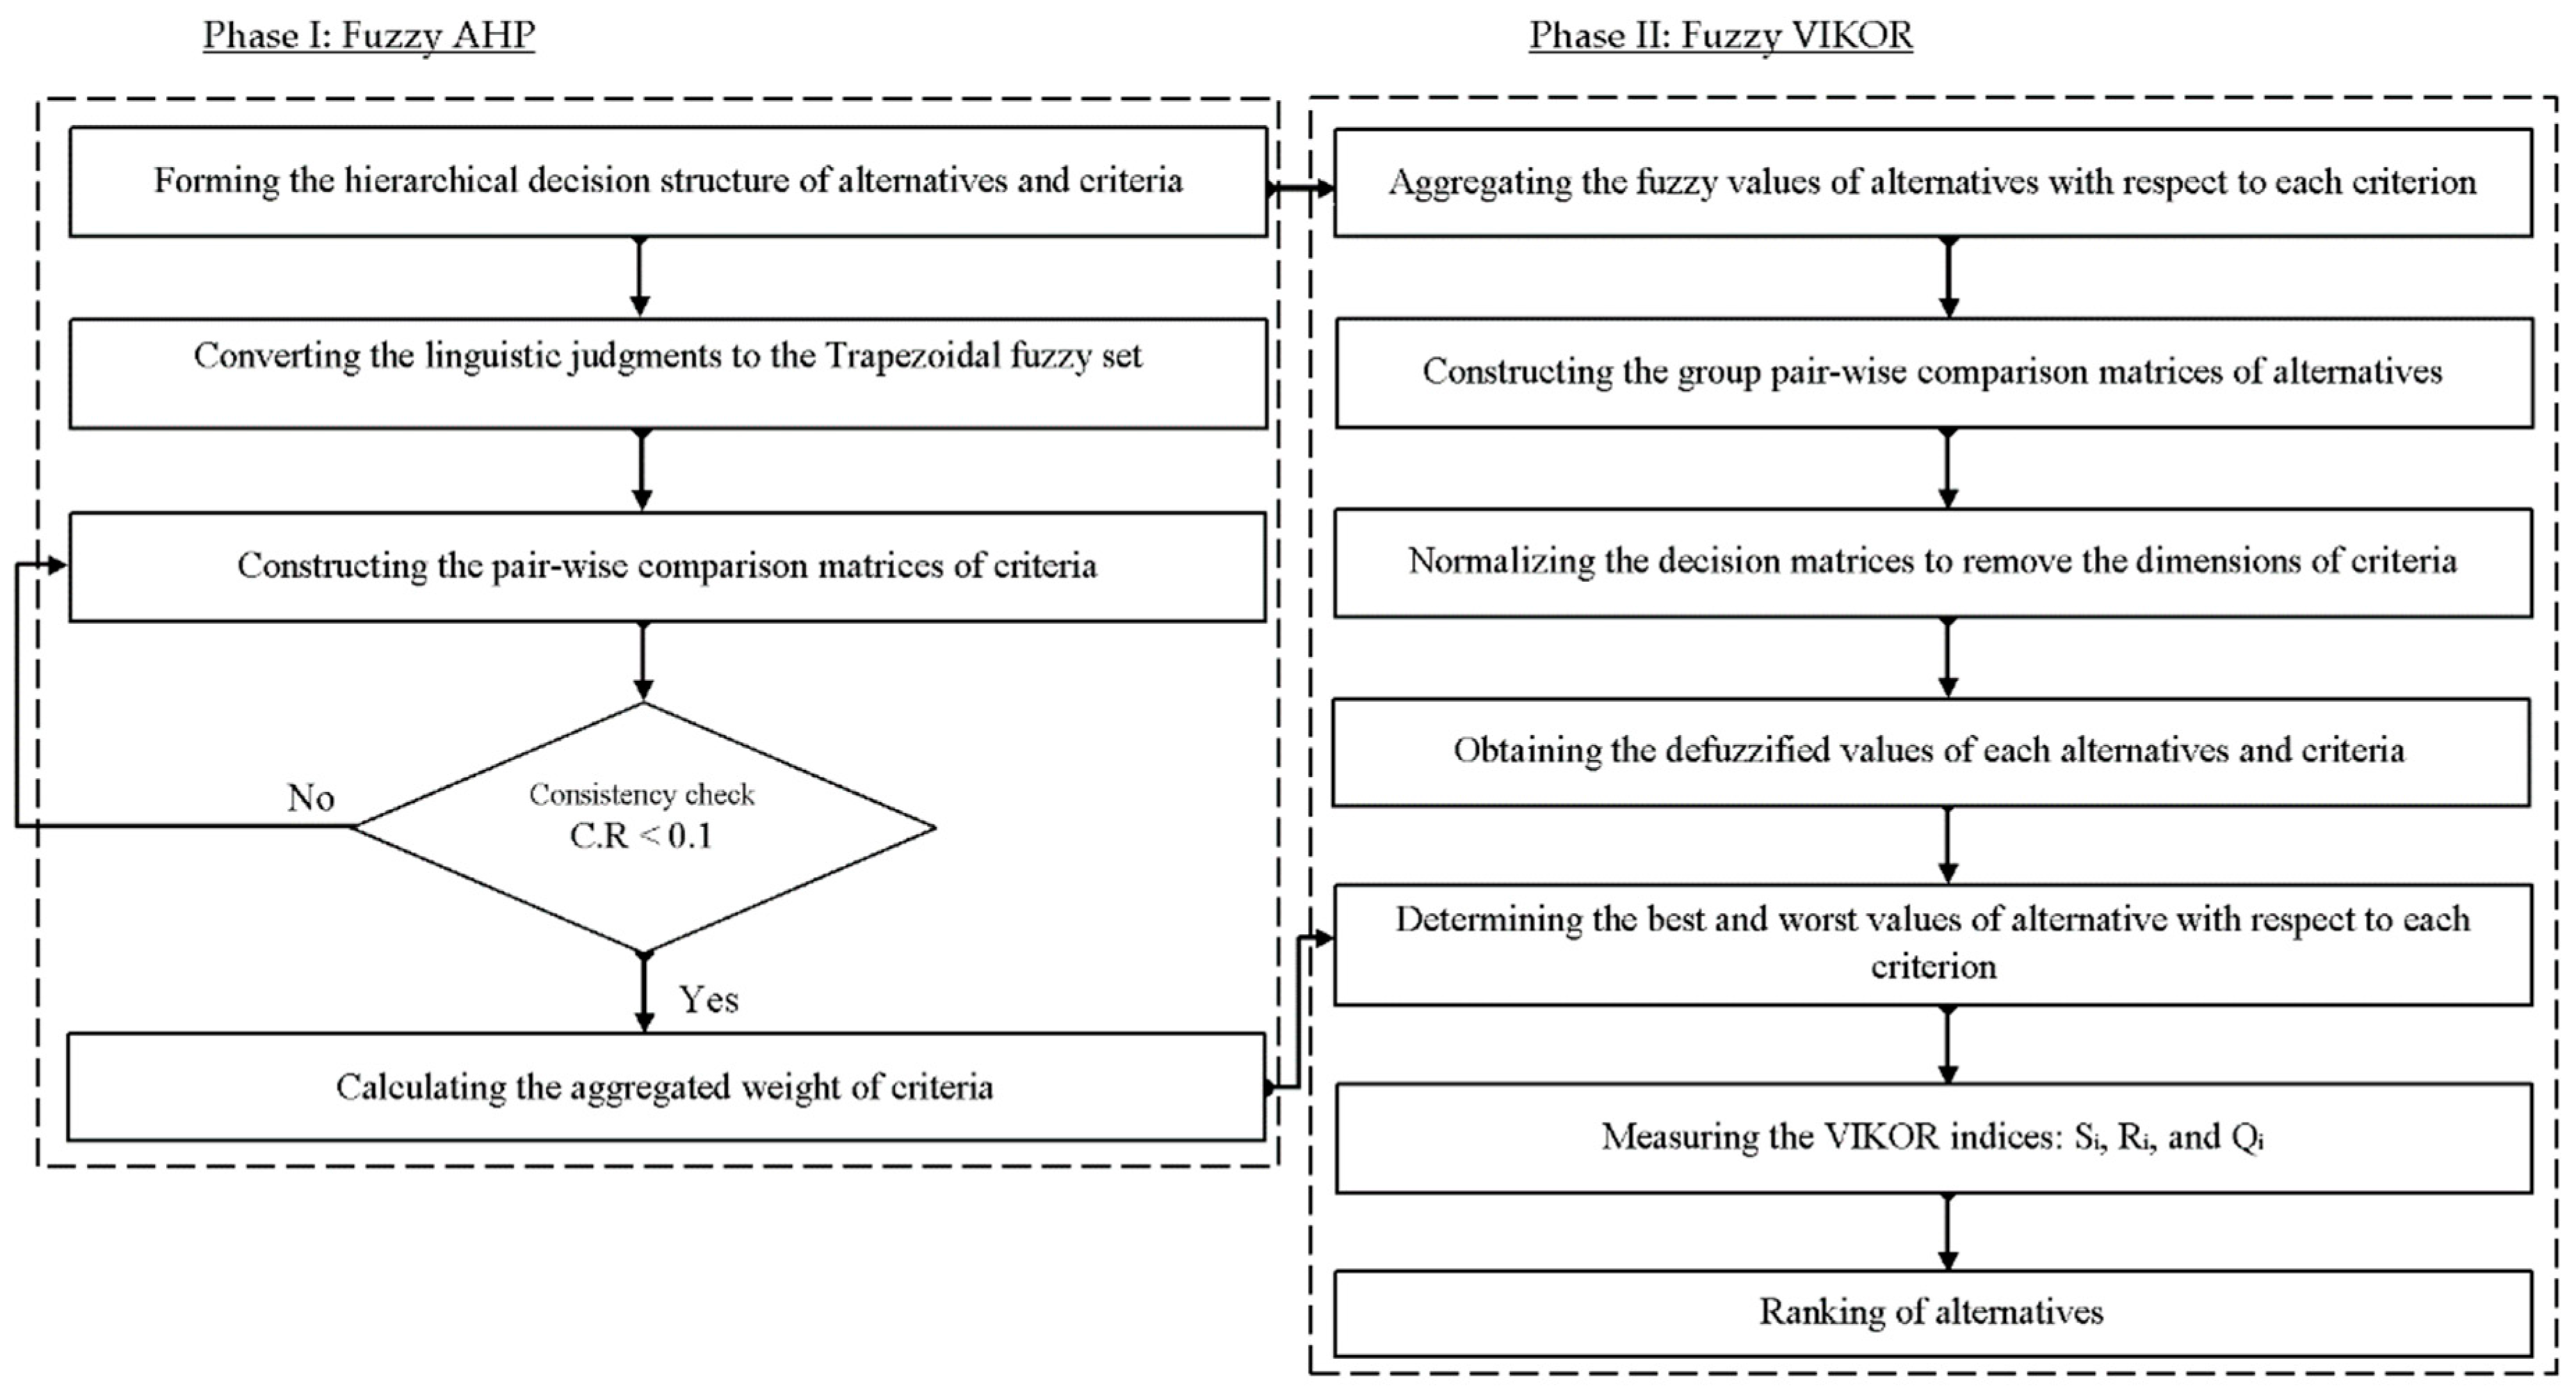
2.7. The Fuzzy AHP-VIKOR Calculation Process
2.7.1. Fuzzy AHP to determine weight of criteria
2.7.2. Fuzzy VIKOR to evaluate the alternative ranking
- Alternatives A1 and A2 if only the C2 condition is not satisfied.
- Alternatives A1, A2… Am if the C1 condition is not satisfied; then, Am is determined using equation for the maximum m.
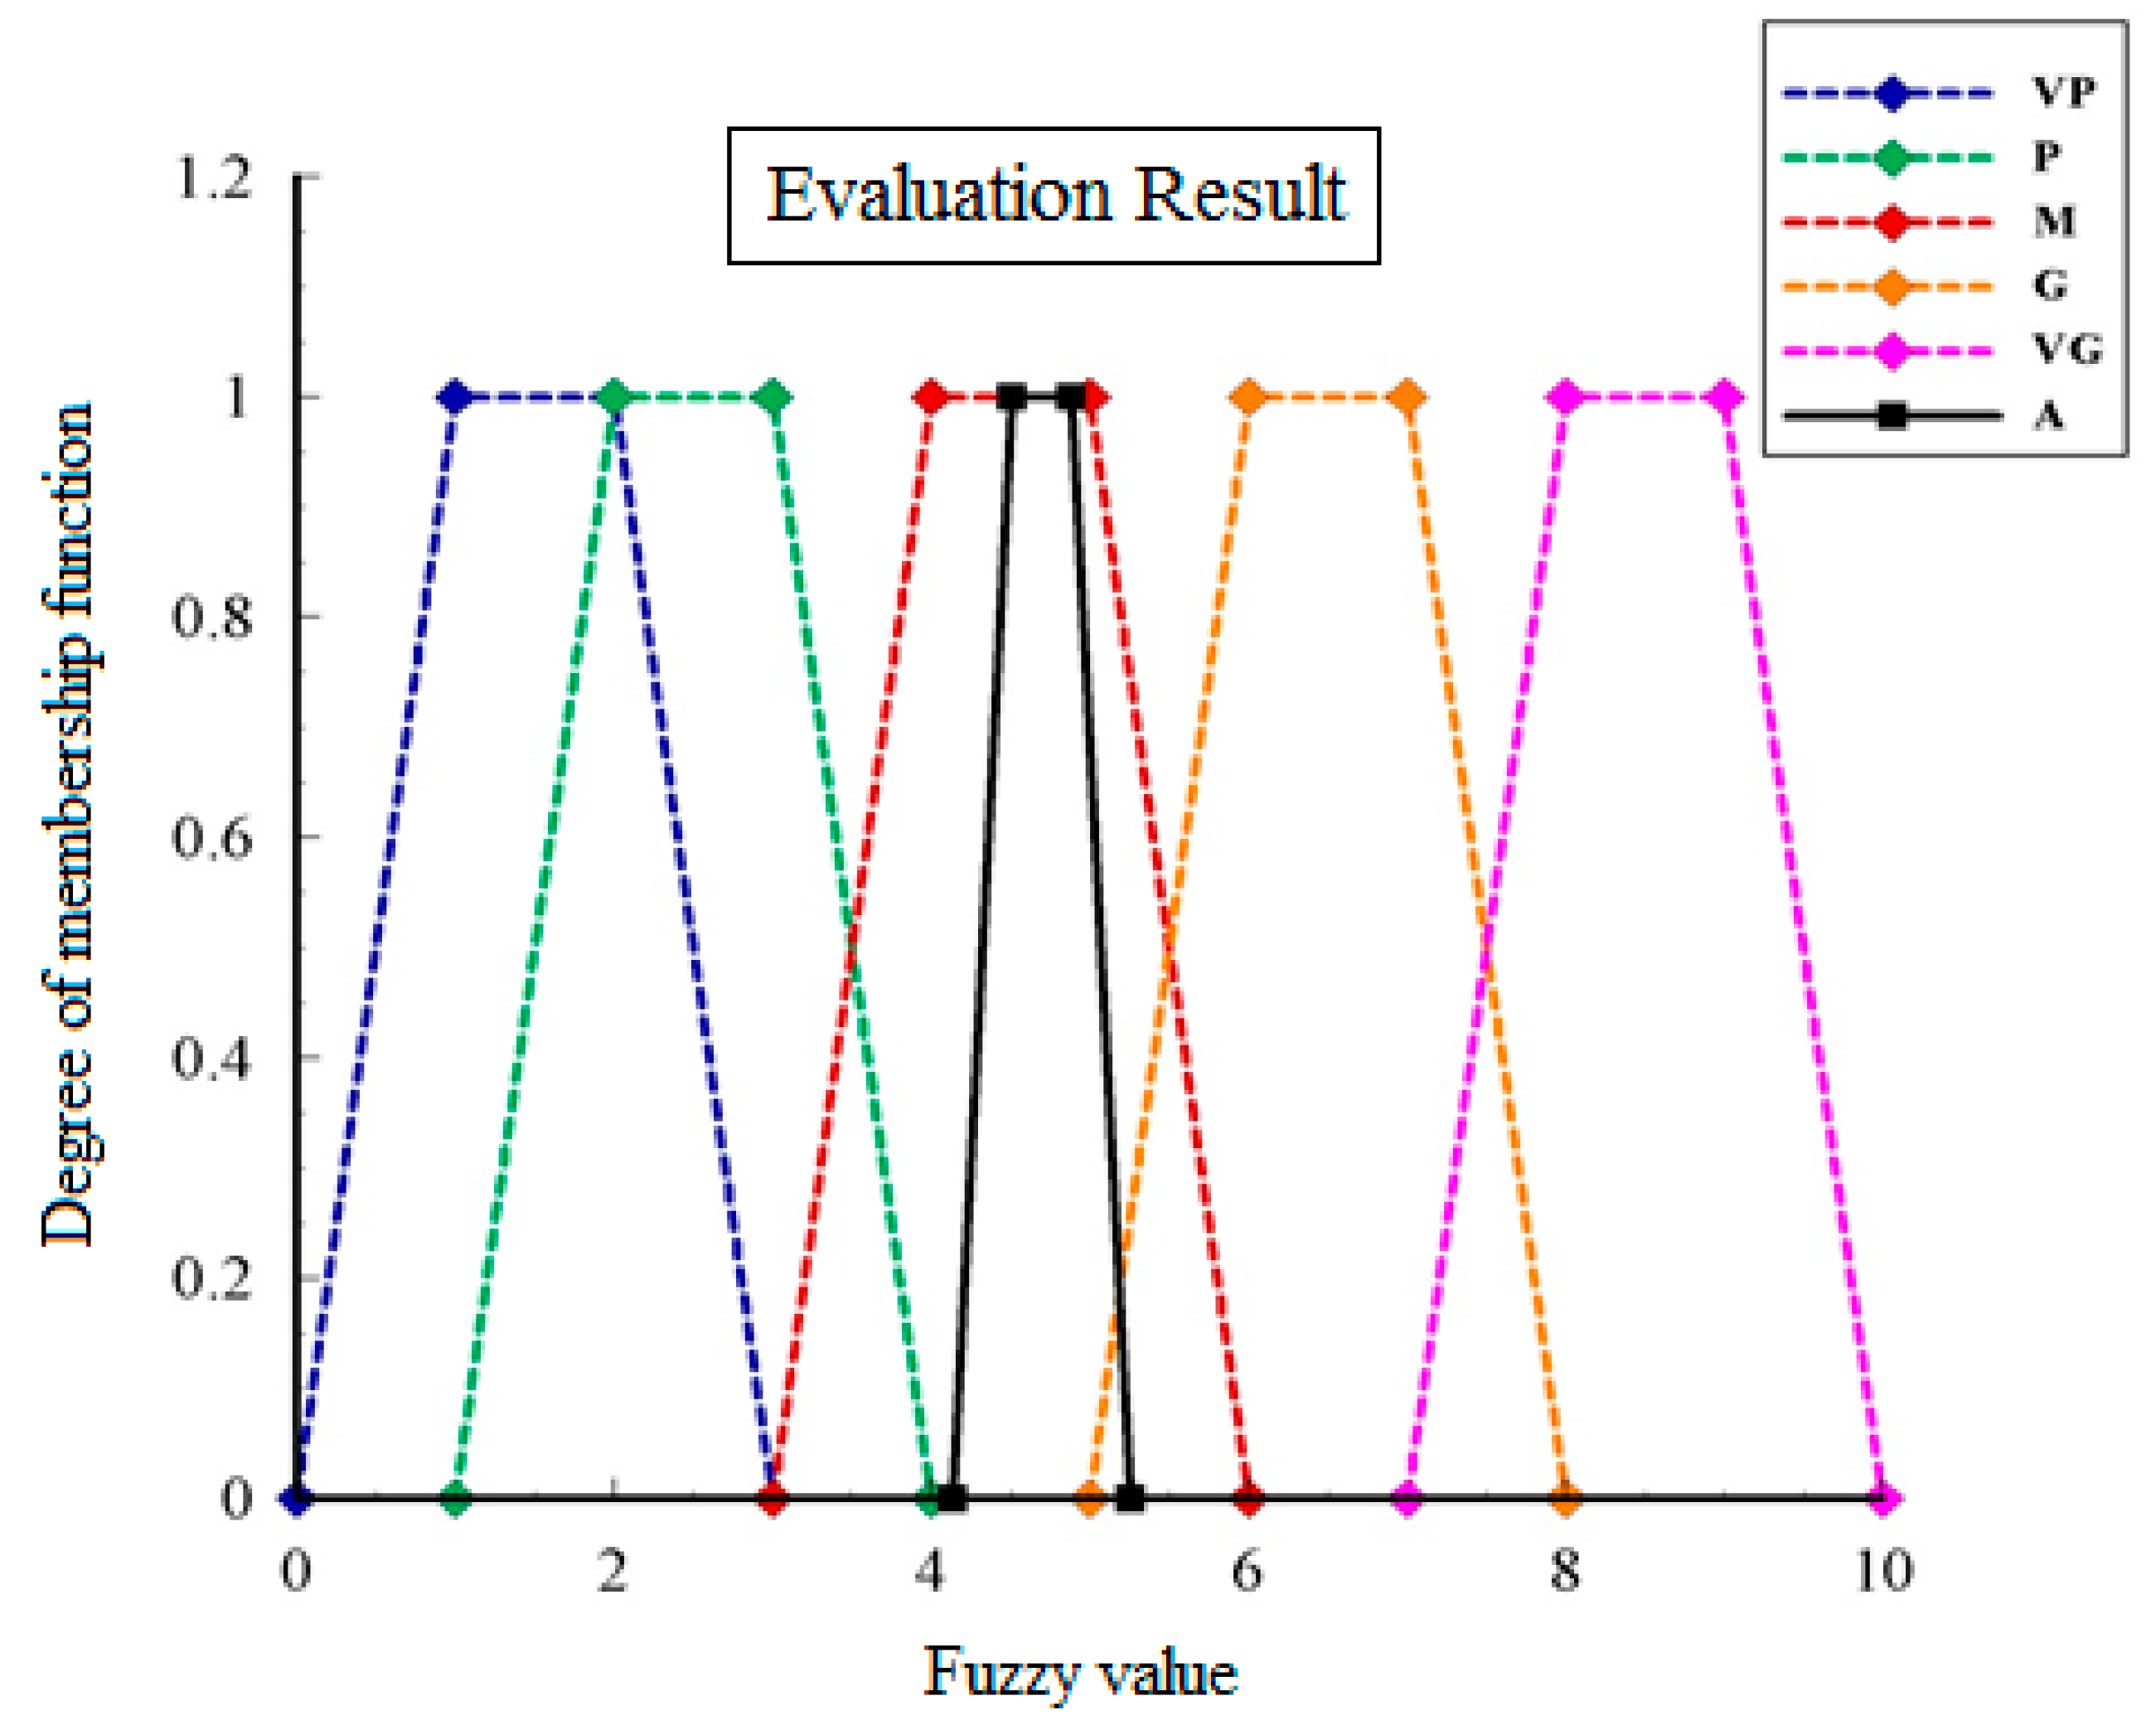
2.8. Fuzzy Evaluation Technique
- (a)
- Formation of fuzzy evaluation matrix
- (b)
- Calculate the fuzzy evaluation vector
3. Applying the Proposed Method
Application of the Proposed Method
4. Analysis of the Obtained Results
5. Discussion
6. Conclusions
Author Contributions
Funding
Acknowledgments
Conflicts of Interest
Appendix A
Appendix B
- Fuzzy AHP to determine weight of criteria:
- Forming the hierarchical decision tree:
- Formation of a pairwise comparison matrix:
- Calculating data Consistency
- Determining the initial data evaluation for decision elements:
- Calculation of the weight vector:
References
- Vafaeifard, M.; Lee, G.; Akib, S.; Ibrahim, S.; Yoon, Y.; Jang, M. Facile and economic one-pot synthesis of rigid functional-polyurethane for the effective treatment of heavy metal-contaminated urban storm water run-off. Desalin. Water Treat. 2016, 57, 26114–26129. [Google Scholar] [CrossRef]
- Salimi, A.; Karami, H.; Farzin, S.; Hassanvand, M.; Azad, A.; Kisi, O. Design of water supply system from rivers using artificial intelligence to model water hammer. ISH J. Hydraul. Eng. 2019, 20, 1–10. [Google Scholar] [CrossRef]
- Salimi, A.H.; Masoompour Samakosh, J.; Sharifi, E.; Hassanvand, M.R.; Noori, A.; von Rautenkranz, H. Optimized Artificial Neural Networks-Based Methods for Statistical Downscaling of Gridded Precipitation Data. Water 2019, 11, 1653. [Google Scholar] [CrossRef]
- Salimi, A.H.; Mousavi, S.F.; Farzin, S. Removal of sulfate from Gamasiab river water samples by using natural nano-Clinoptilolite. J. Appl. Res. Water Wastewater 2019, 6, 39–44. [Google Scholar] [CrossRef]
- Sharifi, E.; Eitzinger, J.; Dorigo, W. Performance of the State-Of-The-Art Gridded Precipitation Products over Mountainous Terrain: A Regional Study over Austria. Remote Sens. 2019, 11, 2018. [Google Scholar] [CrossRef]
- Sharifi, E.; Saghafian, B.; Steinacker, R. Copula-based stochastic uncertainty analysis of satellite precipitation products. J. Hydrol. 2019, 570, 739–754. [Google Scholar] [CrossRef]
- Abouzari, N.; Hassanvand, M.; Salimi, A.; Heddam, S.; Omidvar Mohammadi, H.; Noori, A. Comparison performance of artificial neural network based method in estimation of electric conductivity in wet and dry periods: Case study of Gamasiab River, Iran. J. Appl. Res. Water Wastewater 2019. [Google Scholar] [CrossRef]
- Salami, A.H.; Bonakdari, H.; Akhbari, A.; Shamshiri, A.; Mousavi, S.F.; Farzin, S.; Hassanvand, M.; Noori, A. Performance assessment of modified clinoptilolite and magnetic nanotubes on sulfate removal and potential application in natural river samples. J. Incl. Phenom. Macrocycl. Chem. 2020. [Google Scholar] [CrossRef]
- Dupont, D.; Waldner, C.; Bharadwaj, L.; Plummer, R.; Carter, B.; Cave, K.; Zagozewski, R. Drinking water management: Health risk perceptions and choices in First Nations and non-First Nations communities in Canada. Int. J. Environ. Res. Public Health 2014, 11, 5889–5903. [Google Scholar] [CrossRef]
- Patrick, R.J. Uneven access to safe drinking water for First Nations in Canada: Connecting health and place through source water protection. Health Place 2011, 17, 386–389. [Google Scholar] [CrossRef] [PubMed]
- Kaklauskas, A.; Zavadskas, E.K.; Radzeviciene, A.; Ubarte, I.; Podviezko, A.; Podvezko, V.; Kuzminske, A.; Banaitis, A.; Binkyte, A.; Bucinskas, V. Quality of city life multiple criteria analysis. Cities 2018, 72, 82–93. [Google Scholar] [CrossRef]
- Abrahams, N.A.; Hubbell, B.J.; Jordan, J.L. Joint Production and Averting Expenditure Measures of Willingness to Pay: Do Water Expenditures Really Measure Avoidance Costs? Am. J. Agric. Econ. 2000, 82, 427–437. [Google Scholar] [CrossRef]
- Siddiqi, A.; Anadon, L.D. The water–energy nexus in Middle East and North Africa. Energy Policy 2011, 39, 4529–4540. [Google Scholar] [CrossRef]
- Qasemipour, E.; Abbasi, A. Assessment of Agricultural Water Resources Sustainability in Arid Regions Using Virtual Water Concept: Case of South Khorasan Province, Iran. Water 2019, 11, 449. [Google Scholar] [CrossRef]
- Smith, A.; Paterson, R. Television: An International History, 2nd ed.; Anthony, S., Ed.; Oxford University Press: Oxford, UK, 1998; ISBN 9780198159285. [Google Scholar]
- Amoateng, K.; Amoako-Adu, B. Economic growth, export and external debt causality: The case of African countries. Appl. Econ. 1996, 28, 21–27. [Google Scholar] [CrossRef]
- Ozernoy, V.M. Choosing The “Best” Multiple Criterlv Decision-Making Method. INFOR Inf. Syst. Oper. Res. 1992, 30, 159–171. [Google Scholar] [CrossRef]
- Despontin, M.; Moscarola, J.; Spronk, J. A user-oriented listing of multiple criteria decision methods. Rev. Belg. Stat. Inform. Rech. Opérationalle 1983, 23, 4–110. [Google Scholar]
- Dağdeviren, M.; Yüksel, İ. Developing a fuzzy analytic hierarchy process (AHP) model for behavior-based safety management. Inf. Sci. 2008, 178, 1717–1733. [Google Scholar] [CrossRef]
- Aryanejad, M.B.; Ghavampour, S. Two Stage Multiple Attribute Decision Making Problem in Iranian Gas Distribution Systems. Int. J. Eng. 2004, 17, 135–144. [Google Scholar]
- Ramkumar, M. A modified ANP and fuzzy inference system based approach for risk assessment of in-house and third party e-procurement systems. Strateg. Outsourcing Int. J. 2016, 9, 159–188. [Google Scholar] [CrossRef]
- Zegordi, S.H.; Rezaee Nik, E.; Nzari, A. Power Plant Project Risk Assessment Using a Fuzzy-ANP and Fuzzy-TOPSIS Method. Int. J. Eng. 2012, 25, 107–120. [Google Scholar] [CrossRef]
- Saaty, T.L. Decision making with the analytic hierarchy process. Int. J. Serv. Sci. 2008, 1, 83. [Google Scholar] [CrossRef]
- Yoon, K.P.; Hwang, C.L. Multiple Attribute Decision Making: An Introduction; Sage Publications, Inc.: Thousand Oaks, CA, USA, 1995; ISBN 0-8039-5486-7. [Google Scholar]
- Mousavi, S.M. A Multi-Criteria Decision-Making Approach with Interval Numbers for Evaluating Project Risk Responses. Int. J. Eng. 2012, 25, 121–129. [Google Scholar] [CrossRef]
- Roy, B. Classement et choix en présence de points de vue multiples. RAIRO-Oper. Res.-Rech. Opérationnelle. 1968, 2, 57–75. [Google Scholar] [CrossRef]
- Ramkumar, M.; Jenamani, M. E-procurement service provider selection—An analytic network process-based group decision-making approach. Serv. Sci. 2012, 4, 269–294. [Google Scholar] [CrossRef]
- Saaty, T.L.; Alexander, J.M. Thinking with Models: Mathematical Models in the Physical, Biological, and Social Sciences; RWS Publications: Pittsburgh, PA, USA, 1981; ISBN 978-1-888603-41-5. [Google Scholar]
- Opricovic, S.; Tzeng, G.H. Multicriteria Planning of Post-Earthquake Sustainable Reconstruction. Comput.-Aided Civ. Infrastruct. Eng. 2002, 17, 211–220. [Google Scholar] [CrossRef]
- Brans, J.P.; Mareschal, B. PROMETHEE methods. In Multiple Criteria Decision Analysis: State of the Art Surveys; Springer: New York, NY, USA, 2005; pp. 163–186. [Google Scholar] [CrossRef]
- Egilmez, G.; Gumus, S.; Kucukvar, M. Environmental sustainability benchmarking of the U.S. and Canada metropoles: An expert judgment-based multi-criteria decision making approach. Cities 2015, 42, 31–41. [Google Scholar] [CrossRef]
- Noori, A.; Bonakdari, H.; Morovati, K.; Gharabaghi, B. The optimal dam site selection using a group decision-making method through fuzzy TOPSIS model. Environ. Syst. Decis. 2018, 38, 471–488. [Google Scholar] [CrossRef]
- Manupati, V.K.; Ramkumar, M.; Samanta, D. A multi-criteria decision making approach for the urban renewal in Southern India. Sustain. Cities Soc. 2018, 42, 471–481. [Google Scholar] [CrossRef]
- Noori, A.; Bonakdari, H.; Salimi, A.; Hassanvand, M. Investigating an Optimal Water Supply approach for the Gamasiab basin using the fuzzy extended Analytic Hierarchy Process method. J. Appl. Res. Water Wastewater 2020. [Google Scholar] [CrossRef]
- Saaty, T.L.; Vargas, L.G. Models, Methods, Concepts & Applications of the Analytic Hierarchy Process; Springer: New York, NY, USA, 2012; ISBN 978-1-4614-3597-6. [Google Scholar]
- Yücenur, G.N.; Demirel, N.Ç. Group decision making process for insurance company selection problem with extended VIKOR method under fuzzy environment. Expert Syst. Appl. 2012, 39, 3702–3707. [Google Scholar] [CrossRef]
- Opricovic, S.; Tzeng, G.H. Extended VIKOR method in comparison with outranking methods. Eur. J. Oper. Res. 2007, 178, 514–529. [Google Scholar] [CrossRef]
- Opricovic, S. Multicriteria Optimization of Civil Engineering Systems. Ph.D. Thesis, Faculty of Civil Engineering, Belgrade, Serbia, 1998. [Google Scholar]
- Opricovic, S. Fuzzy VIKOR with an application to water resources planning. Expert Syst. Appl. 2011, 38, 12983–12990. [Google Scholar] [CrossRef]
- Voskoglou, M.G. Assessment of Human Skills Using Trapezoidal Fuzzy Numbers (Part II). Am. J. Comput. Appl. Math. 2015, 5, 154–158. [Google Scholar]
- Rodcha, R.; Tripathi, N.K.; Prasad Shrestha, R. Comparison of Cash Crop Suitability Assessment Using Parametric, AHP, and FAHP Methods. Land 2019, 8(5), 79. [Google Scholar] [CrossRef]
- Popkin, B.M.; Barclay, D.V.; Nielsen, S.J. Water and food consumption patterns of US adults from 1999 to 2001. Obes. Res. 2005, 13, 2146–2152. [Google Scholar] [CrossRef]
- Keshavarzi, A.R.; Sharifzadeh, M.; Haghighi, A.K.; Amin, S.; Keshtkar, S.; Bamdad, A. Rural domestic water consumption behavior: A case study in Ramjerd area, Fars province, IR Iran. Water Res. 2006, 40, 1173–1178. [Google Scholar] [CrossRef]
- Jones, A.Q.; Majowicz, S.E.; Edge, V.L.; Thomas, M.K.; MacDougall, L.; Fyfe, M.; Atashband, S.; Kovacs, S.J. Drinking water consumption patterns in British Columbia: An investigation of associations with demographic factors and acute gastrointestinal illness. Sci. Total Environ. 2007, 388, 54–65. [Google Scholar] [CrossRef]
- Harlan, S.L.; Yabiku, S.T.; Larsen, L.; Brazel, A.J. Household water consumption in an arid city: Affluence, affordance, and attitudes. Soc. Nat. Resour. 2009, 22, 691–709. [Google Scholar] [CrossRef]
- Islam, M.A.; Sakakibara, H.; Karim, M.R.; Sekine, M. Rural water consumption behavior: A case study in southwest coastal area, Bangladesh. In Proceedings of the World Environmental and Water Resources Congress 2011: Bearing Knowledge for Sustainability, 22–26 May 2011; pp. 4403–4412. [Google Scholar]
- Shan, Y.; Yang, L.; Perren, K.; Zhang, Y. Household water consumption: Insight from a survey in Greece and Poland. Procedia Eng. 2015, 119, 1409–1418. [Google Scholar] [CrossRef]
- Wright, C.J.; Sargeant, J.M.; Edge, V.L.; Ford, J.D.; Farahbakhsh, K.; Shiwak, I.; Flowers, C.; Gordon, A.C.; Harper, S.L.; IHACC Research Team. How are perceptions associated with water consumption in Canadian Inuit? A cross-sectional survey in Rigolet, Labrador. Sci. Total Environ. 2018, 618, 369–378. [Google Scholar] [CrossRef] [PubMed]
- Breuer, R.; Brettel, M.; Engelen, A. Incorporating long-term effects in determining the effectiveness of different types of online advertising. Mark. Lett. 2011, 22, 327–340. [Google Scholar] [CrossRef]
- Hsieh, Y.C.; Chen, K.H. How different information types affect viewer’s attention on internet advertising. Comput. Hum. Behav. 2011, 27, 935–945. [Google Scholar] [CrossRef]
- Amoateng, F.; Poku, K. The Impact of Advertisement on Alcohol Consumption: A Case Study of Consumers in Bantama Sub-Metro. Int. Rev. Manag. Mark. 2012, 3, 28–36. [Google Scholar]
- Srikanth, J.; Saravanakumar, M.; Srividhya, S. The impact of celebrity advertisement on Indian customers. Life Sci. J. 2013, 10, 59–65. [Google Scholar]
- Ramkumar, M.; Jenamani, M. Sustainability in supply chain through e-procurement—An assessment framework based on DANP and liberatore score. IEEE Syst. J. 2014, 9, 1554–1564. [Google Scholar] [CrossRef]
- Nomura, T.; Mitsukura, Y. EEG-based detection of TV commercials effects. Procedia Comput. Sci. 2015, 60, 131–140. [Google Scholar] [CrossRef]
- Gilbert-Diamond, D.; Emond, J.A.; Lansigan, R.K.; Rapuano, K.M.; Kelley, W.M.; Heatherton, T.F.; Sargent, J.D. Television food advertisement exposure and FTO rs9939609 genotype in relation to excess consumption in children. Int. J. Obes. 2017, 41, 23. [Google Scholar] [CrossRef]
- Wang, R.; Liaukonyte, J.; Kaiser, H.M. Does Advertising Content Matter? Impacts of Healthy Eating and Anti-Obesity Advertising on Willingness to Pay by Consumer Body Mass Index. Agric. Resour. Econ. Rev. 2018, 1–31. [Google Scholar] [CrossRef]
- Van Laarhoven, P.J.M.; Pedrycz, W. A fuzzy extension of Saaty’s priority theory. Fuzzy Sets Syst. 1983, 11, 229–241. [Google Scholar] [CrossRef]
- Buckley, J. Fuzzy hierarchical analysis. Fuzzy Sets Syst. 1985, 17, 233–247. [Google Scholar] [CrossRef]
- Chang, D.-Y. Applications of the extent analysis method on fuzzy AHP. Eur. J. Oper. Res. 1996, 95, 649–655. [Google Scholar] [CrossRef]
- Cheng, C.-H. Evaluating naval tactical missile systems by fuzzy AHP based on the grade value of membership function. Eur. J. Oper. Res. 1997, 96, 343–350. [Google Scholar] [CrossRef]
- Deng, H. Multicriteria analysis with fuzzy pairwise comparison. Int. J. Approx. Reason. 1999, 21, 215–231. [Google Scholar] [CrossRef]
- Csutora, R.; Buckley, J.J. Fuzzy hierarchical analysis: The Lambda-Max method. Fuzzy Sets Syst. 2001, 120, 181–195. [Google Scholar] [CrossRef]
- Wang, Y.-M.; Chin, K.-S. An eigenvector method for generating normalized interval and fuzzy weights. Appl. Math. Comput. 2006, 181, 1257–1275. [Google Scholar] [CrossRef]
- Lee, S.-H. Using fuzzy AHP to develop intellectual capital evaluation model for assessing their performance contribution in a university. Expert Syst. Appl. 2010, 37, 4941–4947. [Google Scholar] [CrossRef]
- Goyal, R.K.; Kaushal, S.; Sangaiah, A.K. The utility based non-linear fuzzy AHP optimization model for network selection in heterogeneous wireless networks. Appl. Soft Comput. 2018, 67, 800–811. [Google Scholar] [CrossRef]
- Opricovic, S.; Tzeng, G.-H. Compromise solution by MCDM methods: A comparative analysis of VIKOR and TOPSIS. Eur. J. Oper. Res. 2004, 156, 445–455. [Google Scholar] [CrossRef]
- Liou, J.J.H.; Tsai, C.Y.; Lin, R.H.; Tzeng, G.H. A modified VIKOR multiplecriteria decision method for improving domestic airlines service quality. J. Air Transp. Manag. 2010, 1–5. [Google Scholar] [CrossRef]
- Sanayei, A.; Mousavi, S.F.; Yazdankhah, A. Group decision making process for supplier selection with VIKOR under fuzzy environment. Expert Syst. Appl. 2010, 37, 24–30. [Google Scholar] [CrossRef]
- Ying-Yu, W.; De-Jian, Y. Extended VIKOR for multi-criteria decision making problems under intuitionistic environment. In Proceedings of the 2011 International Conference on Management Science & Engineering 18th Annual Conference Proceedings, Rome, Italy, 13–15 September 2011; pp. 118–122. [Google Scholar]
- Tiwari, V.; Jain, P.K.; Tandon, P. Product design concept evaluation using rough sets and VIKOR method. Adv. Eng. Inform. 2016, 30, 16–25. [Google Scholar] [CrossRef]
- Shemshadi, A.; Shirazi, H.; Toreihi, M.; Tarokh, M. A fuzzy VIKOR method for supplier selection based on entropy measure for objective weighting. Expert Syst. Appl. 2011, 38, 12160–12167. [Google Scholar] [CrossRef]
- Wang, T.C.; Chang, T.H. Fuzzy VIKOR as a resolution for multicriteria group decision-making. In Proceedings of the 11th International Conference on Industrial Engineering and Engineering Management (IEEM 2005), Shenyang, China, 23–25 April 2005. [Google Scholar]
- Chang, C.-L.; Hsu, C.-H. Multi-criteria analysis via the VIKOR method for prioritizing land-use restraint strategies in the Tseng-Wen reservoir watershed. J. Environ. Manag. 2009, 90, 3226–3230. [Google Scholar] [CrossRef]
- San Cristóbal, J.R. Multi-criteria decision-making in the selection of a renewable energy project in spain: The Vikor method. Renew. Energy 2011, 36, 498–502. [Google Scholar] [CrossRef]
- Kavita, D. Extension of VIKOR method in intuitionistic fuzzy environment for robot selection. Expert Syst. Appl. 2011, 38, 14163–14168. [Google Scholar]
- Kaya, T.; Kahraman, C. Multicriteria renewable energy planning using an integrated fuzzy VIKOR & AHP methodology: The case of Istanbul. Energy 2010, 35, 2517–2527. [Google Scholar]
- Zhu, G.-N.; Hu, J.; Qi, J.; Gu, C.-C.; Peng, Y.-H. An integrated AHP and VIKOR for design concept evaluation based on rough number. Adv. Eng. Informatics 2015, 29, 408–418. [Google Scholar] [CrossRef]
- Singh, S.; Olugu, E.U.; Musa, S.N.; Mahat, A.B.; Wong, K.Y. Strategy selection for sustainable manufacturing with integrated AHP-VIKOR method under interval-valued fuzzy environment. Int. J. Adv. Manuf. Technol. 2016, 84, 547–563. [Google Scholar] [CrossRef]
- Rezaie, K.; Ramiyani, S.S.; Nazari-Shirkouhi, S.; Badizadeh, A. Evaluating performance of Iranian cement firms using an integrated fuzzy AHP–VIKOR method. Appl. Math. Model. 2014, 38, 5033–5046. [Google Scholar] [CrossRef]
- Kaya, T.; Kahraman, C. Fuzzy multiple criteria forestry decision making based on an integrated VIKOR and AHP approach. Expert Syst. Appl. 2011, 38, 7326–7333. [Google Scholar] [CrossRef]
- Zamani, S.; Farughi, H.; Soolaki, M. Contractor selection using fuzzy hybrid AHP-VIKOR. Int. J. Res. Ind. Eng. 2014, 2, 26–40. [Google Scholar]
- Pourebrahim, S.; Hadipour, M.; Bin Mokhtar, M.; Taghavi, S. Application of VIKOR and fuzzy AHP for conservation priority assessment in coastal areas: Case of Khuzestan district, Iran. Ocean Coast. Manag. 2014, 98, 20–26. [Google Scholar] [CrossRef]
- Fu, H.-P.; Chu, K.-K.; Chao, P.; Lee, H.-H.; Liao, Y.-C. Using fuzzy AHP and VIKOR for benchmarking analysis in the hotel industry. Serv. Ind. J. 2011, 31, 2373–2389. [Google Scholar] [CrossRef]
- Mohaghar, A.; Fathi, M.R.; Zarchi, M.K.; Omidian, A. A combined VIKOR-fuzzy AHP approach to marketing strategy selection. Bus. Manag. Strategy 2012, 3, 13–27. [Google Scholar] [CrossRef]
- Awasthi, A.; Govindan, K.; Gold, S. Multi-tier sustainable global supplier selection using a fuzzy AHP-VIKOR based approach. Int. J. Prod. Econ. 2018, 195, 106–117. [Google Scholar] [CrossRef]
- Sanjani, S.; Bannayan, M.; Kamyabnejad, M. Detection of recent climate change using daily temperature extremes in Khorasan Province, Iran. Clim. Res. 2011, 49, 247–254. [Google Scholar] [CrossRef]
- Census. Census of the Islamic Republic of Iran. 2011. Available online: http:.irandataportal.syr.edu.2011-census (accessed on 6 February 2020).
- Brown, N.; Deegan, C. The public disclosure of environmental performance information—a dual test of media agenda setting theory and legitimacy theory. Account. Bus. Res. 1998, 29, 21–41. [Google Scholar] [CrossRef]
- Weaver, D.H. Thoughts on Agenda Setting, Framing, and Priming. J. Commun. 2007, 57, 142–147. [Google Scholar] [CrossRef]
- Shrum, L.J. Assessing the Social Influence of Television. Commun. Res. 1995, 22, 402–429. [Google Scholar] [CrossRef]
- Miller, K. Communication theories. In Perspectives, Processes, and Contexts, 2nd ed.; McGraw-Hill: Boston, CA, USA, 2005; ISBN 9780071238359. [Google Scholar]
- Bandura, A. Social Learning Theory; Prentice-Hall: London, UK, 1977; ISBN 0138167516. [Google Scholar]
- Khang, H.; Ki, E.-J.; Ye, L. Social Media Research in Advertising, Communication, Marketing, and Public Relations, 1997–2010. Journal. Mass Commun. Q. 2012, 89, 279–298. [Google Scholar] [CrossRef]
- Argyris, C.; Schön, D.A. Theory in practice. In Increasing Professional Effectiveness; Chris, A., Donald, A.S., Eds.; Josey-Bass: San Francisco, CA, USA, 1974; ISBN 978-1555424466. [Google Scholar]
- Saaty, T.L. How to make a decision: The analytic hierarchy process. Eur. J. Oper. Res. 1990, 48, 9–26. [Google Scholar] [CrossRef]
- Mou, Q. Method of Multi-Attribute Decision-Making and Its Application; Guangxi University: Nanning, China, 2004. [Google Scholar]
- Zheng, G.; Zhu, N.; Tian, Z.; Chen, Y.; Sun, B. Application of a trapezoidal fuzzy AHP method for work safety evaluation and early warning rating of hot and humid environments. Saf. Sci. 2012, 50, 228–239. [Google Scholar] [CrossRef]
- Xia, H.-C.; Li, D.-F.; Zhou, J.-Y.; Wang, J.-M. Fuzzy LINMAP method for multiattribute decision making under fuzzy environments. J. Comput. Syst. Sci. 2006, 72, 741–759. [Google Scholar] [CrossRef]
- Vakratsas, D.; Ambler, T. How Advertising Works: What Do We Really Know? J. Mark. 1999, 63, 26–43. [Google Scholar] [CrossRef]
- Cleeren, G.; Quirynen, M.; Ozcelik, O.; Teughels, W. Role of 3D animation in periodontal patient education: A randomized controlled trial. J. Clin. Periodontol. 2014, 41, 38–45. [Google Scholar] [CrossRef]
- Cronley, M.L.; Kardes, F.R.; Goddard, P.; Houghton, D.C. Endorsing Products For the Money: The Role of the Correspondence Bias in Celebrity Advertising. ACR N. Am. Adv. 1999, 26, 627–631. [Google Scholar]
- Fleck, N.; Korchia, M.; Le Roy, I. Celebrities in Advertising: Looking for Congruence or Likability? Psychol. Mark. 2012, 29, 651–662. [Google Scholar] [CrossRef]
- Lenhart, A.; Purcell, K.; Smith, A.; Zickuhr, K. Social Media & Mobile Internet Use among Teens and Young Adults; Millennials, Pew internet & American Life Project: Washington, DC, USA, 2010. [Google Scholar]
- Chow, W.S.; Chan, L.S. Social network, social trust and shared goals in organizational knowledge sharing. Inf. Manag. 2008, 45, 458–465. [Google Scholar] [CrossRef]
- Boyd, D. Why Youth Heart Social Network Sites: The Role of Networked Publics in Teenage Social Life. In YOUTH, IDENTITY, AND DIGITAL MEDIA, David Buckingham; MacArthur Foundation Series on Digital Media and Learning; John, D., Catherine, T., Eds.; The MIT Press: Cambridge, MA, USA, 2017; pp. 2007–2016. [Google Scholar]
- Sæbø, Ø.; Rose, J.; Nyvang, T. The Role of Social Networking Services in eParticipation. In Post-Quantum Cryptography; Springer Science and Business Media: Berlin/Heidelberg, Germany, 2009; Volume 5694, pp. 46–55. [Google Scholar]
- Nielsen, A.E.; Thomsen, C. Sustainable development: The role of network communication. Corp. Soc. Responsib. Environ. Manag. 2011, 18, 1–10. [Google Scholar] [CrossRef]
- Messner, D. The Network Society: Economic Development and International Competitveness as Problems of Social; Routledge: Abington, UK, 2013; ISBN 9781315036946. [Google Scholar]
- Joy, A.; Sherry, J.F.; Deschênes, J. Conceptual blending in advertising. J. Bus. Res. 2009, 62, 39–49. [Google Scholar] [CrossRef]
- Rozendaal, E.; Lapierre, M.A.; Van Reijmersdal, E.A.; Buijzen, M. Reconsidering Advertising Literacy as a Defense Against Advertising Effects. Media Psychol. 2011, 14, 333–354. [Google Scholar] [CrossRef]
- Sadi-Nezhad, S.; Damghani, K.K. Application of a fuzzy TOPSIS method base on modified preference ratio and fuzzy distance measurement in assessment of traffic police centers performance. Appl. Soft Comput. 2010, 10, 1028–1039. [Google Scholar] [CrossRef]
- Wang, T.-C.; Liang, J.-L.; Ho, C.-Y. Multi-Criteria Decision Analysis by Using Fuzzy VIKOR. In Proceedings of the 2006 International Conference on Service Systems and Service Management, Troyes, France, 25–27 October 2006; pp. 901–906. [Google Scholar]
- Zeleny, M. Multiple Criteria Decision Making; McGraw-Hill: New York, NY, USA, 1982. [Google Scholar]
- Yu, P.L. A Class of Solutions for Group Decision Problems. Manag. Sci. 1973, 19, 936–946. [Google Scholar] [CrossRef]
- Lin, H.F.; Lee, G.G. A study of service quality evaluation model for virtual knowledge communities. Electron. Commer. Stud. 2006, 4, 211–234. [Google Scholar]
- Yao, Y.; Lian, Z.; Liu, S.; Hou, Z. Hourly cooling load prediction by a combined forecasting model based on Analytic Hierarchy Process. Int. J. Therm. Sci. 2004, 43, 1107–1118. [Google Scholar] [CrossRef]


| Criteria | Description | Criteria | Description |
|---|---|---|---|
| C1 | Persistence in the mind of promotional animations | C17 | Submitting social networking ADVTs to friends and acquaintances |
| C2 | The magnetism of playing animations in mass media | C18 | Watching more advertising usage through social networks |
| C3 | Simple communication with animated ADVTs. Optimal water consumption | C19 | The great influence of organizing various media competitions on audiences |
| C4 | Learn the proper use of water with TV animation ADVTs | C20 | Promoting effective celebration of special events such as world water day by the mass media |
| C5 | The longevity of most of the spread animated ADVTs | C21 | Transfer appropriate feedback by seeing ADVTs in mass media |
| C6 | Use fantasy characters in promotional animations | C22 | Effect of subtitling slogans on modifying the pattern of water consumption in the mass media, on the audience |
| C7 | The presence of famous characters in media advertising | C23 | Creating thinking in the audience by broadcasting ADVTs from mass media |
| C8 | Advertising attraction with the presence of famous audience musicians | C24 | Impressing the audience by playing a real documentary to promote an optimal water consumption pattern |
| C9 | The impact of athletes’ recommendations on the audience | SC1 | Avoid waste of water while brushing and using sanitary toilets |
| C10 | The emphasis of actors on saving water consumption in media advertising | SC2 | No necessity to wash vehicles with drinkable water |
| C11 | The Impact of famous characters in mass media advertising | SC3 | Changing the valve due to the valves broken |
| C12 | Better message delivery to the audience with the presence of famous artists in advertising | SC4 | Not- opening the treated tap water often for bathing |
| C13 | Viewing ADVTs on social networks is more than other media | SC5 | Do not use amusements and toys that work with water |
| C14 | View ADVTs on friends and acquaintances’ social personal accounts | SC6 | Do not use water to clean the yard and roof and use alternative methods such as vacuuming |
| C15 | The popularity of advertising campaigns in social networks and their participation in them | SC7 | Stopping the main water split in case of fracture in the pipe |
| C16 | Receive short promotional slogans through social networks | SC8 | Preferring the maintenance of plants that require less water, however, is not very nice |
| Criteria | Related Factors | Dimension |
|---|---|---|
| Criteria | C1–C6 | Advertising using animation |
| C7–C12 | Advertising using celebrities | |
| C13–C18 | Advertisement on social networks | |
| C19–C24 | Advertising without celebrities, animation | |
| Sub-criteria | SC1–SC8 | Water consumption pattern modification |
| Linguistic Variables | Trapezoidal Fuzzy Numbers | Relative Importance Scale |
|---|---|---|
| Equal importance | (1, 1, 1, 1) | 1 |
| Weakly important | (2,5/2,7/2,4) | 3 |
| important | (4,9/2,11/2,6) | 5 |
| Strongly important | (6,13/2,15/2,8) | 7 |
| Absolutely important | (8,17/2,9,9) | 9 |
| – | (x-1, x-1/2, x+1/2, x+1) | )2, 4, 6, 8( intermediate scales |
| Fuzzy Scale for Alternatives | Linguistic Statements for Alternatives | Fuzzy Scale for Criteria | Linguistic Statements for Criteria |
|---|---|---|---|
| (0, 0, 0.1, 0.2) | Very Low | (0, 1, 2, 3) | Very Weak |
| (0.1, 0.25, 0.25, 0.4) | Low | (1, 2, 3, 4) | Weak |
| (0.3, 0.5, 0.5, 0.7) | Moderate | (3, 4, 5, 6) | Moderate |
| (0.6, 0.75, 0.75, 0.9) | High | (5, 6, 7, 8) | Good |
| (0.8, 0.9, 1, 1) | Very High | (7, 8, 9, 10) | Very Good |
| n | 1 | 2 | 3 | 4 | 5 | 6 | 7 | 8 | 9 |
|---|---|---|---|---|---|---|---|---|---|
| R.I | 0 | 0 | 0.58 | 0.9 | 1.12 | 1.24 | 1.32 | 1.41 | 1.45 |
| Ai | Fuzzy AHP | Proposed Method | ||||||
|---|---|---|---|---|---|---|---|---|
| A | B | C | D | A | B | C | D | |
| A | 1 | 2 | 3 | 5 | 1, 1, 1, 1 | 1, 1, 3/2, 2 | 2, 5/2, 7/2, 4 | 4, 9/2, 11/2, 6 |
| B | 0.5 | 1 | 3 | 5 | 1/2, 2/3, 1, 1 | 1, 1, 1, 1 | 2, 5/2, 7/2, 4 | 4, 9/2, 11/2, 6 |
| C | 0.333 | 0.333 | 1 | 3 | 1/4, 2/7, 2/5, 1/2 | 1/4, 2/7, 2/5, 1/2 | 1, 1, 1, 1 | 2,5/2,7/2,4 |
| D | 0.2 | 0.2 | 0.33 | 1 | 1/6,2/11,2/9,1/4 | 1/6, 2/11, 2/9, 1/4 | 1/4, 2/7, 2/5, 1/2 | 1, 1, 1, 1 |
| Criteria | Criteria | |||||
|---|---|---|---|---|---|---|
| C1 | C2 | C3 | C4 | C5 | C6 | |
| C1 | 1.00,1.00,1.00,1.00 | 4.00,4.50,5.50,6.00 | 1.00,1.00,1.00,1.00 | 4.00,4.50,5.50,6.00 | 6.00,6.50,7.50,8.00 | 2.00,2.50,3.50,4.00 |
| C2 | 0.16,0.18,0.22,0.25 | 1.00,1.00,1.00,1.00 | 2.00,2.50,3.50,4.00 | 2.00,2.50,3.50,4.00 | 4.00,4.50,5.50,6.00 | 2.00,2.50,3.50,4.00 |
| C3 | 1.00,1.00,1.00,1.00 | 0.25,0.29,0.40,0.50 | 1.00,1.00,1.00,1.00 | 4.00,4.50,5.50,6.00 | 6.00,6.50,7.50,8.00 | 2.00,2.50,3.50,4.00 |
| C4 | 0.16,0.18,0.22,0.25 | 0.17,0.18,0.22,0.25 | 0.17,0.18,0.22,0.25 | 1.00,1.00,1.00,1.00 | 4.00,4.50,5.50,6.00 | 2.00,2.50,3.50,4.00 |
| C5 | 0.12,0.13,0.15,0.16 | 0.17,0.18,0.22,0.25 | 0.12,0.13,0.15,0.16 | 0.17,0.18,0.22,0.25 | 1.00,1.00,1.00,1.00 | 2.00,2.50,3.50,4.00 |
| C6 | 0.25,0.28,0.40,0.50 | 0.25,0.29,0.40,0.50 | 0.25,0.28,0.40,0.50 | 0.25,0.29,0.40,0.50 | 0.25,0.28,0.40,0.50 | 1.00,1.00,1.00,1.00 |
| CR = 0.0305 | ||||||
| Criteria | Criteria | |||||
|---|---|---|---|---|---|---|
| C7 | C8 | C9 | C10 | C11 | C12 | |
| C7 | 1.00,1.00,1.00,1.00 | 4.00,4.50,5.50,6.00 | 6.00,6.50,7.50,8.00 | 6.00,6.50,7.50,8.00 | 4.00,4.50,5.50,6.00 | 4.00,4.50,5.50,6.00 |
| C8 | 0.16,0.18,0.22,0.25 | 1.00,1.00,1.00,1.00 | 1.00,1.00,1.00,1.00 | 1.00,1.00,1.00,1.00 | 1.00,1.00,1.00,1.00 | 1.00,1.00,1.00,1.00 |
| C9 | 0.12,0.13,0.15,0.17 | 1.00,1.00,1.00,1.00 | 1.00,1.00,1.00,1.00 | 1.00,1.00,1.00,1.00 | 1.00,1.00,1.00,1.00 | 1.00,1.00,1.00,1.00 |
| C10 | 0.12,0.13,0.15,0.16 | 1.00,1.00,1.00,1.00 | 1.00,1.00,1.00,1.00 | 1.00,1.00,1.00,1.00 | 1.00,1.00,1.00,1.00 | 1.00,1.00,1.00,1.00 |
| C11 | 0.17,0.18,0.22,0.25 | 1.00,1.00,1.00,1.00 | 1.00,1.00,1.00,1.00 | 1.00,1.00,1.00,1.00 | 1.00,1.00,1.00,1.00 | 1.00,1.00,1.00,1.00 |
| C12 | 0.16,0.18,0.22,0.25 | 1.00,1.00,1.00,1.00 | 1.00,1.00,1.00,1.00 | 1.00,1.00,1.00,1.00 | 1.00,1.00,1.00,1.00 | 1.00,1.00,1.00,1.00 |
| CR = 0.0543 | ||||||
| Criteria | Criteria | |||||
|---|---|---|---|---|---|---|
| C13 | C14 | C15 | C16 | C17 | C18 | |
| C13 | 1.00,1.00,1.00,1.00 | 1.00,1.00,1.00,1.00 | 1.00,1.00,1.00,1.00 | 2.00,2.50,3.50,4.00 | 2.00,2.50,3.50,4.00 | 1.00,1.00,1.00,1.00 |
| C14 | 1.00,1.00,1.00,1.00 | 1.00,1.00,1.00,1.00 | 1.00,1.00,1.00,1.00 | 2.00,2.50,3.50,4.00 | 2.00,2.50,3.50,4.00 | 1.00,1.00,1.00,1.00 |
| C15 | 1.00,1.00,1.00,1.00 | 1.00,1.00,1.00,1.00 | 1.00,1.00,1.00,1.00 | 2.00,2.50,3.50,4.00 | 2.00,2.50,3.50,4.00 | 1.00,1.00,1.00,1.00 |
| C16 | 0.25,0.28,0.40,0.50 | 0.25,0.29,0.40,0.50 | 0.25,0.29,0.40,0.50 | 1.00,1.00,1.00,1.00 | 4.00,4.50,5.50,6.00 | 6.00,6.50,7.50,8.00 |
| C17 | 0.25,0.29,0.40,0.50 | 0.25,0.29,0.40,0.50 | 0.25,0.29,0.40,0.50 | 0.17,0.18,0.22,0.25 | 1.00,1.00,1.00,1.00 | 8.00,8.50,9.00,9.00 |
| C18 | 1.00,1.00,1.00,1.00 | 1.00,1.00,1.00,1.00 | 1.00,1.00,1.00,1.00 | 0.12,0.13,0.15,0.16 | 0.11,0.11,0.12,0.12 | 1.00,1.00,1.00,1.00 |
| CR = 0.0815 | ||||||
| Criteria | Criteria | |||||
|---|---|---|---|---|---|---|
| C19 | C20 | C21 | C22 | C23 | C24 | |
| C19 | 1.00,1.00,1.00,1.00 | 6.00,6.50,7.50,8.00 | 4.00,4.50,5.50,6.00 | 4.00,4.50,5.50,6.00 | 4.00,4.50,5.50,6.00 | 2.00,2.50,3.50,4.00 |
| C20 | 0.12,0.13,0.15,0.17 | 1.00,1.00,1.00,1.00 | 2.00,2.50,3.50,4.00 | 2.00,2.50,3.50,4.00 | 2.00,2.50,3.50,4.00 | 2.00,2.50,3.50,4.00 |
| C21 | 0.17,0.18,0.22,0.25 | 0.25,0.29,0.40,0.50 | 1.00,1.00,1.00,1.00 | 1.00,1.00,1.00,1.00 | 4.00,4.50,5.50,6.00 | 2.00,2.50,3.50,4.00 |
| C22 | 0.17,0.18,0.22,0.25 | 0.25,0.29,0.40,0.50 | 1.00,1.00,1.00,1.00 | 1.00,1.00,1.00,1.00 | 1.00,1.00,1.00,1.00 | 2.00,2.50,3.50,4.00 |
| C23 | 0.17,0.18,0.22,0.25 | 0.25,0.29,0.40,0.50 | 0.17,0.18,0.22,0.25 | 1.00,1.00,1.00,1.00 | 1.00,1.00,1.00,1.00 | 2.00,2.50,3.50,4.00 |
| C24 | 0.25,0.29,0.40,0.50 | 0.25,0.29,0.40,0.50 | 0.25,0.29,0.40,0.50 | 0.25,0.29,0.40,0.50 | 0.25,0.29,0.40,0.50 | 1.00,1.00,1.00,1.00 |
| CR = 0.0302 | ||||||
| Sub-Criteria | Sub-Criteria | |||||||
|---|---|---|---|---|---|---|---|---|
| SC1 | SC2 | SC3 | SC4 | SC5 | SC6 | SC7 | SC8 | |
| SC1 | 1.00,1.00,1.00,1.00 | 1.00,1.00,1.00,1.00 | 2.00,2.50,3.50,4.00 | 6.00,6.50,7.50,8.00 | 8.00,8.50,9.00,9.00 | 6.00,6.50,7.50,8.00 | 2.00,2.50,3.50,4.00 | 1.00,1.00,1.00,1.00 |
| SC2 | 1.00,1.00,1.00,1.00 | 1.00,1.00,1.00,1.00 | 2.00,2.50,3.50,4.00 | 6.00,6.50,7.50,8.00 | 8.00,8.50,9.00,9.00 | 6.00,6.50,7.50,8.00 | 6.00,6.50,7.50,8.00 | 1.00,1.00,1.00,1.00 |
| SC3 | 0.25,0.29,0.40,0.50 | 0.25,0.28,0.40,0.50 | 1.00,1.00,1.00,1.00 | 8.00,8.50,9.00,9.00 | 8.00,8.50,9.00,9.00 | 8.00,8.50,9.00,9.00 | 8.00,8.50,9.00,9.00 | 6.00,6.50,7.50,8.00 |
| SC4 | 0.12,0.13,0.15,0.17 | 0.12,0.13,0.15,0.17 | 0.11,0.11,0.118,0.12 | 1.00,1.00,1.00,1.00 | 4.00,4.50,5.50,6.00 | 1.00,1.00,1.00,1.00 | 6.00,6.50,7.50,8.00 | 6.00,6.50,7.50,8.00 |
| SC5 | 0.11,0.11,0.12,0.12 | 0.11,0.11,0.118,0.12 | 0.11,0.11,0.118,0.12 | 0.17,0.18,0.22,0.25 | 1.00,1.00,1.00,1.00 | 2.00,2.50,3.50,4.00 | 2.00,2.50,3.50,4.00 | 2.00,2.50,3.50,4.00 |
| SC6 | 0.12,0.13,0.15,0.17 | 0.12,0.13,0.15,0.17 | 0.11,0.11,0.12,0.12 | 1.00,1.00,1.00,1.00 | 0.25,0.27,0.40,0.50 | 1.00,1.00,1.00,1.00 | 4.00,4.50,5.50,6.00 | 2.00,2.50,3.50,4.00 |
| SC7 | 0.25,0.29,0.40,0.50 | 0.12,0.13,0.15,0.17 | 0.11,0.11,0.118,0.12 | 0.12,0.13,0.15,0.17 | 0.25,0.29,0.400,0.50 | 0.17,0.18,0.22,0.25 | 1.00,1.00,1.00,1.00 | 2.00,2.50,3.50,4.00 |
| SC8 | 1.00,1.00,1.00,1.00 | 1.00,1.00,1.00,1.00 | 0.12,0.13,0.15,0.17 | 0.12,0.13,0.15,0.17 | 0.25,0.29,0.40,0.50 | 0.25,0.29,0.40,0.50 | 0.25,0.29,0.40,0.50 | 1.00,1.00,1.00,1.00 |
| CR = 0.0417 | ||||||||
| Criteria | Very Weak | Weak | Moderate | Good | Very Good |
|---|---|---|---|---|---|
| C1 | 260 * | 835 | 1169 | 2616 | 979 |
| C2 | 289 | 851 | 1143 | 2670 | 901 |
| C3 | 325 | 779 | 1089 | 2690 | 970 |
| C4 | 384 | 826 | 1075 | 2656 | 913 |
| C5 | 376 | 860 | 1196 | 2540 | 879 |
| C6 | 366 | 739 | 1106 | 2631 | 1008 |
| C7 | 313 | 801 | 1179 | 2554 | 1004 |
| C8 | 395 | 860 | 1155 | 2516 | 924 |
| C9 | 371 | 887 | 1262 | 2421 | 910 |
| C10 | 358 | 900 | 1338 | 2316 | 938 |
| C11 | 399 | 828 | 1305 | 2377 | 941 |
| C12 | 345 | 824 | 1181 | 2565 | 935 |
| C13 | 403 | 869 | 1281 | 2422 | 875 |
| C14 | 507 | 887 | 1216 | 2397 | 843 |
| C15 | 357 | 902 | 1307 | 2402 | 882 |
| C16 | 306 | 869 | 1239 | 2464 | 972 |
| C17 | 334 | 876 | 1263 | 2419 | 958 |
| C18 | 471 | 940 | 1143 | 2477 | 821 |
| C19 | 315 | 738 | 1344 | 2451 | 1003 |
| C20 | 386 | 847 | 1109 | 2588 | 921 |
| C21 | 265 | 868 | 987 | 2769 | 962 |
| C22 | 368 | 760 | 1231 | 2536 | 956 |
| C23 | 313 | 803 | 1154 | 2597 | 984 |
| C24 | 380 | 749 | 1036 | 2647 | 1039 |
| Sub-Criteria | |||||
| SC1 | 365 | 728 | 1074 | 2392 | 1292 |
| SC2 | 358 | 779 | 1126 | 2318 | 1269 |
| SC3 | 305 | 705 | 1047 | 2469 | 1325 |
| SC4 | 439 | 961 | 1047 | 2379 | 1027 |
| SC5 | 482 | 864 | 1235 | 2320 | 952 |
| SC6 | 333 | 806 | 1165 | 2469 | 1080 |
| SC7 | 356 | 817 | 1047 | 2507 | 1126 |
| SC8 | 308 | 789 | 1102 | 2432 | 1222 |
| Alternative | Criteria | Proposed Method | Fuzzy AHP | |
|---|---|---|---|---|
| Fuzzy Weight Vector | Defuzzy Weight | Weight | ||
| A | C1 | 0.1590,0.1630,0.1710,0.1753 | 0.167 | 0.163 |
| C2 | 0.1587,0.1627,0.1708,0.1750 | 0.165 | 0.155 | |
| C3 | 0.1590,0.1630,0.1710,0.1752 | 0.169 | 0.167 | |
| C4 | 0.1585,0.1625,0.1705,0.1747 | 0.166 | 0.173 | |
| C5 | 0.1582,0.1621,0.1702,0.1745 | 0.159 | 0.153 | |
| C6 | 0.1590,0.1630,0.1709,0.1751 | 0.164 | 0.161 | |
| B | C7 | 0.1593,0.1633,0.1713,0.1756 | 0.167 | 0.161 |
| C8 | 0.1586,0.1626,0.1707,0.1750 | 0.166 | 0.145 | |
| C9 | 0.1584,0.1624,0.1705,0.1748 | 0.165 | 0.166 | |
| C10 | 0.1583,0.1624,0.1705,0.1748 | 0.167 | 0.151 | |
| C11 | 0.1585,0.1625,0.1705,0.1748 | 0.166 | 0.151 | |
| C12 | 0.1589,0.1629,0.1710,0.1753 | 0.168 | 0.160 | |
| C | C13 | 0.1585,0.1626,0.1708,0.1751 | 0.167 | 0.157 |
| C14 | 0.1581,0.1621,0.1702,0.1746 | 0.165 | 0.165 | |
| C15 | 0.1586,0.1626,0.1709,0.1752 | 0.168 | 0.165 | |
| C16 | 0.1592,0.1633,0.1714,0.1758 | 0.167 | 0.156 | |
| C17 | 0.1590,0.1630,0.1712,0.1755 | 0.172 | 0.165 | |
| C18 | 0.1581,0.1622,0.1703,0.1747 | 0.166 | 0.162 | |
| D | C19 | 0.1588,0.1627,0.1707,0.1749 | 0.166 | 0.162 |
| C20 | 0.1584,0.1623,0.1703,0.1745 | 0.166 | 0.154 | |
| C21 | 0.1591,0.1631,0.1710,0.1753 | 0.167 | 0.162 | |
| C22 | 0.1586,0.1625,0.1705,0.1747 | 0.166 | 0.169 | |
| C23 | 0.1589,0.1628,0.1708,0.1750 | 0.167 | 0.157 | |
| C24 | 0.1591,0.1630,0.1709,0.1750 | 0.167 | 0.165 | |
| Sub-criteria | SC1 | 0.1120,0.1141,0.1181,0.1201 | 0.139 | 0.141 |
| SC2 | 0.118,0.1139,0.1180,0.1199 | 0.139 | 0.132 | |
| SC3 | 0.0943,0.0952,0.0972,0.0982 | 0.140 | 0.126 | |
| SC4 | 0.0938,0.0948,0.0968,0.0979 | 0.125 | 0.122 | |
| SC5 | 0.0938,0.0947,0.0968,0.0978 | 0.119 | 0.098 | |
| SC6 | 0.0940,0.0950,0.0970,0.0981 | 0.113 | 0.103 | |
| SC7 | 0.0941,0.0950,0.0970,0.0981 | 0.120 | 0.104 | |
| SC8 | 0.0942,0.0951,0.0971,0.0982 | 0.106 | 0.097 | |
| Alternative | Proposed Method | Fuzzy AHP | |
|---|---|---|---|
| Fuzzy Weight Vector | Defuzzy Weights | Weights | |
| A | 0.1586,0.1625,0.1705,0.1747 | 0.161 | 0.146 |
| B | 0.1492,0.1551,0.1626,0.1753 | 0.153 | 0.155 |
| C | 0.1396,0.1427,0.1490,0.1523 | 0.147 | 0.143 |
| D | 0.1397,0.1428,0.1489,0.1522 | 0.141 | 0.139 |
| Alternative | Criteria | Aggregated Fuzzy Value |
|---|---|---|
| A | C1 | 0.226, 0.358, 0.379, 0.524 |
| C2 | 0.231, 0.365, 0.385, 0.530 | |
| C3 | 0.226, 0.358, 0.380, 0.523 | |
| C4 | 0.238, 0.370, 0.392, 0.534 | |
| C5 | 0.244, 0.379, 0.400, 0.543 | |
| C6 | 0.228, 0.358, 0.382, 0.523 | |
| B | C7 | 0.229, 0.361, 0.383, 0.527 |
| C8 | 0.244, 0.377, 0.400, 0.542 | |
| C9 | 0.248, 0.382, 0.404, 0.547 | |
| C10 | 0.249, 0.384, 0.406, 0.550 | |
| C11 | 0.247, 0.381, 0.404, 0.546 | |
| C12 | 0.236, 0.369, 0.391, 0.534 | |
| C | C13 | 0.251, 0.386, 0.408, 0.551 |
| C14 | 0.264, 0.398, 0.421, 0.561 | |
| C15 | 0.249, 0.385, 0.406, 0.551 | |
| C16 | 0.237, 0.370, 0.392, 0.536 | |
| C17 | 0.242, 0.375, 0.397, 0.541 | |
| C18 | 0.262, 0.396, 0.418, 0.559 | |
| D | C19 | 0.230, 0.363, 0.385, 0.530 |
| C20 | 0.241, 0.373, 0.396, 0.537 | |
| C21 | 0.223, 0.355, 0.376, 0.519 | |
| C22 | 0.235, 0.368, 0.390, 0.533 | |
| C23 | 0.229, 0.361, 0.383, 0.526 | |
| C24 | 0.227, 0.356, 0.380, 0.521 |
| Alternative | Criteria | uij | Defuzzy Value |
|---|---|---|---|
| A | C1 | 0.390, 0.635, 0.706, 1.00 | 0.668 |
| C2 | 0.395, 0.641, 0.710, 1.00 | 0.677 | |
| C3 | 0.393, 0.637, 0.709, 1.00 | 0.677 | |
| C4 | 0.404, 0.645, 0.717, 1.00 | 0.677 | |
| C5 | 0.408, 0.649, 0.719, 1.00 | 0.677 | |
| C6 | 0.395, 0.637, 0.712, 1.00 | 0.672 | |
| B | C7 | 0.370, 0.606, 0.675, 1.00 | 0.702 |
| C8 | 0.384, 0.616, 0.685, 1.00 | 0.709 | |
| C9 | 0.385, 0.617, 0.684, 1.00 | 0.700 | |
| C10 | 0.386, 0.617, 0.684, 1.00 | 0.694 | |
| C11 | 0.385, 0.616, 0.685, 1.00 | 0.697 | |
| C12 | 0.376, 0.611, 0.679, 1.00 | 0.708 | |
| C | C13 | 0.418, 0.657, 0.724, 1.00 | 0.686 |
| C14 | 0.430, 0.664, 0.734, 1.00 | 0.689 | |
| C15 | 0.415, 0.655, 0.722, 1.00 | 0.688 | |
| C16 | 0.405, 0.646, 0.715, 1.00 | 0.694 | |
| C17 | 0.409, 0.649, 0.718, 1.00 | 0.697 | |
| C18 | 0.429, 0.664, 0.732, 1.00 | 0.689 | |
| D | C19 | 0.398, 0.642, 0.711, 1.00 | 0.690 |
| C20 | 0.411, 0.652, 0.720, 1.00 | 0.698 | |
| C21 | 0.395, 0.641, 0.708, 1.00 | 0.689 | |
| C22 | 0.404, 0.647, 0.716, 1.00 | 0.694 | |
| C23 | 0.399, 0.643, 0.712, 1.00 | 0.691 | |
| C24 | 0.400, 0.642, 0.715, 1.00 | 0.692 |
| Alternative | A | B | C | D |
|---|---|---|---|---|
| Best value (f*) | 0.677 | 0.709 | 0.697 | 0.698 |
| Worst value (f -) | 0.668 | 0.694 | 0.686 | 0.689 |
| Alternative | A | B | C | D |
|---|---|---|---|---|
| Si | 0.252 | 0.430 | 0.512 | 0.535 |
| Ri | 0.085 | 0.120 | 0.125 | 0.146 |
| Q (v = 0.5) | 0.00 | 1.180 | 1.431 | 2.00 |
| Alternative | Si | Ri | Q (v = 0.5) |
|---|---|---|---|
| A | 1 | 1 | 1 |
| B | 2 | 2 | 2 |
| C | 3 | 3 | 3 |
| D | 4 | 4 | 4 |
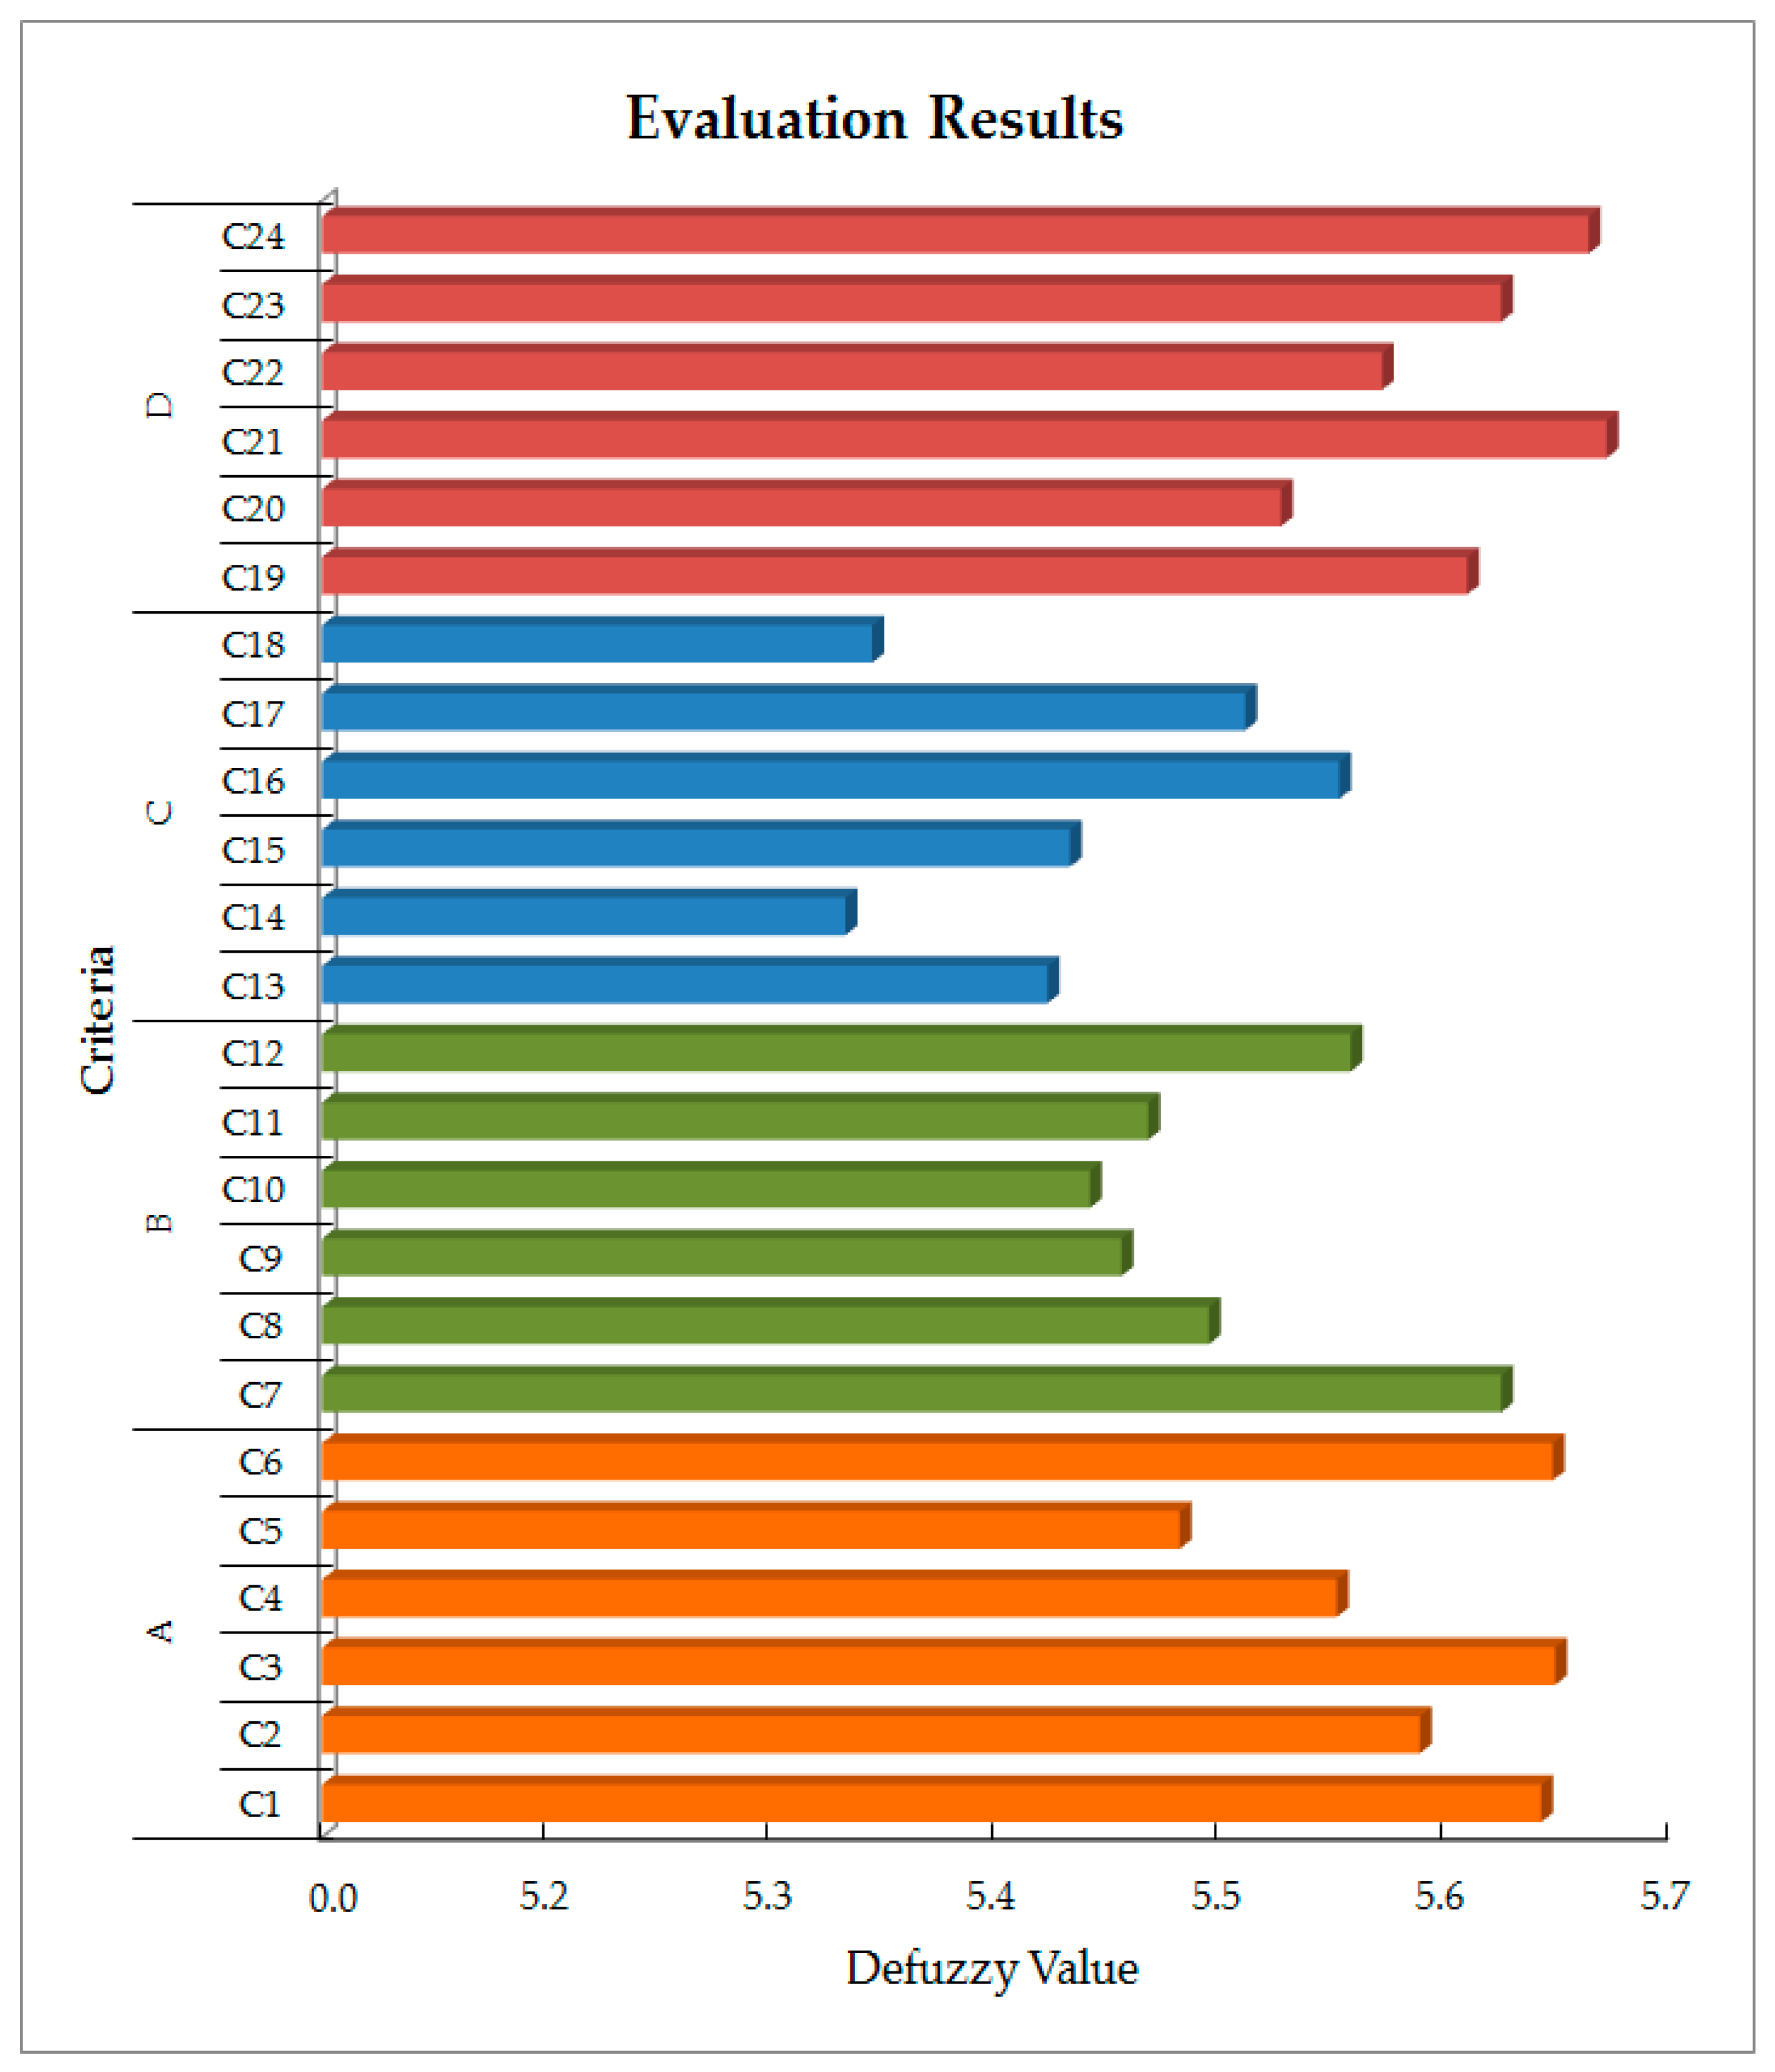
| Alternative | Criteria | The Fuzzy Evaluation Vectors | Rating | Defuzzy Value |
|---|---|---|---|---|
| A | C1 | 4.14, 5.14, 6.14, 7.14 | M,G* | 5.643 |
| C2 | 4.08, 5.08, 6.08, 7.08 | M,G | 5.589 | |
| C3 | 4.14, 5.14, 6.15, 7.14 | M,G | 5.649 | |
| C4 | 4.05, 5.05, 6.05, 7.05 | M,G | 5.552 | |
| C5 | 3.98, 4.98, 5.98, 6.98 | M,G | 5.482 | |
| C6 | 4.14, 5.14, 6.14, 7.14 | M,G | 5.648 | |
| B | C7 | 4.12, 5.12, 6.12, 7.12 | M,G | 5.625 |
| C8 | 3.99, 4.99, 5.99, 6.99 | M,G | 5.495 | |
| C9 | 3.95, 4.95, 5.95, 6.95 | M,G | 5.456 | |
| C10 | 3.94, 4.94, 5.94, 6.94 | M,G | 5.442 | |
| C11 | 3.96, 4.96, 5.96, 6.96 | M,G | 5.468 | |
| C12 | 4.05, 5.05, 6.05, 7.05 | M,G | 5.558 | |
| C | C13 | 3.92, 4.92, 5.92, 6.92 | M,G | 5.423 |
| C14 | 3.83, 4.83, 5.83, 6.83 | M,G | 5.333 | |
| C15 | 3.93, 4.93, 5.93, 6.93 | M,G | 5.433 | |
| C16 | 4.05, 5.05, 6.05, 7.05 | M,G | 5.553 | |
| C17 | 4.01, 5.01, 6.01, 7.01 | M,G | 5.511 | |
| C18 | 3.845,4.845,5.845,6.845 | M,G | 5.345 | |
| D | C19 | 4.11, 5.11, 6.11, 7.11 | M,G | 5.610 |
| C20 | 4.02, 5.02, 6.02, 7.02 | M,G | 5.527 | |
| C21 | 4.17, 5.17, 6.17, 7.17 | M,G | 5.672 | |
| C22 | 4.07, 5.07, 6.07, 7.07 | M,G | 5.572 | |
| C23 | 4.12, 5.12, 6.12, 7.12 | M,G | 5.625 | |
| C24 | 4.16, 5.16, 6.16, 7.16 | M,G | 5.664 | |
| Sub-Criteria | SC1 | 4.26, 5.26, 6.26, 7.26 | M,G | 5.765 |
| SC2 | 4.21, 5.21, 6.21, 7.21 | M,G | 5.710 | |
| SC3 | 4.35, 5.35, 6.35, 7.35 | M,G | 5.852 | |
| SC4 | 3.96, 4.96, 5.96, 6.96 | M,G | 5.461 | |
| SC5 | 3.90, 4.90, 5.90, 6.90 | M,G | 5.401 | |
| SC6 | 4.13, 5.13, 6.13, 7.13 | M,G | 5.636 | |
| SC7 | 4.16, 5.16, 6.16, 7.16 | M,G | 5.665 | |
| SC8 | 4.23, 5.23, 6.23, 7.23 | M,G | 5.639 |
| Alternative | The Fuzzy Evaluation Vectors | Rating | Defuzzy Value |
|---|---|---|---|
| A | 4.13, 4.50, 4.88, 5.25 | M,G * | 4.70 |
| B | 4.13, 4.50, 4.88, 5.25 | M,G | 4.69 |
| C | 4.12, 4.50, 4.87, 5.25 | M,G | 4.68 |
| D | 4.11, 4.48, 4.86, 5.23 | M,G | 4.67 |
| Ai | Q (v = 0.1) | Q (v = 0.2) | Q (v = 0.3) | Q (v = 0.4) | Q (v = 0.5) | Q (v = 0.6) | Q (v = 0.7) | Q (v = 0.8) | Q (v = 0.9) | Q (v = 1.0) | Rank Qi |
|---|---|---|---|---|---|---|---|---|---|---|---|
| A | 0.00 | 0.00 | 0.00 | 0.00 | 0.00 | 0.00 | 0.00 | 0.00 | 0.00 | 0.00 | 1 |
| B | 0.70 | 0.82 | 0.94 | 1.06 | 1.18 | 1.30 | 1.42 | 1.54 | 1.66 | 1.78 | 2 |
| C | 0.80 | 0.96 | 1.12 | 1.27 | 1.43 | 1.59 | 1.74 | 1.90 | 2.06 | 2.21 | 3 |
| D | 1.20 | 1.40 | 1.60 | 1.80 | 2.00 | 2.20 | 2.40 | 2.60 | 2.80 | 3.00 | 4 |
© 2020 by the authors. Licensee MDPI, Basel, Switzerland. This article is an open access article distributed under the terms and conditions of the Creative Commons Attribution (CC BY) license (http://creativecommons.org/licenses/by/4.0/).
Share and Cite
Salimi, A.H.; Noori, A.; Bonakdari, H.; Masoompour Samakosh, J.; Sharifi, E.; Hassanvand, M.; Gharabaghi, B.; Agharazi, M. Exploring the Role of Advertising Types on Improving the Water Consumption Behavior: An Application of Integrated Fuzzy AHP and Fuzzy VIKOR Method. Sustainability 2020, 12, 1232. https://doi.org/10.3390/su12031232
Salimi AH, Noori A, Bonakdari H, Masoompour Samakosh J, Sharifi E, Hassanvand M, Gharabaghi B, Agharazi M. Exploring the Role of Advertising Types on Improving the Water Consumption Behavior: An Application of Integrated Fuzzy AHP and Fuzzy VIKOR Method. Sustainability. 2020; 12(3):1232. https://doi.org/10.3390/su12031232
Chicago/Turabian StyleSalimi, Amir Hossein, Amir Noori, Hossein Bonakdari, Jafar Masoompour Samakosh, Ehsan Sharifi, Mohammadreza Hassanvand, Baharam Gharabaghi, and Mehdi Agharazi. 2020. "Exploring the Role of Advertising Types on Improving the Water Consumption Behavior: An Application of Integrated Fuzzy AHP and Fuzzy VIKOR Method" Sustainability 12, no. 3: 1232. https://doi.org/10.3390/su12031232
APA StyleSalimi, A. H., Noori, A., Bonakdari, H., Masoompour Samakosh, J., Sharifi, E., Hassanvand, M., Gharabaghi, B., & Agharazi, M. (2020). Exploring the Role of Advertising Types on Improving the Water Consumption Behavior: An Application of Integrated Fuzzy AHP and Fuzzy VIKOR Method. Sustainability, 12(3), 1232. https://doi.org/10.3390/su12031232