Energy Management in PV Based Microgrids Designed for the Universidad Nacional de Colombia

 ,
,  , , and
Abstract
1. Introduction
2. Background of SPVSs
3. Circuital Structure and Control Strategy for the EMS
3.1. Devices and Control Strategies
3.2. Energy Management System Proposed to Control the SPVS
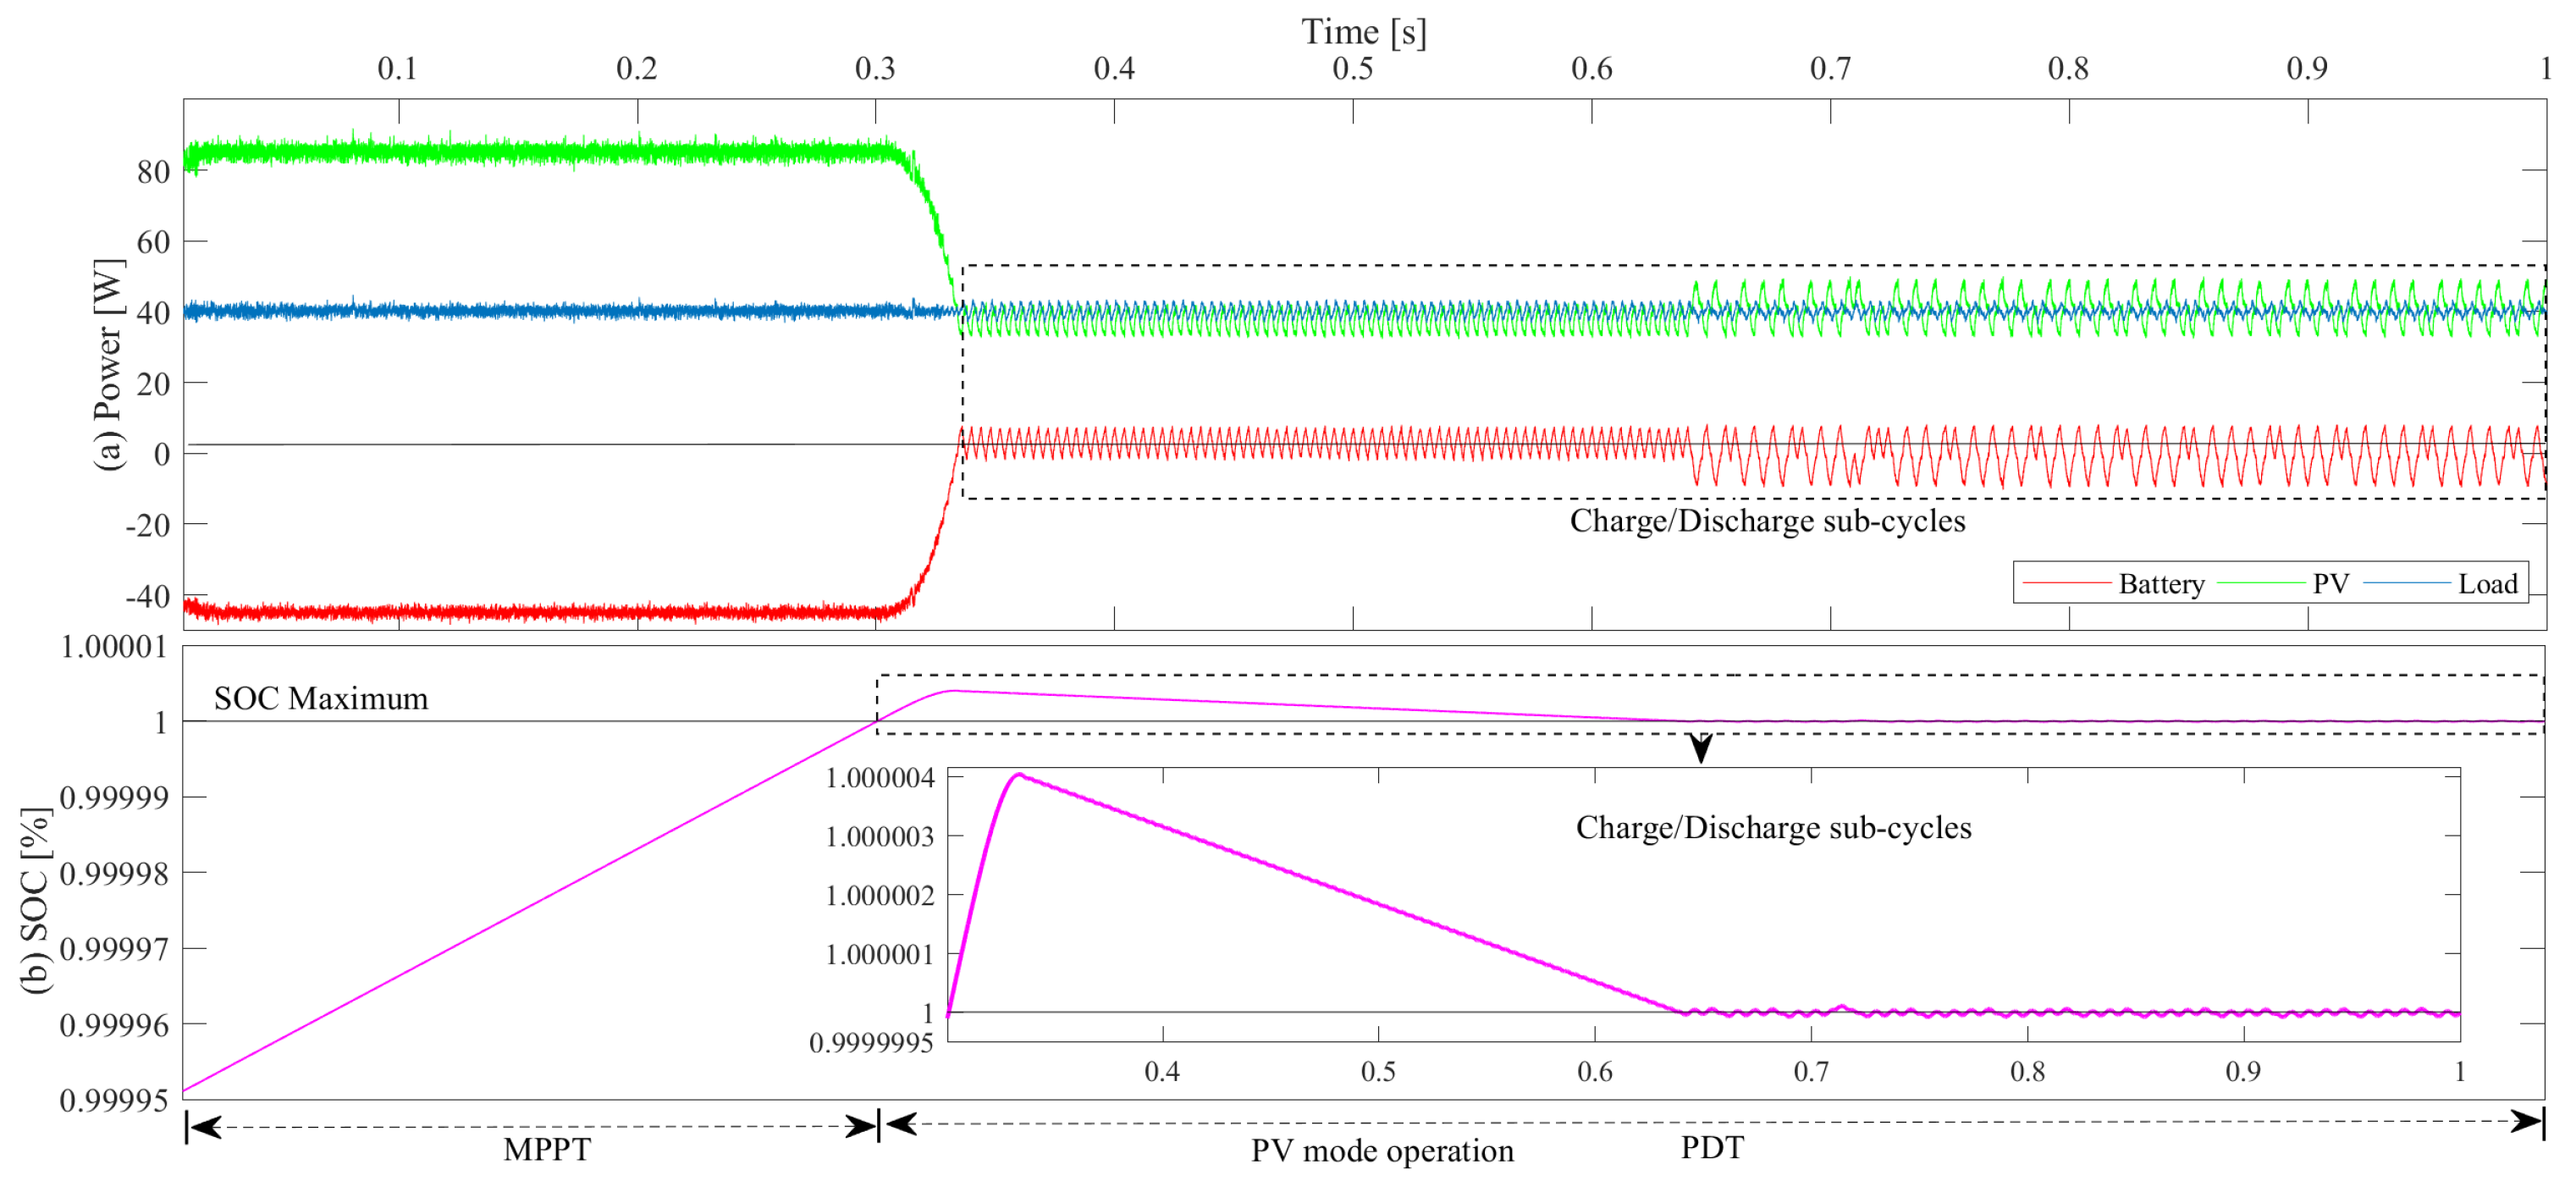
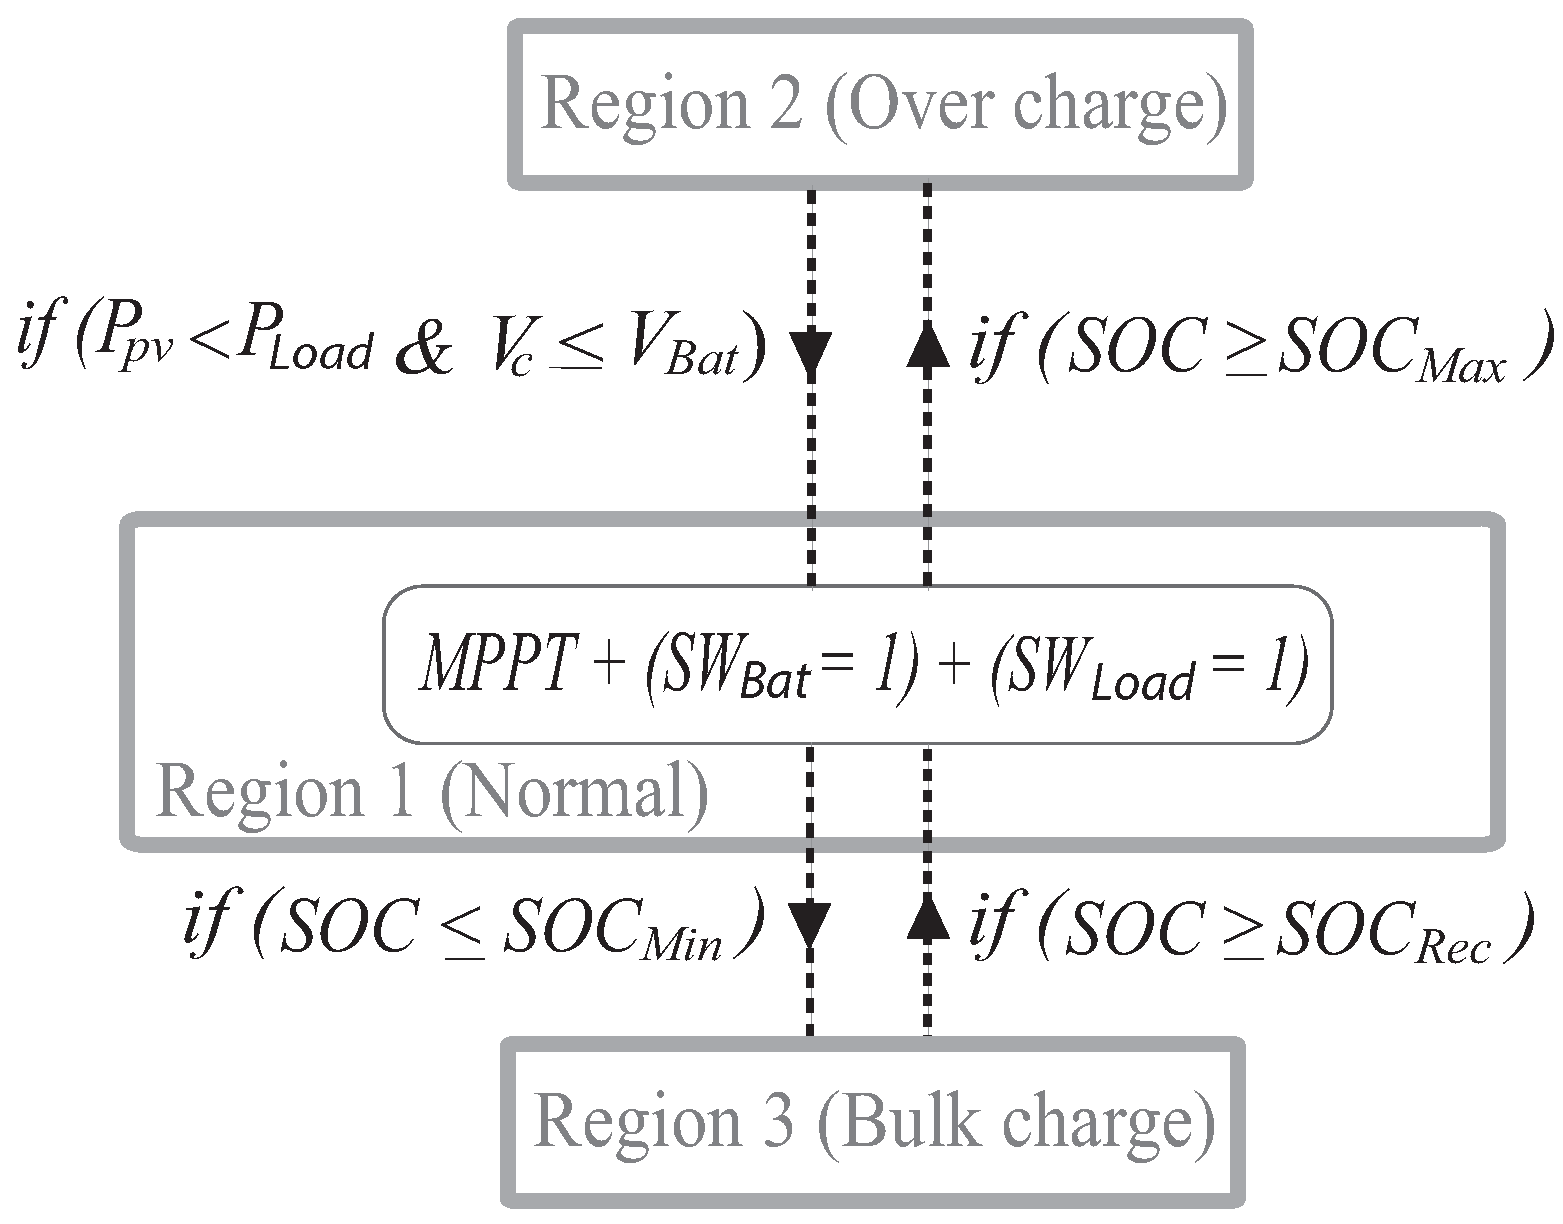
3.2.1. Region 1
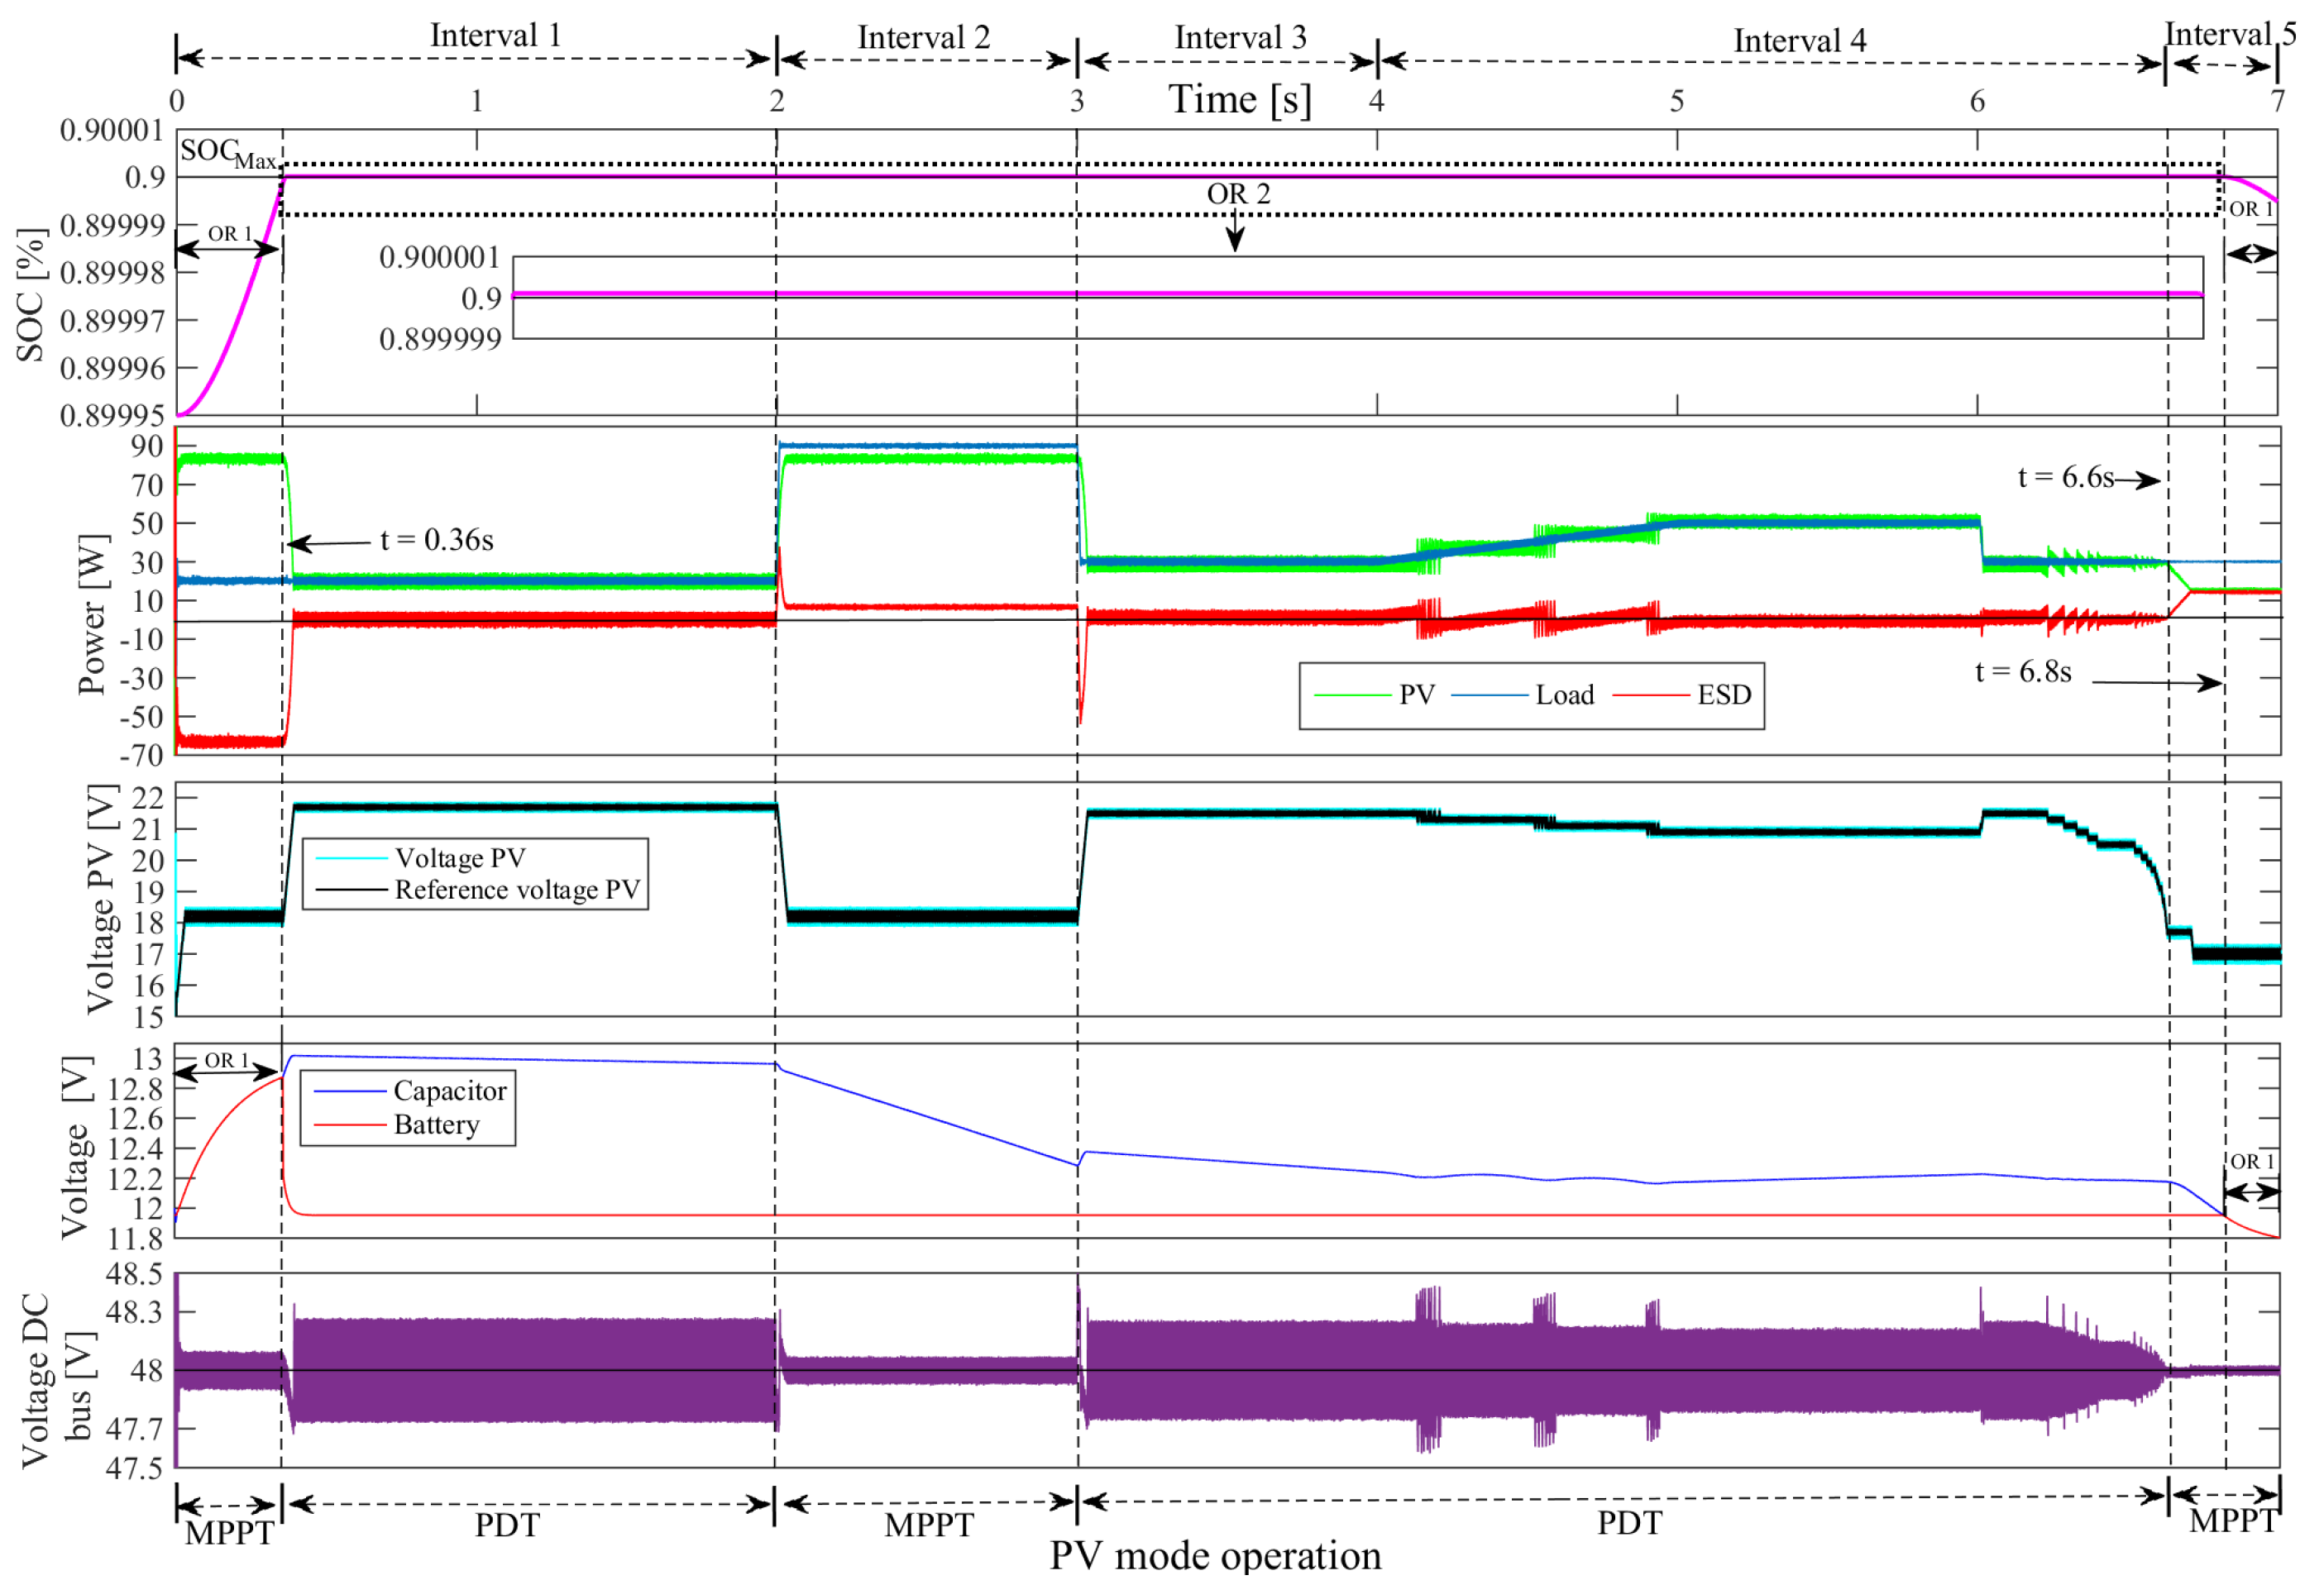
3.2.2. Region 2
- : In this operating state, the battery must be disconnected () and, at the same time, the PVS should operate in PDT. As a result, the capacitor is in charge of supplying and storing the power required by the system to perform the PDT and to control the DC-bus voltage. In order to prevent the capacitor from fully discharging and the system from collapsing due to the lack of power to control the DC-bus, the system operates in PDT mode until the capacitor reaches a voltage below , being the maximum allowable voltage drop for the capacitor. In the case that this limit is violated, the PVS should change to MPPT mode so that the capacitor is charged until it reaches the battery voltage , thus exploiting the excess power generated by the PVS. Note that, in the management system, the voltage of both the capacitor and the battery should always be sensed to perform this control action. Additionally, the capacitor should be protected against over voltage conditions. For that reason, if during the operation in PDT mode the capacitor reaches the maximum allowable voltage (), then the PVS is operated in open circuit voltage () until the capacitor reaches a safe voltage (). This is achieved because the capacitor is forced to supply the power required by the load, thus enabling the reduction of its voltage. When the capacitor reaches a safe voltage, the PVS starts to operate in MPPT to provide power. As a result, the operating mode can change to PDT if the power conditions are met ; otherwise, the PVS continues operating in MPPT in Region 1 as long as the power generated by the panel is lower than that required by the load and the capacitor’s voltage is lower than or equal to that of the battery (). This forces the capacitor to discharge before changing operating regions (from 2 to 1), thus reducing the voltage fluctuations at the DC-bus when the battery is connected.
- : In this state, the PVS power reaches a lower value than that of the load. This is due to the decrease in Solar Radiation (SR), the variation of T, or higher power demanded by the load; therefore, the PVS should increase the delivered power and start to operate in MPPT, maintaining the battery disconnected (). The system continues operating in Region 2 as long as the condition to change to OR1 (described in the previous paragraph) is not met. If that condition is not satisfied and the condition remains, the capacitor is charged up to the battery nominal voltage and the PVS operates in PDT once again.
3.2.3. Region 3
4. Simulation Results
4.1. Simulation and Validation of the Proposed Operating Regions
4.1.1. Region 1
4.1.2. Region 2
4.1.3. Region 3
4.2. 24-h Test Scenario
5. Conclusions
Author Contributions
Funding
Acknowledgments
Conflicts of Interest
References
- Rahbar, K.; Chai, C.C.; Zhang, R. Energy Cooperation Optimization in Microgrids with Renewable Energy Integration. IEEE Trans. Smart Grid 2018, 9, 1482–1493. [Google Scholar] [CrossRef]
- Justo, J.J.; Mwasilu, F.; Lee, J.; Jung, J.W. AC-microgrids versus DC-microgrids with distributed energy resources: A review. Renew. Sustain. Energy Rev. 2013, 24, 387–405. [Google Scholar] [CrossRef]
- Parhizi, S.; Lotfi, H.; Khodaei, A.; Bahramirad, S. State of the Art in Research on Microgrids: A Review. IEEE Access 2015, 3, 890–925. [Google Scholar] [CrossRef]
- Guerrero, J.M.; Chandorkar, M.; Lee, T.L.; Loh, P.C. Advanced Control Architectures for Intelligent Microgrids—Part I: Decentralized and Hierarchical Control. IEEE Trans. Ind. Electron. 2013, 60, 1254–1262. [Google Scholar] [CrossRef]
- Jing, W. Battery-supercapacitor hybrid energy storage system in standalone DC microgrids: A review. IET Renew. Power Gener. 2017, 11, 461–469. [Google Scholar] [CrossRef]
- Zia, M.F.; Elbouchikhi, E.; Benbouzid, M. Microgrids energy management systems: A critical review on methods, solutions, and prospects. Appl. Energy 2018, 222, 1033–1055. [Google Scholar] [CrossRef]
- Schonbergerschonberger, J.; Duke, R.; Round, S. DC-Bus Signaling: A Distributed Control Strategy for a Hybrid Renewable Nanogrid. IEEE Trans. Ind. Electron. 2006, 53, 1453–1460. [Google Scholar] [CrossRef]
- Gee, A.M.; Robinson, F.V.P.; Dunn, R.W. Analysis of Battery Lifetime Extension in a Small-Scale Wind-Energy System Using Supercapacitors. IEEE Trans. Energy Convers. 2013, 28, 24–33. [Google Scholar] [CrossRef]
- Ismail, M.; Moghavvemi, M.; Mahlia, T. Design of an optimized photovoltaic and microturbine hybrid power system for a remote small community: Case study of Palestine. Energy Convers. Manag. 2013, 75, 271–281. [Google Scholar] [CrossRef]
- Augustine, S.; Mishra, M.K.; Lakshminarasamma, N. Adaptive Droop Control Strategy for Load Sharing and Circulating Current Minimization in Low-Voltage Standalone DC Microgrid. IEEE Trans. Sustain. Energy 2015, 6, 132–141. [Google Scholar] [CrossRef]
- Dizqah, A.M.; Maheri, A.; Busawon, K.; Kamjoo, A. A Multivariable Optimal Energy Management Strategy for Standalone DC Microgrids. IEEE Trans. Power Syst. 2015, 30, 2278–2287. [Google Scholar] [CrossRef]
- López, J.; Seleme, S.; Donoso, P.; Morais, L.; Cortizo, P.; Severo, M. Digital control strategy for a buck converter operating as a battery charger for stand-alone photovoltaic systems. Solar Energy 2016, 140, 171–187. [Google Scholar] [CrossRef]
- Abu Eldahab, Y.E.; Saad, N.H.; Zekry, A. Enhancing the design of battery charging controllers for photovoltaic systems. Renew. Sustain. Energy Rev. 2016, 58, 646–655. [Google Scholar] [CrossRef]
- Jeon, J.-Y.; Kim, J.S.; Choe, G.-Y.; Lee, B.-K.; Hur, J.; Jin, H.-C. Design guideline of DC distribution systems for home appliances: Issues and solution. In Proceedings of the 2011 IEEE International Electric Machines & Drives Conference (IEMDC), Niagara Falls, ON, Canada, 15–18 May 2011; pp. 657–662. [Google Scholar] [CrossRef]
- Weixing, L.; Xiaoming, M.; Yuebin, Z.; Marnay, C. On voltage standards for DC home microgrids energized by distributed sources. In Proceedings of the 7th International Power Electronics and Motion Control Conference, Harbin, China, 2–5 June 2012; Volume 3, pp. 2282–2286. [Google Scholar] [CrossRef]
- Shimomachi, K.; Hara, R.; Kita, H. Comparison between DC and AC microgrid systems considering ratio of DC load. In Proceedings of the 2015 IEEE PES Asia-Pacific Power and Energy Engineering Conference (APPEEC), Brisbane, Australia, 31 October 2015; Volume 2016, pp. 1–4. [Google Scholar] [CrossRef]
- Whaite, S.; Grainger, B.; Kwasinski, A. Power Quality in DC Power Distribution Systems and Microgrids. Energies 2015, 8, 4378–4399. [Google Scholar] [CrossRef]
- Diaz-Acevedo, J.A.; Grisales-Noreña, L.F.; Escobar, A. A method for estimating electricity consumption patterns of buildings to implement Energy Management Systems. J. Build. Eng. 2019, 25, 100774. [Google Scholar] [CrossRef]
- Anastasi, G.; Corucci, F.; Marcelloni, F. An intelligent system for electrical energy management in buildings. In Proceedings of the 2011 11th International Conference on Intelligent Systems Design and Applications, Cordoba, Spain, 22 November 2011; pp. 702–707. [Google Scholar] [CrossRef]
- Yin, C.; Wu, H.; Sechilariu, M.; Locment, F. Power Management Strategy for an Autonomous DC Microgrid. Appl. Sci. 2018, 8, 2202. [Google Scholar] [CrossRef]
- Sharma, R.K.; Mishra, S. Dynamic Power Management and Control of a PV PEM Fuel-Cell-Based Standalone ac/dc Microgrid Using Hybrid Energy Storage. IEEE Trans. Ind. Appl. 2018, 54, 526–538. [Google Scholar] [CrossRef]
- Ma, L.; Sun, Y.; Lin, Y.; Bai, Z.; Tong, L.; Song, J. A high performance MPPT control method. In Proceedings of the 2011 International Conference on Materials for Renewable Energy & Environment, Shanghai, China, 22 May 2011; Volume 1, pp. 195–199. [Google Scholar] [CrossRef]
- Ayad, M.; Becherif, M.; Henni, A. Vehicle hybridization with fuel cell, supercapacitors and batteries by sliding mode control. Renew. Energy 2011, 36, 2627–2634. [Google Scholar] [CrossRef]
- Ramos-Paja, C.A.; Bastidas-Rodríguez, J.D.; González, D.; Acevedo, S.; Peláez-Restrepo, J. Design and control of a buck-boost charger-discharger for DC-bus regulation in microgrids. Energies 2017, 10, 1847. [Google Scholar] [CrossRef]
- Lu, X.; Wan, J. Modeling and Control of the Distributed Power Converters in a Standalone DC Microgrid. Energies 2016, 9, 217. [Google Scholar] [CrossRef]
- Kumar, M.; Srivastava, S.C.; Singh, S.N. Control Strategies of a DC Microgrid for Grid Connected and Islanded Operations. IEEE Trans. Smart Grid 2015, 6, 1588–1601. [Google Scholar] [CrossRef]
- Sechilariu, M.; Wang, B.C.; Locment, F.; Jouglet, A. DC microgrid power flow optimization by multi-layer supervision control. Design and experimental validation. Energy Convers. Manag. 2014, 82, 1–10. [Google Scholar] [CrossRef]
- Kwasinski, A.; Onwuchekwa, C.N. Dynamic Behavior and Stabilization of DC Microgrids with Instantaneous Constant-Power Loads. IEEE Trans. Power Electron. 2011, 26, 822–834. [Google Scholar] [CrossRef]
- Linden, D. Handbook of batteries. Fuel Energy Abstr. 1995, 36, 265. [Google Scholar]
- Belvedere, B.; Bianchi, M.; Borghetti, A.; Nucci, C.a.; Paolone, M.; Peretto, A. A Microcontroller-Based Power Management System for Standalone Microgrids With Hybrid Power Supply. IEEE Trans. Sustain. Energy 2012, 3, 422–431. [Google Scholar] [CrossRef]
- Chen, C.; Duan, S.; Cai, T.; Liu, B.; Hu, G. Optimal allocation and economic analysis of energy storage system in microgrids. IEEE Trans. Power Electron. 2011, 26, 2762–2773. [Google Scholar] [CrossRef]
- Anand, S.; Fernandes, B.G.; Guerrero, J. Distributed Control to Ensure Proportional Load Sharing and Improve Voltage Regulation in Low-Voltage DC Microgrids. IEEE Trans. Power Electron. 2013, 28, 1900–1913. [Google Scholar] [CrossRef]
- Matrawy, K.; Mahrous, A.F.; Youssef, M. Energy management and parametric optimization of an integrated PV solar house. Energy Convers. Manag. 2015, 96, 377–383. [Google Scholar] [CrossRef]
- Olatomiwa, L.; Mekhilef, S.; Ismail, M.; Moghavvemi, M. Energy management strategies in hybrid renewable energy systems: A review. Renew. Sustain. Energy Rev. 2016, 62, 821–835. [Google Scholar] [CrossRef]
- Li, J.; Gee, A.M.; Zhang, M.; Yuan, W. Analysis of battery lifetime extension in a SMES-battery hybrid energy storage system using a novel battery lifetime model. Energy 2015, 86, 175–185. [Google Scholar] [CrossRef]
- Wang, B.; Sechilariu, M.; Locment, F. Intelligent DC microgrid with smart grid communications: Control strategy consideration and design. In Proceedings of the 2013 IEEE Power & Energy Society General Meeting, Vancouver, BC, Canada, 25 July 2013; Volume 3. [Google Scholar] [CrossRef]
- Mojallizadeh, M.R.; Badamchizadeh, M.A. Adaptive Passivity-Based Control of a Photovoltaic/Battery Hybrid Power Source via Algebraic Parameter Identification. IEEE J. Photovoltaics 2016, 6, 532–539. [Google Scholar] [CrossRef]
- Adly, M.; Strunz, K. Irradiance-adaptive PV Module Integrated Converter for High Efficiency and Power Quality in Standalone and DC Microgrid Applications. IEEE Trans. Ind. Electron. 2017, 65, 436–446. [Google Scholar] [CrossRef]
- Mbodji, A.K.; Ndiaye, M.L.; Ndiaye, M.; Ndiaye, P.A. Operation optimal dynamics of a hybrid electrical system: Multi-agent approach. Procedia Comput. Sci. 2014, 36, 454–461. [Google Scholar] [CrossRef]
- Mahmood, H.; Michaelson, D.; Jiang, J. A Power Management Strategy for PV/Battery Hybrid Systems in Islanded Microgrids. IEEE J. Emerg. Sel. Top. Power Electron. 2014, 2, 870–882. [Google Scholar] [CrossRef]
- Gaurav, S.; Birla, C.; Lamba, A.; Umashankar, S.; Ganesan, S. Energy Management of PV—Battery Based Microgrid System. Procedia Technol. 2015, 21, 103–111. [Google Scholar] [CrossRef]
- Jenkins, D.; Fletcher, J.; Kane, D. Lifetime prediction and sizing of lead–acid batteries for microgeneration storage applications. IET Renew. Power Gener. 2008, 2, 191–200. [Google Scholar] [CrossRef]
- Zhao, B.; Zhang, X.; Chen, J.; Wang, C.; Guo, L. Operation optimization of standalone microgrids considering lifetime characteristics of battery energy storage system. IEEE Trans. Sustain. Energy 2013, 4, 934–943. [Google Scholar] [CrossRef]
- Oliveira, T.R.; Wodson, W.; Gonçalves, A.; Donoso-garcia, P.F. Distributed Secondary Level Control for Energy Storage Management in DC Microgrids. IEEE Trans. Smart Grid 2016, 8, 2597–2607. [Google Scholar] [CrossRef]
- Dragicevic, T.; Guerrero, J.M.; Vasquez, J.C.; Skrlec, D. Supervisory Control of an Adaptive-Droop Regulated DC Microgrid With Battery Management Capability. IEEE Trans. Power Electron. 2014, 29, 695–706. [Google Scholar] [CrossRef]
- Locment, F.; Sechilariu, M. Modeling and Simulation of DC Microgrids for Electric Vehicle Charging Stations. Energies 2015, 8, 4335–4356. [Google Scholar] [CrossRef]
- Han, Y.; Chen, W.; Li, Q. Energy Management Strategy Based on Multiple Operating States for a Photovoltaic/Fuel Cell/Energy Storage DC Microgrid. Energies 2017, 10, 136. [Google Scholar] [CrossRef]
- Montoya, D.G.; Ramos-Paja, C.A.; Giral, R. Improved Design of Sliding-Mode Controllers Based on the Requirements of MPPT Techniques. IEEE Trans. Power Electron. 2016, 31, 235–247. [Google Scholar] [CrossRef]
- Serna-Garcés, S.I.; Montoya, D.G.; Ramos-Paja, C.A. Sliding-mode control of a charger/discharger DC/DC converter for DC-bus regulation in renewable power systems. Energies 2016, 9, 245. [Google Scholar] [CrossRef]
- Emadi, A.; Khaligh, A.; Rivetta, C.H.; Williamson, G.A. Constant power loads and negative impedance instability in automotive systems: Definition, modeling, stability, and control of power electronic converters and motor drives. IEEE Trans. Veh. Technol. 2006, 55, 1112–1125. [Google Scholar] [CrossRef]
- Huddy, S.R.; Skufca, J.D. Amplitude Death Solutions for Stabilization of DC Microgrids with Instantaneous Constant-Power Loads. IEEE Trans. Power Electron. 2013, 28, 247–253. [Google Scholar] [CrossRef]
- Herrera, L.; Zhang, W.; Wang, J. Stability Analysis and Controller Design of DC Microgrids with Constant Power Loads. IEEE Trans. Smart Grid 2015, 8. [Google Scholar] [CrossRef]
- Guo, L.; Zhang, S.; Li, X.; Li, Y.W.; Wang, C.; Feng, Y. Stability Analysis and Damping Enhancement Based on Frequency-Dependent Virtual Impedance for DC Microgrids. IEEE J. Emerg. Sel. Top. Power Electron. 2017, 5, 338–350. [Google Scholar] [CrossRef]
- Microgrids, V.s.c.b.D.C.; Gao, F.; Bozhko, S.; Costabeber, A.; Patel, C.; Wheeler, P.; Member, S.; Hill, C.I.; Asher, G. Comparative stability analysis of droop control approaches in voltage-source-converter-based DC microgrids. IEEE Trans. Power Electron. 2017, 32, 2395–2415. [Google Scholar]
- Zadeh, M.K.; Gavagsaz-Ghoachani, R.; Martin, J.P.; Pierfederici, S.; Nahid-Mobarakeh, B.; Molinas, M. Discrete-Time Tool for Stability Analysis of DC Power Electronics-Based Cascaded Systems. IEEE Trans. Power Electron. 2017, 32, 652–667. [Google Scholar] [CrossRef]
- Bastidas-Rodriguez, J.; Petrone, G.; Ramos-Paja, C.; Spagnuolo, G. A genetic algorithm for identifying the single diode model parameters of a photovoltaic panel. Math. Comput. Simul. 2017, 131, 38–54. [Google Scholar] [CrossRef]
- Li, J.; Danzer, M.A. Optimal charge control strategies for stationary photovoltaic battery systems. J. Power Sour. 2014, 258, 365–373. [Google Scholar] [CrossRef]
- NASA. NASA Surface Meteorology and Solar Energy: HOMER Data; NASA: Washington, DC, USA, 2018. [Google Scholar]
- CREG: Comisión de Regulación de Energía y Gas. Propuesta para Remunerar la Generación, Distribución y Comercialización de Energía Eléctrica en las ZNI; CREG: Comisión de Regulación de Energía y Gas: Bogota, Colombia, 2014. [Google Scholar]


| Parameters (STC) | Value |
|---|---|
| Open circuit voltage (Voc, STC) | 22.1 V |
| Short circuit current (Isc, STC) | 5 A |
| MPP voltage (, STC) | 18.0 V |
| MPP current (, STC) | 4.70 A |
| Voc temperature constant (Voc) | −0.088 V/°C |
| Isc temperature constant (Isc) | 0.047%/°C |
| Number of cells (Ns ) | 36 |
| Estimated Parameters (STC) | |
| Iph (A) | 5 |
| Isat (nA) | 2.808 |
| Ideality factor of diode () | 1.121 |
| Rs (Ω) | 0.227 |
| Rp (kΩ) | 2.029 |
© 2020 by the authors. Licensee MDPI, Basel, Switzerland. This article is an open access article distributed under the terms and conditions of the Creative Commons Attribution (CC BY) license (http://creativecommons.org/licenses/by/4.0/).
Share and Cite
Grisales-Noreña, L.F.; Ramos-Paja, C.A.; Gonzalez-Montoya, D.; Alcalá, G.; Hernandez-Escobedo, Q. Energy Management in PV Based Microgrids Designed for the Universidad Nacional de Colombia. Sustainability 2020, 12, 1219. https://doi.org/10.3390/su12031219
Grisales-Noreña LF, Ramos-Paja CA, Gonzalez-Montoya D, Alcalá G, Hernandez-Escobedo Q. Energy Management in PV Based Microgrids Designed for the Universidad Nacional de Colombia. Sustainability. 2020; 12(3):1219. https://doi.org/10.3390/su12031219
Chicago/Turabian StyleGrisales-Noreña, Luis Fernando, Carlos Andrés Ramos-Paja, Daniel Gonzalez-Montoya, Gerardo Alcalá, and Quetzalcoatl Hernandez-Escobedo. 2020. "Energy Management in PV Based Microgrids Designed for the Universidad Nacional de Colombia" Sustainability 12, no. 3: 1219. https://doi.org/10.3390/su12031219
APA StyleGrisales-Noreña, L. F., Ramos-Paja, C. A., Gonzalez-Montoya, D., Alcalá, G., & Hernandez-Escobedo, Q. (2020). Energy Management in PV Based Microgrids Designed for the Universidad Nacional de Colombia. Sustainability, 12(3), 1219. https://doi.org/10.3390/su12031219