Abstract
When hosting mega-events such as the Olympic games, increased visitation to nearby local attractions is expected to boost the local economy and sustain the host city’s brand. These spillover effects, as well as the spatial interaction among touristic attractions, are critical from the long-term and sustainable-planning perspectives. This study investigates tourists’ patterns of visitation to multiple destinations during the 2018 Winter Olympics and finds that attraction networks originated from three major cores, forming a strong northern sandy beach–south downtown connection. The domestic visitors’ network had significantly more diverse cores, implying that city branding may have been limited to domestic boundaries. Transportation modes had a significant impact, as public transportation and walking networks had more cores and were significantly denser. The staying period had no significant impact on the number of cores or on connection strengths—even the long-term visitors’ network had lower core values; however, that network was significantly denser, suggesting that a longer stay may not imply more destination visits. These findings suggest that hosting the Olympics may have enhanced the city’s international profile in only a limited fashion. Our findings provide the following practical implications. When planning Olympic spots, the host city’s government can consider strategically scattering infrastructure and facilities, rather than planning for a single spot. Well-organized and designed walking routes or public transportation systems can contribute to enhanced spillover effects versus car rental system developments.
1. Introduction
1.1. Spillover Effects of Mega-Events
Mega-events are generally expected to bring substantial benefits to host cities, including enhanced city branding [1,2,3,4], economic benefits [5,6,7], non-infrastructure benefits [2], and revenue from event ticket sales and tourism [8,9,10,11]. Among the event effects, profits accruing from tourism (stemming from an enhanced city image) constitute the most highly anticipated output from which local communities will benefit. In particular, besides direct ticket income deriving from the events themselves, increased tourist visitation to local attractions across the host city, such as places with scenic values, historical significance, and community identity, promise major benefits, as they can boost local businesses and sustain the city’s image. From the long-term and sustainable-planning perspectives, this kind of spillover effect from mega-events is important to the local communities of host cities.
The tourism spillover effect indicates that tourism to a specific attraction impacts other nearby attractions. This can be recognized as some type of spatial interaction among touristic attractions. The scale of study regarding the tourism spillover effect varies from “between cities” that are related to the regional tourism cooperation, or the network “between attractions” related to the multi-attraction network. There is an expectation that proximity or spatial groupings may make attractions more appealing to travelers who plan multiple destination trips [12,13].
To meet the geographical conditions that winter sports events need, small cities tend to be selected to host the Winter Olympics [14]. For these small cities comprising 200,000–300,000 people, retaining hosting benefits and returns on investment is critical to post-Olympics survival. Therefore, it is critical that the spillover effects to local business be measured, and that a strategy by which to sustain those benefits be crafted. This study is interested in the extent to which the spillover effects of mega-events proliferate spatially, and the significant factors that influence those effects (e.g., transportation mode and staying period). Such considerations may contribute to the preparation of a sustainable-planning strategy by which the local government can sustain the positive effects of hosting the Olympics; this could, in turn, provide helpful baseline data for use by potential host cities as they prepare for future Winter Olympics bidding and planning.
1.2. Attraction Compatibility and Multi-Attraction Visits
Lue, Crompton, and Fesenmaier [15] used the term “cumulative attraction” to indicate the relevance of touristic attractions that can influence a certain region. This concept was first studied in the retail context and then adopted in the tourism field. The core concept of cumulative attraction is related to compatibility and is concerned with the impact of a certain attraction on a proximate attraction: if two attractions affect each other positively, they are said to be compatible [16]. Hunt and Crompton [17] criticized the lack of efforts to collect information on attraction compatibility and complementarity, which can guide in employing cooperative rather than competitive strategies in attraction marketing.
Empirical studies have explored the association between spatial travel patterns and cumulative attraction theory, statistically proving that most trips include multiple destinations [15,18,19]. Building on these, subsequent studies examined the factors of tourist attraction compatibility, such as spatial proximity and product similarity [15,17,20,21].
Extending these precedent studies, this study also explored attraction compatibility and the relationship with spatial and type proximity, in particular utilizing a new analytic method and in a mega-event host city context. This study focused on multi-attraction visits during Olympic events—including to new Olympic venues and existing attractions—and potentially influential factors such as travel type, transportation mode, and staying period. This multi-attraction visit information could be useful for estimating the spatial spillover benefits, many of which may accrue from new Olympic attractions and spread over the city.
1.3. Demand-Oriented Evidence of Mega-Event Impact
In terms of the impact of mega-events, demand-oriented evidence is valuable, as it directly measures the responses and needs of users. Typically, from a tourism perspective, visitor behavior and visitation patterns around event venues are important indicators which measure the indirect impact of mega-events. Usually, a visitation pattern does not relate simply to a single attraction point. Conversely, they relate to multiple attractions [22,23,24,25,26,27]. Some Winter Olympics host cities (such as Turin) strategically planned Olympic venues and related infrastructure while using several derelict parts of the city; they anticipated area-wide revitalization based on the spreading effect of the event [1,9]. Anticipation concerning the spatial spillover effect can also be seen in government efforts to improve transportation connections. In addition to external connections (including express railways), internal connections are also improved through public transportation extensions (i.e., bus route and subway line extensions), new road development, and the installation of walking and biking paths, inter alia [14]. Therefore, among the various measurements of Olympic games’ spillover effects, the current study focuses on the spatial network context—in particular, those areas to which large amounts of investment were directed.
Often, small cities or rural towns that host Winter Olympics struggle, because the “pulling power” of local attractions is not sufficiently strong. In this context, the networking of several attractions can act as a counter-measure by which to maximize the power of these destinations and mitigate problems such as seasonal gaps and the differentiated needs of residents and tourists [22,23]. Recently, several studies [14,22,23,24,26,28,29,30,31,32] examined the visitation patterns of multiple destinations, the spatial networks among attractions, and the influential factors. Therefore, this research reveals the liaison potential among local attractions. Additionally, we could find only one study [29] that examined the form of the attraction network in relation to the impact of a mega-event, which may lead to preparing an effective strategy for the touristic attraction management after a mega-event.
1.4. Effects of Residences, Transportation Mode, and Staying Period
The underlying mechanisms that drive visitation patterns involving multiple destinations are formed within a so-called attraction network, and these have been studied in a limited manner [33,34,35]. In much of the tourism research, attraction visits have been found to associate with destination characteristics or travel settings, such as locations and proximity [14], attraction types [14,24], big-event time period [35], seasons and week periods [28,29,36], transportation modes [37,38], staying period [25], and the like. Other influential factors include characteristics relating to the tourists themselves, such as residence [22,23], visit experiences [22], and choice attitudes [30,31,35,39]. However, while much research has focused on the effects on individual attraction, few studies have examined the effects on the formation of attraction network patterns.
Among the potential factors affecting attraction networks, some factors are more closely associated with mega-event research. First, visitor residence constitutes an important factor that relates to mega-events [22,23]. During Olympic games, both foreign and domestic visitors comprise major consumer groups; thus, investigating the residence factor may help us understand whether prior knowledge of a local city affects attraction network formation—or, regardless of knowledge level, whether the event itself affects network formation. Such information would also be helpful in understanding whether the spillover effect is meaningful only for domestic consumers, or if it applies also to foreign visitors and would thus enhance city image internationally.
Second, transportation modes constitute another significant factor to be examined [37]. In most host cities, major changes and investments are made with regard to transportation option upgrades. Therefore, testing the significance of transportation mode in the formation of attraction networks would provide meaningful data by which to evaluate upgrades that occurred within the host city; it would also provide helpful baseline data by which to plan future connection needs and potential attraction networks.
Finally, examinations of the staying period are important to determining whether the event’s impact increases as people stay longer. Since Olympic games last roughly two to three weeks, it is good to determine whether longer-staying visitors go to surrounding local attractions while they are there, or if they simply stay longer to see more of the Olympic sports events. Kang et al. recently found that the length of stay significantly affects network density [25]. The current study examines these factors that could affect the attraction network while the Olympic event is occurring, when a large influx of visitors is expected.
2. Materials and Methods
2.1. Study Location and Data Collection
Gangneung is located on South Korea’s east coast, and the city is a famous summer vacation location on account of its seashore landscape, natural sandy beaches, and adjacent fishing villages (Figure 1). Figure 2 shows specific tourist attraction spots within the city, including a sandy beach distributed along the north–east seashore, the connected brackish water zone with natural lake and wetland, the historically significant residences of great scholars, traditional small villages, and local markets. The attractions were selected and filtered through the exploration of web-based information, which includes government websites and social media. Attractions allowing either free admission or a small fee, less than 5000 won, were selected. Most recently, Gangneung city hosted the Winter Olympics, and two important spatial changes were made to the city. The new Olympic Park that accommodated ice-sport games was constructed in the middle of the city; additionally, a new KTX express railway station was introduced in the south old downtown located between the new Olympic Park and the old downtown, and it features local markets and amenities.
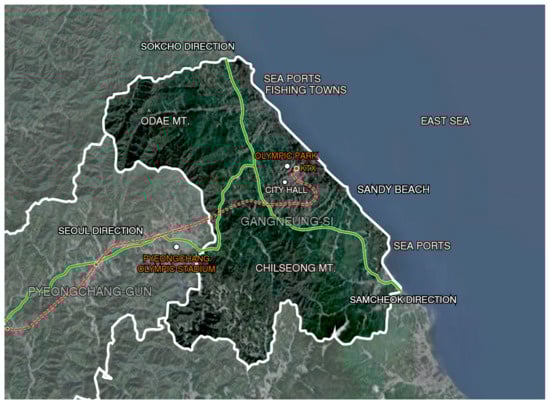
Figure 1.
The location of Gangneung, South Korea, which was the host city of the 2018 Winter Olympics.
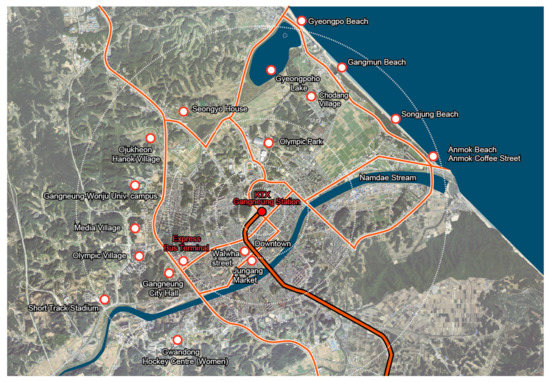
Figure 2.
The locations of selected city attractions, including the natural seashore landscape and other historically significant sites. Map source: www.daum.net.
To measure visitation patterns for multiple attractions, a map survey involving 19 attractions was executed by student researchers between February 9 and February 25, during the Olympic event period (Figure 2). The student surveyors participated in a training session and conducted a pilot survey. Survey participants were recruited at six different locations, including the KTX express railway station, the express bus terminal, the Olympic Park, Walwha Street, the great scholar housing site O-jukhun, and Kyungpo Beach. The survey dates were evenly distributed among weekday and weekend days. The participants were asked to mark all the attractions they had visited or planned to visit as well as the number of hours they stayed at each individual location. Besides the attractions they visited, the participants were additionally asked to specify their age, gender, residence, general perceptions about the impact of the Olympic games, transportation mode, and overall staying period. A convenient sidewalk sampling method was employed, and a total of 152 visitors participated in the survey.
The participants were reasonably balanced in terms of gender, with 53% and 47% being male and female, respectively. In terms of age, the predominant group was 20–39 years old (57%), followed by 40–59 years old (32%); the smallest groups were those less than 20 years old (1%) and more than 70 years old (10%). In terms of residence, domestic and foreign visitors were quite evenly balanced, with 44% and 56% of visitors being domestic and foreign, respectively. The most frequently used transportation option was public transportation and walking (36%), followed by car and taxi (28%); another 36% opted for a mix of modes. Finally, the staying period was divided into two major groups: one or two nights (42%) and three or more nights (47%). The data captured through the survey are presented in Table 1. Survey participants are not based on a stratified sampling, but a convenient sidewalk sampling method. This is due to the impossibility of data acquisition and the given survey period. Although surveyors attempt to perform random samplings based on regular visits to multiple sites, the limitations from the lack of representativeness of the tourist population should be considered.

Table 1.
Descriptive statistics of survey participants.
2.2. Network Analysis
The recent tourist attraction literature features a new methodological approach. Exemplary studies utilize data collection and analysis techniques such as Bluetooth tracking [39], geo-tagged social media, geo-tagged photos, and blog-text mining [32,40,41,42]. There is burgeoning use of social network analysis in various social science fields, and it is often used in “big data” analysis that focuses on relationships [43]. Unlike conventional data analysis—which focuses on the actors and their attributes—network analysis focuses on the actors and their relationships. In network analysis, the main variables are explained by their relationships, not by their attributes. In other words, network analysts are more interested in the structure of connections, where either actors or variables are embedded rather than the attributes of a strong ego. The results of network analysis are usually described based on nodes (actors) and edges (connections) [44,45].
Since this study aims to reveal whether Olympic venue visitors also visit other attractions (the spillover effect), identifying co-visitation patterns is important. Network analysis can be a useful tool. For example, co-visitation patterns can be replaced and quantified by weighed attraction ties or relationships. The term attraction network, indicates a web-like structure where each attraction, as a node, and each relationship between two attractions, as an edge, are embedded. For this study, network analysis was leveraged to identify the attraction network aroused by the Olympics, which ultimately reveals the existence of a spillover effect.
In the first phase of network analysis, the core values of each node (indicating each local attraction) and connecting edge strengths (indicating the degree of relationships among attractions) in the attraction networks were estimated using a network analysis package in R. For data preparation, to compare the paired network, the same sample number (i.e., observations) for each network was set using random sampling code in R. Subsequently, the raw data matrix based on a two-mode matrix was transformed into a one-mode data matrix. Based on the one-mode data, the eigenvector centrality of each node and the weights of the connecting edges were calculated.
In the second phase, to investigate the influential factors on attraction networks, six different networks were compared using Network Comparison Test (NCT). NCT is an effective means of identifying whether there are significant differences between two different types of networks featuring the same nodes (e.g., patterns of visitation to multiple attractions, either with different transportation options or a different length of staying period). Using the UCINET program, a bootstrap paired sampled t-test was conducted to determine whether there was a significant difference between the two paired network datasets. All statistical significance values were tested at the 95% level, and the number of bootstrapping permutations was set to 10,000.
3. Results
3.1. Comparisons of Centrality and Connecting Strength among Three Pairs of Networks
The major results of the network analysis are presented based on the centrality of actors or nodes. For example, some actors or nodes (local attractions) can be considered more important than others, and the degree of relative importance can be quantitatively measured. Eigenvector centrality is one of the measures and is applied under the assumption that connections to high-score nodes influence centrality scores more than low-score nodes.
Table 2 presents the eigenvector centralities for six networks. In the domestic visitors’ network, the highest centrality group (>0.7) included Olympic Park (1.00), Kyungpo Beach (0.93), and downtown (0.79). Five attractions received centralities exceeding 0.5; these included Anmok Beach (0.62) and Kyungpo Lake (0.68). In the foreign visitors’ network, the highest centrality was given to Olympic Park (1.00), followed by downtown (0.83). Three attractions received centralities exceeding 0.5; these included Gangmun Beach (0.60). Figure 3a,b indicates that while the domestic visitors’ network has more cores (i.e., colored nodes) and complex connections (i.e., yellow lines), the foreign visitors’ network has fewer cores and rather simple connections that center on two cores—namely, the Olympic Park and the downtown area where the KTX railway station is located.
Table 2.
Descriptive statistics of three pairs of tourist attraction networks.
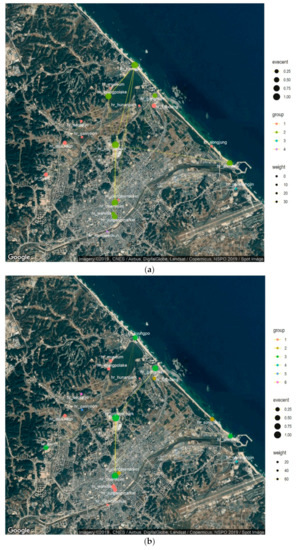
Figure 3.
(a) Attraction network of domestic visitors. Different node colors indicate different group members (based on cluster analysis); the node size depends on the eigenvalue degree centrality. The width and transparency of the edges depend on weights (i.e., strength of connections); (b) Attraction network of foreign visitors.
For the car and taxi users’ network, Olympic Park received the highest centrality (1.00), followed by Kyungpo Beach (0.96), downtown (0.91), Anmok Beach (0.82), Jungang Market (0.78), and Kyungpo Lake (0.76). This highest-centralities group included six attractions with values exceeding 0.7; in total, eight attractions received values exceeding 0.5. In the public transportation users and walking visitors’ network, the highest-centralities group included Kyungpo Beach (1.00), Jungang Market (0.91), downtown (0.86), Olympic Park (0.85), Kyungpo Lake (0.76), Anmok Beach (0.75), and Walwha Street (0.73). Seven attractions had values exceeding 0.7, and 14 attractions had values exceeding 0.5. In line with the centrality results, Figure 4a,b indicates that, compared to the car and taxi users’ network, the network of public transportation users and walking visitors had more cores, leading to more complex connections. In particular, certain local amenities—such as traditional markets and a commercial street in the downtown area, as well as museums and historical sites along the Kyungpo Lake trail—emerged as hotspots. Accordingly, stronger connections among these attractions can be seen on the map.
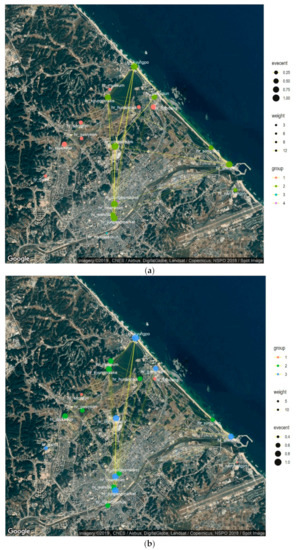
Figure 4.
(a) Attraction network of car and taxi users. Different node colors indicate different group members (based on cluster analysis); the node size depends on the eigenvalue degree centrality. The width and transparency of the edges depend on weights (i.e., strength of connections); (b) Attraction network of public bus users and walking visitors.
In the short-term visitors’ network, Olympic Park received the highest value (1.00), followed by Kyungpo Beach (0.86) and downtown (0.85); five attractions received values exceeding 0.5. In the long-term visitors’ network, Olympic Park received the highest value (1.00), followed by downtown (0.79), Kyungpo Beach (0.79), and Gangmun Beach (0.73); again, five attractions received values exceeding 0.5. In line with the centrality results, Figure 5a,b indicates that the two networks do not appear to be significantly different. Compared to the short-term visitors’ network, however, the long-term visitors’ network showed even lower centralities for the majority of attractions.
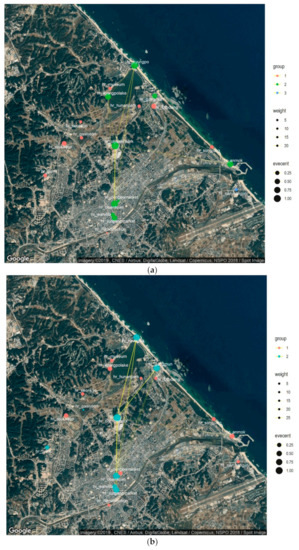
Figure 5.
(a) Attraction network of visitors for one or two nights. Different node colors indicate different group members (based on cluster analysis); the node size depends on the eigenvalue degree centrality. The width and transparency of the edges depend on weights (i.e., strength of connections); (b) Attraction network of visitors for three or more nights.
3.2. Quadratic Assignment Procedure and Network Density Comparison
In addition to visitor characteristics (e.g., residence) and travel settings (e.g., transportation modes and staying period), various destination factors (e.g., geographical proximity and program similarity) can also affect visitation patterns. Thus, the current study examined the relationship between destination factors and attraction networks, and conducted a quadratic assignment procedure (QAP). QAP is a useful approach by which to test hypotheses regarding the relationships among multiple networks [34]. The six previously analyzed attractions were set as dependent variables, and location proximity and type proximity were set as independent variables. As in a traditional regression analysis, QAP calculates the influence significance of independent variables on the dependent variables; it also generates a pseudo-R2 that is analogous to the R2 in an ordinary least squares (OLS) regression.
Table 3 shows the regression results, including the standardized coefficients of the independent variables and the R2 of the QAP regression models. For the six models, none of the adjusted R2 values—which range from 0.001 to 0.005—were significant; this indicates that only 0.13–0.15% of the variance in the tourist attraction network can be explained by adjacency and program similarity. Therefore, neither variable is considered a significant factor in determining the attraction networks. As Table 3 reports, none of the coefficients for regional proximity among the networks were significant. These results suggest that adjacency between attractions does not significantly affect the attraction network. Additionally, the coefficients for type proximity were not significant for any of the networks; these results suggest that program similarity between attractions also has no significant effect on the attraction network. These results indicate that Olympics visitors to Gangneung tended not to visit attractions geographically adjacent to each other, or those themed with similar content.
Table 3.
Results of quadratic assignment procedure (QAP) regression.
Table 4 shows the network density comparison results. While the regression analysis reveals associations, this network density comparison focuses on differences between the two networks; in this respect it is similar to a classical paired sample t-test. A comparison of network density facilitates statistical comparisons of the densities of two networks featuring the same nodes. This comparison made by using the bootstrap method calculates the estimated standard errors to test the significance of differences. In the current study, since both relationships are weighted, a significant difference was found in the mean tie strengths of the two relations. In this study, the three pairs were tested based on residence, transportation mode, and length of stay.
Table 4.
Comparisons of network density.
For bootstrapping, 5000 subsamples were randomly generated. The differences between the mean density values range from 0.4678 to 2.9064; meanwhile, the standard errors of the difference with the classical method range from 0.3322 to 0.7161, while those with the bootstrap estimates range from 0.8798 to 1.9527. As the output indicates, overall, the conventional approach greatly underestimates the true sampling variability and generates a result that is overly optimistic in rejecting the null hypothesis (i.e., that the two densities are identical). The results derived through bootstrapping indicate that while network comparisons of transportation mode and staying period indicated significant differences in network density, those of residence indicate no significant difference. There are two-tailed probabilities of 0.2609 (residence), 0.0083 (transportation option), and 0.0086 (staying period). Thus, the results reveal with great confidence, for instance, that the density of attraction ties in the case of public transportation users or walking visitors is greater than that in the case of car and taxi users. Additionally, the density of attraction ties in the case of long-term visitors is greater than that in the case of short-term visitors—that is, in random samples drawn from these networks, the observed differences would only very rarely arise by chance.
4. Discussion and Conclusions
Although the overall cost of mega-event hosting is enormous, it is generally expected to accompany indirect benefits including international city branding, local business boosting, and life quality enhancement of the local community. However, short-term-based development also involves complicated issues such as reproduction of spatial inequalities, increase of social gaps, and inability to sustain good impact.
From a tourism perspective, this study investigated whether there was a benefit distribution. For example, tourists flowing around event spots effectively spread to other parts of cities, which mitigates the concern of unequally distributed benefits based on a focused development with a few cores. Regarding tourism sustainability in small cities, this study can contribute to explaining some of the favorable aspects of spillover impacts from mega-events. This helps to sustain host city tourism through branding local community-owned businesses.
This study quantitatively measured the connections among local attractions and Olympics event spots by examining tourist movements (i.e., patterns of visitation to multiple destinations) during the event period. The results showed a diverse network pattern that originated from three major cores—namely, the Olympic Park, the express railway station, and Kyungpo Beach—and that this pattern formed a strong northern sandy beach–southern downtown connection. This overall finding implies that the spillover effects were somewhat more limited than initially expected, and that they were concentrated on the arrival point and the event location.
Investigations into the factors that affected the networks revealed that visitor residence influences the formation of attraction networks, with the domestic visitors’ network having more diverse cores (including the downtown area and historically significant spots) than that of foreign visitors. This result showed the opposite of the study by Caldeira and Kastenboltz [22], where visitors from further distances were revealed to more actively seek diverse experiences [13]. This may be because visitors in this study were more purposeful with watching the Olympic games. However, the results correspond with the study by García-Palomares et al. [23]. While tourists’ travel photographs showed higher spatial concentrations on a few hot spots, residents’ photographs showed very scattered distributions on many hot spots [23]. This study’s findings can likely be attributed to domestic visitors’ prior knowledge of the area, and this in turn implies that overall city branding enhancements and boosts to the local tourism industry may have been limited to domestic boundaries. In short, hosting the Olympics may have enhanced the city’s international profile in only a limited fashion. In terms of network density, however, there were no significant differences between the domestic and foreign visitors’ networks. This may have been because the networks were weighted by specific staying hours, and this in turn suggests that foreign visitors stay for longer hours in a few spots, rather than move around.
Transportation mode also had a significant impact on attraction network, in that the network of public transportation users and walking visitors had more diverse cores and was significantly denser. In particular, the additional cores were found to be located along lakefront trails and the downtown area close to the railway station, a major arrival point. This suggests that well-organized and designed walking routes or public transportation systems can contribute to enhanced spillover effects vis-à-vis mega-events such as, for example, car rental system development. Such assertions, however, should be conditionally understood in the context of a specific city (e.g., a small-sized city like Gangneung).
Along with the transportation mode results, QAP results revealed that program similarity had no impact on the attraction network. This finding confirms previous study results that suggest that visitors prefer destinations with some variety [32,46], where the type of proximity was not a significant factor in determining the attraction network; this in turn suggests that, in terms of enhancing beneficial spillover effects, it may be effective to vary the themes and content of public transportation drop-off attractions.
The results pertaining to the staying period indicate that a longer stay has no significant impact on the increase of the number of cores and connection strengths, as even the long-term network tended to have lower core values; however, that network was significantly denser. These findings suggest that the staying period may not lead to visitors stopping at more destinations, but rather an increase in staying time at fewer attractions. A precedent study by Kang et al. [25] revealed that travel patterns can be differentiated according to the length of stay. For example, short- and long-stay tourists travelled more widely than medium-stay tourists. Our study corresponds with this study regarding the significance of the staying period. However, how it influences travel patterns, such as cores, connecting strengths, and overall network density, must be considered within other contexts (i.e., travel purpose and city size). For this study, visitors who stayed longer seemed to spend most of their time watching Olympic sporting events rather than experience the host city’s amenities; this implies the need to establish Olympics-related program operations at a diversity of locations and to enhance appropriate information provision at event hosting.
The overall results suggest practical implications with regard to future Olympics-related infrastructure planning among host cities. When planning Olympic spots, the host city’s government can consider strategically scattered infrastructure and facilities, rather than plan a single spot. While it seems that the Gangneung city government was wise to plan an express railway station near the city center, for example, it should have more carefully planned walking routes and public transportation from the railway station to the Olympic Park. Additionally, to enhance international city branding, it should have provided more information and encouraged foreign visitors to take advantage of numerous local amenities.
Author Contributions
Concerning author contributions, the authors contributed entirely to the intellectual content of this paper: E.-J.K. designed the study, was responsible for all statistical analyses, and wrote the manuscript. Y.K. designed the study, investigated methodology, and revised the manuscript. All authors have read and agreed to the published version of the manuscript.
Funding
This research was supported by a basic research program through the National Research Foundation of Korea (NRF), funded by the Ministry of Education (Grant No. 2017R1D1A 3B03034571).
Acknowledgments
Special thanks go to Yongjun Jo, who contributed substantially to the development of the research idea.
Conflicts of Interest
The authors declare no conflict of interest.
References
- Vanolo, A. The image of the creative city: Some reflections on urban branding in Turin. Cities 2008, 25, 370–382. [Google Scholar] [CrossRef]
- Gratton, C.; Preuss, H. Maximizing Olympic impacts by building up legacies. Int. J. Hist. Sport 2008, 25, 1922–1938. [Google Scholar] [CrossRef]
- Zhang, L.; Zhao, S.X. City branding and the Olympic effect: A case study of Beijing. Cities 2009, 26, 245–254. [Google Scholar] [CrossRef]
- Chappelet, J.L.; Lee, K.H. The emerging concept of sport-event-hosting strategy: Definition and comparison. J. Glob. Sport Manag. 2016, 1, 34–48. [Google Scholar] [CrossRef]
- Kasimati, E.; Dawson, P. Assessing the impact of the 2004 Olympic Games on the Greek economy: A small macroeconometric model. Econ. Model. 2009, 26, 139–146. [Google Scholar] [CrossRef]
- Miyoshi, K.; Sasaki, M. The long-term impacts of the 1998 Nagano Winter Olympic Games on economic and labor market outcomes. Asian Econ. Policy Rev. 2016, 11, 43–65. [Google Scholar] [CrossRef]
- Müller, M. After Sochi 2014: Costs and impacts of Russia’s Olympic Games. Eurasian Geogr. Econ. 2014, 55, 628–655. [Google Scholar] [CrossRef]
- Neirotti, L.D. Impact of Olympic Spectator Satisfaction and Behavioral Intention on Post-Olympic Tourism and Brand Legacies. In Proceedings of the 8th International Sport Business Symposium, Rio de Janeiro, Brazil, 16 August 2016; p. 39. [Google Scholar]
- Bottero, M.; Sacerdotti, S.L.; Mauro, S. Turin 2006 Olympic Winter Games: Impacts and legacies from a tourism perspective. J. Tour. Cult. Change 2012, 10, 202–217. [Google Scholar] [CrossRef]
- Rocha, C.M.; Fink, J.S. Attitudes toward attending the 2016 Olympic Games and visiting Brazil after the games. Tour. Manag. Perspect. 2017, 22, 17–26. [Google Scholar] [CrossRef]
- Vanolo, A. The image of the creative city, eight years later: Turin, urban branding and the economic crisis taboo. Cities 2015, 46, 1–7. [Google Scholar] [CrossRef]
- Yang, Y.; Wong, K.K. A spatial econometric approach to model spillover effects in tourism flows. J. Travel Res. 2012, 51, 768–778. [Google Scholar] [CrossRef]
- Balli, F.; Curry, J.; Balli, H.O. Inter-regional spillover effects in New Zealand international tourism demand. Tour. Geogr. 2015, 17, 262–278. [Google Scholar] [CrossRef]
- Kim. Foreign Case Studies for Post-Management of Olympic Related Public Infrastructure in Gangneung; Local reports. Gangneung-Wonju University: Gangneung, Korea, 2018. [Google Scholar]
- Lue, C.C.; Crompton, J.L.; Fesenmaier, D.R. Conceptualization of multi-destination pleasure trips. Ann. Tour. Res. 1993, 20, 289–301. [Google Scholar] [CrossRef]
- Nelson, R.L. The Selection of Retail Location; R.W. Dodge Corporation: New York, NY, USA, 1958. [Google Scholar]
- Hunt, M.A.; Crompton, J.L. Investigating attraction compatibility in an East Texas City. Int. J. Tour. Res. 2008, 10, 237–246. [Google Scholar] [CrossRef]
- Wall, G. Competition and complementarity: A study in park visitation. Int. J. Environ. Stud. 1978, 13, 35–41. [Google Scholar] [CrossRef]
- Oppermann, M. A model of travel itineraries. J. Travel Res. 1995, 33, 57–61. [Google Scholar] [CrossRef]
- Weidenfeld, A.; Butler, R.W.; Williams, A.M. Clustering and compatibility between tourism attractions. Int. J. Tour. Res. 2010, 12, 1–16. [Google Scholar] [CrossRef]
- Fyall, A.; Leask, A.; Garrod, B. Scottish visitor attractions: A collaborative future? Int. J. Tour. Res. 2001, 3, 211–228. [Google Scholar] [CrossRef]
- Caldeira, A.M.; Kastenholz, E. Spatiotemporal behaviour of the urban multi-attraction tourist: Does distance travelled from country of origin make a difference? Tour. Manag. Stud. 2015, 11, 91–97. [Google Scholar]
- García-Palomares, J.C.; Gutiérrez, J.; Mínguez, C. Identification of tourist hot spots based on social networks: A comparative analysis of European metropolises using photo-sharing services and GIS. Appl. Geogr. 2015, 63, 408–417. [Google Scholar] [CrossRef]
- Jurowski, C.; Combrink, M.S.; Cothran, C. Measuring probabilities in attraction visitation. In Proceedings of the 2007 TTRA International Conference: Tourism Travel and Research Association: Advancing Tourism Research Globally, Amherst, MA, USA, 17–19 June 2016; Available online: https://scholarworks.umass.edu/cgi/viewcontent.cgi?article=1354&context=ttra (accessed on 6 February 2020).
- Kang, S.; Lee, G.; Kim, J.; Park, D. Identifying the spatial structure of the tourist attraction system in South Korea using GIS and network analysis: An application of anchor-point theory. J. Destin. Mark. Manag. 2018, 9, 358–370. [Google Scholar] [CrossRef]
- Lee, S.H.; Choi, J.Y.; Yoo, S.H.; Oh, Y.G. Evaluating spatial centrality for integrated tourism management in rural areas using GIS and network analysis. Tour. Manag. 2013, 34, 14–24. [Google Scholar] [CrossRef]
- Miah, S.J.; Vu, H.Q.; Gammack, J.; McGrath, M. A big data analytics method for tourist behaviour analysis. Inf. Manag. 2017, 54, 771–785. [Google Scholar] [CrossRef]
- Hui, T.K.; Yuen, C.C. A study in the seasonal variation of Japanese tourist arrivals in Singapore. Tour. Manag. 2002, 23, 127–131. [Google Scholar] [CrossRef]
- Butler, R.W. Seasonality in tourism: Issues and implications. Tour. Rev. 2001, 53, 18–24. [Google Scholar] [CrossRef]
- Mutinda, R.; Mayaka, M. Application of destination choice model: Factors influencing domestic tourists’ destination choice among residents of Nairobi, Kenya. Tour. Manag. 2012, 33, 1593–1597. [Google Scholar] [CrossRef]
- Lepp, A.; Gibson, H. Sensation seeking and tourism: Tourist role, perception of risk and destination choice. Tour. Manag. 2008, 29, 740–750. [Google Scholar] [CrossRef]
- Yuan, H.; Xu, H.; Qian, Y.; Li, Y. Make your travel smarter: Summarizing urban tourism information from massive blog data. Int. J. Inf. Manag. 2016, 36, 1306–1319. [Google Scholar] [CrossRef]
- Shih, H.Y. Network characteristics of drive tourism destinations: An application of network analysis in tourism. Tour. Manag. 2006, 27, 1029–1039. [Google Scholar] [CrossRef]
- Liu, B.; Huang, S.S.; Fu, H. An application of network analysis on tourist attractions: The case of Xinjiang, China. Tour. Manag. 2017, 58, 132–141. [Google Scholar] [CrossRef]
- Leung, X.Y.; Wu, B.; Xie, F.; Xie, Z.; Bai, B. Overseas Tourist Movement Patterns in Beijing: The Impact of the Olympic Games Tour. Travel Res. Assoc. 2016. Available online: https://scholarworks.umass.edu/cgi/viewcontent.cgi?article=1573&context=ttra (accessed on 6 February 2020).
- Song, H.; Li, G.; Witt, S.F.; Athanasopoulos, G. Forecasting tourist arrivals using time-varying parameter structural time series models. Int. J. Forecast. 2011, 27, 855–869. [Google Scholar] [CrossRef]
- Decrop, A. Destination choice sets: An inductive longitudinal approach. Ann. Tour. Res. 2010, 37, 93–115. [Google Scholar] [CrossRef]
- Karl, M.; Reintinger, C.; Schmude, J. Reject or select: Mapping destination choice. Ann. Tour. Res. 2015, 54, 48–64. [Google Scholar] [CrossRef]
- Versichele, M.; De Groote, L.; Bouuaert, M.C.; Neutens, T.; Moerman, I.; Van de Weghe, N. Pattern mining in tourist attraction visits through association rule learning on Bluetooth tracking data: A case study of Ghent, Belgium. Tour. Manag. 2014, 44, 67–81. [Google Scholar] [CrossRef]
- Chua, A.; Servillo, L.; Marcheggiani, E.; Moere, A.V. Mapping Cilento: Using geotagged social media data to characterize tourist flows in southern Italy. Tour. Manag. 2016, 57, 295–310. [Google Scholar] [CrossRef]
- Hu, Y.; Gao, S.; Janowicz, K.; Yu, B.; Li, W.; Prasad, S. Extracting and understanding urban areas of interest using geotagged photos. Comput. Environ. Urban Syst. 2015, 54, 240–254. [Google Scholar] [CrossRef]
- Vu, H.Q.; Li, G.; Law, R.; Ye, B.H. Exploring the travel behaviors of inbound tourists to Hong Kong using geotagged photos. Tour. Manag. 2015, 46, 222–232. [Google Scholar] [CrossRef]
- Hanneman, R.A.; Riddle, M. Introduction to Social Network Methods; University of California Riverside: Riverside, CA, USA, 2005; Available online: https://faculty.ucr.edu/~hanneman/nettext/Introduction_to_Social_Network_Methods.pdf (accessed on 6 February 2020).
- Granovetter, M. American journal of sociology. The strength of Weak Ties. 1973. Available online: https://sociology.stanford.edu/sites/g/files/sbiybj9501/f/publications/the_strength_of_weak_ties_and_exch_w-gans.pdf (accessed on 6 February 2020).
- Czernek-Marszałek, K. Cooperation evaluation with the use of network analysis. Ann. Tour. Res. 2018, 72, 126–139. [Google Scholar] [CrossRef]
- Kim, E.J.; Jo, Y.; Kang, Y. Are Touristic Attractions Well-Connected in an Olympic Host City? A Network Analysis Measurement of Visitor Movement Patterns in Gangneung, South Korea. Sustainability 2018, 10, 3310. [Google Scholar] [CrossRef]


© 2020 by the authors. Licensee MDPI, Basel, Switzerland. This article is an open access article distributed under the terms and conditions of the Creative Commons Attribution (CC BY) license (http://creativecommons.org/licenses/by/4.0/).