1. Introduction
The 2030 Agenda for Sustainable Development of the United Nations (UN) includes in its Sustainable Development Goal (SDG) 8.5 “… to achieve full and productive employment and decent work for all women and men, including for young people and persons with disabilities (PWD), and equal pay for work of equal value” [
1] (p. 22). For their part, the Entities of the Social and Solidarity Economy (SSE), by their very nature, are presumed to be more sensitive in the labour insertion of groups in danger of social exclusion than are the Capitalist companies (CC). In Spain, the term of Social Economy (SE), the principles that guide it and the entities that comprise it are defined in Articles 2, 4 and 5 of Law 5/2011 [
2]. This law represented an unprecedented turning point in Spain for the recognition, visibility and development of the sector. Although the term used to refer to it is SE, as one of its guiding principles is the promotion of internal solidarity and with society, the concept of SSE is currently being coined and extended more widely, especially among some international organizations such as the United Nations, in particular the United Nations Research Institute for Social Development (UNRISD) [
3]. For this reason, SSE is the term to be used in this paper. Therefore, it is expected that the SSE entities include among their staff a greater number of people with socio-labour characteristics which the ordinary labour market discriminates negatively against (young people, women, people with lower levels of education and/or degree of qualification, PWD, among others).
In this context, the objective of this research focuses on the analysis of socio-labour characteristics, wage differences, the degree of dispersion and inequality in the distribution of income from work among the group of persons with disabilities in the SSE compared to the CC. The geographical scope of the study focuses on Spain during the last decade (2007–2016), which allows us to see what has happened during the last two phases of the economic cycle: the Great Recession (2007–2013) and the beginning of the Current Economic Recovery (2013–2016).
The inclusion in the labour market of PWD vs. persons without disabilities (PWOD), as well as the wage differences between the two groups (inter-groups), have been widely approached in the literature [
4,
5,
6,
7,
8,
9,
10]. In the same way, the specialised literature on the SSE [
11,
12,
13,
14,
15,
16], theoretically justifies the greater sensitivity of these type of entities than the CC in the socio-labour inclusion of vulnerable groups, such as PWD, but there is an almost total absence of studies that provide empirical evidence of this differential role of the SSE concerning the CC [
17,
18] and, specifically, concerning PWD (intra-group) on one type of entity or another [
19]. Authors such as Dwertmann and Boehm [
20], Baumgärtner et al [
21] and Dwertmann [
22] highlight the need to increase the number of scientific investigations that provide empirical evidence on PWD.
The present work contributes to the literature in four dimensions. First, it provides empirical evidence of the greater sensitivity of the SSE in the inclusion in the labour market of PWD, compared to the CC, which authors such as Barea, Monzón and Chaves [
11,
12,
14,
15] point out at a theoretical level. In this sense, Dwertmann [
22] argues that a possible solution to the challenges facing by research on disability could be solved by focusing on analysing sheltered employment companies, assuming that they have this special sensitivity.
Second, unlike the previous literature on wages of PWD, which focused on analysing the wage gap between PWD and PWOD (intergroup gap), our contribution is to analyse the wage gap within the PWD group (intra-group gap). Specifically, following the recommendations of Dwertmann [
22], we analysed the wage gap between workers with disabilities in the SSE and those hired by the CC, reducing the problem of heterogeneity.
Third, an analysis of the previous literature shows that there are very few studies that provide empirical evidence on the degree of inequality in the distribution of wage income [
23,
24,
25,
26,
27]. In this sense, our study fills this gap, being a pioneer in providing empirical evidence on the unequal distribution of wage income in the group of workers with disabilities in SSE and CC.
Fourth, it is also the first longitudinal analysis that shows the evolution of both the sensitivity of the labour inclusion of PWD in the SSE compared to the CC, as well as the wage differences and the inequality in the distribution of these incomes, during the last two phases of the economic cycle: the Great Recession and the beginning of the Current Economic Recovery. Concerning income distribution, the 2030 Agenda for Sustainable Development of the United Nations includes in its Sustainable Development Goal (SDG) 10 “Reduce inequality within and among countries” [
1] (p. 21) in particular Target 10.3 related to reducing inequalities of outcome.
The source of the fundamental information used in this research is the Continuous Sample of Working Histories (MCVL, in Spanish) prepared by the Spanish Social Security and the Tax Agency. The exploitation of their microdata allows the analysis of socio-labour characteristics and salaries of different groups by providing information on the work trajectories of more than one million individuals. This database has the advantage of allowing individuals who work in the SSE and CC entities to be analysed in a differentiated way. Given the breadth of years for which information is available, it allows us to cover the situation in different phases of the economic cycle (2007–2016). Additionally, observing the evolutionary path recently followed, we can intuit the viability of fulfilling some of the SDG of the 2030 Agenda.
In the study two hypotheses are raised: on the one hand, the greater sensitivity of the SSE entities than the CC in labour inclusion of the PWD; and, on the other hand, that SSE entities create a better distribution of salary income for the PWD collective, although salaries in these entities are lower than in the CC.
In order to test the first hypothesis, a comparative descriptive analysis of the main socio-labour characteristics (personal, type of contract and type of company) of the employment of PWD in the two types of entities (SSE and CC) is performed. As for the second hypothesis, a comparative descriptive analysis of wages, their distribution and dispersion, for PWD among the two types of entities is performed.
The methodology used to carry out the comparative analysis of the main socio-economic characteristics of the employment of PWD consists of the creation of contingency tables which show the percentage structure of each characteristic between the SSE entities and the CC and to see if there are statistically significant differences in that profile. For the measurement of the wage dispersion and the distribution of wage income, typical inequality measures are used such as the distribution by percentiles and the Gini index.
In order to achieve the proposed objectives, the research is structured as shown below. First, the theoretical framework is developed. Later, the methodology is shown. Then, the results are presented, which are subsequently discussed to show the conclusions in the final section and mark economic policy recommendations which allow us to meet some of the goals set out in the 2030 Agenda for Sustainable Development.
2. Theoretical Approach
PWD represent a growing percentage of the Spanish population which, also, is constantly increasing due to the increase in life expectancy and the degree of ageing of the population. In this research, PWD are considered those "persons who have a recognized degree of disability -by the Social Security System- for having got diminished their physical, psychic or sensorial capacities, or for suffering from a chronic illness, in degree equal or superior to 33%" [
28] (p. 48). According to the Disabilities Survey (EDAD, in Spanish) [
29], in 2008, PWD represented 8.5 per cent of resident persons in Spain and according to the Social Integration and Health Survey by the INE, in 2012, PWD represented 16.7 per cent of persons aged 15 and over [
30] (since 2012, no new data have been published in Spain about the number of PWD as a percentage of the total population. However, since 2008, the number of PWD in working age has been published in The Employment of Persons with Disabilities by the Spanish Statistical Office (INE) [
31]).
Specialised literature [
7,
9,
32] considers it essential to support the independence and personal autonomy of PWD in all areas of their daily lives, with equal opportunities and non-discrimination from the rest of society. However, the performance of paid work is considered one of the most effective tools in achieving personal autonomy and full social integration of the collective, as reflected in the pioneer and today repealed Law 13/1982 on the social integration of Disabled [
33]. These values and principles are shared by the entities that make up the SSE [
12,
34,
35,
36], so the SSE are presumed to have greater sensitivity in the social inclusion of people in danger of social exclusion, among whom are the PWD, and that to a greater extent than the CC to people with socio-labour characteristics against which, the ordinary labour market (CC) discriminates negatively (women, young people, low qualification, high degree of disability, among others) [
14,
37,
38]. In fact, the current regulatory regulations of the PWD, which replaces the repealed Law of 13/1982,—the Royal Legislative Decree 1/2013, in its Articles 27 and 39 recognizes the role of the SSE in the generation of employment of the PWD. For its part, the Law of Social Economy 5/2011, lists in its Article 4 the guiding principles of the Social Economy Entities, among which, for our purpose, the insertion of people at risk of social exclusion and the generation of stable and quality employment [
39].
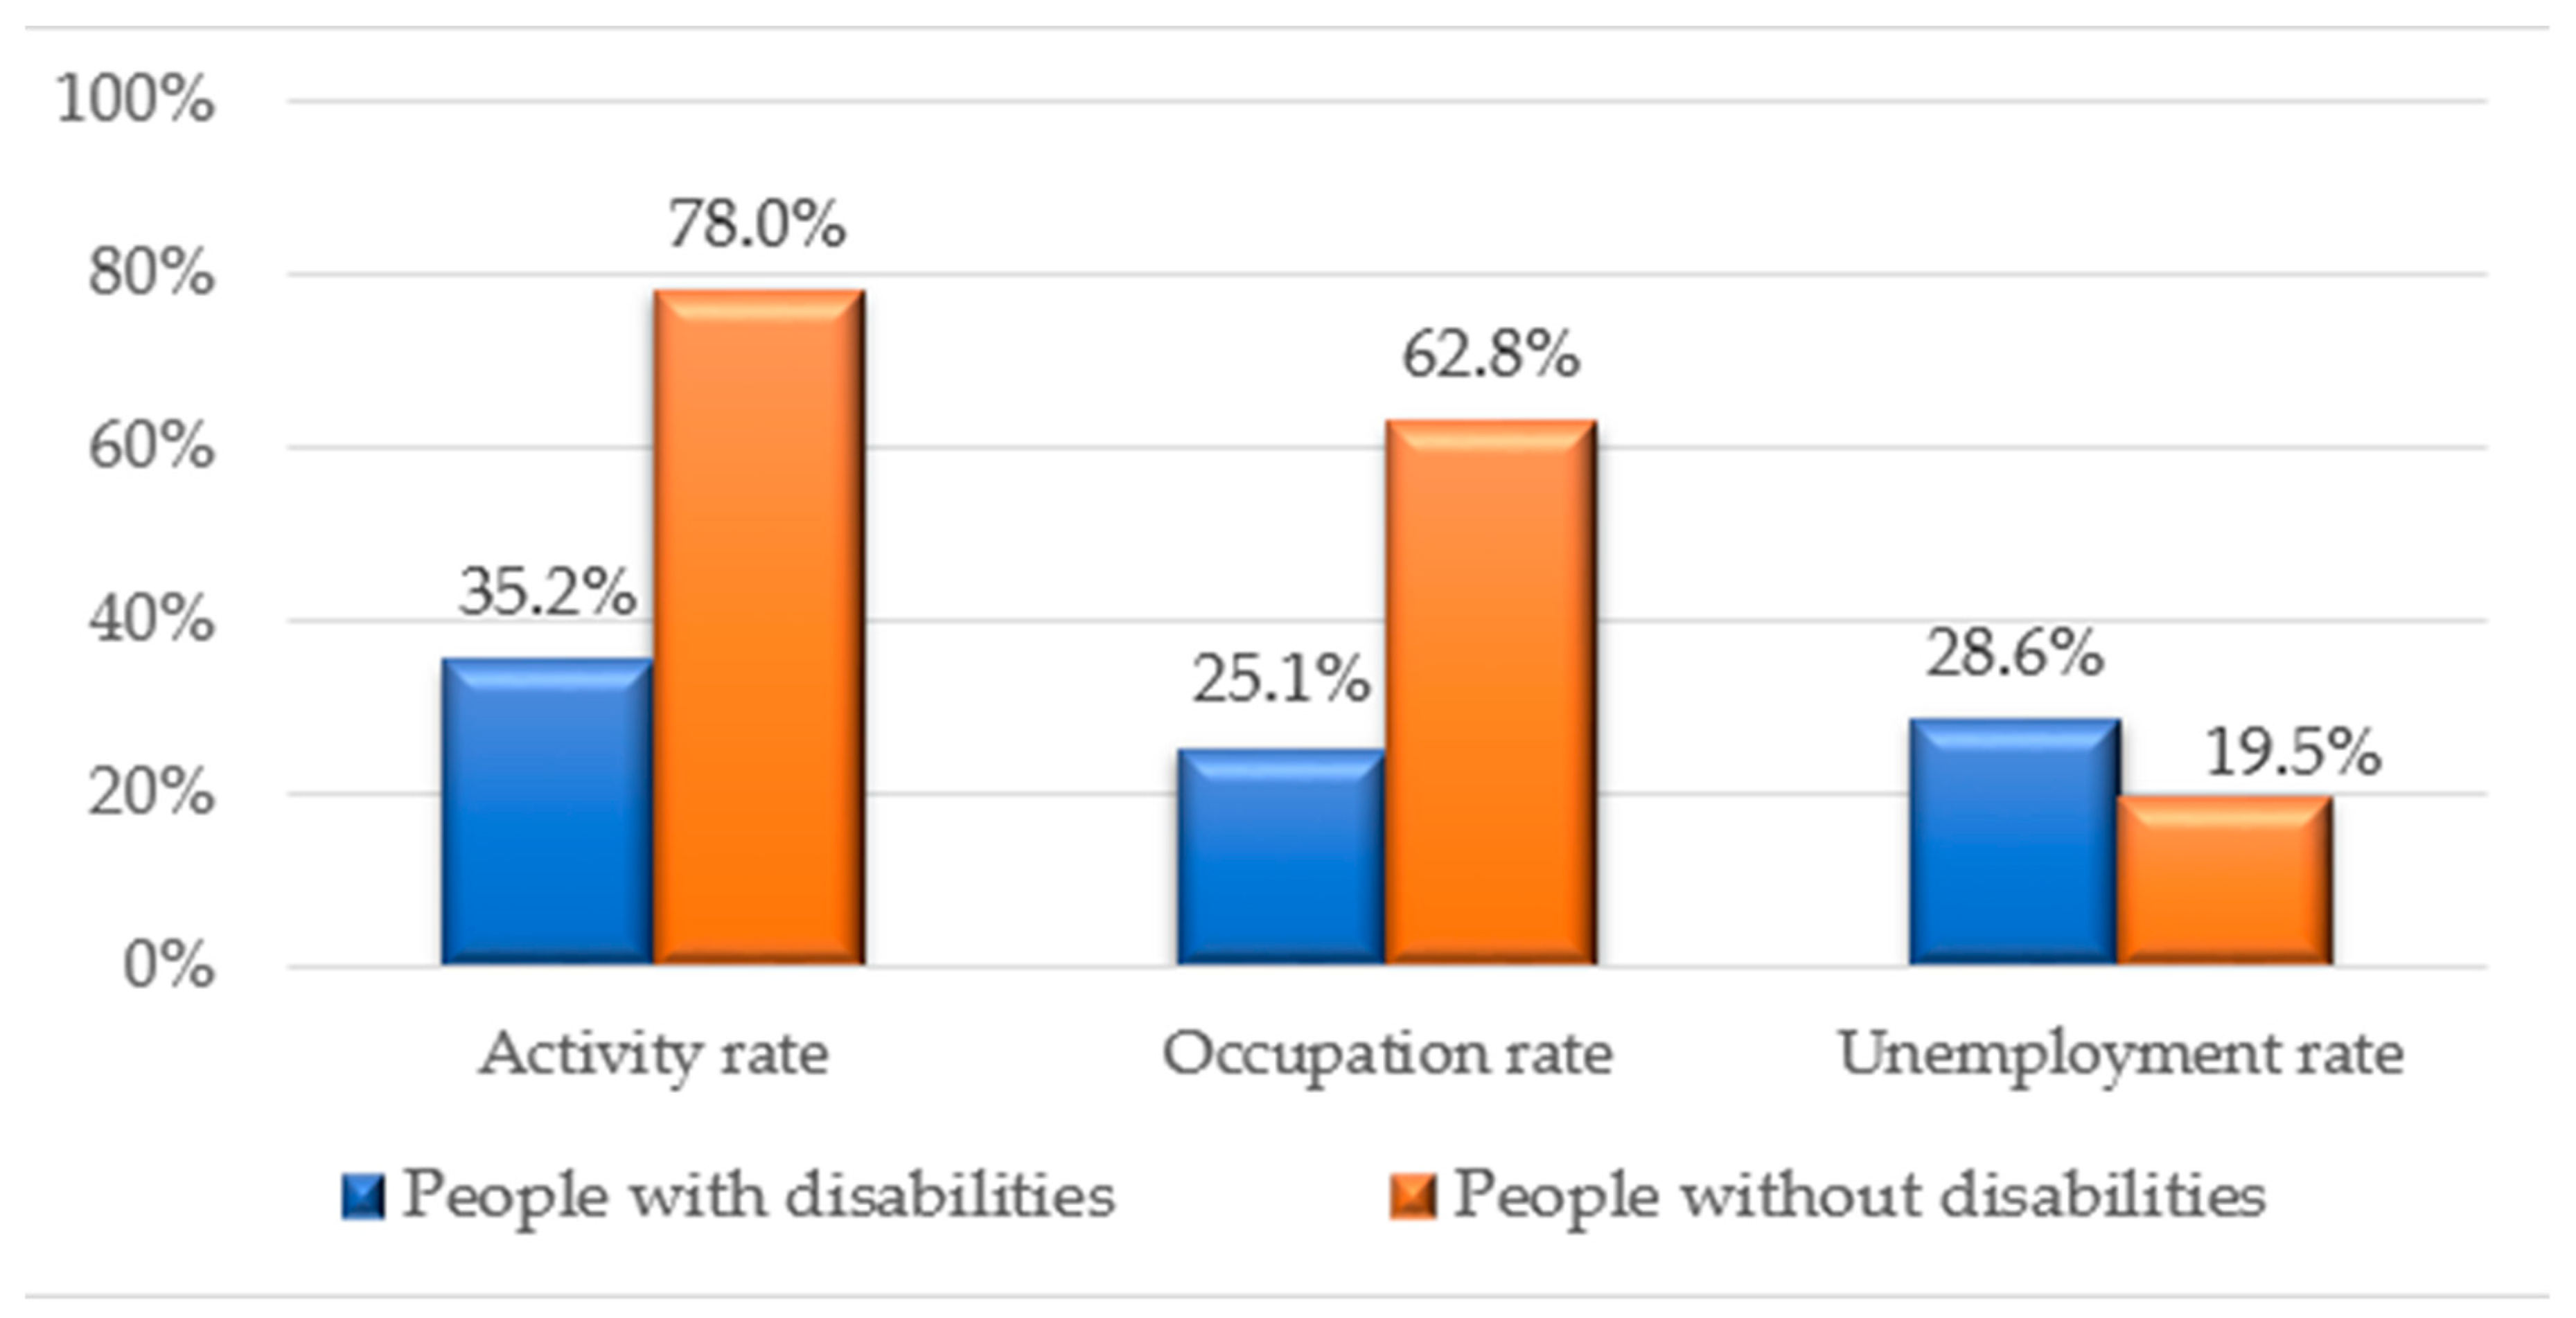
Despite all this, the PWD continue to show more negative indicators in the labour market than PWOD in Spain. In 2016, there were 1,840,700 working-age persons with disabilities (16–64 years), representing 6.1 per cent of the Spanish working-age population. Their activity and occupancy rates are less than half that of the PWOD and the unemployment rate gap is almost 10 points higher. (
Figure 1). Therefore, the main problem in the labour market for PWD is inactivity, i.e., their low participation in the labour market, rather than unemployment or the very low employment rate. This high level of inactivity reflects the low level of inclusion of this group in the labour market, which represents, in addition to the opportunity cost in terms of economic growth potential (e.g., loss of talent and business opportunities), an additional cost for the Social Security System through social protection benefits and medical expenses [
22].
Regarding personal characteristics of PWD compared to PWOD, there is a lower percent of women, young people, people with higher levels of education, especially those with higher education, and in jobs with a higher degree of qualification in workers with disabilities. Furthermore, the activity and employment rates of PWD are strongly determined by the degree of disability (lower rates if the intensity of the disability is greater) and by the type of disability (greater for physical disabilities and less for mental and intellectual disabilities) [
31].
Likewise, there is a significant wage gap in the labour market between workers with and without disabilities. In 2016 in Spain, PWD wages were 17% lower than those of PWOD [
40]. According to the literature on the wage gap between PWD and PWOD [
4,
5,
6,
7,
8], part of this wage gap can be explained by the different characteristics of workers with disabilities compared to workers without disabilities (for example, lower levels of education and lower-skilled jobs). In this sense, it is especially noteworthy that the largest wage gap between people with and without disabilities is shown in lower-skilled jobs (17.1% lower) and however, the smallest gaps are found in medium- and high-skilled jobs (5.5% and 7.4% lower, respectively). On the other hand, the lowest salaries corresponded to workers with intellectual and mental disabilities, while the highest salaries were received by workers with sensory and physical disabilities [
40].
Hence the following working hypothesis is raised:
Hypothesis 1 (H1). The SSE entities are more sensitive in the labour inclusion of PWD than the CC, regardless of their socio-labour characteristics.
However, the greater sensitivity of the SSE entities towards the labour integration of groups with special difficulties of insertion in the labour market, contrasts with the fact that the salary remuneration is usually lower than that of the CC [
17,
18]. According to the data we have extracted from the 2016 MCVL-CDF, salaries in the SSE entities, without considering the disability variable, were 14% lower than those of the CC in the Spanish context.
From a theoretical point of view, without taking into account the disability variable, there is no clear conclusion about what the relationship between salaries in SSE entities can be concerning CC. On the one hand, the theory of the non-profit Sector, defended by authors such as Hansmann [
41], Preston [
42] or Rose-Ackerman [
43], considers that, in SSE entities, salaries are lower than in CC because workers obtain a series of non-monetary compensation (the intrinsic motivation hypothesis) that goes beyond their salary, such as identifying themselves with the entity’s social purposes or maximizing and guaranteeing employment. On the other hand, the theory linked to Labour-Managed Firms or Worker-Owned Firms, which has its antecedents in Ward [
44], considers that in companies that are invested by their own workers, such as those that make up the hard core of the ESS (cooperatives and labour societies), wages will tend to be higher than in the CC because in the former the objective of the worker-members is the maximization of their salaries and individual returns, rather than the maximization of benefits of the entity as in the latter.
From the empirical point of view, there is also no consensus. In the works of Pencavel, Pistaferri, and Schivardi [
18], Clemente et al. [
17] or Magne [
45], it is obtained that the salaries of the SSE entities are lower than in the CC, although this result also depends on the percentiles of the salary distribution considered and the branches of economic activity. However, in other works, such as those of Burdín and Dean [
46] or Bailly, Chapelle, and Prouteau [
47], the opposite is shown, that salaries in the SSE entities are higher than in the CC. Additionally, when considering the collective of PWD, the empirical evidence corroborates, again, that they are lower in the SSE entities than in the CC [
19].
An interesting issue concerning PWD salaries is the analysis of the degree of inequality in the distribution of wage income by type of entity (SSE vs. CC). The international economic literature has paid attention during the last decades to the analysis of wage inequality and its determining factors [
48]. Moreover, studies which analyse this issue in Spain begin to proliferate [
23,
24,
49,
50,
51,
52,
53]. These studies base their explanations of wage inequality in Spain on the changes that are taking place in the productive fabric in terms of the degree of qualification, seniority, level of studies, gender and occupations of workers, in the size and characteristics of companies, and even how the cycles of creation and destruction of employment influence. However, in no case, is the degree of inequality in the distribution of wage income analysed for the specific case of workers with disabilities and, much less, comparing the SSE with the CC. Although the group under analysis is not the one analysed in these jobs (workers with disabilities), most of these jobs indeed highlight the effect that the trend has on the increase in salary inequality that exists towards the hiring of workers with characteristics that the ordinary labour market does not discriminate against (men, people with a higher level of education, with a higher degree of qualification, among others). Therefore, in line with Hypothesis 1 of this study, it would be expected that as long as the SSE present a greater sensitivity than the CC in the contracting of PWD with characteristics that the ordinary labour market discriminates against negatively, the degree of inequality in the distribution of salary income will be lower in the SSE than in the CC.
Therefore, this allows us to formulate Hypothesis 2:
Hypothesis 2 (H2). Salaries are lower in the SSE entities than in the CC, for the PWD group, but they create a more equitable distribution of wage income.
3. Materials and Methods
3.1. Data
The source of basic information used in this work has been the Continuous Sample of Working Lives in its version with fiscal data (MCVL-CDF, in Spanish) that can be defined as an organized set of anonymous microdata extracted from the Social Security administrative records, the Municipal Continuous Register of Inhabitants of the Spanish Statistics Office (INE, in Spanish) and the annual summary of withholdings and income on account of the Income Tax of Physical Persons of the Tax Agency (the report by Ministerio de Trabajo, Inmigraciones y Seguridad Social [
28] contains further information about the content of MCVL microdata). Given the enormous complexity involved in the exploitation of this data source, to analyse the evolution, in the decade between 2007 and 2016, of the socio-labour characteristics and of the wage differences of the PWD collective, three pictures have been compared: 2007, before the start of the Great Recession; that of 2013, in full crisis; and that of 2016, the last year with data available from the beginning of the current recovery.
It is important to keep in mind that the greatest efforts of this work lie precisely in the exploitation of the MCVL to obtain unpublished data of the variables under study, so the data itself is already a product of the research, regardless of the analysis that is then performed.
The MCVL is not a specific source for the study of disability, but it contains useful information to identify PWD and has a significant degree of representativeness which allows for a detailed study of the labour relations of this group.
The initial selection has been made from the tax data table, choosing those individuals who declare their disability to the employer. Workers between 16 and 65 years of age who have been working for at least two months in the reference year have been considered; to compare the results obtained from the use of the MCVL and those obtained by the INE in the Salary Structure Survey.
With the development of the MCVL, it is possible to differentiate between the types of entities which the PWD studies, which is one of the objectives of this study, with a sample size sufficient to be able to extrapolate the results to the population.
As the criterion to be used throughout the argument is the differentiation by type of company, distinguishing the SSE entities from the CC, the variable Legal form of the employer of the Fiscal Data Table has been considered. We have obtained sample sizes of 6368 PWD in 2007, 6705 PWD in 2013 and 7709 PWD in 2016.
The use of the fiscal data version of the MCVL (MCVL-CDF) is due to the fact that it is the only way to obtain an approximation of the salaries received by individuals. To calculate the annual salary gain, the full perceptions received from each paying entity, by the PWD, regardless of the duration of the labour episode, the type of contract or working day have been considered. Therefore, to make salary figures comparable, the number of days worked in each reference year has been calculated from the actual high and low dates of the contracts that appear in the MCVL Affiliate Table. To take into account the type of working day, the partiality coefficient that appears in each labour relationship has been considered, adjusting the number of days worked and thus showing the results for salary gains in full-time equivalence (FTE). In order to calculate the salary gains of each group, the average values have been taken, since the average values have not been considered adequate due to the enormous dispersion of the sample as there are very high values in the upper extremes.
3.2. Data Analysis Techniques
The different statistical methods used to make the comparison between the results obtained for the SSE entities and the CC have been Pearson’s χ2 test for the contrast of the first working hypothesis; and a series of measures of dispersion and distribution of the wage earnings of the PWD in each type of entity, together with the calculation of the Gini index as a measure of concentration, for the contrast of the second working hypothesis.
On the one hand, in the different variables used to make the comparison of the ESS entities and the EC, a statistical contrast has been used to measure whether the differences in the proportions obtained for both types of entities, are significant or not from the statistical point of view. To do this, Pearson’s χ2 test has been used based on:
H
0: All proportions of the population are equal.
Being,
Okj: Relative frequencies observed for each sample k and category j.
Ekj: Relative expected frequencies for each sample k and category j.
J: Total number of categories.
K: Total number of samples.
The expected frequencies (E) are calculated from the formula E = p * Ototal, where p is the sample proportion and Ototal is the total frequency observed.
The test statistic is compared with a χ2 of (J−1) * (K−1) degrees of freedom for the level of significance desired.
4. Results
The first objective or hypothesis raised in this study is to prove whether the SSEs truly have a greater sensitivity than the CC in terms of labour inclusion of the PWD, according to Dwertmann’s proposal [
22].
As the first indicator to corroborate this hypothesis, the weight of the employment of the PWD within the total employment in the two types of entities (SSE and CC) and its evolution during the last two phases of the economic cycle, that is, the Great Recession (2007–2013) and the beginning of the current recovery (2013–2016) (
Figure 2). According to the conclusions obtained by the Spanish Social Economy Business Confederation (CEPES, in Spanish) [
54], our results reveal that the SSE have greater sensitivity in this regard, since the PWD represent a greater proportion of their total employment (in 2016, three times higher). The last two phases of the cycle have caused opposite trends in the evolution of this indicator in the two types of entities, reducing this sensitivity in the SSE and increasing, despite being much lower, in the CC.
Secondly, and following the hypothesis of greater sensitivity, the percentage distribution of employment of PWD is analysed according to the different socio-labour characteristics (personal, by type of contract and company characteristics) in the two types of entities. This helps us to see if the SSE integrate their workforce with socio-labour characteristics that the ordinary labour market (CC) discriminates negatively against (i.e., women, young people, people with lower educational and qualification levels or with a greater degree of disability, among others) (from
Table 1,
Table 2,
Table 3,
Table 4,
Table 5 and
Table 6). In all cases, the significance of the differences between SSE and CC is corroborated by Pearson’s χ
2 statistic, whose results are also shown in these tables.
Regarding personal characteristics (
Table 1 and
Table 2), the following is verified:
By gender, the presence of women, despite being a minority in the use of PWD in the two types of entities, is slightly higher in the SSE than in the CC, thus indicating a greater sensitivity in gender equality in the SSE than the CC. Additionally, the degree of feminisation for the employment of PWD has increased in both types of entities during the last two phases of the cycle.
By age cohorts, before the Great Recession, the SSE showed greater sensitivity in labour inclusion of young people under 25 years of age than the CC, and the opposite for people over 55 years. However at present, there are no longer statistically significant differences between the two types of entities by age cohorts. One possible explanation for this could be linked to how job destruction, during the Great Recession, has affected different sectors of activity (manufacturing and construction have concentrated most of the employment destroyed), types of contract (especially temporary contracts) and age groups (the youngest) in an unequal way. However, a more in-depth analysis of this fact would be necessary to understand the cause.
By educational level, most PWD are concentrated in the lowest educational levels. However, the SSE show greater sensitivity in labour inclusion of PWD with lower educational levels (without studies). This greater sensitivity could be due to the sectors of activity in which PWD are specialised by each type of entity. However, as can be seen in
Table 5, which shows the sectoral distribution of employees with disabilities in the SSE and the CC, the SSE entities are more specialised than the CC in the health, education and social services sectors, while the CC are more specialised in commercial distribution and administrative activities. Therefore, a priori, the different sectoral specialisation would not justify this greater sensitivity in the inclusion of PWD with a lower level of education, but rather the opposite. The last two phases of the cycle have led to an increase in the educational level, in favour of those in higher education to the detriment of those without studies in the two types of entities.
By degree of disability, again the SSE have a greater sensitivity than the CC by integrating among its staff a higher percentage of PWD with a higher degree of disability, although this percentage has been reduced during the Great Recession.
Regarding the characteristics of the contractual relationship (
Table 3 and
Table 4), highlights:
The greater stability in employment in the SSE, since the rate of temporary employment and partiality, is lower than in the CC. The work of Castro Núñez et al [
55], which assesses the effects of SSE on social cohesion, also highlights the greater stability of employment in this type of entity. Among the reasons for this greater stability in employment, it could be highlighted that many of these entities, such as worker cooperatives and labour companies, are created to provide stable employment to their worker-members. Another possible explanation is the greater internal flexibility of this type of entity, so that, in times of crisis, adjustments are made, more frequently than the CC, through internal channels (adjustment of salaries and working hours) than through external channels (dismissals), which provides greater stability in employment [
56]. The Great Recession decreases the temporality in the two types of entities and also the current recovery in those of the SSE, this does not happen in the CC, whereas the bias in employment has increased during the last two phases of the economic cycle and in both.
The predominance of hiring under the specific modality of disability in the SSE and of the non-specific in the CC, however, in the SSE the relative presence of this type of specific contracting decreases while it increases in the CC.
The concentration of most of the employment of PWD in the medium and low qualification groups in the two types of entities. Here, however, there is a greater sensitivity from the CC in the labour insertion of PWD with lower levels of qualification. The Great Recession and the onset of recovery increase the relative presence of low-skilled employment in CCs and high-skilled employment in SSE.
According to the characteristics of the company (
Table 5 and
Table 6), the following can be concluded:
By size of the company, there is a polarisation of the use of PWD in smaller companies (less than 50 workers) and the larger ones (more than 100 workers) in both types of entities. The beginning of the recovery accentuates the concentration of employment in the larger ones.
By sector of activity, the use of PWD is very concentrated in the services sector, as in the whole of the Spanish economy, and very segregated horizontally. Additionally, there is a different sectoral concentration of employment of PWD according to the type of entity: in the SSE in the sectors directly linked to social action (health, education and social services), while in the CC in those related to administrative activities and commercial distribution.
The second objective or working hypothesis is to verify that the salaries of the PWD are lower in the SSE than in the CC and that the former make a better distribution of the wage income than the second (from
Table 7,
Table 8,
Table 9 and
Table 10). For this, the rates which measure the wage differences between both types of entity (SSE concerning CC) and statistics have been calculated to measure the dispersion (from the coefficient of variation), distribution and inequality (with the calculation of deciles and their differences) and, finally, the salary concentration (based on the Gini index).
Regarding wages, during the Great Recession, yes, salaries in the SSE were lower than the median of the CC as well as the FTE for most socio-labour characteristics. However, in 2016, this trend has been reversed becoming similar in median and FTE and even slightly higher in the SSE than in the CC. Additionally, during the Great Recession, the wage difference of the PWD between the two types of entities increase and decrease during the beginning of recovery.
Finally, regarding the degree of inequality in the distribution of wage income (measured by the Gini Index and the ratios between percentiles) and its dispersion (measured through the coefficient of variation) (
Table 9 and
Table 10), the results reveal, in general, the more equitable distribution of wage income in the SSE than in the CC, highlighting that:
The dispersion of wages for 2007 and 2013 is smaller in the SSE than in the CC as the coefficient of variation shows us.
During the Great Recession, the dispersion of wage income increases, and, during the beginning of the current economic recovery, it decreases. This result is similar to that obtained by Arranz and García-Serrano [
23], in the sense that the phases of economic expansion decrease wage dispersion, while those of crisis increase it. Bashford-Fernández and Rodríguez-Álvarez [
57] also show the trend towards increasing wage inequality in the post-crisis periods.
The ratios between deciles (D9/D1, D9/D5, D5/D1) reveal smaller differences in the SSE than in the CC, between the salaries of those who receive the highest salary and those who receive medium, and the lowest salaries.
The Gini Index obtained is lower in the SSE than in the CC in the three years analysed (
Table 10), which tells us of the lower inequality in the distribution of wage income in the SSE than in the CC. Although, it is observed that the degree of inequality in the distribution of salary income is decreasing in the CC, while in the SSE it grows progressively in the three periods analysed. The analysis of the causes would require a more detailed study for the different personal, contractual and company characteristics which lead us to these results at an aggregate level.
Therefore, it was found that a more equitable distribution of income for PWD in the SSE in compare to the CC favours compliance with SDG 10 on reducing inequalities.
5. Discussion and Policy Implications
SSE entities have a series of inherent characteristics which, in theory, make them more sensitive than CCs in the labour inclusion of PWD [
22]. The purpose of our study has been to add empirical evidence to this theoretical approach. In practice, this study has been able to corroborate, in part, that greater sensitivity. Not only because the PWD suppose a greater proportion of total employment of the SSE entities than of the CC (4.5% vs. 1.4%, in 2016), but also because the SSE entities integrate in relative terms among its PWD workforce people with a profile or characteristics against whom the ordinary labour market (CC) usually discriminates negatively [
16,
58]. In this sense, authors such as Castaño et al. [
59] or Anker [
60] point out that people face stereotypes associated with their socio-demographic characteristics, such as gender, race, or age, which predispose the employer to associate them with poor work performance. In the case of disability, this becomes a stigma that weighs down the employment options of PWD [
61,
62] and their low employment rates contribute not only to their high poverty rates [
63], but also to be socially marginalised [
22]. Additionally, from society’s point of view, it has negative consequences, such as the loss of economic potential by having underutilised productive resources [
64,
65] and increasing costs through more pressure on social security systems [
66]. Therefore, public policies should pay more attention to the serious problem of unemployment and low activity rates among PWDs, not only due to social factors but also to economic efficiency issues [
67].
Excluding PWD from the workforce has costs for society, in terms of their productive potential, the cost of disability social protection benefits and pensions and implications for their families and carers. The ILO estimates that this exclusion may cost countries between 1 to 7 per cent of GDP [
65].
In general, the results of this study support the promotion of ESS as a possible way of mitigating the serious problem of unemployment among PWD. Specifically, it has been verified the greater sensitivity of the SSE entities in gender equality, in labour integration of the young, of people without studies and those with a higher degree of disability. However, the results have also cast shadows against the SSE entities and in favour of the CC in this last aspect analysed, against what the specialised literature postulates [
68]. In particular, the study has been able to corroborate the greater sensitivity of CCs in labour integration of older PWD (over 55 years of age) and of lower qualification. It is possible that fiscal and economic incentives to hire this particular cohort of PWD [
69] may be at the origin of these contradictory results. Given the temporary nature of such incentives, measures to promote the training of workers and social economy partners [
70,
71], and their active participation in the design and implementation of Vocational Training, could be useful policies to improve the qualification of PWD in these type of entities. In this sense, Schur, Colella and Adya [
63] point out that it is convenient to make society aware of the need to overcome the paternalistic vision of protection that considers disability as a defect within an individual, evolving towards a social vision, where the cause of the labour problems of PWD is found in the social and physical work environment and not in the PWD themselves [
66,
72]. Hence the need pointed out by Baumgärtner et al. [
21], to create flexible working environments, where both companies and PWD benefit mutually from their collaboration: companies taking advantage of the special skills and talent of this group, and PWD developing a highly satisfactory work that allows them to be economically independent and feel useful and self-fulfilling [
73].
From the comparative analysis of the socio-labour characteristics of the PWD, we have also been able to draw more conclusions which tell us about additional bonuses of the SSE entities compared to the CC as they provide the PWD with greater employment stability and are more specialised in branches of economic activity directly linked to welfare services and social action (education, health, social services). In this sense, the economic policy measures which should be promoted would be in line with establishing and consolidating the incentive system for the incorporation of partners and workers in cooperative and labour societies, and for the permanent hiring of third parties in the social economy entities, especially those whose social purpose is the creation of employment for PWD and groups in danger of social exclusion. For this, it is necessary to continue promoting the work of the Special Employment Centres, Insertion Companies and Social Initiative Cooperatives. Incentive policies for collective entrepreneurship through cooperatives and labour societies are also a key factor in generating employment [
74].
Regarding the analysis of wages, their dispersion and distribution by percentiles, at work, the second hypothesis that PWD salaries are lower in the SSE entities than in the CC is corroborated. Except for, in the last year analysed, 2016 they are balanced, and this trend is even slightly reversed. However although they have been lower, the degree of dispersion (measured by the coefficient of variation of wages) and the degree of inequality by percentiles (ratios D9/D1, D5/D1 and D9/D5) and total (Gini Index) they all speak to us of a more equitable distribution of salaries in SSE entities than in the CC, which is an aspect to be taken into account in the public policies of income redistribution since, the primary income (between which wages are found) are together with income transfers, the basis of the result of personal income distribution in a country.
The promotion of SSE entities is key to the labour inclusion of PWD. The important challenge is to value their role in the monetisation of the social impact generated by these entities [
75], especially in the current legal framework of Public Sector Contracting in Spain [
76], based on European Directive 2014/24/EU of the European Parliament and of the Council, of February 26, which incorporates the assessment of social aspects in public procurement and contracting. In this sense, Gutiérrez, Nevado and Pache [
77] build ethical and sustainable indicators to measure and compare the responsible behaviours of administrations concerning their public contracts. Traditionally, it has been the large companies who were most likely to access these types of contracts by strictly economic award criteria. The current legislation requires maintaining the market reserve to encourage the insertion of people with disabilities and the social and professional integration of groups at risk of exclusion. The social clauses incorporated in the Spanish legislation as of 2018 for public procurement constitute an important track to the development of SSE entities.
6. Limitations and Implications for Future Research
Given the pioneering nature of this study in the analysis of the degree of inequality in the wage distributions of PWD in the SSE compared to CC, one of its main limitations is its exploratory nature. In this study, we have concluded that the SSE perform a more equitable distribution of the wage income of the PWD than the CC; however, the causes behind this more equitable distribution are not analysed, as Franzini and Gaetano [
27], and Arranz and García-Serrano [
23] point out. Therefore, as a line for future research, it is proposed to analyse the causes that may be motivating this more equitable distribution of the salary income of PWD in the SSE compared to the CC.
The second limitation of the research is derived from the database used: the MCVL. Although it has many advantages over other databases, among which it is worth noting that it allows a distinction to be made by type of entity (ESS vs. CC) and by degree of disability, it also presents a fundamental limitation in the analysis of the specific group of PWD: it does not enable to distinguish by type of disability (sensory, physical, mental, intellectual, etc.) and this is one of the basic elements that helps to explain, not only active participation in the labour market, but also the rates of occupation, unemployment and wages of the PWD. Dwertmann [
22] points out the problem of heterogeneity of the disability construct as one of the challenges that disability researches face, which is accentuated by the scarcity of available data. Authors such as Gunderson and Lee [
78] propose focusing only on the lowest degree of disability to mitigate this limitation, but we do not agree with their arguments, understanding that it is based on a paternalistic and stereotyped vision from which we are trying to escape. We think it is more appropriate and valuable to propose, as future lines of research, to repeat the analysis carried out by segmenting the database by sector and, above all, by type of work (employed or self-employed). Additionally, it would be advisable to perform a work of matching the information available in MCVL with other sources that enable the type of disability to be identified.
Finally, the geographical limitation, given that the research is focused on Spain, means that the conclusions obtained cannot be extrapolated to other countries. In this sense, another line of future research would be to perform an international comparison. In this case, the heterogeneity in the measure of the multidimensional construct of disability will represent an additional challenge in which, as Dwertmann [
22] points out, it will be necessary to involve survey organisations and achieve the consensus of the different social agents at an international level.


