Article

The Nexus between Poverty and the Environment: A Case Study of Lijiang, China

1
Institute of Geographic Sciences and Natural Resources Research, Chinese Academy of Sciences, Beijing 100101, China
2
Key Laboratory of Regional Sustainable Development Modeling, Chinese Academy of Sciences, Beijing 100101, China
3
College of Resources and Environment, University of Chinese Academy of Sciences, Beijing 100049, China
*
Authors to whom correspondence should be addressed.
Sustainability 2020, 12(3), 1066; https://doi.org/10.3390/su12031066
Submission received: 18 November 2019 / Revised: 18 January 2020 / Accepted: 30 January 2020 / Published: 3 February 2020
(This article belongs to the Section Sustainability in Geographic Science)

Abstract

:
Highlighting the nexus between poverty and environment is essential to promote poverty alleviation and sustainable development. This study analyzed spatial differences and environmental factors influencing poverty incidence and reduction using spatial statistical methods and GeoDetector tools. It focused on Lijiang in the Hengduan Mountains of western China as the case area. The results indicate a notable decline in poverty incidence in most Lijiang villages during 2014–2018 under China’s poverty alleviation strategy. However, there are distinct spatial differences for both poverty incidence and reduction. The main environmental factors affecting poverty incidence and reduction are available water storage and geological hazard risks. Socioeconomic factors such as administrative unit and distance to city center also play a key role. The anti-poverty policies in various administrative units have the most significant influence. However, existing policy formulation mainly considers elevation factor in mountainous areas. This study suggests that water resources and geological hazards should also be highly considered, and not only elevation. It is imperative to promote the construction of water conservancy facilities and improve the prevention and control of geological disasters. Moreover, targeted poverty alleviation should focus on, not only policy or socioeconomic factors, but also main environmental factors affecting poverty incidence and reduction.

1. Introduction

Poverty is a global issue hindering sustainable development [1,2,3], and its eradication continues to be a common goal for the international community [4,5]. In 2000, the United Nations introduced the Millennium Development Goals, one of which was to halve the extreme poverty headcount ratio as per the 1990 levels by 2015. However, even in 2015, the poverty headcount ratio remained as high as 9.9%, with a global poverty population of 736 million. In 2015, the United Nations enacted the 2030 Sustainable Development Goals, which were primarily aimed at eliminating all forms of global poverty by 2030. Consequently, countries have adopted various anti-poverty policies, such as providing material and financial support, optimizing industrial structures, increasing employment, strengthening infrastructure, and improving public services including transport, education, and medical care [6]. In addition to socioeconomic development conditions, the environment is considered a fundamental factor affecting poverty [7]. Regions with uninhabitable environments or scarce natural resources are more likely to fall into the poverty trap, and this is particularly true for developing or undeveloped nations. Nevertheless, human efforts including projects related to transport, construction, hydraulic engineering, and protection against natural disasters are improving poverty conditions. Therefore, there is a nexus between poverty and the environment in terms of both poverty incidence and poverty reduction [8]. Poverty incidence and reduction represent the synergic function of anthroposphere and sub-systems in natural environments. To reduce regional poverty, it is necessary to understand the relationship between environmental factors and the process of escaping from and falling into poverty.
China has significantly contributed to achieving the United Nations’ Millennium Development Goals and reducing global poverty [9]. According to World Bank statistics [10], China’s poverty headcount ratio reduced from 66.2% in 1990 to 0.7% in 2015. This can be attributed to the country’s poverty alleviation strategy and policy system. Since its reform and opening-up, China has undergone structural reforms promoting poverty relief, development-oriented poverty relief, and addressing key problems in poverty relief, followed by consolidation-oriented comprehensive poverty alleviation and targeted poverty alleviation with a focus on government leadership, self-reliance, social participation, and multi-dimensional development [11,12]. In 2015, China’s central government proposed to eliminate both regional and national poverty by 2020. To make up the short-board of villages and promote the building of a prosperous society, in 2017, the government presented a rural revitalization strategy and advocated that China was fighting for poverty alleviation and development on its own terms. There remains significant global pressure on China to reduce poverty. At the end of 2018, the national poverty population continued to be at a high 16.6 million. A majority of the impoverished regions are located in western China, particularly in the mountainous, plateau, and arid areas. The relationship between humans and the environment in western China is distinctly tense. Examining the nexus between poverty and the environment is, therefore, imperative to strengthen theoretical and practical poverty research in western China that offers useful policy implications for poverty alleviation.
Numerous theoretical and empirical studies have been conducted on poverty and its alleviation [13,14,15,16,17,18,19]. The literature primarily concentrated on the concept and measurement of poverty, spatial pattern characteristics, influencing factors, and poverty alleviation policies. Notably, poverty was generally considered as a condition characterized by the severe scarcity of basic human needs for food, clothing, and shelter [20]. Recent studies have shown that poverty is not limited to low-income distribution but includes the lack of basic necessities such as education, healthcare, and housing. Therefore, poverty has changed from a single economic concept to a multidimensional perspective [15]. Correspondingly, studies were employing multi-dimensional approaches, in addition to single-dimensional ones, to measure poverty. Single-dimension measures employed the poverty line as a criterion. The international poverty line was based on the World Bank standard of monitoring global extreme poverty. In 2015, it changed from $1.25 per person per day in 2005 Purchasing Power Parities (PPPs) to $1.90 per person per day in 2011 PPPs [21]. China set its own poverty line based on farmers’ income, which was also an important reference for governments to identify the poor. China’s rural poverty line was 2300 yuan (about $1.80 per person per day in 2011 PPPs) in 2011, which was close to the international standard. This line periodically adjusted to 2736 yuan (about $2.14 per person per day in 2011 PPPs) in 2013 and 3535 yuan (about $2.76 per person per day in 2011 PPPs) in 2018. In addition, multi-dimensional measures mainly employed a multidimensional poverty index (MPI) to provide a comprehensive overview of poverty, such as the global Multidimensional Poverty Index published by the United Nations Development Programme (UNDP) [22]. Advancements in remote-sensing and information technology have encouraged researchers to employ nightlight data [23], the Internet and social media [24], and digital footprints in the transaction logs of mobile phones [25] to estimate poverty. The adoption of machine learning also has considerable potential to fight poverty [26]. However, it is difficult to select appropriate indicators to represent each dimension in a multi-dimensional approach, and it is easier to solve data problems using single-dimensional measures. Thus, single-dimensional measures remain widely used as a basic measure.
The spatial distribution of poverty is characterized by extensive dispersion with localized concentrations. From a global perspective, poverty areas have expanded in terms of spatial fragmentation rather than size [27]. At the regional level, poor areas have a high spatial concentration effect, which is primarily due to industry clustering [28,29]. Such agglomeration has a spatial scale effect [30]. Existing research focused more on macro-scale poverty at the county level. However, poverty conditions are typically observed in rural areas. Thus, a study conducted at the village level, rather than the county or township level, can offer the executive and operational insight necessary to formulate poverty alleviation policies [15]. Further, compared with research on poverty incidence, few studies examined spatial patterns in the context of poverty reduction.
Research on the influencing factors generally highlighted income, urbanization, transport, childhood disabilities, and education [31,32]. Previous studies have shown that poverty can be divided into individual and regional poverty. Factors at the individual level include homeowners age, marital status, family structure, working hours, culture, and psychological aspects [33,34]. On the other hand, the essence of regional poverty is the discordance in the relationship between humans and the environment. Scholars have indicated that the relationship between environment and poverty is a two-fold interactive process. The poorer are forced to overuse environmental resources for daily survival and the continually depleting environment further impoverishes them. Some, however, diverge from the stylized ‘vicious circle’ and these wealthier individuals have a larger environmental impact than the poorer [35]. The literature focused more on how poverty impacts the environment but neglected unsustainable environmental aspects in relation to poverty, especially in a natural environment, thus providing an incomplete view of the multiple dimensions of poverty and their underlying drivers [36,37].
Therefore, this study used the income poverty lines published by the Chinese central government to identify the poor in Lijiang at the village-level, and analyzed the spatial pattern of poverty incidence and reduction. On this basis, this study aimed to explore the nexus between poverty and the environment, namely, to explore what environmental factors are related to poverty incidence and reduction. Environmental factors, such as elevation, have become important criterion for the government to formulate and implement anti-poverty policies. Identifying accurate environmental factors can provide an important reference for formulating reasonable poverty alleviation policy and promoting poverty reduction. The remainder of this paper is organized as follows: Section 2 presents the research methodology, Section 3 shows a detailed analysis on the spatial distribution characteristics and the influencing factors of poverty incidence and reduction, and Section 4 discusses the findings and concludes with policy recommendations.

2. Methodology

2.1. Study Area

This study selected Lijiang in Yunnan Province as the case area (Figure 1a). In terms of the administrative definition, Lijiang is a prefectural-level city with a district and four counties. However, in terms of the landscape definition, Lijiang only refers to the built-up city in the Gucheng district. In addition to the built-up center city, other places in Lijiang administrative area are mostly rural areas with poverty problems. The total area of Lijiang is about 20,566.62 km2. As shown in Figure 1b, Lijiang is divided into Gucheng District, Yulong County, Ninglang County, Yongsheng County, and Huaping County. The ancient city in Gucheng District has made Lijiang a famous tourist destination. Gucheng District is also the political and economic center of Lijiang Prefecture. However, Lijiang’s remaining four counties are typically impoverished regions and have relatively lower urbanization levels. Lijiang is located at the junction of the Yunnan–Guizhou Plateau and Qinghai–Tibetan Plateau and thus, is surrounded by mountains and has ecologically fragile zones. In addition, Lijiang is distributed in the Jinsha River watershed, which is the upstream area of the Yangtze River and faces serious soil erosion. Lijiang is also prone to natural disasters such as earthquakes, landslides, and mudslides. Another serious issue in Lijiang is stony desertification. Given these environmental conditions, Lijiang remains an important poverty-stricken area in western China, where agriculture and forestry remain the primary sources of income.
Lijiang has recently adopted various poverty alleviation measures, such as providing food and money, relocating poor households, and providing employment opportunities and skill training. These measures have successfully decreased the population in poverty from 175,584 in 2014 to 83,582 in 2018. In 2018, Lijiang had 15 poverty townships, 250 poverty villages, and 39, 10, and 61 villages with severe poverty are in Yongsheng, Huaping, and Ninglang counties, respectively. Research on poverty reduction in Lijiang can serve as a reference in designing poverty alleviation policies in regions with similar conditions. As China implemented the targeted poverty alleviation strategy in 2013, this study explored poverty reduction in Lijiang during 2014–2018 and compared the poverty situation in 2014 with that in 2018. The smallest geographic unit is at the village level.

2.2. Methods and Data Resources

2.2.1. Poverty Incidence and Poverty Reduction Rates

The poverty incidence rate is equal to the ratio of the number of poverty population to the total population, revealing the extent of poverty. The poverty reduction rate is equal to the ratio of the number of poverty reduction population over a period of time to the number of poverty population in the base period, which reveals the extent of poverty reduction. To understand the change in poverty incidence and reduction at the village-level, this study estimated the poverty incidence rate for each village in 2014 and 2018 and poverty reduction rates for each village during 2014–2018. The required data were provided by Lijiang Municipal Government.

2.2.2. Spatial Analysis and Spatial Autocorrelation

This study used Spatial Analysis Tools in ArcGIS 10.2 (ESRI, Redlands City, CA, USA) to visualize the spatial distribution pattern of poverty incidence and reduction rate, and applied a spatial statistical model to reveal its spatial autocorrelation. In general, it uses global spatial autocorrelation to measure the overall spatial correlation of different variables. The commonly used measure is the Moran’s I index, and its calculation formula is as follows:
I = 1 S 2 i = 1 n j 1 n ( X i X ¯ ) ( X j X ¯ ) i = 1 n j 1 n W i j
Here, n is the total number of villages, X i is the poverty incidence or reduction rate of village i , X ¯ is the average poverty incidence or reduction rate of all villages, S 2 is the variance of poverty incidence or reduction rate of all villages, and W i j is the spatial weight matrix, constructed by queen contiguity; each value is equal to 1 when two villages have common edges or vertices, otherwise it is equal to 0. Selecting queen contiguity as the adjacent relationship was done to produce more closely related structures and cover more adjacent villages. The Moran’s I value ranges between 0 and 1. A value closer to 1 indicates absolute positive autocorrelation, as similar attributes tend to come together. A value closer to −1 indicates absolute negative autocorrelation, as different attributes tend to come together. A value closer to 0 indicates that attributes are randomly distributed, or have no spatial autocorrelation [38].
The results were statistically tested using a standardized z-statistic as follows:
Z = I E ( I ) V ( I )
Here, E ( I ) is the expected value and V ( I ) is the coefficient of variation.
In addition, this study also cited the local indicators of the spatial autocorrelation index (LISA index), to test spatial local patterns. For village i , its expression is as follows:
I i = X i X ¯ S 2 j = 1 ,   j i n W i j ( X j X ¯ )
Here, the meaning of the alphabets in the formula is the same as above. I i > 0 indicates that a high (low) value is surrounded by a high (low) value (H-H or L-L), whereas I i < 0 indicates that a high (low) value is surrounded by a low (high) value (H-L or L-H).

2.2.3. Potential Environmental Factors of Poverty Incidence and Reduction

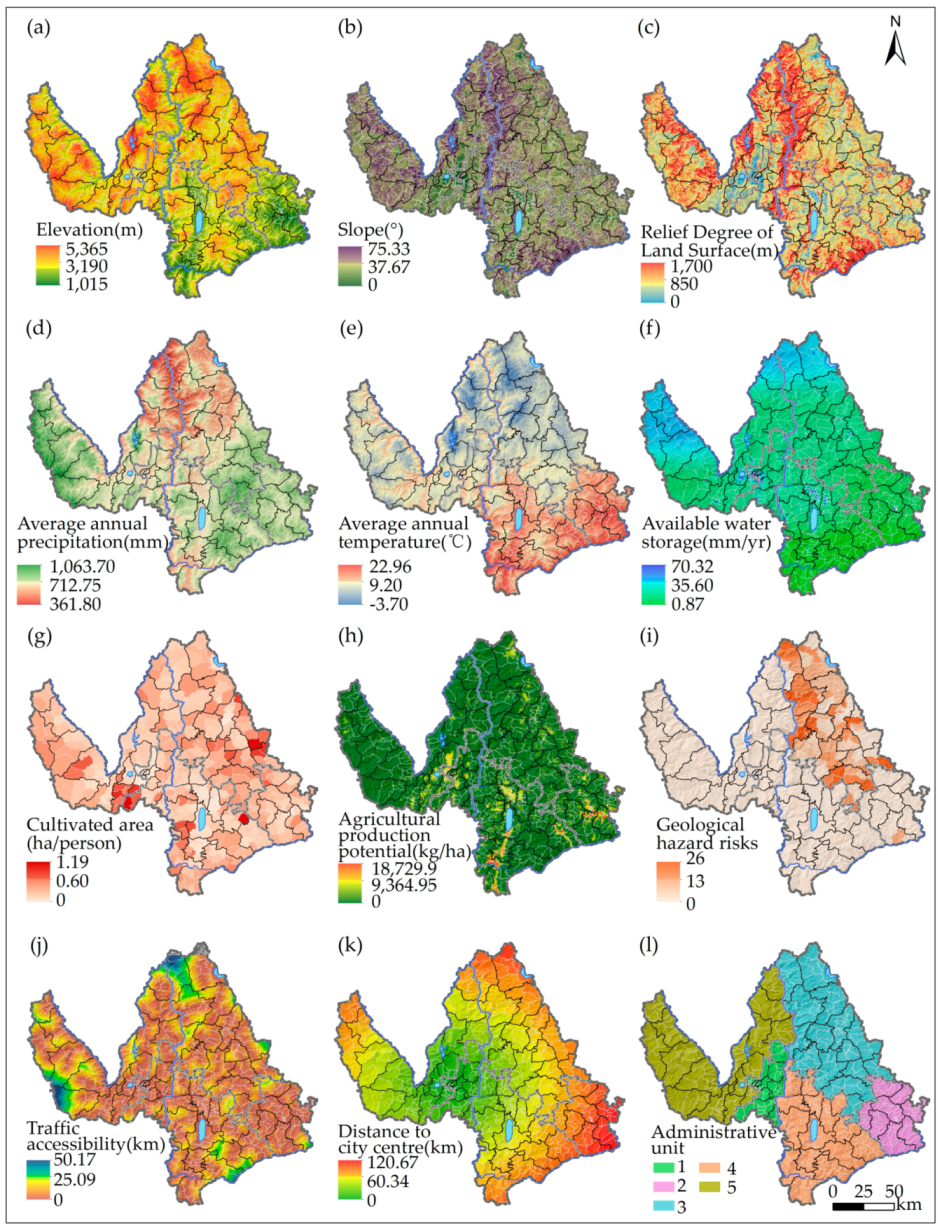
Table 1 presents the potential environmental factors of the poverty incidence and reduction employed in this study. There are 12 factors summarized into 8 categories. The factors were compiled using a geographic information system (GIS) environment (Figure 2). A majority of the factors are natural environment factors related to the lithosphere, atmosphere, hydrosphere, and biosphere. This study considered topography and geological disasters for the lithosphere. Topography is described as elevation, slope, and relief degree of land surface, which are basic terrain indicators in mountain regions. The rank of geological hazard risks is also a key indicator because Lijiang is prone to earthquakes, landslides, and debris flow. For the atmosphere, this study considered the climate in the dry and hot valley of the Jinsha River basin. Climate is denoted by the average annual temperature and precipitation. For the hydrosphere, this study highlighted water resources, an important factor sustaining production and life. Despite receiving abundant precipitation or being located along the river, certain rural areas face water shortages owing to restrictions such as elevation, evaporation, and penetration. Thus, it is more appropriate to represent water resources by available water storage rather than distance from the river. Finally, this study focused on land resources for the biosphere and accounted for both the quantity and quality of land resources expressed by the per capita cultivated area and agricultural production potential. Note that the dataset of agricultural production potential was calculated by the Global Agro-Ecological Zones models and had been published in the Resources and Environmental Sciences Data Center (RESDC) [39].
In addition to natural environment, this study examined the role of socioeconomic factors. This study first considered traffic accessibility to indicate human efforts to enhance connectivity among settlements and reduce travel time in the mountain areas. Second, this study accounted for the distance to the city center (Gucheng District) to represent economic location. Finally, this study considered administrative boundary because county-level units may employ different poverty reduction policies. Notably, the potential factors in this study indirectly affect poverty incidence and reduction by influencing people’s production and life. This study did not include direct socioeconomic indicators (e.g., GDP and urbanization level) owing to the lack of related statistical data at the village level.
The data used in this study were primarily from the following three sources. Firstly, this study referenced data published by Lijiang Municipal Government for per capita cultivated area, geological hazard risks, and administrative units. Secondly, information for elevation, average annual precipitation, average annual temperature, and agricultural production potential were published by the Resources and Environmental Sciences Data Center (RESDC), the Chinese Academy of Sciences. Thirdly, this study used Gravity Recovery and Climate Experiment (GRACE) satellite data on available water storage represented by terrestrial water storage. GRACE satellite data are an integrated estimation of water storage including groundwater, surface water, soil water content, and biological water content. This study adopted specific estimation methods from the literature [12].

2.2.4. GeoDetector

GeoDetector identifies spatial stratified heterogeneity and spatial patterns of attributes [40]. This study employed poverty incidence rate and poverty reduction rate as the dependent variable Y. The environmental factors discussed in the previous subsection were included as the explanatory variable X to assess the impact of environmental factors on poverty incidence and reduction and the general interaction between the explanatory and dependent variables. All tasks were performed using the following GeoDetector q-statistic:
q = 1 h = 1 L n h σ h 2 n σ 2
where n and σ 2 denote the total number of villages and variance in Y, respectively. Y is composed of L strata (h = 1, 2, …, L). In other words, n h and σ h 2 are the number of villages and variance in Y in stratum h, respectively. The unit q ranges between 0 and 1, with 0 indicating no coupling between Y and X, whereas q = 1 denotes that Y is determined by X. The value of q means that X explains 100 × q% of Y. The interaction relationship of two explanatory variables or factors is determined by the location of q(X1X2) in the five intervals: q(X1X2) = q(X1) + q(X2) means that two factors are independent with each other, q(X1X2) < Min(q(X1), q(X2)) means nonlinear weakening, Min(q(X1), q(X2)) < q(X1X2) < Max(q(X1), q(X2)) means univariate weakening, q(X1X2) > Max(q(X1), q(X2)) means bivariate enhancement, and q(X1X2) > q(X1) + q(X2) means nonlinear enhancement.

3. Results

3.1. Spatial Patterns

3.1.1. Overview of Spatial Distribution

Table 2 presents the basic poverty statistics in Lijiang. There were distinct differences in the poverty incidence and reduction rates among various county-level units. Gucheng District reported the lowest poverty level, whereas Ninglang County showed the highest. In terms of poverty reduction during 2014–2018, Yulong County and Gucheng District ranked as the top two regions, whereas Ninglang County ranked last. In addition, the global Moran’s I values for poverty incidence rate were 0.561 in 2014 and 0.591 in 2018, and the value for poverty reduction from 2014 to 2018 was 0.409. The z-values were all greater than the critical value of 2.56, and all passed the 1% statistical significance test. Thus, there were obvious positive spatial autocorrelation and agglomeration features in both poverty incidence and reduction. Villages with similar properties tended to form spatial clusters.

3.1.2. Changes in Spatial Pattern of Poverty Incidence During 2014–2018

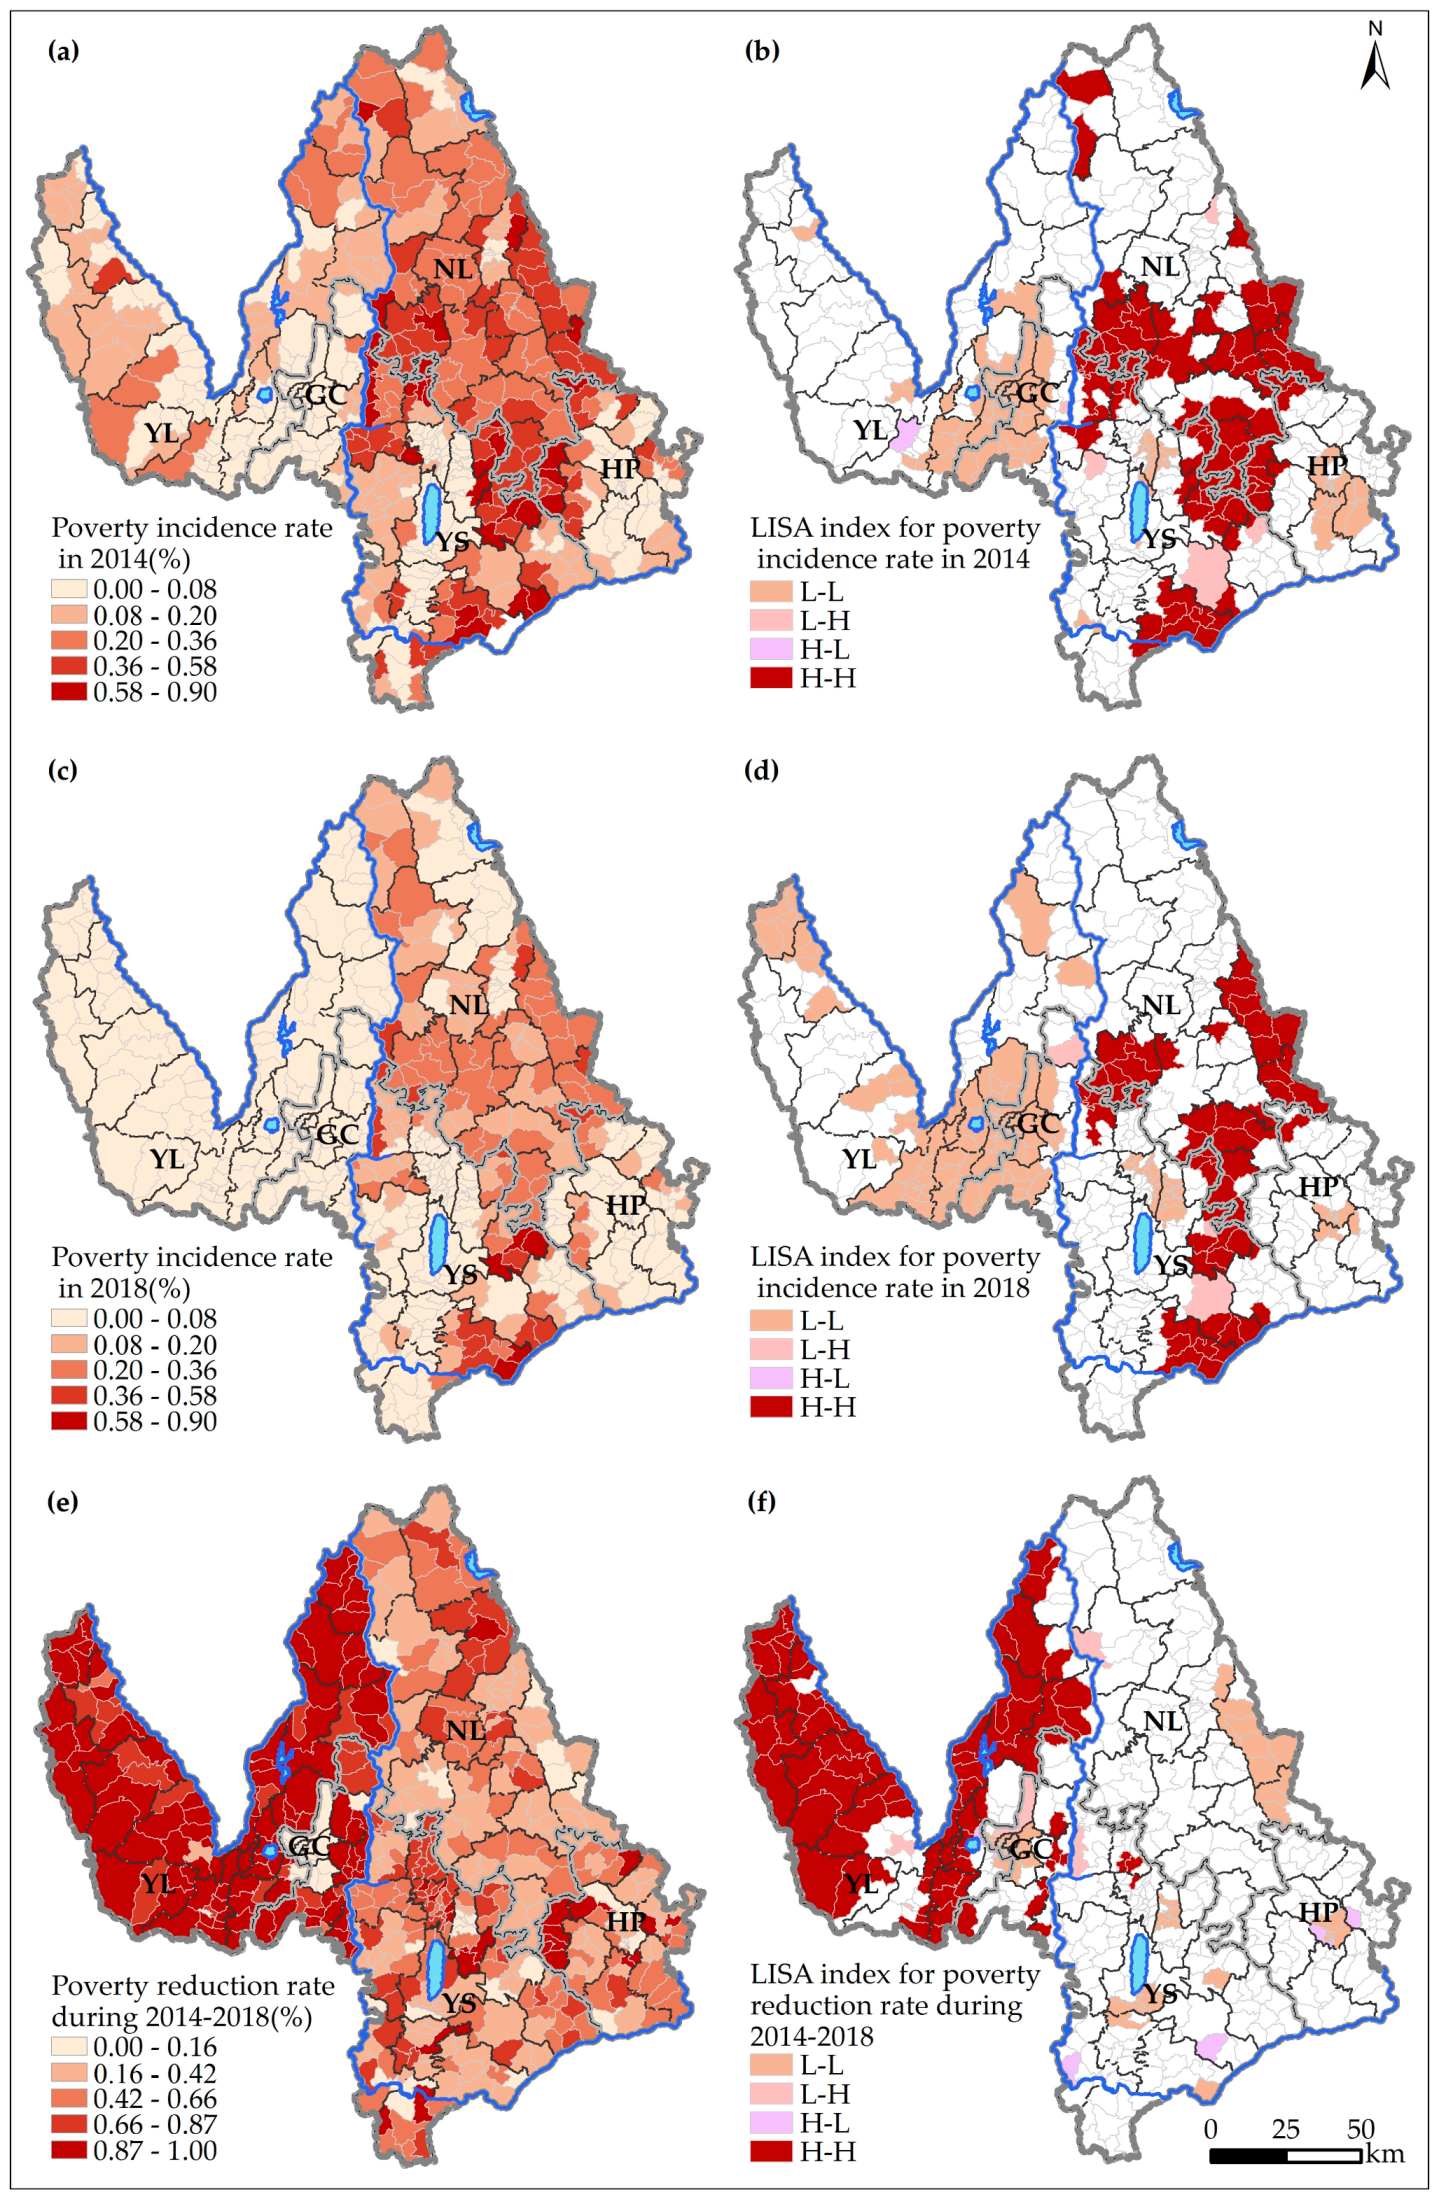
As shown in Figure 3a, this study first investigated the spatial pattern of poverty incidence at the village level. In 2014, the poverty incidence rate in east Lijiang was higher than that in west Lijiang. The poorer villages were mainly concentrated in Ninglang County, southeast Yongsheng County, northeast Yulong County, and the junction of three counties in east Lijiang. In certain villages, including Geke and Donghong, the poverty incidence rate was more than 90%. Figure 3b presents the spatial autocorrelation map of poverty incidence according to local Moran’s I data. The H-H clusters of poverty in 2014 were concentrated in the south Ninglang County, the southeast Yongsheng County, and the junction of three counties in east Lijiang. The L-L clusters were located in the west Gucheng District and central Huaping County. There was also an H-L village in Yulong County and some L-H villages in Yongsheng and Ninglang counties, all of which were distributed as islands and valleys in the overall layout.
As shown in Figure 3c, compared with the spatial pattern for 2014, the poverty incidence rate in most counties distinctly declined in 2018. However, the gap between east and west Lijiang strengthened during the four years. The poorer villages were mainly located in the south Ninglang and southeast Yongsheng counties. Most villages in the Yulong, Huaping, and east Yongsheng counties were no longer significantly poor areas. Figure 3d shows that the H-H cluster reduced in 2018 and was mostly concentrated in the south Ninglang and southeast Yongsheng counties. The L-L cluster was extended and mostly concentrated in Gucheng District, the east Yolong County, and the administrative central areas of the Yongsheng and Huaping counties. These patterns indicate that poverty is more likely to occur in marginal areas that are at a distance from the city center. In addition, there were two L-H villages in Gucheng District and Yongsheng County.

3.1.3. Spatial Pattern of Poverty Reduction During 2014–2018

Figure 3e shows an unbalanced spatial distribution of the poverty reduction rate from 2014 to 2018. The poverty reduction rate was generally higher in the west than in the east. Most villages in Yulong County and Gucheng District reported poverty reduction rates greater than 90%. However, few villages in the Yongsheng, Ninglang, and Huaping counties showed higher poverty reduction rates. Notably, certain communities in the Gucheng District reported a considerably low poverty reduction rate because they were located at the center of Lijiang, and their poverty levels were equal to 0 in 2014. Figure 3f illustrates the H-H clusters of poverty reduction that were mainly distributed in Yulong County, and the L-L clusters were primarily in Lannijing town and the east of Ninglang County. Further, the L-H clusters were located in east Lijiang, whereas the H-L clusters were distributed across east Lijiang. These findings reiterate the need and resultant advantages of overcoming poverty in west Lijiang.

3.2. Effects of Environmental Factors

3.2.1. Main Environmental Factors of Poverty Incidence

Table 3 reports the impact of various factors on poverty incidence estimated using GeoDetector. All factors passed the significance test, and thus, all the environmental factors considered in this study influenced poverty incidence by affecting people’s production and life, but they varied in magnitude denoted by q-values. It is noteworthy that the ranks of the q-values for 2014 and 2018 were not identical. However, irrespective of the year, administrative unit, distance to city center, available water storage, per capita cultivated area, and geological hazard risks remained dominant factors impacting poverty incidence rate in Lijiang. Administrative units reported the highest q-value and had the biggest influence on poverty, because villages in the same administrative division generally have similar natural environments. In addition, different administrative units tend to adopt different policies related to socioeconomic development and poverty reduction. Cities offer significantly higher employment opportunities and a wider market for the surrounding countryside. Thus, closer proximity to cities allows for greater labor export and an increase in income, both of which contribute to preventing poverty conditions. Water resources sustain population residence and agricultural production, and thus, water-scarce areas are more prone to poverty. Cultivated land is the material basis for agricultural production, and high per capita cultivated area often means greater production materials and less poverty. For example, the south-eastern Yulong County had a per capita cultivated area of about 0.2 hectare and a lower poverty incidence rate (Figure 2g). Geological hazard risks are closely associated with the safety of life and property. Villages subject to a high risk of geological disasters are not suitable for living and are more likely to be poor. Ninglang County, for example, reported higher geological hazard risks and greater poverty incidence (Figure 2i). Other environmental factors also affected poverty incidence, although their effects were weaker.

3.2.2. Main Environmental Factors of Poverty Reduction

Table 3 also reports GeoDetector’s estimation results for the indirect impact of various factors on poverty reduction. All factors passed the significance test. For poverty reduction during 2014–2018, the main environmental factors were administrative unit, available water storage, geological hazard risks, and distance to city center. This result was similar to that for poverty incidence. However, the factors differed in their influencing direction. Factors such as policy advantages for poverty reduction, high availability of water resources, few geological hazards, and close proximity to the city center were more positively related to the realization of poverty reduction. However, unlike the main factors of poverty incidence, agricultural production potential, relief degree of land surface, slope, and traffic accessibility ranked lower for poverty reduction.
The analysis further highlighted that topography and climate were not the main influencing factors for both poverty incidence and reduction, and their impact had been gradually decreasing. However, elevation was a relatively important factor influencing poverty reduction and was related to the government’s policy for altitude-based poverty reduction. Local governments often focus on high-elevation villages to alleviate poverty. Traffic accessibility also significantly affected poverty incidence, but it had the least significant effect on poverty reduction, thus indicating that lower traffic accessibility may influence poverty. Improving road facilities, however, is often not an effective method to alleviate poverty. That is, though certain poor regions have convenient transport conditions, they lack an industrial foundation and sufficient development momentum, making it difficult to shake off poverty.

3.2.3. Multivariate Interaction

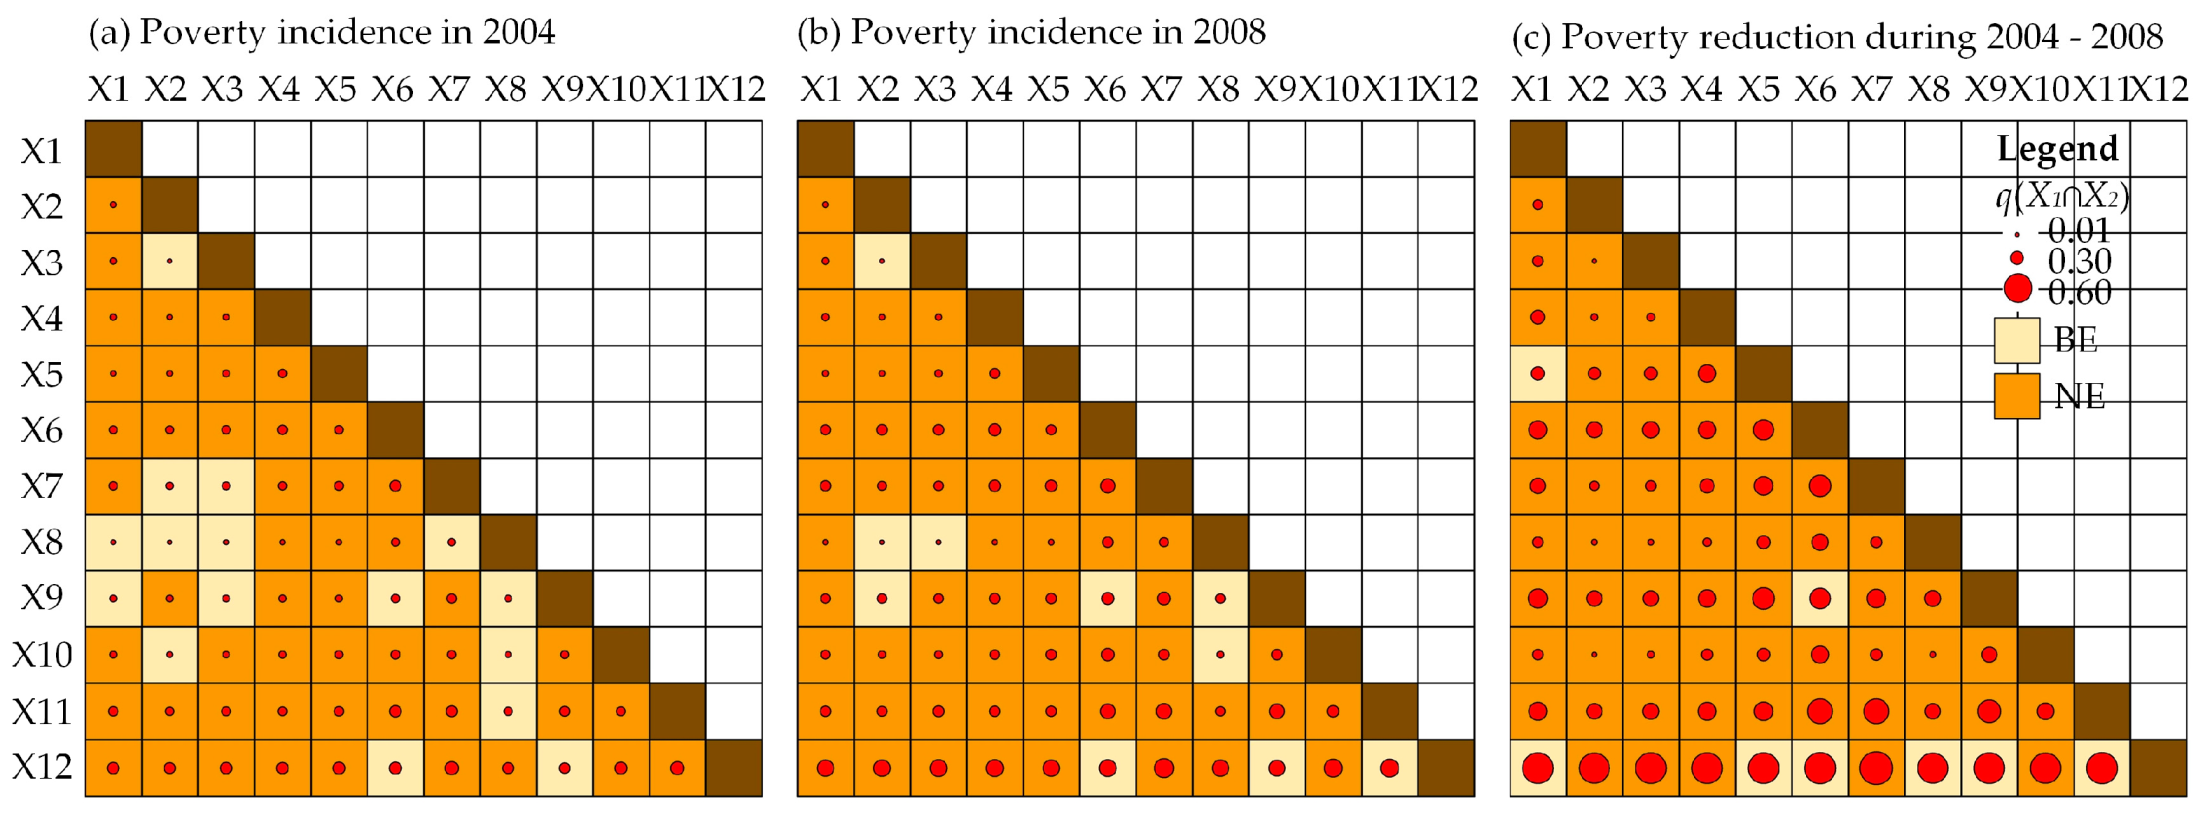
The environmental factors affecting poverty incidence and reduction may be independent, that is, there is no interaction between a pair of factors. However, they might interact with each other, and this means one factor can enhance or weaken other factors. Figure 4 shows there is multivariate interaction among different factors. For poverty incidence in 2014, all pairs had a higher joint impact than the corresponding individual variables, which means all factors enhanced each other. Moreover, most pairs, particularly administrative unit and distance to city center, reported significantly higher nonlinear enhancement than the sum of the factors. The interaction impact was as high as 0.401. In addition, certain pairs, such as factor pairs for agriculture production potential and geological hazard risks, showed bivariate enhancement, which suggests these pairs were more likely to enhance each other at a lower level. For poverty incidence in 2018, all pairs enhanced each other. Among them, this study observed an increase in nonlinear enhancement, but a decline in bivariate enhancement. Notably, there was an increase in the joint impact. The interaction impact between administrative unit and per capita cultivated area was higher, at 0.483. Compared with other pairs, the factor pairs for agriculture production potential and geological hazard risks can more easily enhance each other at a lower level.
For poverty reduction during 2014–2018, all pairs enhanced each other. In particular, more pairs reported nonlinear enhancement, whereas few showed bilateral enhancement. The interaction impact of poverty reduction was significantly greater than that of poverty incidence. The interaction impact between administrative unit and per capita cultivated area was the highest, at 0.565. Notably, a lower-level interaction impact was observed among the factor pairs of the administrative unit. That is, though other factors enhanced the role of policies in poverty reduction, their enhancement power was relatively low.

4. Discussion

4.1. Environmental Effects on Poverty Incidence and Reduction

Poverty in China is largely concentrated in remote rocky mountainous, border, and minority areas, indicating a significant cluster effect [41]. This study further examined the environmental effects on poverty incidence at the village level, and the findings highlight key factors influencing special regions and that these factors differ by geographical scale. In our case area, Lijiang Prefecture, available water storage, geological hazards, and per capita cultivated area are key environmental factors. Elevation, slope, and relief degree of land surface are often listed as factors indicative of mountains regions, however, they are not the most powerful factors. This research also investigated the relationship between the environment and poverty reduction. Notably, poverty incidence and reduction report similar key environmental factors, but they differ in influencing intensity and direction. For example, villages in Lijiang lacking water storage are more likely to fall into poverty, and those with abundant water resources more easily overcome poverty. Thus, the findings for the environmental effects on poverty incidence and reduction help us understand the nexus between poverty and the environment.
This study also finds that topography and climate are not dominant factors influencing poverty incidence and reduction in mountain areas, a viewpoint contrary to that presented in the extant literature. More specifically, the impact of topography and climate on poverty is relatively low and shows a downward trend. By contrast, elevation has a relatively larger impact on poverty reduction, possibly because the Lijiang government considers elevation as a standard to relocate villages and determine policy preferences. Consequently, numerous high-elevation villages have been relocated to county towns through government support. However, China’s poverty alleviation policy lacks uniform standards, and thus, local governments are biased in their implementation, preferring high-altitude areas in western mountainous areas. In other words, elevation-based poverty alleviation policies are unreasonable and ignore the critical impact of available water resources and geological hazards on farmers’ lives and productivity. High-elevation villages, in fact, can also establish characteristic industries of those set up on plateaus to achieve wealth. However, severe water shortages and frequent natural disasters endanger villagers, making these areas uninhabitable. Therefore, poverty alleviation policies should focus more on available water resources and geological hazards, and not only elevation.

4.2. Roles of Socioeconomic Factors

This study also finds that socioeconomic factors including the administrative unit, distance to city center, and traffic accessibility are important factors influencing poverty. Administrative units, in particular, are the most important influencing factors for both poverty incidence and reduction. County-level administrative units are a combination of macro-policy formulation and micro-policy implementation. These units tend to have different policies and represent various distribution directions of funds and resources. Policy intensity and direction may indirectly influence the degree of poverty incidence and reduction, which alludes to the critical role of policy in poverty incidence and reduction. Studies find that economic development, unemployment rate, and land resources are the most important factors associated with poverty incidence and reduction [17,42]. This study, however, reveals that policy plays an irreplaceable role in targeted poverty alleviation. Increased government investment and poverty alleviation projects aimed at joining targeted counties that form the administrative border will influence poverty incidence and reduction.
Distance to city center is also a significant influencing factor. The closer a village is to the city center, the more labor it exports, and there is greater access to public services. Lijiang is rich in tourism resources, and the development of its tourism industry provides numerous employment opportunities for local residents and its surrounding villages, which in turn can increase employment among surplus rural labor, contribute towards urbanization, and reduce poverty. Yulong County, for example, gradually overcame poverty between 2014 and 2018. This can be attributed to, not only the superior poverty alleviation policy, but also its proximity to Gucheng District. Other counties are located at a distance from Gucheng District and across the river and mountains, which forms a natural communication barrier. Most residents of Yulong County migrate to Gucheng District to work as taxi drivers, restaurant waiters, housekeeping staff, tourism security, and other low-paying occupations that, nevertheless, help meet food and clothing needs.
Finally, traffic is an important factor impacting poverty. On the one hand, researchers show that traffic infrastructure has a significantly positive effect on rural poverty reduction by increasing non-agricultural employment, reducing production costs, enhancing transport and labor transfers, improving social services, and developing rural tourism [43]. On the other hand, some scholars believe that traffic infrastructure has an insignificant effect on poverty reduction, and in fact, it widens the gap between villages. This study, however, shows that traffic accessibility significantly affects poverty, although it has the least significant effect on poverty reduction. That is, low traffic accessibility may be related to poverty, but improving accessibility does not necessarily reduce poverty.

4.3. Policy Implications

The findings of this study offer key policy recommendations. Firstly, the research emphasizes the importance of policies in poverty reduction. In the context of rural revitalization strategies and new-type urbanization, the government must promote both ruralization with new-type urbanization to create a policy environment that encourages rural revitalization. Related measures include tax concessions, interest-free loans, low land prices, and even free land to attract locals, particularly local elites, to return home and set up businesses and become consumers. To achieve local urbanization, the government should develop small towns as bridges to employment, education, medical care, and administrative services [18]. Secondly, to promote targeted poverty alleviation, local governments should focus on, not only policy and socioeconomic factors, but also targeted environmental factors affecting poverty incidence and reduction in all areas. Policymakers could, for example, consider available water resources and geological hazard factors in mountain areas. It is also necessary to relocate villages from uninhabitable areas with severe water deficiencies, which are prone to geological disasters. Further, it is imperative to build water conservation facilities and strengthen the prevention and control of geological disasters. Though traffic is not a necessary condition for poverty reduction, traffic infrastructure can be leveraged to create income sources for farmers to achieve self-reliance and reduce poverty. More specifically, it can be used to explore the resource advantages of villages to develop industries such as rural tourism, mango farming, and local medicines.

5. Conclusions

This study analyzed the spatial pattern and environmental factors of poverty incidence and reduction at the village level in Lijiang Prefecture using a spatial statistical method and GeoDetector tools. The study arrived at the following main conclusions. First, since 2014, poverty incidence in Lijiang has shown a declining trend, whereas poverty reduction had been increasing. The spatial distribution represents significant spatial heterogeneity and autocorrelation features. Second, the main environmental factors affecting poverty incidence and reduction are water resources and geological hazards. Socioeconomic factors such as administrative units and distance to the city center also play a key role. In particular, administrative units have the most significant influence, thus indirectly proving the importance of policy in poverty incidence and reduction. All factor pairs enhance each other, most pairs report nonlinear enhancement, and some show bivariate enhancement. Finally, existing poverty alleviation policies focus more on high elevation areas. However, available water resources and geological hazards should be the primary factors under consideration. It is imperative to promote the construction of water conservation facilities and strengthen the prevention and control of geological disasters in mountainous areas.
Despite the contributions of this study, it is not free from limitations. First, the poverty incidence and reduction measure based on the poverty line only identifies poverty in economic dimensions, and thus, does not consider the multidimensional nature of poverty. Second, this study focuses on Lijiang and, therefore, the policy implications apply to regions with similar conditions. To comprehensively analyze the nexus between poverty and the environment, it is important to consider environmental factors relevant to other regions. Finally, the GeoDetector tools only explain force, not direction. Multidimensional poverty indices will play a critical role in poverty measurement, and higher fidelity estimates for poverty using information technology will ensure accurate identification and targeted poverty alleviation. In addition, individual-level field surveys are necessary to provide deeper insight on the nexus between poverty and the environment.

Author Contributions

Conceptualization, methodology, formal analysis, investigation, visualization, and writing—original draft preparation, P.G.; writing—review and editing, methodology, validation, and funding acquisition, S.L.; methodology, formal analysis, writing—review and editing, W.Q.; methodology, formal analysis, and investigation, H.Q. All authors have read and agreed to the published version of the manuscript.

Funding

This research was funded by the Strategic Priority Research Program of the Chinese Academy of Science, grant No. XDA19040402, and the National Natural Science Foundation of China, grant Nos. 41771180, 41661144023, and 41701165.

Acknowledgments

The authors are grateful for the reviewers and the editor.

Conflicts of Interest

The authors declare no conflict of interest.

References

  1. Zhang, J.; Zuo, F.; Zhou, Y.; Zhai, M.; Mei, L.; Fu, Y.; Cheng, Y. Analyzing Influencing Factors of Rural Poverty in Typical Poverty Areas of Hainan Province: A Case Study of Lingao County. Chin. Geogr. Sci. 2018, 28, 1061–1076. [Google Scholar] [CrossRef] [Green Version]
  2. Haushofer, J.; Fehr, E. On the psychology of poverty. Science 2014, 344, 862–867. [Google Scholar] [CrossRef] [PubMed]
  3. Liu, Y.; Liu, J.; Zhou, Y. Spatio-temporal patterns of rural poverty in China and targeted poverty alleviation strategies. J. Rural Stud. 2017, 52, 66–75. [Google Scholar] [CrossRef]
  4. Griggs, D.; Stafford-Smith, M.; Gaffney, O.; Rockström, J.; Öhman, M.C.; Shyamsundar, P.; Noble, I. Policy: Sustainable development goals for people and planet. Nature 2013, 495, 305–307. [Google Scholar] [CrossRef] [PubMed]
  5. Eshelman, R.S. Revolt of the Gadgets. Baffler 2012, 19, 101–106. [Google Scholar] [CrossRef]
  6. Chen, M.; Sui, Y.; Liu, W.; Liu, H.; Huang, Y. Urbanization patterns and poverty reduction: A new perspective to explore the countries along the Belt and Road. Habitat Int. 2019, 84, 1–14. [Google Scholar] [CrossRef]
  7. Sachs, J.D. The End of Poverty; Penguin Press: London, UK, 2005. [Google Scholar]
  8. Reardon, T.; Lansing, E.; Vosti, S.A.; Food, I. Links Between Rural Poverty and the Environment in Developing Countries: Asset Categories and Investment Poverty. World Dev. 1995, 23, 1495–1506. [Google Scholar] [CrossRef]
  9. UNDPC. China, the Millenium Development Goals, and the Post-2015 Development Agenda; UNDPC: Beijing, China, 2015. [Google Scholar]
  10. World Bank. World Development Report 2015: Mind, Society, and Behavior; World Bank: Washington, DC, USA, 2015. [Google Scholar]
  11. Guo, Y.; Zhou, Y.; Cao, Z. Geographical patterns and anti-poverty targeting post-2020 in China. J. Geogr. Sci. 2018, 28, 1810–1824. [Google Scholar]
  12. Wang, L.; Chen, L. Analysis: The impact of new transportation modes on population distribution in Jing-Jin-Ji region of China. Sci. Data 2018, 5, 1–15. [Google Scholar] [CrossRef] [Green Version]
  13. Fransman, T.; Yu, D. Multidimensional poverty in South Africa in 2001–16. Dev. S. Afr. 2018, 36, 1–31. [Google Scholar] [CrossRef] [Green Version]
  14. Alkire, S.; Foster, J. Counting and multidimensional poverty measurement. J. Public Econ. 2011, 95, 476–487. [Google Scholar] [CrossRef]
  15. Wen, Q.; Shi, L.; Ma, C.; Wang, Y. Spatial heterogeneity of multidimensional poverty at the village level: Loess Plateau. Acta Geogr. Sin. 2018, 73, 1850–1864. [Google Scholar]
  16. Ren, Q.; Huang, Q.; He, C.; Tu, M. The poverty dynamics in rural China during 2000–2014: A multi-scale analysis based on the poverty gap index. J. Geogr. Sci. 2018, 28, 1427–1443. [Google Scholar] [CrossRef] [Green Version]
  17. Nasution, D.H.; Bangun, P.; Sitepu, H.R. Factors that Affect Poverty Areas in North Sumatera Using Discriminant Analysis. IOP Conf. Ser. Mater. Sci. Eng. 2018, 335, 012043. [Google Scholar] [CrossRef]
  18. Liu, Y.; Li, Y. Revitalize the world’s countryside. Nature 2017, 548, 275–277. [Google Scholar] [CrossRef] [PubMed]
  19. Magombeyi, M.T.; Odhiambo, N.M. Poverty dynamics in Botswana: Policies, trends and challenges. Cogent Soc. Sci. 2017, 3, 1–12. [Google Scholar] [CrossRef]
  20. UN (United Nations). Poverty [EB/OL]. Available online: https://wayback.archive-it.org/10611/20160908121214/http://www.unesco.org/new/en/social-and-human-sciences/themes/international-migration/glossary/poverty/ (accessed on 20 May 2019).
  21. Ferreira FH, G.; Chen, S.; Dabalen, A.; Dikhanov, Y.; Hamadeh, N.; Jolliffe, D.; Yoshida, N. A global count of the extreme poor in 2012: Data issues, methodology and initial results. J. Econ. Inequal. 2016, 14, 141–172. [Google Scholar] [CrossRef] [Green Version]
  22. UNDP (United Nation Development Programme). Global multidimensional poverty index 2019 [EB/OL]. Available online: https://max.book118.com/html/2019/0715/7112146026002041.shtm (accessed on 20 May 2019).
  23. Henderson, V. Measuring Economic Growth from Outer Space. Am. Econ. Rev. 2009, 102, 994–1028. [Google Scholar] [CrossRef] [Green Version]
  24. Llorente, A.; Garcia-herranz, M.; Cebrian, M.; Moro, E. Social Media Fingerprints of Unemployment. PLoS ONE 2015, 10, e0128692. [Google Scholar] [CrossRef] [Green Version]
  25. Dubm, S. Network Diversity and Economic Development. Science 2010, 328, 1029–1032. [Google Scholar]
  26. Blumenstock, J.E. Fighting poverty with data. Science 2016, 353, 753–754. [Google Scholar] [CrossRef] [PubMed]
  27. Zhou, L.; Xiong, L. Concentration or diffusion? Exploring the emerging spatial dynamics of poverty distribution in Southern California. Cities 2018, 90, 282–292. [Google Scholar]
  28. Pan, J.; Hu, Y. Spatial Identification of Multi-dimensional Poverty in Rural China: A Perspective of Nighttime-Light Remote Sensing Data. J. Indian Soc. Remote Sens. 2018, 46, 1093–1111. [Google Scholar] [CrossRef]
  29. Curtis, K.J.; Lee, J.; O’Connell, H.A.; Zhu, J. The Spatial Distribution of Poverty and the Long Reach of the Industrial Makeup of Places: New Evidence on Spatial and Temporal Regimes. Rural Sociol. 2018, 84, 28–65. [Google Scholar] [CrossRef] [PubMed] [Green Version]
  30. Ma, Z.; Chen, X.; Chen, H. Multi-scale Spatial Patterns and Influencing Factors of Rural Poverty: A Case Study in the Liupan Mountain Region, Gansu Province, China. Chin. Geogr. Sci. 2018, 28, 296–312. [Google Scholar] [CrossRef] [Green Version]
  31. Cali, M.; Menon, C. Does urbanization affect rural poverty? Evidence from Indian districts. World Bank Econ. Rev. 2013, 27, 171–201. [Google Scholar] [CrossRef] [Green Version]
  32. Fosu, A.K. The effect of income distribution on the ability of growth to reduce poverty: Evidence from rural and urban African economies. Am. J. Econ. Sociol. 2010, 69, 1034–1053. [Google Scholar] [CrossRef]
  33. McKernan, S.; Ratcliffe, C. Transitioning in and Out of Poverty. Urban Inst. 2009, 9, 1–2. [Google Scholar]
  34. Stevens, A.H.; Davis, U.C. Transitions into and out of Poverty in the United States. Policy Brief, Center for Poverty Research [EB/OL]. Available online: https://poverty.ucdavis.edu/policy-brief/transitions-out-poverty-united-states (accessed on 12 June 2019).
  35. Gray, L.C.; Moseley, W.G. A Geographical Perspective on Poverty-Environment Interactions. Geogr. J. 2012, 171, 9–23. [Google Scholar] [CrossRef]
  36. Scott, L. Chronic Poverty and the Environment: A Vulnerability Perspective. SSRN Electron. J. 2006, 8, 1–26. [Google Scholar] [CrossRef]
  37. Schleicher, J.; Schaafsma, M.; Burgess, N.D.; Sandbrook, C.; Danks, F.; Cowie, C.; Vira, B. Poorer without It? The Neglected Role of the Natural Environment in Poverty and Wellbeing. Sustain. Dev. 2018, 26, 83–98. [Google Scholar] [CrossRef] [Green Version]
  38. Lv, L.; Sun, F.; Huang, R. Innovation-based urbanization: Evidence from 270 cities at the prefecture level or above in China. Acta Geogr. Sin. 2018, 73, 1910–1922. [Google Scholar]
  39. RESDC (Resources and Environmental Sciences Data Center). China’s agricultural production potential data sets [EB/OL]. Available online: http://www.resdc.cn/DOI (accessed on 20 March 2019).
  40. Wang, J.; Xu, C. Geodetector: Principle and prospective. Acta Geogr. Sin. 2017, 72, 116–134. [Google Scholar]
  41. Liu, Y.; Li, J. Geographic detection and optimizing decision of the differentiation mechanism of rural poverty in China. Acta Geogr. Sin. 2017, 72, 161–173. [Google Scholar]
  42. Scott, S.; Conacher, A. Land Degradation and Poverty. Nat. Sustain. 2008, 46, 1–3. [Google Scholar] [CrossRef]
  43. Guo, J.; Zhang, B.; Zhang, X. Study on Rural Poverty Reduction Effect of Traffic Infrastructure. Asian Agric. Res. 2014, 6, 4–8. [Google Scholar]
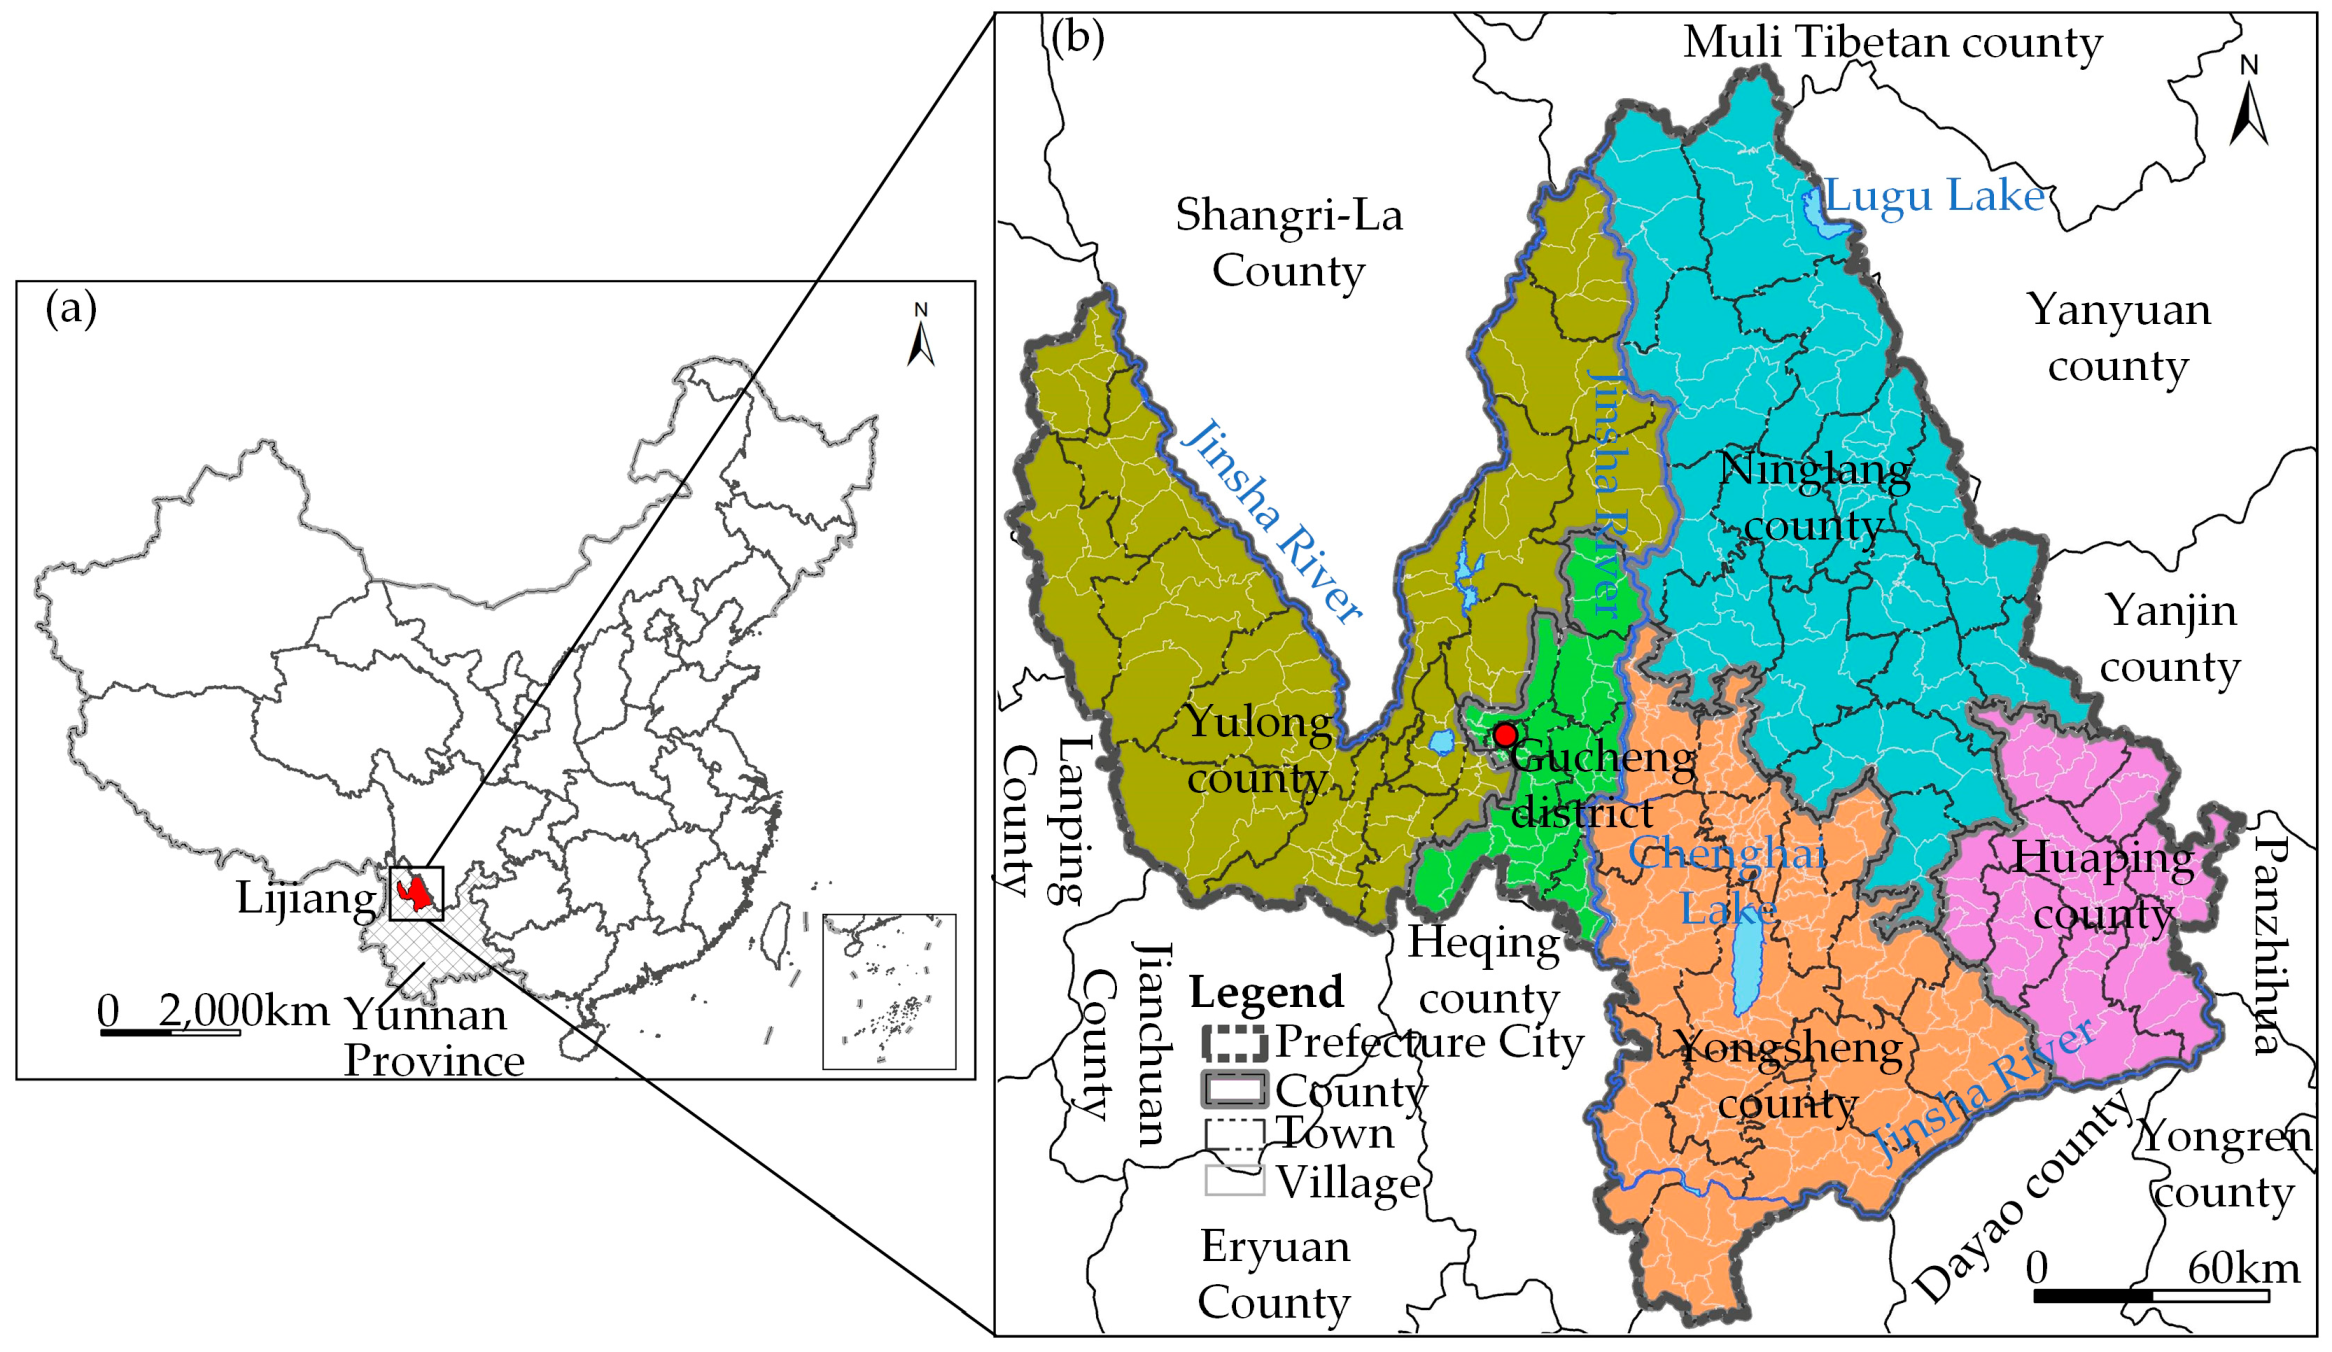
Figure 1. The geographical location of the study area: (a) Map of the study area in China, (b) One district and four counties in Lijiang Prefecture.
Sustainability 12 01066 g001
Figure 2. Spatial pattern of 12 potential environmental factors: (a) Elevation. (b) Slope. (c) Relief degree of land surface. (d) Average annual precipitation. (e) Average annual temperature. (f) Available water storage. (g) Per capita cultivated area. (h) Agricultural production potential. (i) Geological hazard risks. (j) Traffic accessibility. (k) Distance to city center. (l) Administrative unit.
Sustainability 12 01066 g002
Figure 3. Spatial difference and autocorrelation pattern of poverty incidence and reduction in Lijiang: (a) The spatial distribution of poverty incidence rate in 2014. (b) The spatial distribution of LISA index for poverty incidence rate in 2014. (c) The spatial distribution of poverty incidence rate in 2018. (d) The spatial distribution of LISA index for poverty incidence rate in 2018. (e) The spatial distribution of poverty reduction rate during 2014–2018. (f) The spatial distribution of LISA index for poverty reduction rate during 2014–2018. Notes: Gucheng District (GC), Yulong County (YL), Yongsheng County (YS), Ninglang County (NL), Huaping County (HP).
Sustainability 12 01066 g003
Figure 4. The joint impact of environmental factors on poverty incidence and reduction rates during 2014–2018: Bivariate enhancement (BE), nonlinear enhancement (NE), elevation (X1), slope (X2), relief degree of land surface (X3), average annual precipitation (X4), average annual temperature (X5), available water storage (X6), per capita cultivated area (X7), agricultural production potential (X8), geological hazard risk (X9), traffic accessibility (X10), distance to city center (X11), administrative unit(X12).
Sustainability 12 01066 g004
Table 1. Potential factors influencing poverty incidence and reduction.
CategoriesEnvironmental FactorsUnitResolutionData Resources and Processing
TopographyX1: Elevationm90 mDownload from the Resources and Environmental Sciences Data Center (RESDC)
X2: Slope°90 mCalculated by Slope Tool in Spatial Analysis Tools based on elevation data
X3: Relief degree of land surface (RDLS)m90 mCalculated by Focal Statistics Tool in Spatial Analysis Tools based on elevation data
ClimateX4: Average annual precipitationmm1 kmDownload from the RESDC
X5: Average annual temperature°C1 kmDownload from the RESDC
Water resourcesX6: Available water storagemm/yr1 kmUsing Gravity Recovery and Climate Experiment (GRACE) satellite data (level 2, release 05) from three institutes: the Center for Space Research (CSR), the Geo Forschungs Zentrum (GFZ), and the Jet Propulsion Laboratory (JPL)
Land resourcesX7: Per capita cultivated areaha/person1 kmObtained from Lijiang Municipal Government
X8: Agricultural production potentialkg/ha1 kmDownload from the RESDC
Natural risksX9: Geological hazard risks/1 kmObtained from Lijiang Municipal Government
TrafficX10: Traffic accessibilitykm1 kmCalculated by Cost Distance Tool in Spatial Analysis Tools based on various traffic data
LocationX11: Distance to city centerkm1 kmCalculated by Distance Tool in Spatial Analysis Tools
PolicyX12: Administrative unit/1 kmDummy variable takes the value of 1 for Gucheng District, 2 for Yulong County, 3 for Huaping County, 4 for Ninglang County, and 5 for Yongsheng County
Table 2. Basic statistics of poverty incidence and reduction during 2014–2018.
Area Name P , 2014 P I R , 2014 P , 2018 P I R , 2018 R , 2014 2018 P R R , 2014 2018
Gucheng District18801.23%1370.09%174392.71%
Yulong County15,6787.13%11680.52%14,51092.55%
Yongsheng County61,54815.26%29,2187.19%32,33052.53%
Huaping County17,13710.67%61973.83%10,94063.84%
Ninglang County79,34128.82%46,86216.79%32,47940.94%
Lijiang Prefecture175,58414.49%83,5826.81%92,00252.40%
Notes: P , t denotes the number of poverty population in year t , P I R , t denotes the poverty incidence rate in year t , R , t denotes the number of poverty reduction population over a period of time, and P R R , t denotes the poverty reduction rate over a period of time.
Table 3. Power of environmental factors in poverty and poverty reduction rates.
Factors P I R , 2014 P I R , 2018 P R R , 2014 2018
qprankqprankqprank
Elevation0.030090.0120110.03806
Slope0.0270120.0150100.002011
Relief degree of land surface0.037080.020080.005010
Average annual precipitation0.0270110.016090.02108
Average annual temperature0.0280100.0060120.06005
Available water storage0.113030.121020.11502
Per capita cultivated area0.111040.092050.03707
Agricultural production potential0.039070.022070.01409
Geological hazard risk0.083050.108030.11403
Traffic accessibility0.063060.045060.0020.01512
Distance to city center0.129020.099040.10804
Administrative unit0.251010.331010.46601
Notes: P I R , t denotes the poverty incidence rate in year t , P R R , t denotes the poverty reduction rate over a period of time. q-statistic denotes the influence of the environmental factors, p-value is a parameter used to determine the significance of a hypothesis test.