Article

A Graphical Tool to Estimate the Air Change Efficiency in Rooms with Heat Recovery Systems

by
Alberto Meiss
*,
Miguel Ángel Padilla-Marcos
*,
Irene Poza-Casado
and
Antonio Álvaro-Tordesillas
E.T.S. Arquitectura, Universidad de Valladolid, 47014 Valladolid, Spain
*
Authors to whom correspondence should be addressed.
Sustainability 2020, 12(3), 1031; https://doi.org/10.3390/su12031031
Submission received: 17 December 2019 / Revised: 20 January 2020 / Accepted: 28 January 2020 / Published: 31 January 2020
(This article belongs to the Special Issue Energy Sustainability in the Building Sector)

Abstract

:
Indoor air quality in buildings must be guaranteed for the health and comfort of the occupants. In order to assess the ventilation strategy of a considered room, the parameter of the air change efficiency ( ε a ) can be used. The objective of this work is to provide designers with a graphical tool for a reliable estimate of the value of ε a of a room. The temperature gradient between the outdoor air supply and the indoor air is so low that the ventilation flow can be assumed as isothermal when high-efficiency heat recovery systems are used. By means of charts, the optimal location of the openings for a better ε a can be determined during the design process, in order to subsequently apply them. It is concluded that it is very important to consider the ε a in the case of openings located in facing walls given that its range varies between 40% and 65%. In contrast, its use can be obviated in the case of openings located in non-facing walls, as the value of ε a obtained is close to 50%; this means a perfect mixing air flow pattern, which is the reference value for the estimation of the indoor air quality (IAQ) in the different national regulations.

1. Introduction

The air quality in indoor environments is essential for the well-being of their occupants. Therefore, ventilation is one of the systems that has the greatest impact on the health and comfort of occupants. People from countries included in the Organization for Economic Co-operation and Development (OECD) spend most of their lives inside artificial environments and between 60% and 90% of that time inside buildings [1].
Considering these data, in order to achieve good indoor air quality (IAQ), it is necessary to ensure adequate air change inside the living space. Different national building regulations include requirements regarding IAQ based on performance that entails enough outdoor air flow (presumably fresher than indoor air) to guarantee the dilution and subsequent exhaust of the polluted air. In addition, the complementary implementation of other strategies, such as the control of the source, the located exhaust, and the filtration and purification of the air is desirable.
On the other hand, buildings are nowadays a key sector within the energy context in developed countries. For example, in the European Union (EU), they represent 40% of total primary energy consumption [2]. According to different countries, ventilation represents approximately between 20% and 30% of the total of this value [3].
The adoption of energy-saving measures focused only on the discretionary reduction of ventilation flow rates that deteriorate the IAQ. In contrast, the installation of heat recovery systems allows for maintaining the necessary ventilation flow rates without a great energy impact [4].
Heat recovery systems, due to their design, regain most of the thermal energy contained in the exhaust air flow. Their standard efficiency varies depending on the air flow (a greater flow means less efficiency) and the temperature difference―outdoor and indoor―between the exchange flows (a greater gradient means better efficiency).
A maximum temperature gradient below ± 4.0 °C was obtained when considering outdoor air from -5 °C in winter to 40 °C in summer and with the indoor air comfort temperature from 21 °C to 23 °C (Figure 1). As a consequence, when high-efficiency heat recovery systems are used (with in-situ performance efficiency above 85% [5]), the fresh air supply can be assumed to be an isothermal flow with respect to the indoor air temperature. Therefore, the evaluation of the IAQ from the air pattern using the air change efficiency, ε a , concept under isothermal conditions is simplified [6,7,8,9,10]. In buildings, this concept is very useful in order to ensure adequate IAQ in rooms when it is not possible to identify any local contaminant source [11].
This ventilation air flow runs through the building in a more or less efficient way. However, different regulations assume a perfect mixing model when establishing the minimum ventilation flow rates, and designers normally base ventilation on this presumption. A more detailed study would lead to numerical computational fluid dynamics (CFD) simulations in each room, which is expensive in terms of specialization and time.
Based on these assumptions, the objective of this work is the elaboration of a graphical tool to directly estimate ε a depending on the relative position of the inlet and exhaust openings. In this way, the designer can verify if the ventilation strategy proposed with the air flow rates in regulations can achieve the minimum IAQ conditions.

2. Materials and Methods

The characterization of the air flow pattern, according to IAQ criteria and ε a , is possible through the calculation of the local and average age of the air [12] and the derived ε a [11]. Consequently, a numerical and experimental systematic study was carried out in several building rooms. The experimental results served as the benchmark for the correct configuration of the subsequent numerical model.
ε a can be defined as the relationship between the shortest time needed to renovate the air, or turn-over time ( τ t ), and the corresponding average time of exchange of air ( τ ¯ e x c ) [13]:
ε a     =   τ t τ ¯ e x c 100   ( % ) ,
In an experimental and numerical study, ε a is calculated as the relationship between the local mean age of the exhaust air ( τ e ) and twice the room average age of air 〈 τ ¯ 〉 (taking the optimal theoretical model or “piston model" as a reference):
ε a     =   τ e 2 · τ ¯ 100   ( % ) ,
where the local mean age of the air, τ e , is a statistical value of the average time it takes fresh air particles to flow from the inlet to the point under study (in this case, the exhaust). With the average value of the local age of all the air in the room, the room average age of the air was obtained, 〈 τ ¯ 〉 [14].
The real value of ε a obtained in the room is compared to the reference value of ε a = 50% set by the different national regulations, which assume a perfect mixing model. Additionally, it must be taken into account that there are certain variables that have an impact on the value of ε a for a certain room, as they determine the air flow pattern [15]:
  • The relative location of the inlet and exhaust air openings;
  • The supply of positively or negatively buoyant air;
  • The envelope airtightness;
  • The momentum of the jet;
  • The discharge Archimedes number; and
  • The magnitude and location of the contaminant sources.
When ε a > 50%, the air flow pattern tends toward the piston model. Thus, the ventilation air flow is higher than strictly necessary, given that the resulting IAQ is better than the minimum IAQ established in regulations. If ε a < 50%, the pattern tends toward the short-circuit model. Therefore, the ventilation flow is insufficient, as the resulting IAQ is poorer than the minimum IAQ required to comply with regulations. Hence, it may be the case that, although the prescriptive flows are fulfilled, there is a ventilation deficit inside the room. In other words, the system is not efficient when it comes to providing fresh air to those areas of the room that require it [15].
This research focused on the characterization of the impact of the relative location (vertical and horizontal distance) of the inlet and exhaust openings on the air flow pattern. This parameter is essential to determine the efficiency, ε a , which is the dilution and exhaust capacity of polluted air through ventilation with heat recovery [16]. The other concepts previously listed are not determining because of the following [17]:
  • The effects of buoyancy and Archimedes number result in a temperature gradient between the outdoor and indoor air that is minimised in rooms with an air inlet by high-efficiency heat recovery systems. In circulation areas and rooms with an air exhaust, the air flow acquires the temperature of the indoor air, adopting an isothermal behaviour;
  • The hot/cold surfaces inside the rooms impact the air flow pattern locally, but the overall value of the average age of the air in the room remains unchanged. Therefore, the ε a remains constant [15,17,18];
  • Energy-efficient buildings have construction systems that avoid uncontrolled air flow through the envelope. This can be verified if there is compliance with strict infiltration limits by means of onsite pressurization tests [19];
  • A high ventilation jet velocity ensures the mixing of the indoor air. However, the loss of velocity caused by air mixing does not affect the overall efficiency of the system [15];
  • The use of the air change efficiency parameter, ε a , is recommended in the literature [20] to characterize rooms where the location of the contaminating source is not specified and, at the same time, an adequate IAQ is desired in the entire volume of the room.

2.1. Basis for the Experimental Study

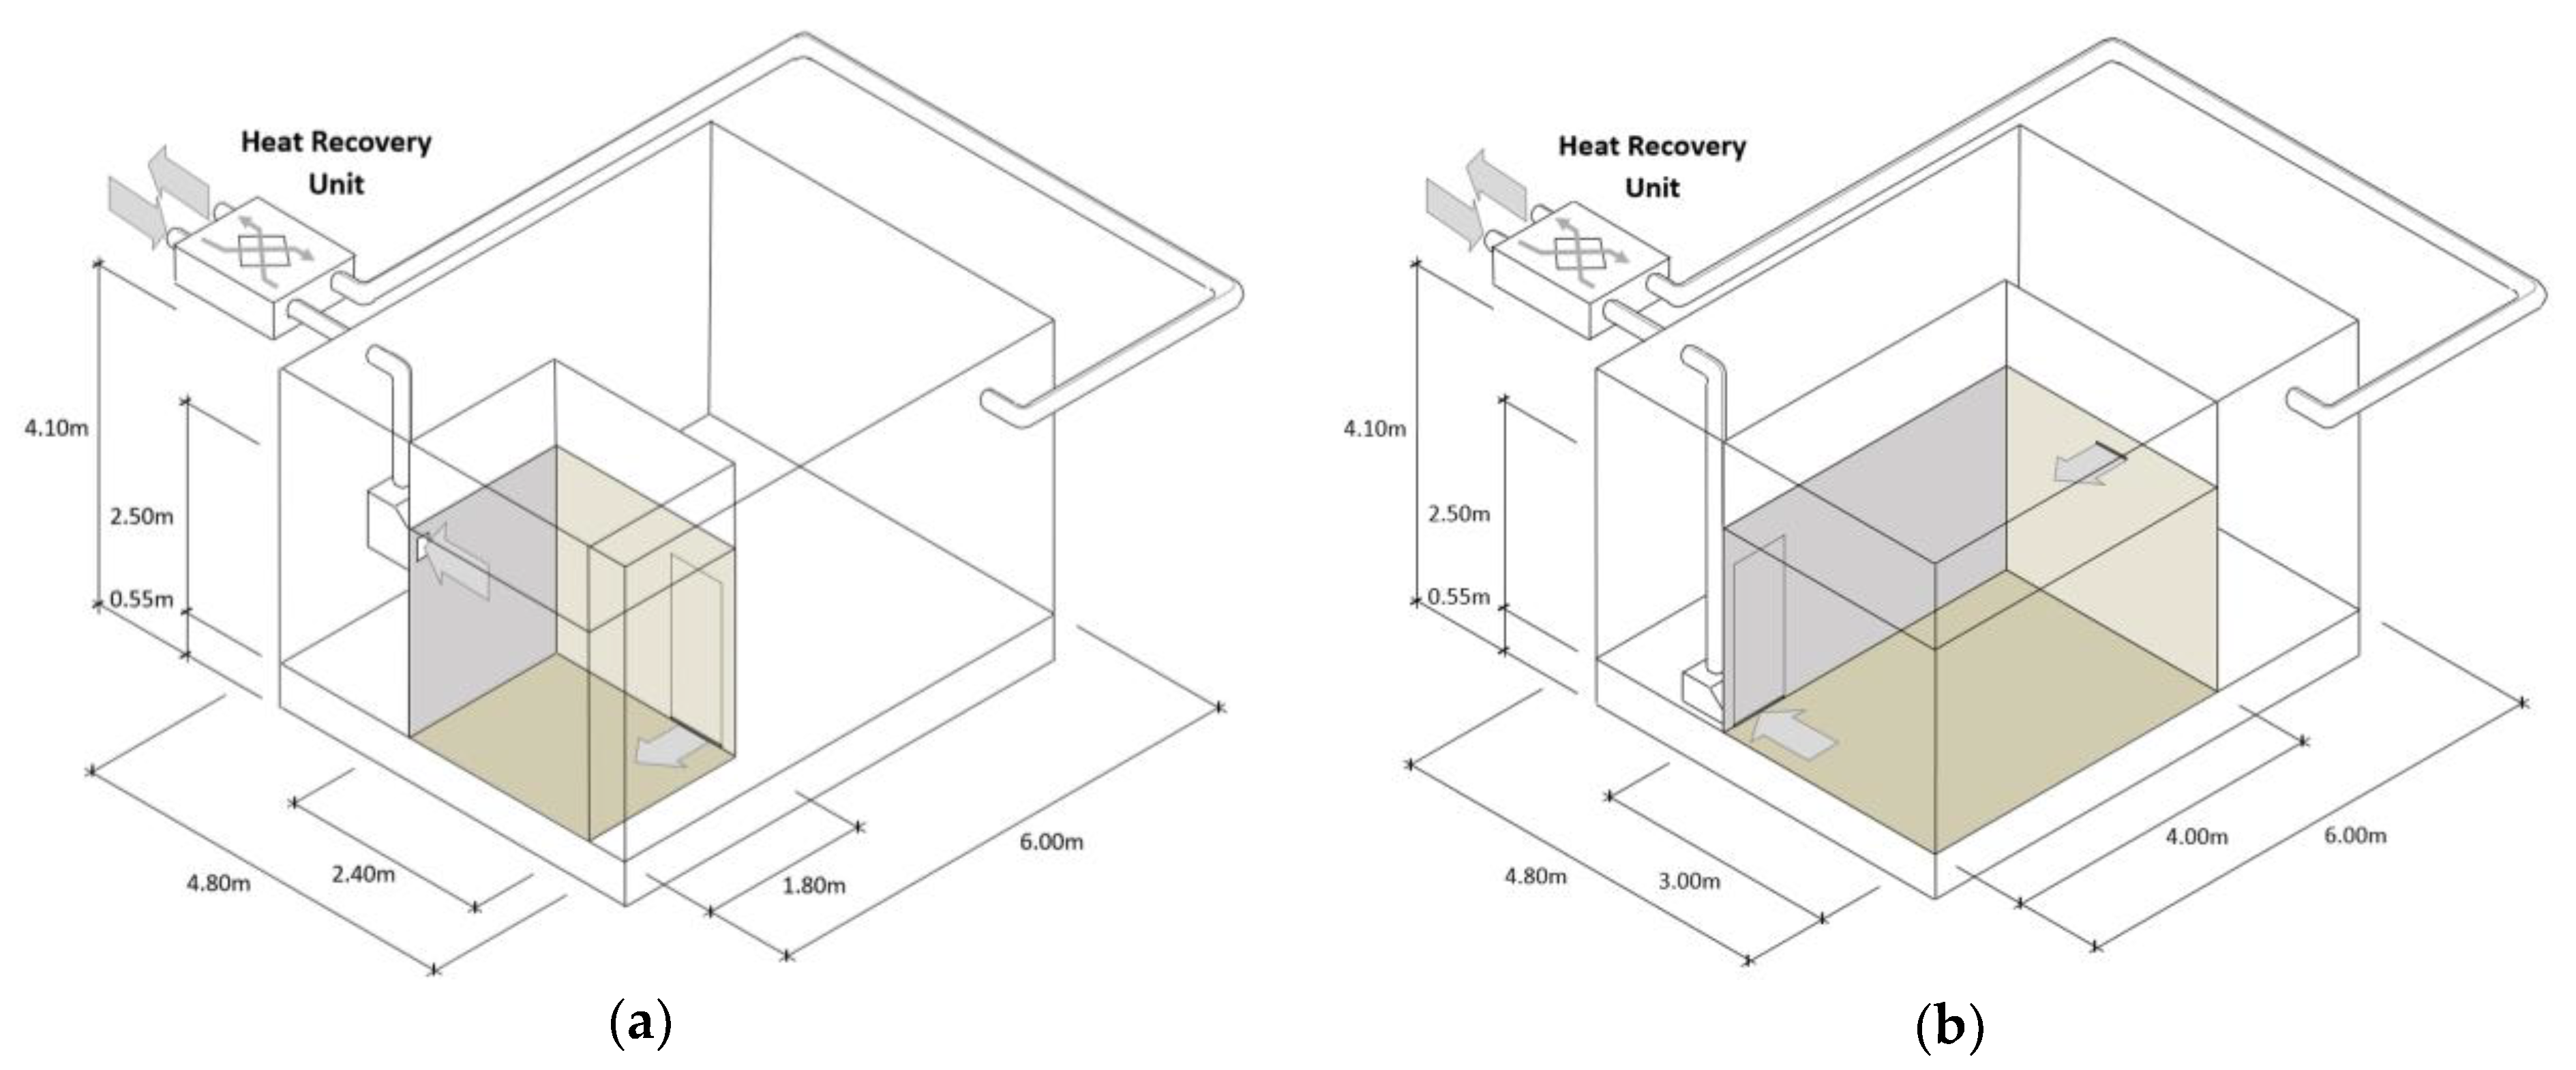
A test chamber to the scale of 1:1 in the HS3 Ventilation Laboratory of the School of Architecture of the University of Valladolid (Spain) was used to develop the experimental study of the air flow pattern using tracer gases. The inner chamber was versatile, with mobile panels inside the larger chamber space. Two configurations of rooms were made―a smaller one whose dimensions were 1.80 × 2.20 × 2.50 m and a larger one whose dimensions were 3.00 × 4.00 × 2.50 m. Both rooms had ventilation openings (inlet and exhaust) located at different heights (Figure 2).
In order to characterize the air flow, the local mean age of the air was measured at validation points (Figure 3) at two different heights—0.75 (↓ symbol) and 2.00 m (↑ symbol) over the floor (10 points (5 × 2) in the small room and 18 points (9 × 2) in the large room). In the process, a Brüel & Kjær 1303 multipoint sampler and a Brüel & Kjær 1302 doser and multi-gas analyzer were used to measure the tracer gas concentrations contained in the air samples.
The following boundary conditions were established for each experimental test:
  • The opening of doors, windows, or any other factor that could cause a non-steady regime were not considered. The objective was to analyze the efficiency complying with the minimum ventilation conditions without the impact of the occupants’ behavior;
  • Incompressible flow: the Mach number reached an approximate value of 0.00734, with a higher velocity around the air jet. The density variation due to the pressure gradient was negligible;
  • The local mean age of the air in the inlet was set to zero;
  • The air flow through the openings was perpendicular to the envelope. The inlet had no moving parts or obstacles that could cause a variation of the air flow through them;
  • Constant air flow velocity was set, depending on the type of air inlet, between 1.25 and 2.50 m/s, (that is, air flow rates between 10 and 15 l/s, respectively). It was verified that a variation in the jet velocity and in the global volumetric ventilation flow does not have an impact on the overall value of ε a , as a previous experimental research had already demonstrated [16];
  • The turbulence intensity considered was 5% and the length of the inlet scale 0.01 m [14];
  • The outdoor air supply was thermally conditioned by a heat recovery device. Efficiency values of the heat recovery system between 81% and 86% were obtained, depending on the outdoor/indoor temperature difference from May to February. Due to the efficiency of the heat recovery system, the obtained temperature gradient between the outdoor air supply and the indoor comfort temperature was in the range of + 2.88 and −3.10 °C in all the tests. The surfaces of the volume were considered smooth and isothermal regarding the comfort indoor air temperature (23 °C).
To obtain the age of the air, 78 tests were made according to the tracer gas SF6 concentration decay technique [13], calculating the local age of the air, τ p , in a three-point series: two of them as control points and the other in the air exhaust, τ e . The procedure consisted of injecting tracer gas (sulfur hexafluoride) directly inside the room, using a mixing fan to create an initial uniform reference concentration (200 mg of SF6/m3). Once the desired concentration was achieved, the fan stopped and the concentration values were measured at the control points [21]. It is worth mentioning that the test-chamber design minimized uncontrolled infiltrations (with an air change rate no lower than 0.10 h−1, according to pressurization test EN ISO 9972:2019 [22].
At the end of the test campaign, each validation point was supported by a series of six values. The obtained mean relative deviations of the experimental measurements were +1.58% and −1.65% (95% confidence interval (CI)). These values were considered adequate to characterize the existing flow pattern [23]. These values allowed for the subsequent validation of the numerical model.

2.2. Basis for the Numerical Study

The numerical study was performed using the ANSYS Fluent R18.0 © software. The computational domain of the simulations comprised the whole volume of each room. In the case of validation, the three-dimensional model of the fluid domain geometry was simulated with a structured hexahedral mesh. This mesh was non-uniformly designed, refining those areas with large air velocity gradients and near the walls of the room. Meshing conditions aimed for a finer grid and a dimensionless wall distance ( y + ), which would correspond to a partially laminar boundary layer. It was verified that a step-steady simulation process based on “standard wall functions (SWF)” and “Enhanced Wall Treatment” with the SIMPLE simulations model allowed for reaching the most accurate results for the cases established. With these conditions established, the mesh had the following characteristics (Table 1):
With these conditions, a sensitivity study of the mesh was performed. Approximately 7.5·105 cells defined the validation model, with an orthogonal quality of the mesh (skewness) of 1.
The configuration of the operational conditions was adjusted to the test chamber in a steady simulation, as well as the boundary conditions involved in the calculation. The irregular, chaotic, and unpredictable nature of the turbulent air flow justified the use of statistical methods. The turbulence models that use the Reynolds Average Navier-Stokes (RANS) equations [9,24,25] are based on these principles. Specifically, the k-ε models (standard, RNG, and realisable κ-ε) were adopted in successive approximations of the equation process. Fifteen thousand iterations were performed for the model (1500 iterations in standard k-ε with standard wall functions as near-wall treatment, 3500 iterations in renormalization group scheme with standard wall functions, 5000 iterations in renormalization group model with enhanced wall treatment as near-wall treatment, and 5000 iterations in realizable turbulence model with enhanced wall treatment) [26,27]. The process required the evaluation of the convergence of continuity with residual results close to 1·e−6, guaranteeing the basic principles of consistency, convergence, and stability (Lax–Friedrichs theorem) [28].
For both openings, the intensity of length and turbulence length were set to 5% and 0.01 m, respectively. A velocity condition was imposed on the outlet opening, while a pressure condition was imposed on the inlet opening.
Once the simulation was calculated and using user-defined functions (UDF), it was possible to obtain the local age of the air, τ p , at the validation points.
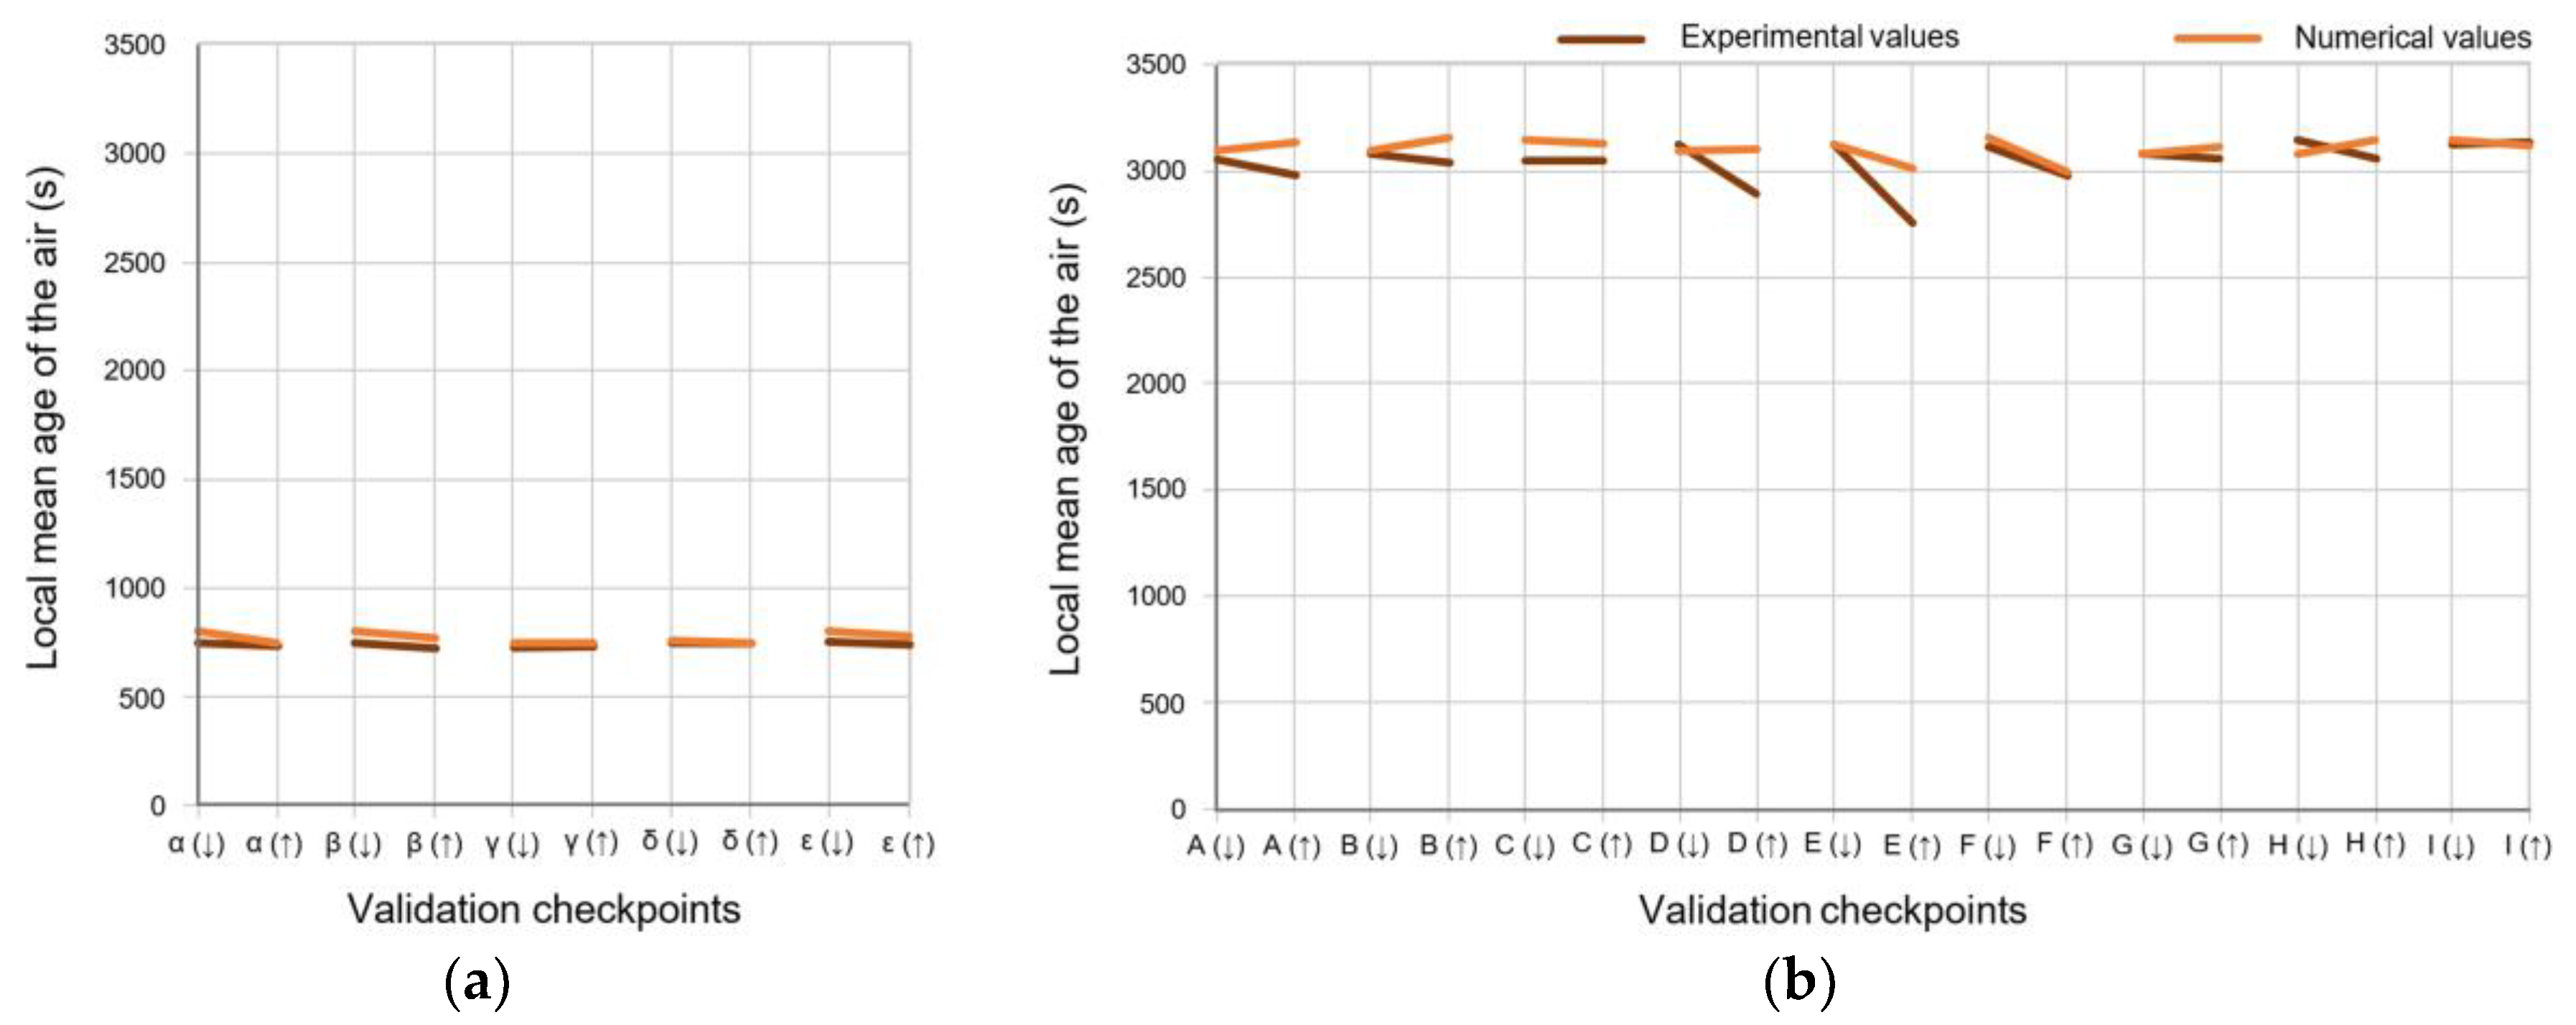
Furthermore, the adopted configuration could be validated by means of the comparison with the values calculated in the experimental procedure. Thus, the relative average deviations obtained were +2.91% and −0.77% (95% CI) (Figure 4).
The further development of the numerical study consisted of applying the CFD configuration to the study of several rooms [29]. In this sense, and with the aim of including the most common dimensions of rectangular rooms, 29 different morphologies were defined (Figure 5). These dimensions represent common sizes of dwellings, offices, small classrooms, small working rooms, etc. from 1.44 m2 (3.60 m3) up to 35.28 m2 (88.20 m3). The mesh was adapted to the simulated volume for each case after the pertinent sensitivity study, and, in some cases, the models varied from 5.0·105 to 2.1·106 cells. Lastly, different locations of the inlet and exhaust openings in the simulated rooms were adopted, placing them on opposite or adjacent walls (X- and Y-axis) and at different heights (Z-axis). In this way, 1152 cases were simulated, determining the efficiency, ε a , in each of them.

3. Results and Discussions

The effect of the location of the openings was determined through numerical simulation. The results obtained were represented in a graph that related the air change efficiency, ε a , obtained according to the location of the exhaust with respect to the air inlet. A trend based on the X and Y distances that separate the axes from the openings has been verified.
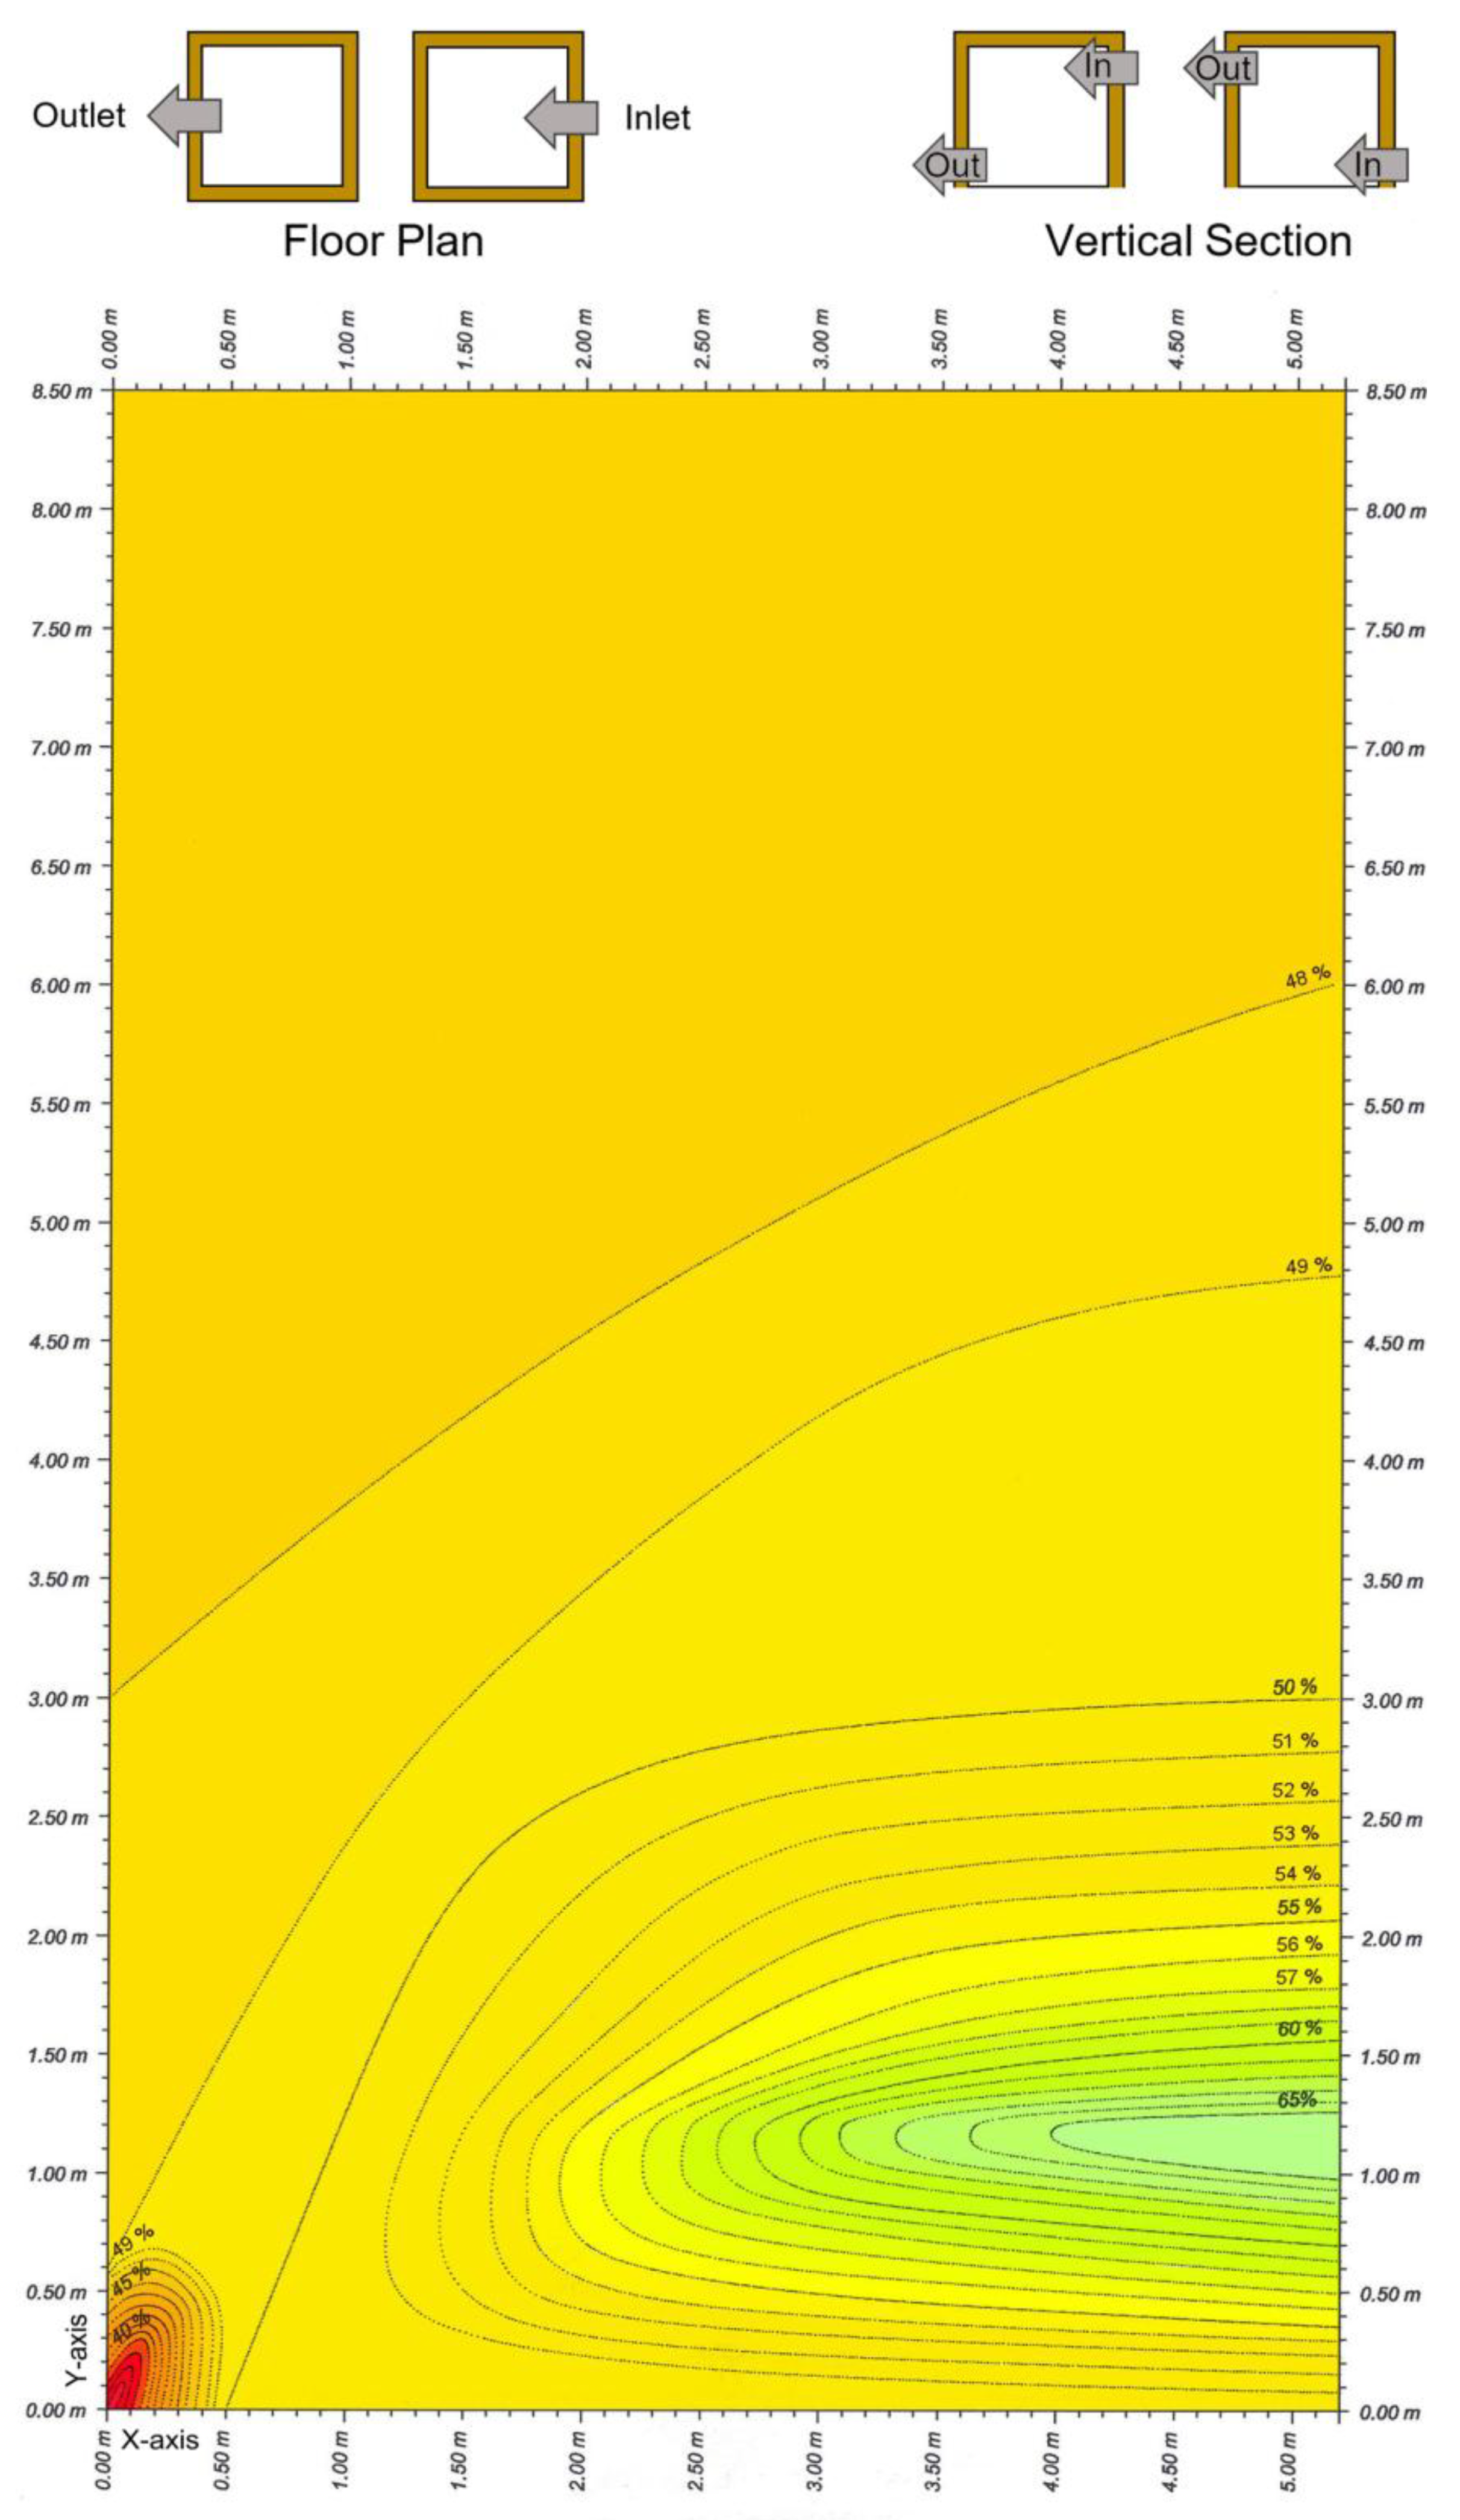
An example of the configurations when rooms had openings facing each other and at a similar height is shown in Figure 6. The trend shows that ε a increased with the distance along the Y-axis. A physical explanation is that the closer the openings were to each other, the greater the proportion of incoming fresh air that left the room through the exhaust without removing the pollutants concentrated inside.
The charts show how the tool developed allowed for the estimation of ε a in the rooms described. It was obtained that on opposite walls, where the guideline of the air inlet and the air exhaust was parallel (Figure 7 and Figure 8), the air flow pattern acquired more or less efficient models, depending on the case.
It can be seen that if openings are located in opposite walls, facing each other, in most cases perfect mixing models were achieved ( ε a ≈ 50%). There were also two areas with significantly lower and higher efficiency values. The best efficiency values were due to the fact that in a rectangular room (with its length in the X-axis), the air flow tended toward the piston model.
In the other cases, where the openings were located in non-facing walls (Figure 9 and Figure 10) and the air-inlet guideline was perpendicular to the exhaust, models that could be assumed to have perfect air mixing were obtained in all the simulated configurations. In these cases, the concept of cross ventilation was fulfilled in the rooms.
When analyzing these results, it is verified that in professional practice, it is often assumed that fresh air is always mixed with the indoor air, obtaining a perfect mixing ( ε a ≈ 50%) and that, therefore, a homogeneous and adequate IAQ within the room would be guaranteed when the ventilation flows stipulated by national regulations are accomplished.
However, it can be seen that, if the location of the air inlet and the exhaust in rooms are not properly studied, it is possible to get ε a < 50% and an air flow pattern tending toward a short circuit. In this case, the indoor air is not renewed adequately despite complying with the ventilation flows established in regulations. Thus, most of the fresh air does not remove the pollutants emitted and concentrated inside the room. Furthermore, in large areas of the room, there can be concentrations of pollutants that exceed acceptable levels of IAQ. As a consequence of this low efficiency ε a , a necessary increase of the ventilation air flow should be considered in order to reach a minimum of IAQ, with the subsequent energy waste.
Another case to consider is when the location of openings in a room allows for obtaining an efficiency of ε a > 50%. In this case, the air flow pattern acquires certain characteristics of piston flow, being, thus, more efficient than a perfect air mixing model. Therefore, the designer is able to guarantee a better IAQ or a reduction of the ventilation air flow after a new evaluation of the efficiency, until reaching an average age of the air, τ ¯ , equivalent to the initial perfect air mixing model.

4. Conclusions

The ventilation designer must be able to incorporate in a project the concept of air change efficiency, ε a , modeling the air flow in the most efficient way from the inlet to the exhaust of the room. In this way, the best possible IAQ for the projected room is guaranteed.
This study provides a graphical tool by means of charts that allow for a quick and reliable estimation of ε a in rooms where the temperature of the air inlet is similar to the indoor air temperature (even with a gradient of ± 4 °C). Due to the presence of high-efficiency heat recovery systems is it possible to assume the air flow as practically isothermal.
These charts are the result of a systematic numerical study of 1152 cases. The desirable process consists of searching, through the charts, for those locations of the openings which have better ε a and applying them in the designed space (See Appendix A for an example of application).
Given that the usual assumption that fresh air is always mixed with the indoor air, obtaining a perfect mixing ( ε a ≈ 50%), has been proved to be inaccurate, this procedure provides reliable values of ε a . Thus, the ventilation designer does not need to model each room with CFD software. In addition, it provides general guidelines concerning the most suitable location of the openings.
In the event that the location of these openings was subject to restrictions that affect the design, it would be possible to previously know an estimate of the efficiency, ε a , and be able to look for alternative solutions (for example, varying the relative height between them) in order to minimize the adverse effects detected.

Author Contributions

The laboratory tests were performed by A.M. Analyses of the data were carried out by A.M., M.Á.P.-M., and I.P.-C. The graphical tool was developed by A.Á.-T. The research principles and methods of the study were developed by A.M. and M.Á.P.-M. All authors have read and agreed to the published version of the manuscript.

Funding

This study was funded by the research project EPACRA: Lanzadera project. “Study of air flow patterns in radiating conditioning systems”, reference number TCUE.6-LANZADERA 067/157541.

Conflicts of Interest

The authors declare no conflict of interest. The funders had no role in the design of the study; in the collection, analysis, or interpretation of data; in the writing of the manuscript; or in the decision to publish the results.

Abbreviations

ε a air change efficiency
τ ¯ room average age of the air
τ e local mean age of the exhaust air
τ ¯ e x c average time of exchange of air
τ p local mean age of the air
τ t turn-over time
CFDcomputational fluid dynamics
CIconfidence interval
IAQindoor air quality
UDFuser-defined functions
y + dimensionless wall distance

Appendix A. Example of Application

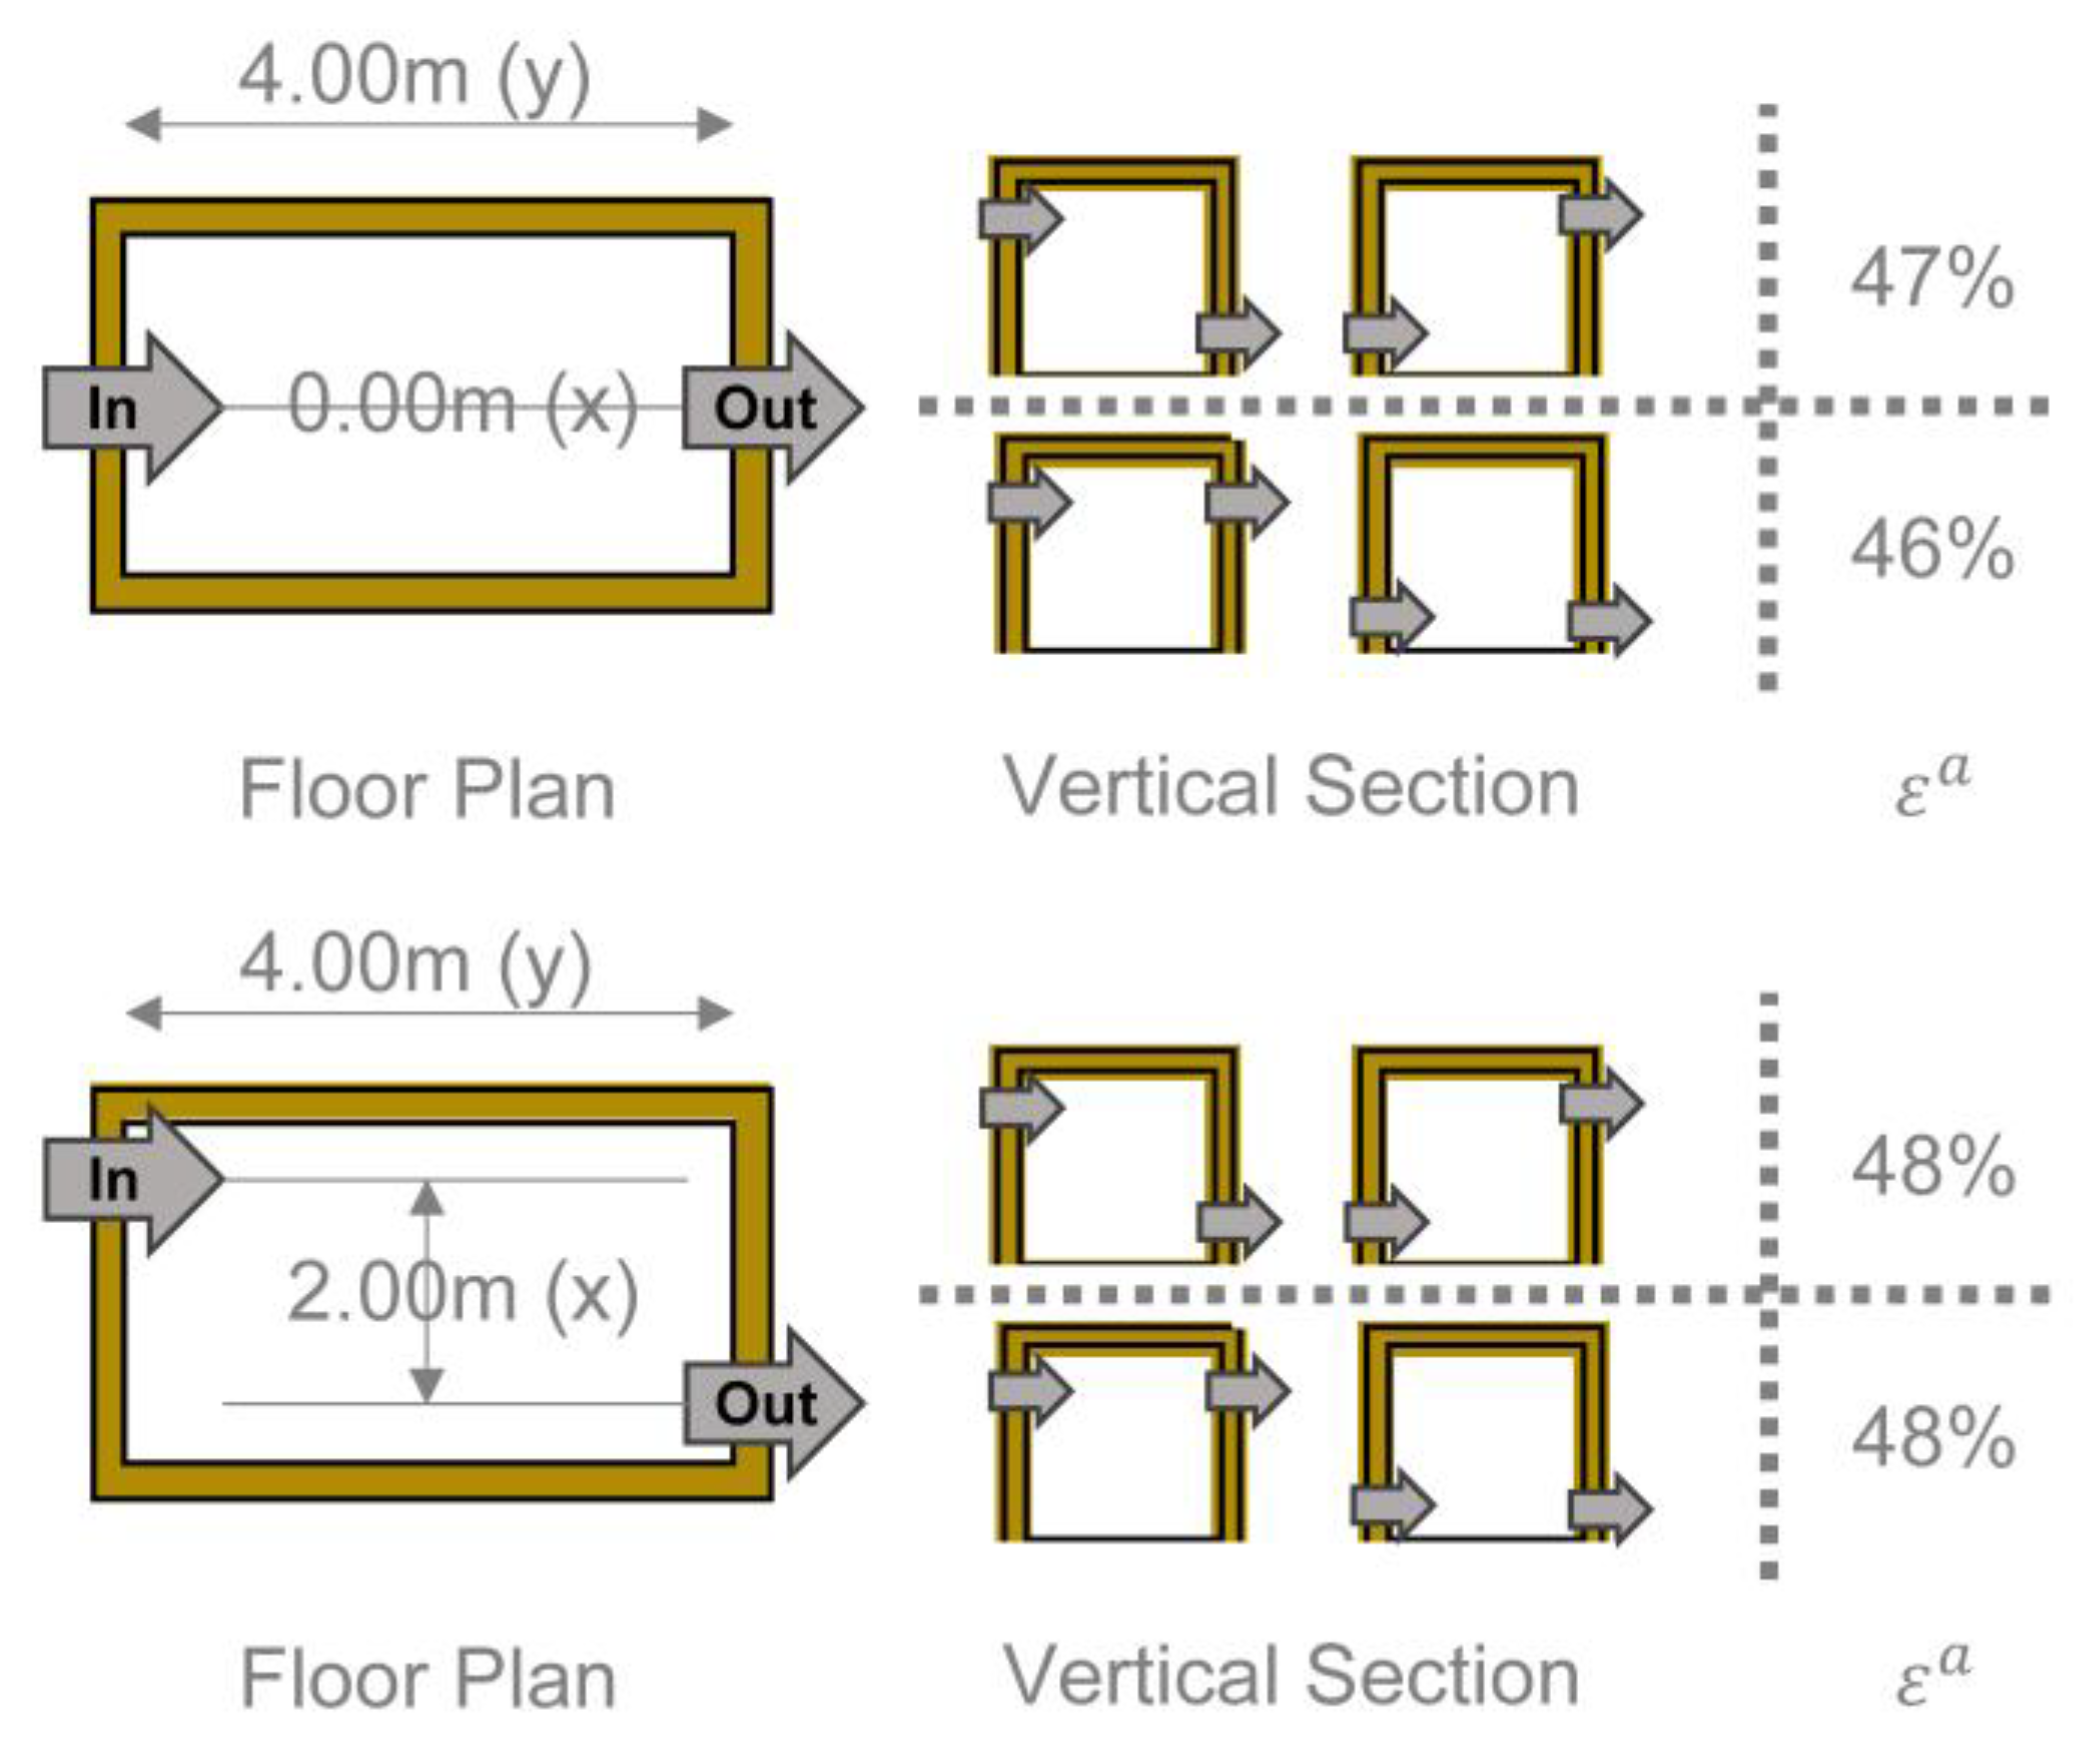
For example, in the case of a hospital room, with dimensions of 4.00 × 2.50 × 2.50 m (10 m2), where the correct flow of ventilation must be ensured, different locations of the inlet and exhaust openings can be chosen.
The use of abaci allows the air change efficiency to be determined directly for each opening arrangement. Therefore, it is possible to evaluate comparatively better and worse solutions.
Figure A1. Different values of ε a with openings located in opposite walls.
Sustainability 12 01031 g0a1aSustainability 12 01031 g0a1b
Figure A2. Different values of ε a with Openings located in non-facing walls.
Sustainability 12 01031 g0a2

References

  1. Wargocki, P. Ventilation, Indoor Air Quality, Health, and Productivity. In Ergonomic Workplace Design for Health, Wellness, and Productivity, 1st ed.; Hedge, A., Ed.; CRC Press: Boca Raton, FL, USA, 2016. [Google Scholar]
  2. Eurostat. Final Energy Consumption by Sector (2017 Data). Available online: https://ec.europa.eu/eurostat/databrowser/view/ten00124/default/table?lang=en (accessed on 1 December 2019).
  3. National Institute for Health and Welfare (THL). HealthVent Health-Based Ventilation Guidelines for Europe Project; Deliverable 8: Report on the impact of guideline implementation on health and energy; National Institute for Health and Welfare: Kuopio, Finland, 2012.
  4. Guillén-Lambea, S.; Rodríguez-Soria, B.; Marín, J.M. Review of European ventilation strategies to meet the cooling and heating demands of nearly zero energy buildings (nZEB)/Passivhaus. Comparison with the USA. Renew. Sustain. Energy Rev. 2016, 62, 561–574. [Google Scholar] [CrossRef]
  5. Mikola, A.; Simson, R.; Kurnitski, J. The impact of Air Pressure Conditions on the Performance of Single Room Ventilation Units in Multi-Story Buildings. Energies 2019, 12, 2633. [Google Scholar] [CrossRef] [Green Version]
  6. Kwon, K.-S.; Lee, I.-B.; Han, H.-T.; Shin, C.-Y.; Hwang, H.-S.; Hong, S.-W.; Bitog, J.P.; Seo, I.-H.; Han, C.-P. Analysing ventilation efficiency in a test chamber using age-of-air concept and CFD technology. Biosyst. Eng. 2011, 110, 421–433. [Google Scholar] [CrossRef]
  7. Ameen, A.; Cehlin, M.; Larsson, U.; Karimipanah, T. Experimental Investigation of Ventilation Performance of Different Air Distribution Systems in an Office Environment-Heating Mode. Energies 2019, 12, 1835. [Google Scholar] [CrossRef] [Green Version]
  8. Dijkstra, H.A. Ventilation Efficiency in an L-Shaped Room. Master’s Thesis, University of Technology, Eindhoven, The Netherlands, 18 June 2015. [Google Scholar]
  9. Rabanillo-Herrero, M.; Padilla-Marcos, M.A.; Feijó-Muñoz, J.; Gil-Valverde, R.; Meiss, A. Ventilation efficiency assessment according to the variation of opening position in L-shaped rooms. Build. Simul. 2020, 13, 213–221. [Google Scholar] [CrossRef]
  10. Hormigos-Jiménez, S.; Padilla-Marcos, M.A.; Meiss, A.; González-Lezcano, R.A.; Feijó-Muñoz, J. Computational fluid dynamics evaluation of the furniture arrangement for ventilation efficiency. BSERT 2018, 39, 557–571. [Google Scholar] [CrossRef]
  11. Mundt, E.; Mathisen, H.M.; Nielsen, P.V.; Moser, A. Ventilation Effectiveness. Guidebook nº2, 1st ed.; Mundt, E., Ed.; Federation of European Heating and Ventilation Association REHVA: Helsinki, Finland, 2004. [Google Scholar]
  12. Davidson, L.; Olsson, E. Calculation of age and local purging flow rate in rooms. Build. Environ. 1987, 22, 111–127. [Google Scholar] [CrossRef]
  13. Sandberg, M. What is ventilation efficiency? Build. Environ. 1981, 16, 123–135. [Google Scholar] [CrossRef]
  14. Sandberg, M.; Sjöberg, M. The use of moments for assessing air quality in ventilated rooms. Build. Environ. 1983, 18, 181–197. [Google Scholar] [CrossRef]
  15. Etheridge, D.; Sandberg, M. Building Ventilation. Theory and Measurement, 1st ed.; John Wiley & Sons Ltd.: Baffins Lane, UK, 1996. [Google Scholar]
  16. Meiss, A. Study of the Air Change Efficiency in Dwellings from Architectural Design Parameters. Ph.D. Thesis, Universidad de Valladolid, Valladoid, Spain, 2009. [Google Scholar]
  17. Meiss, A.; Feijó-Muñoz, J.; García-Fuentes, M.A. Age-of-the-air in rooms according to the environmental condition of temperature: A case study. Energy Build. 2013, 67, 88–96. [Google Scholar] [CrossRef]
  18. Rabanillo-Herrero, M.; Padilla-Marcos, M.A.; Feijó-Muñoz, J.; Meiss, A. Effects of the radiant heating system location on both the airflow and ventilation efficiency in a room. Indoor Built Environ. 2019, 28, 372–383. [Google Scholar] [CrossRef]
  19. Šadauskienė, J.; Paukštys, V.; Šeduikytė, L.; Banionis, K. Impact of Air Tightness on the Evaluation of Building Energy Performance in Lithuania. Energies 2014, 7, 4972–4987. [Google Scholar] [CrossRef] [Green Version]
  20. Roos, A. On the Effectiveness of Ventilation, 1st ed.; Rutten, P., Mattheij, R.M.M., ter Morsche, H.G., Eds.; Technische Universiteit Eindhoven: Eindhoven, The Netherlands, 1999. [Google Scholar]
  21. Sherman, M.H. Tracer-gas techniques for measuring ventilation in a single zone. Build. Environ. 1990, 25, 365–374. [Google Scholar] [CrossRef]
  22. European Committee for Standardization. EN-ISO 9972:2015. Thermal Performance of Buildings. Determination of Air Permeability of Buildings. Fan Pressurization Method; International Organization for Standardization: Geneva, Switzerland, 2015. [Google Scholar]
  23. Sherman, M.H. Uncertainty in air flow calculations using tracer gas measurements. Build. Environ. 1989, 24, 347–354. [Google Scholar] [CrossRef] [Green Version]
  24. Nielsen, P.V.; Allard, F.; Awbi, H.B.; Davidson, L.; Schälin, A. A Computational Fluid Dynamics in Ventilation Design Guidebook nº10, 1st ed.; Nielsen, P.V., Ed.; Federation of European Heating and Ventilation Association REHVA: Helsinki, Finland, 2007. [Google Scholar]
  25. Gilani, S.; Montazeri, H.; Blocken, B. CFD simulation of stratified indoor environment in displacement ventilation: Validation and sensitivity analysis. Build. Environ. 2016, 95, 299–313. [Google Scholar] [CrossRef]
  26. Wilcox, D.C. Turbulence Modelling for CFD, 2nd ed.; Wilcox, D.C., Ed.; DCW Industries Inc.: Palm Drive, Beverly Hills, CA, USA, 1994. [Google Scholar]
  27. Murakami, S.; Kato, S. Numerical and experimental study on room airflow–3-D predictions using the k-e turbulence model. Build. Environ. 1989, 24, 85–97. [Google Scholar] [CrossRef]
  28. Richtmyer, R.D.; Morton, K.W. Difference Methods for Initial-Value Problems, 2nd ed.; Richtmyer, R.D., Ed.; Krieger Pub. Co.: Krieger Lane, FL, USA, 1994. [Google Scholar]
  29. Campano Laborda, M.Á.; Acosta García, I.; Fernández-Agüera, J.; Sendra, J.J. Towards finding the optimal location of a ventilation inlet in a roof monitor skylight, using visual and thermal performance criteria, for dwellings in a Mediterranean climate. J. Build. Perform. Simul. 2015, 8, 226–238. [Google Scholar] [CrossRef]
Figure 1. Operation of a heat recovery unit (efficiency η ≈ 85%): (a) in winter; (b) in summer.
Sustainability 12 01031 g001
Figure 2. Experimental configuration of the test chamber: (a) room 1.80 × 2.40 × 2.50 m; (b) room 3.00 × 4.00 × 2.50 m.
Sustainability 12 01031 g002
Figure 3. Validation points: (a) floor plan 1.80 × 2.20 × 2.50 m; (b) heights in vertical section; (c) floor plan 3.00 × 4.00 × 2.50 m.
Sustainability 12 01031 g003
Figure 4. Numerical study validation: (a) room 1.80 × 2.20 × 2.50 m; (b) room 3.00 × 4.00 × 2.50 m.
Sustainability 12 01031 g004
Figure 5. Dimensional variation of the simulated rooms.
Sustainability 12 01031 g005
Figure 6. Efficiency ( ε a ) depending on the distance along the Y-axis between openings at the same height.
Sustainability 12 01031 g006
Figure 7. Openings located in opposite walls and vertical cross ventilation.
Sustainability 12 01031 g007
Figure 8. Openings located in opposite walls and vertical parallel ventilation.
Sustainability 12 01031 g008
Figure 9. Openings located in non-facing walls and vertical cross ventilation.
Sustainability 12 01031 g009
Figure 10. Openings located in non-facing walls and vertical parallel ventilation.
Sustainability 12 01031 g010
Table 1. Meshing conditions.
y+ (dimensionless wall distance)30
d (distance to the first node near a wall)0.01 m
Maximum proportion of cell1:4
Maximum growing rate1.10 (10%)